Abstract
Background: Hepatocellular carcinoma (HCC) is a type of refractory malignant tumor with high fatality rate. Currently, immunotherapy and competitive endogenous RNA (ceRNA) are research hotspots in HCC, but the relationship between ceRNA and the immune microenvironment in HCC is unclear. Methods: Firstly, a differentially expressed circRNA-miRNA-mRNA network was constructed from the GEO database, and functional enrichment analysis was performed. Next, combine the TCGA database to construct a ceRNA prognosis-related subnetwork. Establish a risk prediction model based on the mRNA in the sub-network, and evaluate the impact of the model on the prognosis. Use clinical samples to verify the expression of genes in the model. Finally, we analyzed the distribution of tumor infiltrating immune cells (TIC) in HCC, and explored the correlation between mRNAs in the ceRNA sub-network and immune infiltration. Results: We used the HCC ceRNA network (including 12 circRNA, 5 miRNA, and 8 mRNA) as a starting point for the identification of target genes (PSMD10, ESR1 and PPARGC1A) in the ceRNA prognosis-related subnetwork to establish a risk prediction model and elucidated its important role in predicting the poor prognosis of HCC. The differences in mRNA expression verified by clinical samples are consistent with the database. In addition, we found that the mRNAs in the ceRNA prognosis subnetwork are closely related to different types of TICs and immune checkpoints. Conclusions: This study is expected to serve as a reference for the study of mechanisms underlying liver cancer, the screening of prognostic markers and the evaluation of the immune response.
Keywords: Hepatocellular carcinoma, ceRNA network, prognosis, tumor infiltrating immune cells, immune checkpoint
Introduction
According to report fromf the World Health Organization in 2020, primary liver cancer is the 6th most commonly diagnosed cancer worldwide, and it is the 4th leading cause of cancer-related death [1]. Hepatocellular carcinoma (HCC) is the most common pathological type of primary liver cancer [2]. Its early diagnosis is difficult, its development is rapid, and drug efficacy is limited. Therefore, HCC has a high mortality rate and a relatively poor prognosis [3]. It is therefore, of great significance to explore the molecular mechanism underlying HCC and the development of its malignant biological behavior, so as to identify effective targets for HCC treatment and related molecular markers that mediate its poor prognosis.
At present, factors such as immune system disorders and tumor microenvironment (TME) have been confirmed to affect tumor occurrence, development, invasion and drug resistance [4,5]. In recent years, immunotherapy has developed rapidly, and the application of immune checkpoint inhibitors can indeed result in significant survival benefits for HCC patients [6]. However, the distribution and mechanism of action of the complex TME in HCC have not yet been elucidated. Moreover, it is necessary to further explore approaches for precisely predicting HCC immunotherapy efficacy and to search for immunotherapy-related markers. Circular RNAs (circRNAs) are single-stranded covalently closed noncoding RNAs. circRNAs do not have a 5’ cap or a 3’ poly(A) tail. This covalent ring structure makes circRNAs less susceptible to RNase R and exonuclease degradation, which results in higher stability of circRNAs than linear transcripts [7]. The main function of circRNAs is to adsorb miRNAs and regulate protein translation, and act as miRNA sponges in tumors [8-11]. As circRNAs contain a large number of miRNA binding sites, they can act as a miRNA molecular sponge and indirectly regulate the expression of downstream target genes of miRNA [12]. Hence, circRNAs are ceRNAs with important biological significance. For instance, studies have shown that the key node factors in the ceRNA network can affect the proportion of TICs in the TME and the efficacy of immunotherapy. Chang et al. [13] showed that ceRNAs (FAS and hsa-miR125b-5p) and TICs (T cell follicular helper cells and M0 macrophages) may be related to the distant metastasis of colonic glands and affect the prognosis of patients. Zhang et al. [14] found that the RP11-1094M14.8/miR-1269a/CXCL9 axis may serve as a potential immunotherapy target for gastric cancer patients with different levels of immune cell infiltration. However, there are few studies on the immune infiltration pattern of ceRNA and HCC. At present, most of these studies have used lncRNAs as the starting point to establish ceRNA networks and conduct immune infiltration analysis. There is still a lack of relevant research focusing on circRNAs.
In this study, a circRNA-miRNA-lncRNA-related ceRNA network was established based on the GEO database. Prognosis-related sub-networks and risk prognosis models were constructed based on the TCGA database. The impact of a risk model composed of key genes in the ceRNA network on the survival time of HCC patients was analyzed. In addition, correlation analysis was carried out according to different proportions of TICs, immunosuppressive factors and ceRNA gene types, so as to clarify the new mechanism of immune infiltration mode in the occurrence of HCC.
Materials and methods
Data and sample acquisition
We obtained circRNA, miRNA and mRNA expression profile data from human HCC tissues and matched adjacent tissues from the Gene Expression Omnibus (GEO, https://www.ncbi.nlm.nih.gov/geo/) database. circRNA expression data were obtained from GSE97332 (7 pairs of HCC tissues and adjacent tissues), miRNA expression data were obtained from GSE108724 (7 pairs of HCC tissues and adjacent tissues), and mRNA expression data were obtained from GSE76427 (115 pairs of HCC tissues and 52 adjacent tissues). Subsequently, for prognostic analysis, we downloaded the transcriptome gene expression data of 424 samples from The Cancer Genome Atlas (TCGA, https://portal.gdc.cancer.gov/) database (including 374 liver cancer tissues and 50 cancer tissues). Additionally, the corresponding clinical information, including age, sex, grade, stage, overall survival time and survival status, was obtained.
This study uses 15 clinical samples for each molecule for verification. All clinical patient tissues used are from Shanghai Oriental Hepatobiliary Surgery Hospital, and the inclusion criteria were: according to the WHO standard pathology confirmed HCC.
Ethical Statement: All procedures performed in this study involving human participants were in accordance with the Declaration of Helsinki (as revised in 2013). All clinical studies were approved by the ethics committee (No. EHBHKY2020-K-040). All patients enrolled in this study gave written informed consent.
Differentially expressed gene screening
To identify genes with differential expression, we used the Bioconductor Limma package to analyze the circRNAs, miRNAs, and mRNAs in the HCC tissues and adjacent tissues in the GEO chip data.
① For the circRNA expression data downloaded from the GEO database, a gene was considered to be a differentially expressed gene if it satisfied |log2FC| >2 and FDR<0.05. ② eFor the miRNA and mRNA expression data downloaded in the GEO database, a molecule was considered differentially expressed if it satisfied |log2FC| >1 and FDR<0.05.
ceRNA network construction and functional enrichment analysis
According to the results of differential expression analysis, we use the circBase database (http://www.circbase.org/) to obtain the differential circRNA information obtained in the previous period. Then, the cancer-specific CircRNA database (CSCD, http://gb.whu.edu.cn/CSCD/) was used to analyze the structure of the differential circRNA, and at the same time, the target miRNA was obtained. Next, the target miRNAs and the differential miRNAs identified in the aforementioned GEO database were crossed. Finally, target miRNAs with differential expression in HCC were obtained, and a circRNA-miRNA regulatory network was constructed. In addition, we also used the two databases miRTarBase (http://mirtarbase.mbc.nctu.edu.tw/index.html) and miRDB (http://mirdb.org/) to predict the target mRNA of the above-mentioned differentially expressed miRNA. Target mRNAs that were confirmed in both databases were selected, and the prediction results were intersected with the differentially expressed mRNAs identified in the aforementioned GEO database to finally obtain differentially expressed target genes, and further construct a miRNA-mRNA network. According to the ceRNA theory, circRNAs regulate mRNA expression by acting as miRNA molecular sponges. That is, the expression of circRNAs and their target miRNAs are negatively correlated, and the expression of miRNAs and their target mRNAs are also negatively correlated. Based on this principle, we used the circRNAs, miRNAs, and mRNAs identified above to construct a ceRNA regulatory network. Finally, Cytoscape 3.8.2 software was used to visualize the ceRNA network. To elucidate the potential functions of all mRNAs in the ceRNA network, we used the org.Hs.eg.db, ggplot2, clusterProfiler and enrichplot software packages in R software to perform Gene Ontology (GO) and Kyoto Encyclopedia of Genes and Genomes (KEGG) pathway analysis. GO or KEGG pathways with P<0.05 were considered statistically significant.
Survival analysis and construction of prognosis-related subnetwork
To elucidate the relationship between mRNAs and the survival of HCC patients, we used the gene expression data and clinical data of HCC samples downloaded from the TCGA database to first verify the differences in the expression of mRNAs in the cancer and adjacent tissues in the network. Next, all the mRNAs in the ceRNA network were analyzed with respect to survival. HCC patients were divided into two groups with high expression and low expression according to the median of mRNA expression, and the survival curve was further drawn. A gene with P<0.05 was considered a prognosis-related gene. Finally, the target genes related to prognosis were identified to construct the ceRNA prognostic subnetwork, and the subnetwork was visualized using Cytoscape 3.8.2 software.
Construction and evaluation of the mRNA risk prediction model in the ceRNA network
To prove the prognostic value of genes in the ceRNA network in HCC, we used univariate Cox regression analysis (P<0.05) to screen genes related to overall survival time, and then established a prognostic risk model based on LASSO Cox regression. The risk value was calculated using the following formula: Risk score = ∑n i=1Coefi * xi. Coefi is the risk factor, and xi is the expression level of each gene. HCC patients were divided into high-risk or low-risk groups according to the median risk value, the relationship between patients in different risk groups and overall survival was analyzed, survival curves were drawn, and receiver operating characteristic (ROC) curves were constructed to evaluate prediction efficiency. To explore the clinical value of risk value as a prognostic factor for HCC patients, we integrated all clinical indicators and performed univariate and multivariate Cox regression analysis. Moreover, a gene nomogram and calibration curve was constructed to visualize the effects of genes in the prognostic model on the survival time of HCC patients.
Clinical samples verify the expression of mRNA in the ceRNA prognosis-related subnetwork
ABI Prism 7500 sequence detector (Applied Biosystems, Foster City, CA, USA) was used to perform real-time fluorescent quantitative PCR reaction and detect the expression level of each mRNA in the ceRNA prognosis-related subnetwork.
The sequence of each primer is shown in Table 3.
Table 3.
Primer sequence
| Primer | Sequence (5’ to 3’) |
|---|---|
| PSMD10 forward primer | AGCAGCCAAGGGTAACTTGA |
| PSMD10 reverse primer | ACACTGGGGACAACAACACA |
| ESR1 forward primer | ACTCTACTGAACCCTGGTGC |
| ESR1 reverse primer | CCCCACTCTGAGGCAAGTTA |
| PPARGC1A forward primer | GGTCTCCAGGCAGTAGATCC |
| PPARGC1A reverse primer | ACATAAATCACACGGCGCTC |
Comprehensive analysis of tumor immunity
To explore the proportion of TICs in HCC tissues and adjacent tissues, we used the CIBERSORT algorithm to calculate the scores of 22 types of TICs in each HCC sample based on TCGA RNA-seq data. The correlation of 22 TICs and their different proportions in in tissues were evaluated. To further analyze the influence of target genes in the HCC ceRNA prognostic subnetwork on the distribution of TICs and response to immunotherapy, we evaluated the correlation between the number of TICs and the expression of PSMD10, ESR1 and PPARGC1A through correlation analysis. We used scatter plots to visualize the results. Finally, seven common immune checkpoints that exert immunosuppressive effects (IL10RB, PD-L1, CTLA4, PD-1, TGFBR1, ADORA2A, and LGALS9) were retrieved. A box plot was drawn to elucidate the correlation between the target genes in the subnetwork and the expression of immunosuppressive factors.
Statistical analysis
The expression difference between tumor tissue and normal tissue of HCC patients was analyzed by Wilcoxon rank sum test. The LASSO Cox regression algorithm was used to establish a prognostic risk model, the Kaplan-Meier survival curve was used to analyze the overall survival rate between the high and low gene expression groups and the high- and low-risk groups of the model, and the ROC curve was used to test the accuracy of the prediction model. The chi-square test was used to compare the differences in clinicopathological characteristics and risk gene expression of different risk groups. Univariate and multivariate Univariate and multivariate Cox risk models were used to evaluate the prognostic value of risk value as an independent prognostic factor for HCC patients. The Wilcoxon rank sum test was used to analyze the differences between the two groups of immune checkpoints in the expression of different genes in the ceRNA network. All the above statistical analyses were performed in R (version 4.0.4). The comparison of clinical samples of HCC and adjacent tissues was performed by a paired sample t test, and the GraphPad Prism 9.0.0 software was used for statistical analysis. P<0.05 was considered significantly different.
Results
Identification of differentially expressed circRNAs, miRNAs, and mRNAs
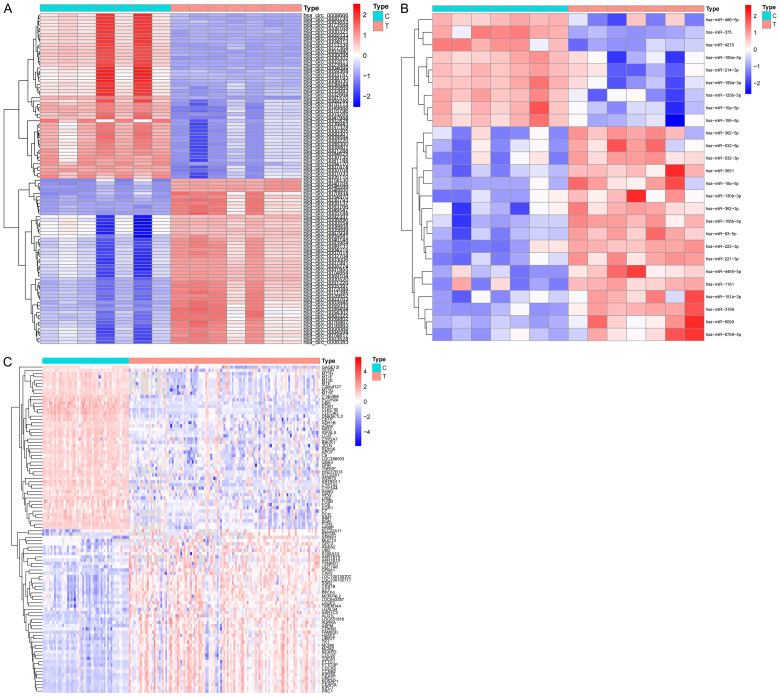
Based on the GSE97332, GSE108724 and GSE76427 chip data in the GEO database, we identified 149 differential circRNAs (91 upregulated and 58 downregulated) (Figure 1A), 26 differential miRNAs (17 upregulated and 9 downregulated) (Figure 1B), and 436 differential mRNAs (69 upregulated and 367 downregulated) (Figure 1C). These differential genes will be further used in the construction of ceRNA networks.
Figure 1.
Differences in RNA expression based on the GEO database. Differential expression heat map of circRNA (A), miRNAs (B) and mRNAs (C) between HCC samples and adjacent samples. C, adjacent non-tumor tissues; T, tumor tissues.
Construction of a ceRNA network
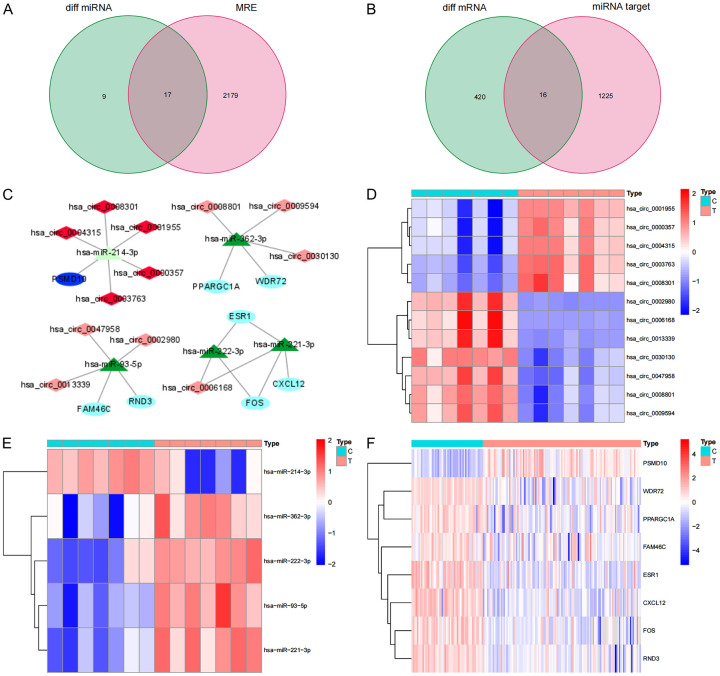
After obtaining the location and transcript information of 149 different circRNAs through the circBase database, we used the CSCD database to find 2196 target miRNAs corresponding to the circRNAs. We matched the 26 differential miRNAs identified by the GEO database and finally obtained 17 intersecting miRNAs (Figure 2A). Next, we used two databases, miRDB and miRTarBase, to predict the target genes of the 17 intersecting miRNAs and simultaneously obtained 1241 target genes supported by the two software programs. Matching the 436 differential mRNAs identified in the GEO database yielded 16 overlapping mRNAs (Figure 2B). According to the ceRNA theory, we finally identified 12 circRNAs (5 upregulated and 7 downregulated), 5 overlapping miRNAs (4 upregulated and 1 downregulated), and 8 overlapping mRNAs (1 upregulated and 7 downregulated) to construct a ceRNA network (Figure 2C). The network contains a total of 25 nodes and 23 links. In addition, we conducted a difference analysis of the nodes in the network and drew a heat map based on the expression data of the above three chips in the GEO database. The results show that there are significant differences between each node molecule in HCC cancer tissue and adjacent tissues. The up-regulation and down-regulation of circRNA, miRNA and mRNA in the ceRNA network are confirmed here (Figure 2D-F).
Figure 2.
ceRNA network construction and node differential expression. A. The Venn diagram of the overlap of the target miRNAs predicted by the differential circRNA and the differential miRNA in the GEO database; B. The Venn diagram of the overlap of the target gene predicted by the intersection miRNA and the differential mRNA in the GEO database; C. ceRNA network, Dark red represents the highly expressed of circRNAs, light red represents the low expression of circRNAs, dark green represents the highly expressed of miRNAs, light green represents the low expression of miRNAs, dark blue represents the highly expressed of mRNAs, light blue represents the low expression of mRNAs, and the line represents a regulatory relationship between the two genes; D-F. The differential expression of mRNAs, miRNAs and circRNAs in the ceRNA network in liver cancer tissues and adjacent tissues in the GEO database. C, adjacent non-tumor tissues; T, tumor tissues.
GO and KEGG function enrichment analysis
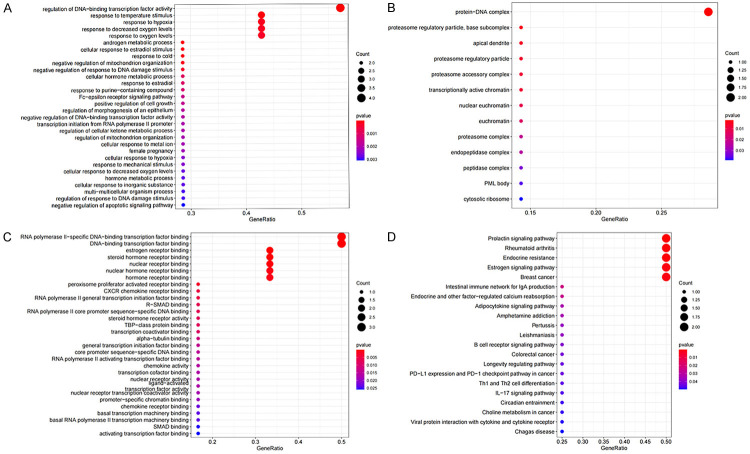
We performed GO and KEGG functional enrichment analysis on 8 mRNAs in the ceRNA network. We found that these mRNAs participate in 471 biological processes (BPs) in the human body, constitute 13 cell components (CCs), perform 35 molecular functions (MFs), and participate in the regulation of 21 signaling pathways. We arranged the above functions in order of P value from small to large and took the top 30 functions and pathways with the smallest P value to draw the bubble chart (Figure 3A-D). The GO enrichment analysis revealed that most molecules play a role by regulating the activity of DNA-binding transcription factors. The KEGG signaling pathway mainly involved the following: a. endocrine regulation; b. signal transduction and collaterals of Th1 and Th2 cell differentiation, PD-L1 and PD-1 checkpoints in tumors, B cell receptor signaling pathways and other immune-related pathways; c. choline metabolism in cancer.
Figure 3.
Enrichment analysis of function. Bubble plot of target gene GO enrichment analysis: BP (A), CC (B) and MF (C) in the ceRNA network; (D) the bubble chart of the signal pathway focused by the KEGG enrichment analysis of genes in the ceRNA network.
Survival analysis and construction of the prognostic subnetwork
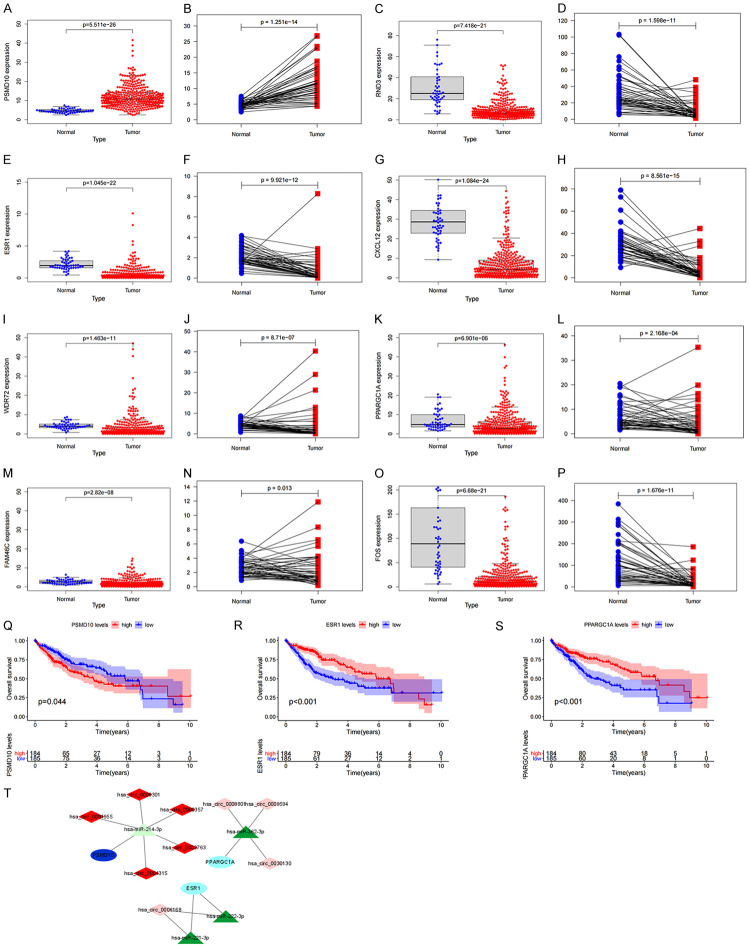
First, we use the TCGA database to verify the consistency of the expression of the above 8 mRNAs with the GEO database. The scatter plot and paired analysis revealed that PSMD10 expression was upregulated in HCC tissues, RND3, ESR1, and ESR1. CXCL12, WDR72, PPARGC1A, FAM46C and FOS expression was downregulated in HCC tissues (Figure 4A-P), and the results were consistent with the data in the GEO database. Then, the patients were divided into two groups with high expression and low expression, with the median of target gene expression in the TCGA database as the cut-off value, and survival curves were drawn according to survival time and survival status. The expression of PSMD10, ESR1 and PPARGC1A was significantly correlated with the overall survival time of HCC patients (P<0.05) (Figure 4Q-S). Based on the above three prognosis-related genes, a ceRNA prognostic subnetwork with 16 nodes and 14 links was drawn (Figure 4T). Therefore, we speculate that hsa_circ_0000357, hsa_circ_0003763, hsa_circ_0004315, hsa_circ_0001955 and hsa_circ_0008301 may act as a molecular sponge of hsa-miR-214-3p to regulate the expression of PSMD10. Hsa_circ_0008801, hsa_circ_0009594 and hsa_circ_0030130 may act as a molecular sponge of hsa-miR-362-3p to regulate the expression of PPARGC1A. Hsa_circ_0006168 may act as a molecular sponge of hsa-miR-221-3p and hsa-miR-222-3p to regulate the expression of ESR1. Finally, we visualized the structure of 9 circRNAs in the ceRNA prognostic subnet according to the CSCD database, and the results showed that all 9 circRNAs had miRNA response elements (MREs) (Figure 5A-I). Therefore, we believe that the 16 node molecules in the ceRNA prognostic subnetwork may mediate the occurrence of HCC and the poor prognosis of patients.
Figure 4.
Construction of prognosis-related subnetwork. Based on TCGA data PSMD10 (A, B), RND3 (C, D), ESR1 (E, F), CXCL12 (G, H), WDR72 (I, J), PPARGC1A (K, L), FAM46C (M, N), FOS (O, P) in HCC tumor samples and normal samples Differences in expression; (Q-S) the relationship between PSMD10, ESR1, PPARGC1A and the overall survival of HCC patients; (T) ceRNA subnetwork drawn based on the three prognostic-related genes.
Figure 5.
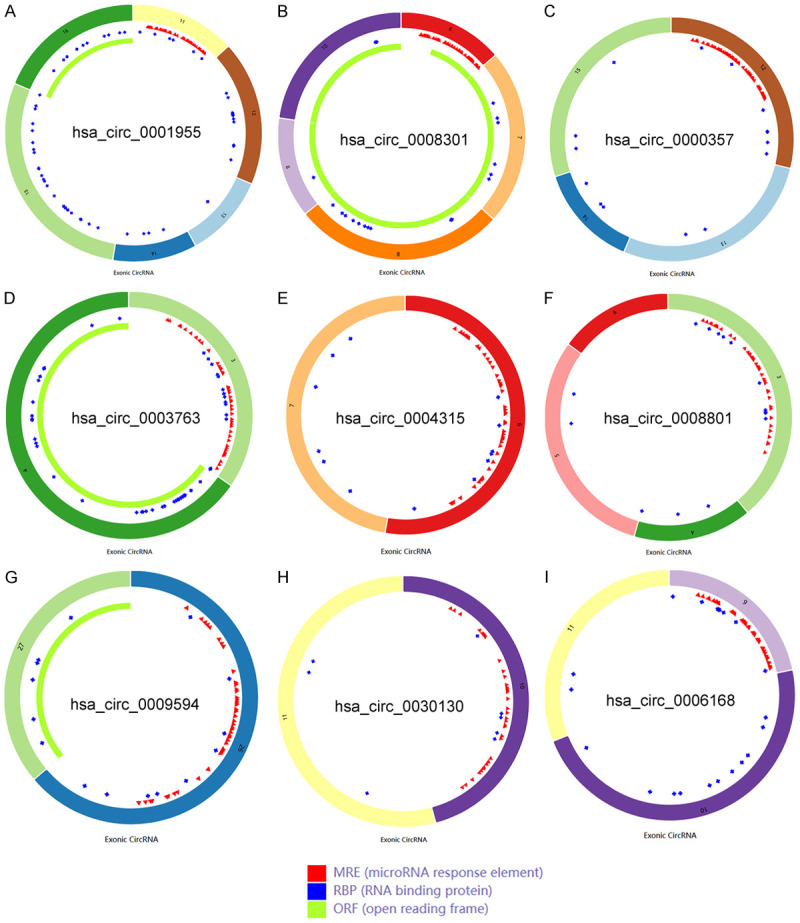
Structural diagrams of nine circRNAs obtained from the CSCD database. A. The structure model diagram of hsa_circ_0001955; B. The structure model diagram of hsa_circ_0008301; C. The structure model diagram of hsa_circ_0000357; D. The structure model diagram of hsa_circ_0003763; E. The structure model diagram of hsa_circ_0004315; F. The structure model diagram of hsa_circ_0008801; G. The structure model diagram of hsa_circ_0009594; H. The structure model diagram of hsa_circ_0030130; I. The structure model diagram of hsa_circ_0006168.
Construction and evaluation of mRNA-related risk prediction models
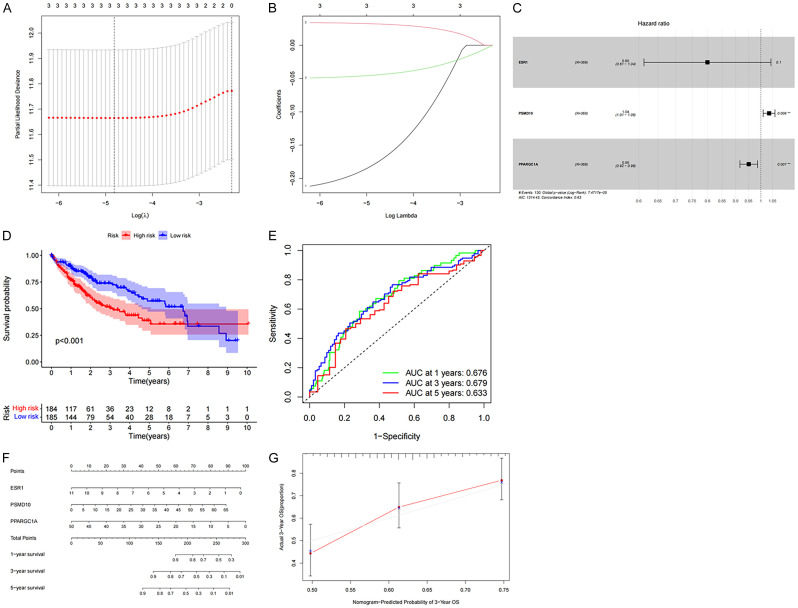
We confirmed by univariate Cox regression that PSMD10, ESR1, and PPARGC1A all significantly affected the overall survival rate of patients (P<0.05), indicating that the mRNA in the prognostic subnet of ceRNA may affect the survival and prognosis of HCC patients. The hazard ratio of the PSMD10 factor was >1, indicating that is a gene associated with high risk, while the hazard ratio of ESR1 and PPARGC1A was <1, indicating that these genes are associated with low risk (Table 1). Next, the LASSO Cox regression analyses were used to construct a risk model for the above three genes. The LASSO regression analysis results retained the above three genes (Figure 6A, 6B), and then established a multi-factor Cox proportional hazard model, to draw a forest map (Figure 6C). In addition, the weight coefficient of each hub gene in the ceRNA network was determined (Table 2), and the risk value was calculated according to the following method: risk value = 0.034546 was calculated according 050602 × PPARGC1A. We divide HCC patients into high-risk groups and low-risk groups based on the median risk value. Compared with the low-risk group, the five-year survival rate of patients in the high-risk group was significantly lower (P<0.05) (Figure 6D). ROC curve analysis showed that the AUC values predicted by the model for the 1, 3, and 5-year overall survival of HCC patients were 0.676, 0.679, and 0.633, respectively (Figure 6E). Next, a Nomogram nomogram was constructed to quantitatively predict the OS rate of HCC patients at 1, 3, and 5 years., and the calibration curve confirms that the risk model has a good predictive effect for the 3-year survival rate (Figure 6F, 6G). Therefore, the mRNAs involved in the construction of the ceRNA network can be used as potential therapeutic targets and prognostic biomarkers for HCC.
Table 1.
Single factor COX analysis of CeRNA network
| Gene | HR | HR.95L | HR.95H | P value |
|---|---|---|---|---|
| ESR1 | 0.740083 | 0.559013 | 0.979805 | 0.035512 |
| PSMD10 | 1.038975 | 1.013881 | 1.064690 | 0.002176 |
| PPARGC1A | 0.947053 | 0.911749 | 0.983724 | 0.005007 |
Figure 6.
Construction of mRNA risk prediction model in ceRNA network. A, B. Three prognostic genes were identified by LASSO Cox regression analysis, and prognostic models were established; C. Forest plot shows that 3 mRNAs are included in a multivariate Cox proportional hazard model to predict the prognosis of HCC patients; D. Overall survival rate of HCC patients in the high and low risk groups; E. The ROC curve of the ceRNA model shows that the AUCs of 1-year, 3-year, and 5-year OS are 0.676, 0.679, 0.633, respectively; F, G. Nomograms and calibration curves are established based on these 3 mRNAs.
Table 2.
Multifactor COX analysis of CeRNA network
| Gene | coef | HR | HR.95L | HR.95H | P value |
|---|---|---|---|---|---|
| ESR1 | -0.223552 | 0.799674 | 0.612873 | 1.043411 | 0.099578 |
| PSMD10 | 0.034546 | 1.035150 | 1.009892 | 1.061039 | 0.006125 |
| PPARGC1A | -0.050602 | 0.950657 | 0.916154 | 0.986458 | 0.007300 |
Clinical and prognostic analysis of risk value
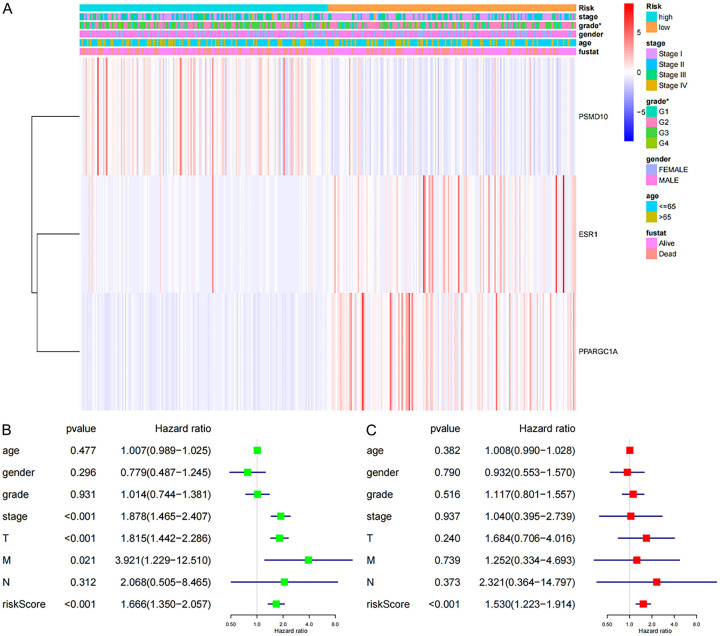
To elucidate the differences between different risk groups and clinicopathological characteristics, we removed incomplete clinical data from the TCGA database. The results showed that the expression of PSMD10 was positively correlated with the risk score, and the expression of ESR1 and PPARGC1A was negatively correlated with the risk score. Additionally, there were significant differences in grading between the different risk groups (P<0.05) (Figure 7A). Univariate Cox regression analysis showed that age, gender, grade and N staging were not related to the overall survival rate (P>0.05), but stage, T staging, TNM staging and riskscore were all related to the overall survival rate (P<0.05) (Figure 7B). Incorporating all the above single factors into the multivariate Cox regression analysis showed that only the riskscore can be used as an independent prognostic factor for the overall survival rate in HCC patients (P<0.05) (Figure 7C).
Figure 7.
Analysis of the different risk values and different clinicopathological characteristics in TCGA database and the single-factor and multifactor Cox regression analysis. A. Clinical correlation analysis of different risk groups; B. Univariate Cox regression analysis was performed for different clinicopathological features and risk values; C. Multivariate Cox regression analysis was performed for different clinicopathological features and risk values (*P<0.05).
Clinical sample verification of genes in the ceRNA prognostic subnetwork
Using 15 cases each of clinical HCC and adjacent samples, the 3 mRNAs in the above-mentioned ceRNA prognostic subnetwork were verified by Realtime-PCR. See Table 3 for primer sequences. We found that relative to the adjacent tissues, the expression of PSMD10 in HCC tissue was significantly increased, while the expression of ESR1 and PPARGC1A in HCC tissue was significantly decreased (Figure 8A-C). This result suggests that the differences in the expression of the molecules PSMD10, ESR1 and PPARGC1A that we screened in the previous phase have been confirmed in clinical samples. Therefore, we believe that the genes in the ceRNA sub-network of this study may be involved in the occurrence of HCC, and this risk model is expected to lay a theoretical foundation for the screening of HCC prognostic and early warning markers.
Figure 8.
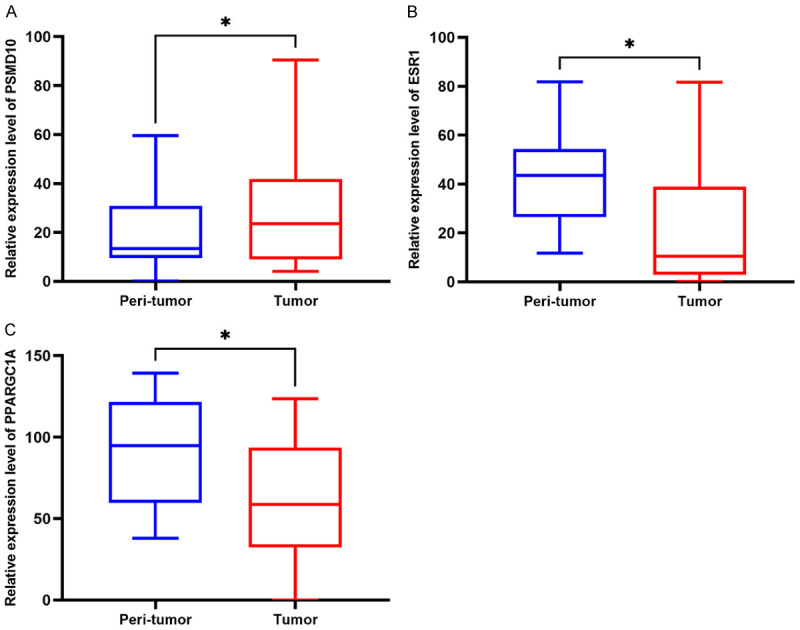
Clinical sample verification of mRNA expression in the ceRNA prognosis-related subnetwork. Differences in the expression of PSMD10 (A), ESR1 (B) and PPARGC1A (C) between HCC tissue and corresponding adjacent tissues (*P<0.05).
Distribution and correlation of TICs in HCC
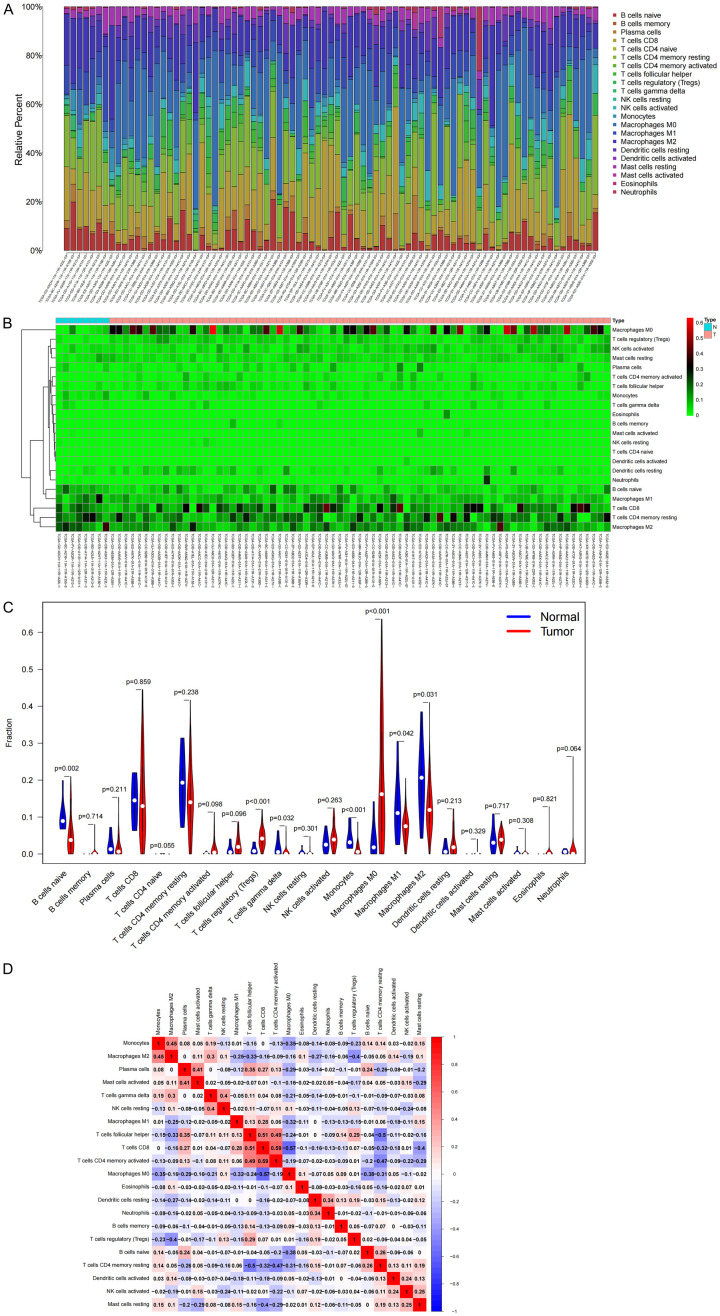
Based on KEGG enrichment analysis, it was found that genes in the ceRNA network played a regulatory role in multiple immune-related pathways such as PD-L1, PD-1 immune-related gene expression, and B cell receptor signal transduction. Therefore, we focused on immune cell infiltration and analyzed the influence of mRNA in the prognostic subnet of ceRNA on the immune microenvironment. First, we used the CIBERSORT deconvolution algorithm to evaluate TICs, constructed a profile of 22 immune cells in HCC, and analyzed the proportion of TICs in each sample (Figure 9A). Further analysis of the infiltration of TICs with a heat map shows showed the proportion of 22 TICs in the HCC sample and the normal sample (Figure 9B), and the violin chart showed that there were 8 kinds of TICs that were present in significantly different numbers in these tissues (P<0.05) (Figure 9C). In addition, a significant negative correlation was found between M0 macrophages and CD8 T cells (r = -0.57), while a significant positive correlation was found between CD8 T cells and activated memory CD4 T cells (r = 0.59) by analyzing the correlation between immune cells in all samples (Figure 9D).
Figure 9.
Immune cell infiltration in HCC and its correlation analysis. A. Histogram of the proportions of 22 TICs in HCC samples and normal samples; B. Heat map of TIC content distribution in HCC samples and normal samples; C. Violin chart of the analysis of different TIC proportions; D. For the correlation between TICs, red is positive correlation, and blue is negative correlation.
Correlation analysis of mRNAs in the ceRNA subnet with TICs and immune checkpoints
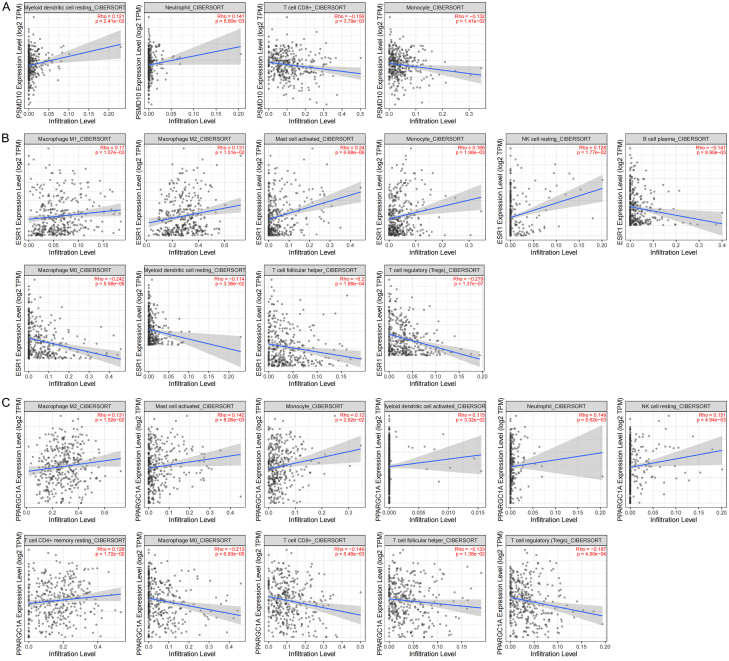
The CIBERSORT database analysis proved that the expression of mRNAs in the ceRNA subnetwork was correlated with the proportion of 22 different types of TICs. PSMD10 is correlated with 4 types of TICs. The infiltration degree of resting dendritic cells and neutrophils increases with the increase of PSMD10 expression, and the infiltration degree of CD8+ T cells and monocytes decreases with the increase of PSMD10 expression (Figure 10A). ESR1 is correlated with 10 types of TICs. The infiltration degree of M1 macrophages, M2 macrophages, activated mast cells, monocytes and resting NK cells with the increase of ESR1 expression, and the infiltration degree of B cell plasma, M0 macrophages, resting dendritic cells, follicular helper T cells and Tregs decreases with the increase of ESR1 expression (Figure 10B). PPARGC1A is correlated with 11 types of TICs. The infiltration degree of M2 macrophages, activated mast cells, monocytes, activated dendritic cells, neutrophils, resting NK cells and resting CD4+ memory T cells, and the infiltration degree of M0 macrophages, CD8+ T cells, follicular helper T cells and Tregs decreases with the increase of PPARGC1A expression (Figure 10C). The above results further confirmed that the expression of the abovementioned mRNAs significantly affects the proportions of immune cells in the immune microenvironment of HCC. Finally, to evaluate the feasibility of predicting the response to immunotherapy through the expression of target genes in the ceRNA subnetwork, we conducted a correlation study between the PSMD10, ESR1 and PPARGC1A levels and those of 7 inhibitory immune checkpoints. We found that the expression of most immunosuppressive factors increased in samples with high expression of PSMD10, and decreased in samples with high expression of ESR1 and PPARGC1A (Figure 11A-C). In summary, we believe that the high expression of PSMD10 and the low expression of ESR1 and PPARGC1A indicate a better immunotherapy response, and HCC patients with such molecular expression characteristics are more likely to benefit from immune checkpoint inhibitors. Therefore, the key genes in the ceRNA prognostic subnetwork are likely to affect the efficacy of immunotherapy by regulating the types of TICs and the expression of immune checkpoints in the tumor microenvironment.
Figure 10.
Correlation analysis between target genes in the ceRNA prognostic subnet and TIC levels. A. Scatter plot of PSMD10 correlation with 4 TICs (P<0.05); B. Scatter plot of ESR1 correlation with 10 TICs (P<0.05); C. Scatter plot of PPARGC1A correlation with 11 TICs (P<0.05); the blue line in each figure is the fitted line that simulates the proportional relationship between the level of gene expression and immune cells.
Figure 11.
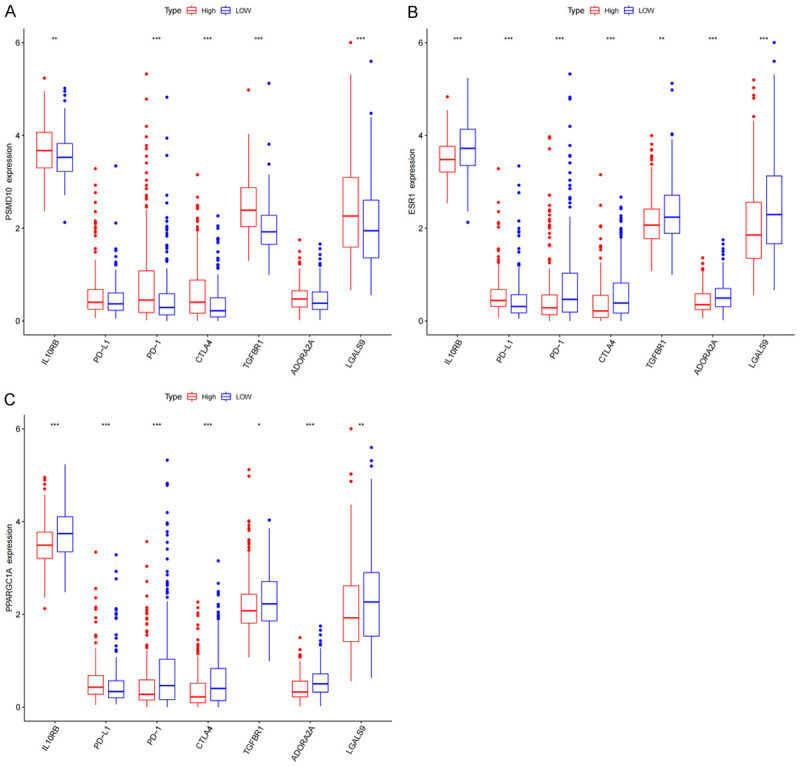
Correlation between target genes in the ceRNA prognostic subnet and immunosuppressive factors. The relationship between PSMD10 (A), ESR1 (B), and PPARGC1A (C) and PD-L1, PD-1, CTLA4 and other immunosuppressive checkpoints (*P<0.05, **P<0.01, ***P<0.001).
Discussion
HCC is one of the malignant tumors with poor prognosis, and its morbidity and mortality rate are high among all tumors [15]. Because of its asymptomatic onset and high degree of malignancy, approximately 60% of HCC patients have missed their opportunity for surgery at the time of diagnosis, and there is still a lack of effective prognostic molecular markers [16]. Therefore, improving the clinical efficacy of unresectable patients who are in the middle and late stages of disease and identification of additional molecular markers for improving prognosis have become key to the treatment of HCC. Immune checkpoint inhibitors that target the programmed death-1 (PD-1) axis have shown good prospects in the treatment of advanced tumors, but there are still many HCC patients who still cannot benefit from this treatment. Because the liver itself is an important immune organ of the human body [17], the occurrence of HCC is closely related to chronic liver inflammation caused by viral and nonviral injuries, and this process can lead to effector T cell failure [18]. Liver fibrosis and hypoxia further strengthen the inhibitory effect on the liver cancer immune response [19,20]. In addition, immune cells in the normal liver tend to have stronger immune tolerance, and the interaction between complex genetics, the microenvironment and various factors of the body determines the response of immunotherapy to HCC treatment [21]. At present, a large number of studies indicate that the ceRNA network is of great significance in the development and progression of tumors [22]. Importantly, the mRNA, miRNA and circRNA in the ceRNA network can be used as potential targets for HCC treatment and molecular targets for evaluating prognosis. However, the joint analysis of the circRNA-based ceRNA network and immune microenvironment is less well understood in the HCC field. Therefore, we specifically constructed a circRNA-miRNA-mRNA network and analyzed the target genes and prognosis, TICs and immune checkpoints to identify new molecular mechanisms underlying the occurrence of HCC and prognostic molecular markers. We also aim to explore new targets that can mediate precise tumor immunotherapy.
In this study, we found significant differences in the RNA expression and TIC distribution in HCC and adjacent tissues. A ceRNA network composed of 12 circRNAs, 5 miRNAs and 8 mRNAs was constructed. Enrichment analysis found that multiple signaling pathways such as tumor immune regulation and endocrine regulation were clustered on mRNAs in the ceRNA network. To verify the relationship between the ceRNA network and clinical results, we obtained 3 survival-related genes through the K-M survival curve, including PSMD10, ESR1 and PPARGC1. A prognosis-related ceRNA subnetwork composed of 9 circRNAs (hsa_circ_0001955, hsa_circ_0008301, hsa_circ_0000357, hsa_circ_0003763, hsa_circ_0004315, hsa_circ_0008801, hsa_circ_0009594, hsa_circ_0030130, hsa_circ_0006168), 4 miRNAs (hsa-miR-214-3p, hsa-miR-362-3p, hsa-miR-221-3p, and hsa-miR-222-3p) and 3 mRNAs (PSMD10, ESR1, and PPARGC1) was further constructed. Using LASSO Cox regression analysis, the three target genes in the ceRNA subnetwork were used to build a risk prediction model. In addition, a nomogram and calibration curve was drawn. The AUC value suggested that this model may be helpful for the prognostic evaluation of clinical HCC patients. The riskscore is an independent prognostic factor of HCC is determined by univariate and multivariate Cox regression analysis. Realtime-PCR was used to confirm the differences in expression of PSMD10, ESR1 and PPARGC1 in clinical samples. Using CIBERSORT software to evaluate 22 kinds of TICs in HCC, it was found that the key target genes PSMD10, ESR1, and PPARGC1 in the ceRNA prognostic subnetwork were related to the distribution of TICs to varying degrees. These genes were also related to the expression of multiple inhibitory immune checkpoint molecules, including PD-1 and CTLA4. Based on the above analysis, we believe that PSMD10, ESR1, and PPARGC1 in the ceRNA network may mediate the survival and prognosis of HCC patients. Moreover, these mRNAs may affect the infiltration pattern of immune cells in the complex tumor microenvironment of HCC and patients’ responsiveness to various immunotherapy drugs. In addition, other circRNAs and miRNAs in the ceRNA network are likely to play an important role in the occurrence and development of HCC, clinical prognosis, and remodeling of the tumor microenvironment through the regulation of the above three target genes. These factors were worthy of our in-depth study.
PSMD10, also known as gankyrin, is an important oncoprotein whose expression is upregulated in a variety of tumors [23,24]. Our analysis indicated that PSMD10 and hsa-miR-214-3p may have a regulatory relationship in the occurrence of HCC. In fact, the miR-214 and PSMD10 axis have been studied in multiple tumor types, and it has been reported that this pathway is involved in the malignant regulation of tumors. In papillary thyroid carcinoma, miR-214 can directly target the 3’ noncoding region of PSMD10 and negatively regulate the expression of PSMD10. Downregulation of PSMD10 expression reduces the proliferation, metastasis and invasion of papillary thyroid cancer cells [25-27]. However, the mechanism by which miR-214 regulates PSMD10 as a target has not been reported in HCC. The ESR1 gene located on the long arm of chromosome 6 (6q25.1) is an important part of the estrogen receptor. The estrogen receptor can act as a ligand to activate transcription factors to regulate the expression of a variety of genes [28,29]. In ER(+) breast cancer, miR-142-3p acts as a tumor suppressor by targeting ESR1 encoded by the estrogen receptor [30]. In bladder cancer cells, ESR1 increases the expression of miR-4324 by combining with its promoter, thereby reducing the expression of RACGAP1, and significantly inhibiting cell proliferation and metastasis [31]. However, our results for the first time clarify that the miR-221/miR-222/ESR1 axis has an important impact on the survival and prognosis of HCC patients. PPARGC1, also known as PGC-1ults clanuclear transcription factor that mainly regulates the transcription of a variety of genes and posttranscriptional splicing modifications by interacting with a variety of transcription factors [32,34]. At present, many studies have confirmed that PPARGC1 plays an important regulatory role in tumorigenesis [35-38]. Therefore, based on the current bioinformatics analysis results, we speculate that PPARGC1 may interact with miR-362-3p to regulate the malignant biological behavior of HCC, but the specific molecular mechanism still needs further experimental verification.
As a key mediator of tumor progression and treatment results, the tumor microenvironment is closely related to tumor occurrence, growth and metastasis [39]. Normally, in addition to cancer cells, stromal cells, such as interstitial cells, endothelial cells and infiltrating immune cells, are also important components of the TME. Among these cells, infiltrating immune cells are considered to be effective in predicting the prognosis of patients and may become effective targets of drugs [40,41]. This study found that the target genes in the HCC ceRNA prognostic subnetwork are related to the distribution of different TICs. This indicates that the genes from the ceRNA subnetwork may affect the composition of the HCC immune microenvironment and regulate the immune status of HCC. The tumor microenvironment contains innate and adaptive immune cells, which perform pro- or antitumor functions [42]. Existing studies have shown that effector T cells (CD8+ T cells and CD4+ T cells), NK cells, dendritic cells, M1 polarized macrophages and N1 polarized neutrophils are involved in the antitumor immune response. In addition to antitumor immune cells, there are also a large number of tumor-promoting immune cells, including Tregs and myeloid-derived suppressor cells [43]. At present, research on tumor immunotherapy is mainly focused on T cells. In the past, CD8+ cytotoxic T cells were considered to be the main lymphocyte subset that killed cancer cells with major histocompatibility class I molecules [44]. However, in addition to stimulating signals derived from dendritic cells, CD4+ helper T cell signals have also been found to be necessary for the activation of cytotoxic T lymphocytes [45]. Studies have shown that cancer cells in some tumors inhibit the activation of cytotoxic lymphocytes by producing ligands that bind to inhibitory checkpoints (such as PD 1), which is an important mechanism for cancer cell immune escape [46]. Based on this principle, a variety of immunotherapy drugs widely used in clinical applications has been introduced. As a member of the T cell family, the main function of Tregs is to maintain peripheral immune tolerance and immune homeostasis. Based on the inhibitory effect in the tumor microenvironment, Tregs can prevent the effective response of cytotoxic lymphocytes to cancer cells [47,48]. NK cells are tumor antagonistic immune cells that act as mediators to induce tumor immune supervision. Their mechanism of action is to release perforin and granzyme secretion to cause the apoptosis of target cells through which they exert a tumor-killing effect, but the role of tumor-infiltrating NK cells is always limited [49]. It has been shown that the CD11b-CD27 liver infiltrating NK cell subset is significantly related to the progression of hepatocellular carcinoma [50]. As currently recognized as the most effective antigen presenting cell, Dendritic cells plays a key role in mediating innate immune response and inducing adaptive immune response. However, factors in the tumor microenvironment can weaken the antigen-presenting function of dendritic cells, thereby limiting T cell viability and promoting tumor growth [51]. Macrophages are the main participants in tumor immunity, and M0 macrophages can differentiate into M1 and M2 macrophages [52]. Generally, M1 macrophages are potent antitumor cells, while M2 macrophages show tumor-promoting functions [53]. Neutrophils are another type of immune cells and have also been found to infiltrate many types of tumors. In theory, neutrophils may be an effective antitumor effector cell because neutrophil granules contain various antibacterial and cytotoxic compounds that can destroy malignant cells [54]. However, many studies have shown that tumor-associated neutrophils may promote tumor progression. N2-polarized neutrophils are morphologically similar to granulocytes or polymorphonuclear myeloid-derived suppressor cells, so they may exert a tumor suppressor effect [55]. WE found that the expression of PSMD10, ESR1 and PPARGC1A was related to the level of monocyte infiltration, and the expression was consistent. Monocytes are innate immune cells of the mononuclear phagocyte system [56,57]. Although monocytes have many important functions in the development of cancer, the mechanisms that determine their antitumor immune or tumor-promoting immune cell phenotypes are still not fully understood, especially in the field of HCC. How to tilt the balance towards immune cells that contribute to anti-tumor immunity will be crucial to the discovery of more effective immunotherapy in the future.
Conclusions
The ceRNA network and prediction model proposed in this study play an important role in the exploration of the mechanism underlying HCC and the identification of prognostic markers. In addition, the target genes in the network can regulate the immune status of tumors, which is expected to provide new insight and ideas for cancer immunotherapy.
Acknowledgements
This study was supported by grants from Natural Fund Guidance Program of Liaoning Province (2019-ZD-1072); the Key Projects of Liaoning Natural Science Foundation (20180530019); Major Scientific and Technological Innovation Research and Development Plan of Shenyang City (19-112-4-079); China Medical University Youth Backbone Support Program (1210519002); Shanxi Administration of Traditional Chinese Medicine (2019-GJ-JC005); Program of Science and Technology Commission of Shanghai Municipality (18411969200).
Disclosure of conflict of interest
None.
References
- 1.Siegel RL, Miller KD, Jemal A. Cancer statistics, 2020. CA Cancer J Clin. 2020;70:7–30. doi: 10.3322/caac.21590. [DOI] [PubMed] [Google Scholar]
- 2.Khemlina G, Ikeda S, Kurzrock R. The biology of hepatocellular carcinoma: implications for genomic and immune therapies. Mol Cancer. 2017;16:149. doi: 10.1186/s12943-017-0712-x. [DOI] [PMC free article] [PubMed] [Google Scholar]
- 3.Pinto Marques H, Gomes da Silva S, De Martin E, Agopian VG, Martins PN. Emerging biomarkers in HCC patients: current status. Int J Surg. 2020;82S:70–76. doi: 10.1016/j.ijsu.2020.04.043. [DOI] [PubMed] [Google Scholar]
- 4.Hinshaw DC, Shevde LA. The tumor microenvironment innately modulates cancer progression. Cancer Res. 2019;79:4557–4566. doi: 10.1158/0008-5472.CAN-18-3962. [DOI] [PMC free article] [PubMed] [Google Scholar]
- 5.Wu T, Dai Y. Tumor microenvironment and therapeutic response. Cancer Lett. 2017;387:61–68. doi: 10.1016/j.canlet.2016.01.043. [DOI] [PubMed] [Google Scholar]
- 6.Ruf B, Heinrich B, Greten TF. Immunobiology and immunotherapy of HCC: spotlight on innate and innate-like immune cells. Cell Mol Immunol. 2021;18:112–127. doi: 10.1038/s41423-020-00572-w. [DOI] [PMC free article] [PubMed] [Google Scholar]
- 7.Liang D, Tatomer DC, Luo Z, Wu H, Yang L, Chen LL, Cherry S, Wilusz JE. The output of protein-coding genes shifts to circular RNAs when the Pre-mRNA processing machinery is limiting. Mol Cell. 2017;68:940–954. doi: 10.1016/j.molcel.2017.10.034. [DOI] [PMC free article] [PubMed] [Google Scholar]
- 8.Hansen TB, Jensen TI, Clausen BH, Bramsen JB, Finsen B, Damgaard CK, Kjems J. Natural RNA circles function as efficient microRNA sponges. Nature. 2013;495:384–8. doi: 10.1038/nature11993. [DOI] [PubMed] [Google Scholar]
- 9.Meng X, Chen Q, Zhang P, Chen M. CircPro: an integrated tool for the identification of circRNAs with protein-coding potential. Bioinformatics. 2017;33:3314–3316. doi: 10.1093/bioinformatics/btx446. [DOI] [PubMed] [Google Scholar]
- 10.Visci G, Tolomeo D, Agostini A, Traversa D, Macchia G, Storlazzi CT. CircRNAs and Fusion-circRNAs in cancer: new players in an old game. Cell Signal. 2020;75:109747. doi: 10.1016/j.cellsig.2020.109747. [DOI] [PubMed] [Google Scholar]
- 11.Tang Y, Jiang M, Jiang HM, Ye ZJ, Huang YS, Li XS, Qin BY, Zhou RS, Pan HF, Zheng DY. The roles of circRNAs in liver cancer immunity. Front Oncol. 2021;10:598464. doi: 10.3389/fonc.2020.598464. [DOI] [PMC free article] [PubMed] [Google Scholar]
- 12.Zhou Y, Zheng X, Xu B, Chen L, Wang Q, Deng H, Jiang J. Circular RNA hsa_circ_0004015 regulates the proliferation, invasion, and TKI drug resistance of non-small cell lung cancer by miR-1183/PDPK1 signaling pathway. Biochem Biophys Res Commun. 2019;508:527–535. doi: 10.1016/j.bbrc.2018.11.157. [DOI] [PubMed] [Google Scholar]
- 13.Chang Z, Huang R, Fu W, Li J, Ji G, Huang J, Shi W, Yin H, Wang W, Meng T, Huang Z, Wei Q, Qin H. The construction and analysis of ceRNA network and patterns of immune infiltration in colon adenocarcinoma metastasis. Front Cell Dev Biol. 2020;8:688. doi: 10.3389/fcell.2020.00688. [DOI] [PMC free article] [PubMed] [Google Scholar]
- 14.Huang R, Wu J, Zheng Z, Wang G, Song D, Yan P, Yin H, Hu P, Zhu X, Wang H, Lv Q, Meng T, Huang Z, Zhang J. The construction and analysis of ceRNA network and patterns of immune infiltration in mesothelioma with bone metastasis. Front Bioeng Biotechnol. 2019;7:257. doi: 10.3389/fbioe.2019.00257. [DOI] [PMC free article] [PubMed] [Google Scholar]
- 15.Chen Z, Xie H, Hu M, Huang T, Hu Y, Sang N, Zhao Y. Recent progress in treatment of hepatocellular carcinoma. Am J Cancer Res. 2020;10:2993–3036. [PMC free article] [PubMed] [Google Scholar]
- 16.Forner A, Reig M, Bruix J. Hepatocellular carcinoma. Lancet. 2018;391:1301–1314. doi: 10.1016/S0140-6736(18)30010-2. [DOI] [PubMed] [Google Scholar]
- 17.Kubes P, Jenne C. Immune responses in the liver. Annu Rev Immunol. 2018;36:247–277. doi: 10.1146/annurev-immunol-051116-052415. [DOI] [PubMed] [Google Scholar]
- 18.Levite M, Safadi R, Milgrom Y, Massarwa M, Galun E. Neurotransmitters and neuropeptides decrease PD-1 in T cells of healthy subjects and patients with hepatocellular carcinoma (HCC), and increase their proliferation and eradication of HCC cells. Neuropeptides. 2021;89:102159. doi: 10.1016/j.npep.2021.102159. [DOI] [PubMed] [Google Scholar]
- 19.Nishida N, Kudo M. Immunological microenvironment of hepatocellular carcinoma and its clinical implication. Oncology. 2017;92(Suppl 1):40–49. doi: 10.1159/000451015. [DOI] [PubMed] [Google Scholar]
- 20.Keenan BP, Fong L, Kelley RK. Immunotherapy in hepatocellular carcinoma: the complex interface between inflammation, fibrosis, and the immune response. J Immunother Cancer. 2019;7:267. doi: 10.1186/s40425-019-0749-z. [DOI] [PMC free article] [PubMed] [Google Scholar]
- 21.Pinter M, Jain RK, Duda DG. The current landscape of immune checkpoint blockade in hepatocellular carcinoma: a review. JAMA Oncol. 2021;7:113–123. doi: 10.1001/jamaoncol.2020.3381. [DOI] [PMC free article] [PubMed] [Google Scholar]
- 22.Qi X, Zhang DH, Wu N, Xiao JH, Wang X, Ma W. ceRNA in cancer: possible functions and clinical implications. J Med Genet. 2015;52:710–8. doi: 10.1136/jmedgenet-2015-103334. [DOI] [PubMed] [Google Scholar]
- 23.Higashitsuji H, Itoh K, Nagao T, Dawson S, Nonoguchi K, Kido T, Mayer RJ, Arii S, Fujita J. Reduced stability of retinoblastoma protein by gankyrin, an oncogenic ankyrin-repeat protein overexpressed in hepatomas. Nat Med. 2000;6:96–9. doi: 10.1038/71600. [DOI] [PubMed] [Google Scholar]
- 24.Fujita J, Sakurai T. The oncoprotein gankyrin/PSMD10 as a target of cancer therapy. Adv Exp Med Biol. 2019;1164:63–71. doi: 10.1007/978-3-030-22254-3_5. [DOI] [PubMed] [Google Scholar]
- 25.Liu F, Lou K, Zhao X, Zhang J, Chen W, Qian Y, Zhao Y, Zhu Y, Zhang Y. miR-214 regulates papillary thyroid carcinoma cell proliferation and metastasis by targeting PSMD10. Int J Mol Med. 2018;42:3027–3036. doi: 10.3892/ijmm.2018.3902. [DOI] [PMC free article] [PubMed] [Google Scholar]
- 26.Wang C, Li M, Wang S, Jiang Z, Liu Y. LINC00665 promotes the progression of multiple myeloma by adsorbing miR-214-3p and positively regulating the expression of PSMD10 and ASF1B. Onco Targets Ther. 2020;13:6511–6522. doi: 10.2147/OTT.S241627. [DOI] [PMC free article] [PubMed] [Google Scholar] [Retracted]
- 27.Chen BF, Suen YK, Gu S, Li L, Chan WY. A miR-199a/miR-214 self-regulatory network via PSMD10, TP53 and DNMT1 in testicular germ cell tumor. Sci Rep. 2014;4:6413. doi: 10.1038/srep06413. [DOI] [PMC free article] [PubMed] [Google Scholar]
- 28.Rodriguez-Acevedo AJ, Maher BH, Lea RA, Benton M, Griffiths LR. Association of oestrogen-receptor gene (ESR1) polymorphisms with migraine in the large Norfolk Island pedigree. Cephalalgia. 2013;33:1139–47. doi: 10.1177/0333102413486321. [DOI] [PubMed] [Google Scholar]
- 29.Yang W, He X, He C, Peng L, Xing S, Li D, Wang L, Jin T, Yuan D. Impact of ESR1 polymorphisms on risk of breast cancer in the Chinese Han population. Clin Breast Cancer. 2021;21:e235–e242. doi: 10.1016/j.clbc.2020.10.003. [DOI] [PubMed] [Google Scholar]
- 30.Mansoori B, Mohammadi A, Gjerstorff MF, Shirjang S, Asadzadeh Z, Khaze V, Holmskov U, Kazemi T, Duijf PHG, Baradaran B. miR-142-3p is a tumor suppressor that inhibits estrogen receptor expression in ER-positive breast cancer. J Cell Physiol. 2019 doi: 10.1002/jcp.28263. [Epub ahead of print] [DOI] [PubMed] [Google Scholar]
- 31.Ge Q, Lu M, Ju L, Qian K, Wang G, Wu CL, Liu X, Xiao Y, Wang X. miR-4324-RACGAP1-STAT3-ESR1 feedback loop inhibits proliferation and metastasis of bladder cancer. Int J Cancer. 2019;144:3043–3055. doi: 10.1002/ijc.32036. [DOI] [PubMed] [Google Scholar]
- 32.Shi SQ, Ke JJ, Xu QS, Wu WQ, Wan YY. Integrated network analysis to identify the key genes, transcription factors, and microRNAs involved in hepatocellular carcinoma. Neoplasma. 2018;65:66–74. doi: 10.4149/neo_2018_161215N642. [DOI] [PubMed] [Google Scholar]
- 33.Sharma DR, Sunkaria A, Wani WY, Sharma RK, Kandimalla RJ, Bal A, Gill KD. Aluminium induced oxidative stress results in decreased mitochondrial biogenesis via modulation of PGC-1α expression. Toxicol Appl Pharmacol. 2013;273:365–80. doi: 10.1016/j.taap.2013.09.012. [DOI] [PubMed] [Google Scholar]
- 34.Yuan C, Nguyen P, Baxter JD, Webb P. Distinct ligand-dependent and independent modes of thyroid hormone receptor (TR)/PGC-1 α interaction. J Steroid Biochem Mol Biol. 2013;133:58–65. doi: 10.1016/j.jsbmb.2012.09.001. [DOI] [PubMed] [Google Scholar]
- 35.Bost F, Kaminski L. The metabolic modulator PGC-1α in cancer. Am J Cancer Res. 2019;9:198–211. [PMC free article] [PubMed] [Google Scholar]
- 36.Zhang S, Liu X, Liu J, Guo H, Xu H, Zhang G. PGC-1 alpha interacts with microRNA-217 to functionally regulate breast cancer cell proliferation. Biomed Pharmacother. 2017;85:541–548. doi: 10.1016/j.biopha.2016.11.062. [DOI] [PubMed] [Google Scholar]
- 37.Byrnes CC, Jia W, Alshamrani AA, Kuppa SS, Murph MM. miR-122-5p expression and secretion in melanoma cells is amplified by the LPAR3 SH3-binding domain to regulate Wnt1. Mol Cancer Res. 2019;17:299–309. doi: 10.1158/1541-7786.MCR-18-0460. [DOI] [PubMed] [Google Scholar]
- 38.Li J, Li Y, Chen L, Yu B, Xue Y, Guo R, Su J, Liu Y, Sun L. p53/PGC-1α-mediated mitochondrial dysfunction promotes PC3 prostate cancer cell apoptosis. Mol Med Rep. 2020;22:155–164. doi: 10.3892/mmr.2020.11121. [DOI] [PMC free article] [PubMed] [Google Scholar]
- 39.Wu T, Dai Y. Tumor microenvironment and therapeutic response. Cancer Lett. 2017;387:61–68. doi: 10.1016/j.canlet.2016.01.043. [DOI] [PubMed] [Google Scholar]
- 40.Chen DS, Mellman I. Elements of cancer immunity and the cancer-immune set point. Nature. 2017;541:321–330. doi: 10.1038/nature21349. [DOI] [PubMed] [Google Scholar]
- 41.Liu X, Wu S, Yang Y, Zhao M, Zhu G, Hou Z. The prognostic landscape of tumor-infiltrating immune cell and immunomodulators in lung cancer. Biomed Pharmacother. 2017;95:55–61. doi: 10.1016/j.biopha.2017.08.003. [DOI] [PubMed] [Google Scholar]
- 42.Arneth B. Tumor microenvironment. Medicina (Kaunas) 2019;56:15. doi: 10.3390/medicina56010015. [DOI] [PMC free article] [PubMed] [Google Scholar]
- 43.Xing Y, Ruan G, Ni H, Qin H, Chen S, Gu X, Shang J, Zhou Y, Tao X, Zheng L. Tumor immune microenvironment and its related miRNAs in tumor progression. Front Immunol. 2021;12:624725. doi: 10.3389/fimmu.2021.624725. [DOI] [PMC free article] [PubMed] [Google Scholar]
- 44.Shen M, Ren X. New insights into the biological impacts of immune cell-derived exosomes within the tumor environment. Cancer Lett. 2018;431:115–122. doi: 10.1016/j.canlet.2018.05.040. [DOI] [PubMed] [Google Scholar]
- 45.Racioppi L, Nelson ER, Huang W, Mukherjee D, Lawrence SA, Lento W, Masci AM, Jiao Y, Park S, York B, Liu Y, Baek AE, Drewry DH, Zuercher WJ, Bertani FR, Businaro L, Geradts J, Hall A, Means AR, Chao N, Chang CY, McDonnell DP. CaMKK2 in myeloid cells is a key regulator of the immune-suppressive microenvironment in breast cancer. Nat Commun. 2019;10:2450. doi: 10.1038/s41467-019-10424-5. [DOI] [PMC free article] [PubMed] [Google Scholar]
- 46.Abolfath R, Helo Y, Bronk L, Carabe A, Grosshans D, Mohan R. Renormalization of radiobiological response functions by energy loss fluctuations and complexities in chromosome aberration induction: deactivation theory for proton therapy from cells to tumor control. Eur Physic J D. 2019;73:64–66. doi: 10.1140/epjd/e2019-90263-5. [DOI] [PMC free article] [PubMed] [Google Scholar]
- 47.Yan S, Zhang Y, Sun B. The function and potential drug targets of tumour-associated tregs for cancer immunotherapy. Sci China Life Sci. 2019;62:179–186. doi: 10.1007/s11427-018-9428-9. [DOI] [PubMed] [Google Scholar]
- 48.Shen H, Sheng H, Lu JJ, Feng C, Yao M, Pan H, Xu LS, Shen JF, Zheng Y, Zhou YL. Expression and distribution of programmed death receptor 1 and T cell immunoglobulin mucin 3 in breast cancer microenvironment and its relationship with clinicopathological features. Zhonghua Yi Xue Za Zhi. 2018;98:1352–1357. doi: 10.3760/cma.j.issn.0376-2491.2018.17.014. [DOI] [PubMed] [Google Scholar]
- 49.Bald T, Krummel MF, Smyth MJ, Barry KC. The NK cell-cancer cycle: advances and new challenges in NK cell-based immunotherapies. Nat Immunol. 2020;21:835–847. doi: 10.1038/s41590-020-0728-z. [DOI] [PMC free article] [PubMed] [Google Scholar]
- 50.Karin N, Razon H. The role of CCR5 in directing the mobilization and biological function of CD11b+Gr1+Ly6Clow polymorphonuclear myeloid cells in cancer. Cancer Immunol Immunother. 2018;67:1949–1953. doi: 10.1007/s00262-018-2245-6. [DOI] [PMC free article] [PubMed] [Google Scholar]
- 51.Wculek SK, Cueto FJ, Mujal AM, Melero I, Krummel MF, Sancho D. Dendritic cells in cancer immunology and immunotherapy. Nat Rev Immunol. 2020;20:7–24. doi: 10.1038/s41577-019-0210-z. [DOI] [PubMed] [Google Scholar]
- 52.Murray PJ, Wynn TA. Protective and pathogenic functions of macrophage subsets. Nat Rev Immunol. 2011;11:723–37. doi: 10.1038/nri3073. [DOI] [PMC free article] [PubMed] [Google Scholar]
- 53.Sag D, Cekic C, Wu R, Linden J, Hedrick CC. The cholesterol transporter ABCG1 links cholesterol homeostasis and tumour immunity. Nat Commun. 2015;6:6354. doi: 10.1038/ncomms7354. [DOI] [PMC free article] [PubMed] [Google Scholar]
- 54.Ocana A, Nieto-Jiménez C, Pandiella A, Templeton AJ. Neutrophils in cancer: prognostic role and therapeutic strategies. Mol Cancer. 2017;16:137. doi: 10.1186/s12943-017-0707-7. [DOI] [PMC free article] [PubMed] [Google Scholar]
- 55.Rakic A, Beaudry P, Mahoney DJ. The complex interplay between neutrophils and cancer. Cell Tissue Res. 2018;371:517–529. doi: 10.1007/s00441-017-2777-7. [DOI] [PubMed] [Google Scholar]
- 56.Olingy CE, Dinh HQ, Hedrick CC. Monocyte heterogeneity and functions in cancer. J Leukoc Biol. 2019;106:309–322. doi: 10.1002/JLB.4RI0818-311R. [DOI] [PMC free article] [PubMed] [Google Scholar]
- 57.Cassetta L, Fragkogianni S, Sims AH, Swierczak A, Forrester LM, Zhang H, Soong DYH, Cotechini T, Anur P, Lin EY, Fidanza A, Lopez-Yrigoyen M, Millar MR, Urman A, Ai Z, Spellman PT, Hwang ES, Dixon JM, Wiechmann L, Coussens LM, Smith HO, Pollard JW. Human tumor-associated macrophage and monocyte transcriptional landscapes reveal cancer-specific reprogramming, biomarkers, and therapeutic targets. Cancer Cell. 2019;35:588–602. e10. doi: 10.1016/j.ccell.2019.02.009. [DOI] [PMC free article] [PubMed] [Google Scholar]


