

Abstract
Objective: To determine the short-term prognostic value of Computed Tomography (CT) perfusion parameters in patients with advanced non-small cell lung cancer (NSCLC) after chemotherapy. Methods: A total of 60 patients with NSCLC who received concurrent radiotherapy and chemotherapy were enrolled. Before therapy, CT perfusion imaging was conducted to scan their local lesions. Then, the CT perfusion-associated parameters were recorded, and evaluated. According to the Response Evaluation Criteria in Solid Tumors (RECIST), 42 out of 60 patients had remission after chemotherapy. The blood flow (BF), blood volume (BV), and permeability surface (PS) of the two groups were analyzed before therapy, and factors and parameters affecting the efficacy of concurrent radiotherapy and chemotherapy were discussed. Results: After chemotherapy, patients with remission showed lower BF, BV, and PS levels in pulmonary lesions than those without remission (all P<0.05). According to the 1-year follow-up results, 33 cases survived, and 27 cases died, and the survivors showed lower BF and PS levels than the dead (both P<0.05). Conclusion: Patients with lower BF and PS in CT perfusion parameters obtained better chemotherapy efficacy, so BF and PS can be adopted to predict the survival of patients.
Keywords: CT perfusion, advanced non-small cell lung cancer, chemotherapy, short-term prognosis
Introduction
Lung cancer (LC) is a malignant tumor of the respiratory system, with the highest mortality and morbidity among all cancers worldwide. It mainly falls into small cell (SCLC, approximate 10%-15%) and non-small cell lung cancer (NSCLC, approximate 85%-90%) [1]. The latter includes two subtypes: adenocarcinoma and squamous cell carcinoma [2]. The early diagnosis rate of LC is low, and over 75% of the patients have already entered a locally advanced or metastatic stage at the time of diagnosis [3]. Usually, surgical resection is selected to treat tumors at early stage, which can greatly improve the survival of patients with LC [4]. However, not all patients with LC are suitable for surgery. Patients with advanced LC can only be treated with chemotherapy, targeted therapy, and chemotherapy-immunotherapy, as these patients have missed the optimal surgical timing due to metastasis [5,6]. Even if there is a treatment for advanced LC, the recovery rate is still terribly low [7]. Accordingly, evaluating efficacy and judging prognosis in time are of profound significance for clinical decision-making.
Currently, the response evaluation criteria in solid tumors (RECIST) is a widely adopted method for efficacy evaluation of chemotherapy and radiotherapy. It may reflect the effect of radiotherapy and chemotherapy through the change of tumor size before and after therapy. However, there are enormous limitations for RECIST [8]. For example, it is hard to objectively evaluate the early efficacy of patients undergoing targeted therapy [9]. The tumor after therapy may be covered with scar and edema, which compromises the evaluation effectiveness of RECIST [10]. Therefore, it is of particular importance to search for effective evaluation indexes. Computed tomography (CT) perfusion imaging is a novel functional imaging technology, in which, intravenous contrast agent is quickly injected into patients, and operators scan the region of interest (ROI) of the image with continuous CT, and then drew corresponding time-density curve of perfusion tissues that can reflect the concentration change of contrast agent in the tissues. Finally, the dynamic perfusion value of the tissues can be obtained [11,12]. Therefore, CT perfusion imaging can accurately reflect the blood perfusion of tumors.
In this study, we detected the survival rate of NSCLC patients based on CT perfusion parameters for the first time, and provided potential imaging markers for predicting and evaluating the curative effect of these patients after chemotherapy.
Methods and materials
Clinical data
A total of 60 patients with advanced LC treated in our hospital from May 2018 to May 2020 were analyzed retrospectively, including 33 males and 27 females, with a mean age of 65.4±7.4 years old. The study was approved by the Ethics Committee of our hospital with ethical approval number of LL2019(5)8, and was in strict accordance with the Declaration of Helsinki, and all participants were informed of the study [13]. See Table 1 for detailed clinical data of patients.
Table 1.
Clinical data
| Factors | n |
|---|---|
| Gender | |
| Male | 33 |
| Female | 27 |
| Age (Y) | |
| ≥65 | 35 |
| <65 | 25 |
| Tumor size | |
| ≥3 cm | 45 |
| <3 cm | 15 |
| Clinical staging | |
| III | 40 |
| IV | 20 |
| Differentiation | |
| Moderate + high differentiation | 27 |
| Low differentiation | 33 |
| Pattern of organization | |
| Squamous cell carcinoma | 25 |
| Adenocarcinoma | 35 |
Inclusion and exclusion criteria
The inclusion criteria: Patients who were diagnosed with lung adenocarcinoma by pathological examination and imaging examination, and met the staging criteria for NSCLC of the 8th edition of Union for International Cancer Control (UICC) [14], patients with completed case data, and patients who were willing to cooperate with treatment and follow-up.
The exclusion criteria: Patients with severe liver or kidney dysfunction; patients with other malignant tumors; pregnant women; lactating women; patients with severe cardiovascular or cerebrovascular diseases; patients who had received radiotherapy or chemotherapy before treatment; patients whose estimated survival time was less than 3 months; and those who were intolerant of the treatment plan.
Therapeutic regimen
All patients were treated by both radiotherapy and chemotherapy. Radiotherapy: The patient was treated by intensity modulated radiation therapy (IMRT) in the tumor radiotherapy department of our hospital, with a linear accelerator at 6 MVX-ray and 2 Gy/d, 5 times a week, with a total dose of 40-60 Gy. Chemotherapy: The patient received chemotherapy from the first day of radiotherapy. The chemotherapy regimen consisted of platinum drugs combined with docetaxel (DP regimen): DOC (75 mg/m2) was applied on the first day and cisplatin (DDP, 75 mg/m2) was applied in three days. Each cycle spanned 28 days, and the patient was given 2 cycles of chemotherapy during radiotherapy.
Determination methods
Firstly, a Siemens SOMATOM sensation 64-slice spiral CT machine was adopted to scan the whole lung of each patient. With the largest cross section of tumor tissue as the central slice of perfusion scanning, a randomly configured scanning software was adopted to continuously and dynamically scan the selected lesions: 120 KV; 100 mAs; matrix: 512×512; slice thickness: 2.4 mm; acquisition slice: 1.2 mm×24 slices; field of view (FOV): 380 mm; effective scanning range: 28 mm; scanning delay: 6 s; data acquisition time: 30 s; spiral time: 1 s. A total of 360 images were obtained after 30 scanning cycles. After targeted therapy, the slice selected before therapy was used as reference for another CT perfusion imaging scanning. Non-ionic contrast agent (370 mgI/mL iohexol) was injected into each patient via elbow vein with a high-pressure syringe at a rate of 4-6 ml/s and a dose of 50 mL, and 25 mL normal saline was injected into the patient at the same rate before and after enhancement.
Data processing
The 360 images generated by perfusion imaging were processed in a sensation 64 workstation, and the lung tumor item in randomly configured syngo Body PCT software was adopted to analyze the lesion. After motion correction, the layer displaying the maximum diameter of the lesion was selected, and aorta on the same layer (if there was no aorta on the layer, the common carotid artery, brachiocephalic artery or subclavian artery could be used for the upper lung, and the left ventricle could be used for the lower lung) was selected as the reference blood vessel. The ROI of the mass was delineated using the hyperperfusion region mean method. Two experienced senior physicians specialized in chest radiological diagnosis (engaged in imaging for more than 10 years) were arranged to conduct measurement, and their obtained values were averaged. The perfusion parameters including blood flow (BF), blood volume (BV) and permeability surface (PS) were obtained.
Outcome measures
Primary outcome measures
The changes of CT perfusion parameters of each patient before and after therapy were evaluated. The CT perfusion parameters of the remission group and the non-remission group before therapy were compared. In addition, the value of CT perfusion parameters in predicting the 1-year survival of patients after chemotherapy was evaluated (The follow-up was conducted through outpatient review of pathological system and telephone).
Secondary outcome measures
Observe the predictive value of CT perfusion parameters before treatment on the patient’s remission after treatment, and evaluate the use of ROC curve to assess its clinical value.
Efficacy assessment
The efficacy can be classified into four grades: Complete remission (CR), partial remission (PR), stable disease (SD) and progressive disease (PD). CR: The complete disappearance of tumor lesions, and no enhancement in the arterial phase; PR: A decrease in diameters of tumor lesion >30%, and no enhancement in the arterial phase; SD: no enhancement in the arterial phase of tumor lesions, and a decrease in the diameters of lesion ≤20%, or an increase <20%; PD: no enhancement in the arterial phase of tumor lesions, and an increase in the diameters of lesion ≥20% or the number of new lesions ≥1. Patients with CR and those with PR were counted as patients with remission after chemotherapy, while those with SD and those with PD as patients without remission after chemotherapy.
Statistical analyses
Our study adopted GraphPad 7 for data analysis and data visualization. Data in normal distribution were expressed as Mean ± SD, and the inter-group comparison was conducted using independent-samples T test, and the intra-group comparison was conducted using the paired t test. Additionally, the K-M survival curve was drawn to observe the total survival of patients, and the Log-rank test was conducted for survival analysis. P<0.05 indicated a significant difference.
Results
Changes of CT perfusion parameters before and after therapy
According to comparison of BF, BV and PS in patients before and after therapy, these parameters in patients decreased significantly after therapy (Figure 1A-C, P<0.01).
Figure 1.

Changes of CT perfusion parameters before and after therapy. A. Comparison of BF in patients before and after therapy (the paired t test, n=60). B. Comparison of BV in patients before and after therapy (the paired t test, n=60). C. Comparison of PS in patients before and after therapy (the paired t test, n=60). **P<0.01, ***P<0.001.
Predictive value of pre-treatment CT perfusion parameters on the remission of patients
The patients were divided into a remission group (n=42) and a non-remission group (n=18) according to clinical efficacy after therapy. Their BF, BV and PS before therapy were compared. According to the comparison results, the remission group showed significantly lower BF, BV and PS levels than the non-remission group before therapy (Figure 2A-C, all P<0.05). In order to more deeply determine the predictive value of pre-treatment CT perfusion parameters on the remission of patients, we drew receiver operator characteristic (ROC) curves of BF, BV and PS in prediction of remission. The analysis results revealed that BF, BV, and PS were good predictors when their areas under the curves (AUCs) were larger than 0.7. The results show that BF, BV and PS can be used as reference indicators for predicting patient remission (Table 2 and Figure 3A-C, P<0.05).
Figure 2.

Comparison of CT perfusion parameters between the remission group and non-remission group before therapy. A. Comparison of BF between the remission group (n=42) and non-remission group (n=18) before therapy (the independent-samples T test). B. Comparison of BV between the remission group (n=42) and non-remission group (n=18) before therapy (the independent-samples T test). C. Comparison of PS between the remission group (n=42) and non-remission group (n=18) before therapy (the independent-samples T test). **P<0.01, ***P<0.001.
Table 2.
ROC curve parameters
| Parameter index | AUC | Specificity (%) | Sensitivity (%) | Youden index (%) | Cut-off |
|---|---|---|---|---|---|
| BF | 0.733 | 88.89 | 57.14 | 46.03 | <82.97 |
| BV | 0.718 | 44.44 | 92.85 | 37.30 | <6.00 |
| PS | 0.806 | 100.00 | 66.67 | 66.67 | <16.55 |
Figure 3.
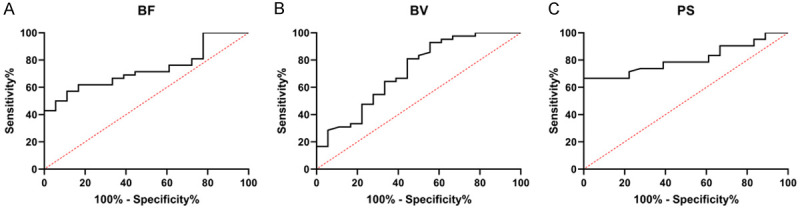
Predictive value of CT perfusion parameters before treatment on remission of patients. A. AUC of BF in patients’ remission. B. AUC of BV in patients’ remission. C. AUC of PS in patients’ remission.
Evaluation value of CT perfusion parameters on the remission of patients after therapy
The predictive value of BF, BV and PS in the remission of patients with advanced LC after therapy was confirmed in this study, but whether these indexes could be used as evaluation indexes of remission remains unclear. Therefore, we analyzed their evaluation value on patients’ remission after therapy. According to the results, the remission group showed significantly lower BF and PS levels than the non-remission group (Figure 4A-C, P<0.05), and had no significant difference with the non-remission group in BV (P>0.05). Then, we further analyzed the evaluation value of each index by ROC curve. According to the results, the AUCs of BF and PS were both >0.7, and the AUC of joint detection of them was similar to that of a single index (Table 3 and Figure 5A, 5B).
Figure 4.

Comparison of CT perfusion parameters between the remission group and non-remission group after therapy. A. Comparison of BS between the remission group (n=42) and non-remission group (n=18) after therapy (the independent-samples T test). B. Comparison of BV between the remission group (n=42) and non-remission group (n=18) after therapy (the independent-samples T test). C. Comparison of PS between the remission group (n=42) and non-remission group (n=18) after therapy (the independent-samples T test). **P<0.01, ***P<0.001.
Table 3.
ROC curve parameters
| Parameter index | AUC | Specificity (%) | Sensitivity (%) | Youden index (%) | Cut-off |
|---|---|---|---|---|---|
| BF | 0.753 | 61.11 | 76.19 | 37.30 | <65.04 |
| PS | 0.796 | 100.00 | 54.76 | 54.76 | <12.94 |
Figure 5.

Predictive value of CT perfusion parameters after treatment on remission of patients before treatment. A. AUC of BF in patients’ remission. B. AUC of PS in patients’ remission.
Value of CT perfusion parameters in short-term prognosis of patients after chemotherapy
We followed up 60 patients for 1 year and found that their survival rate was 55%. The patients were divided into a survival group (n=33) and a death group (n=27) according to their survival condition. According to comparison results, the survival group showed significantly lower BF and PS levels than the death group (Figure 6A-C, P<0.05), and the two groups showed no significant difference in BV level (P>0.05). In addition, the ROC curve-based analysis revealed that BF and PS were favorable indicators of clinical prognosis because their AUCs in prediction of patients’ short-term prognosis were 0.630 and 0.655, respectively (Table 4 and Figure 7A, 7B).
Figure 6.

Value of CT perfusion parameters in short-term prognosis of patients after chemotherapy. A. Comparison of BF between the survival group (n=33) and death group (n=27) before therapy (the independent-samples T test). B. Comparison of BV between the survival group (n=33) and death group (n=27) before therapy (the independent-samples T test). C. Comparison of PS between the survival group (n=33) and death group (n=27) before therapy (the independent-samples T test). * indicates P<0.05.
Table 4.
ROC curve parameters
| Parameter index | AUC | Specificity (%) | Sensitivity (%) | Youden index (%) | Cut-off |
|---|---|---|---|---|---|
| BF | 0.630 | 81.84 | 42.42 | 23.90 | <81.16 |
| PS | 0.655 | 51.72 | 75.75 | 27.48 | <18.70 |
Figure 7.

Predictive value of CT perfusion parameters on patients’ death before therapy. A. AUC of BF for prediction of patients’ survival. B. AUC of PS for prediction of patients’ survival.
Discussion
Surgery can be the first choice of clinical therapy for LC, with a variety of specific operation manners [15,16]. However, a small number of patients with LC have already entered the advanced stage and misssed the optimal surgical therapy timing [17]. and the prognosis of advanced patients is rather unsatisfactory. According to previous study, early intervention can improve the survival of patients [18,19]. One recent study has found the significance of observing the biological indicators of patients before therapy for the evaluation of patients’ condition and prediction of efficacy [20]. In this study, we compared the changes of CT perfusion parameters in patients after therapy of DP regimen. CT perfusion imaging is a crucial imaging examination method in recent years [21]. We intravenously injected contrast agent into patients and carried out repeated and rapid CT scanning to selected slices. Then we drew the time-density curve of the slice image. The concentration change of contrast agent in tissues indirectly reflected the changes of blood flow and blood flow velocity in tissues and organs. CT perfusion imaging is of great clinical value, because it can fully reflect the changes of microvessels in tumors, and help quantitatively evaluate the physiological conditions, density distribution and metabolic function of tumor microvessels [22,23]. BF is the amount of blood flowing through a certain tumor tissue per unit time, and BV reflects the amount of blood contained in certain tumor tissues. The blood vessels in malignant tumors are interwoven into a network, so the running length of different blood vessels in unit tumor tissue is different. PS refers to the unidirectional transmission rate of contrast agent into the intercellular space through capillary endothelium [24]. In our study, similar to the results obtained by Zhao et al. [25], BF, BV, and PS in tumor tissues of patients decreased greatly after therapy. The results further indicate that these indexes are promising clinical observation indexes for patients with advanced LC after chemotherapy.
For the purpose of further verifying the correlations of BF, BV and PS with treatment efficacy in patients, we assigned the patients to an remission group and a non-remission group according to treatment efficacy after therapy. According to further observation results, the remission group showed significantly lower BF, BV, and PS than the non-remission group. According to ROC curve-based analysis, BF, BV and PS had certain value in predicting the efficacy improvement in patients. In addition, we further compared the value of BF, BV and PS in evaluating the efficacy on patients after therapy. The results showed that the remission group showed notably lower BF and PS than the non-remission group, and the AUCs of them for efficacy evaluation was both larger than 0.7, but BV demonstrates no value in efficacy evaluation of patients. We believed that chemotherapy would induce the apoptosis of tumor cells in patients and thus give rise to a decrease in blood content in tumor tissues. According to the obtained data after chemotherapy, the blood content in tumor tissues of patients was not high, so BV is not likely to be an index for efficacy evolution on patients. At the end of the study, we made a further comparison according to the patients’ survival within one year. The analysis results indicate that BF and PS are promising indexes for evaluation of the survival of patients, but ROC curve-based analysis reveals that the two have clinical value only when their AUCs are >0.6. One study by Fraioli et al. [26] has revealed that CT perfusion parameters can help fully evaluate the changes triggered by therapy in NSCLC, and perfusion parameters are correlated with the treatment response evaluation using RECIST standard. In our study, CT perfusion parameters demonstrated both predictive and evaluative value for the clinical efficacy in patients with advanced NSCLC, which further confirmed the clinical value of CT perfusion imaging in LC prognosis.
The present study has determined the short-term prognostic value of CT perfusion parameters in patients with advanced NSCLC after chemotherapy, but it still has some limitations. For example, this study is not a prospective study, and the sample size is small. In addition, this study didn’t carry out subgroup analysis on patients with different types of LC, which needs more research in the future.
To sum up, patients lower BF and PS in CT perfusion imaging obtained better chemotherapy efficacy, so BF and PS can be adopted to predict the survival of patients.
Disclosure of conflict of interest
None.
References
- 1.Villalobos P, Wistuba II. Lung cancer biomarkers. Hematol Oncol Clin North Am. 2017;31:13–29. doi: 10.1016/j.hoc.2016.08.006. [DOI] [PMC free article] [PubMed] [Google Scholar]
- 2.de Sousa VML, Carvalho L. Heterogeneity in lung cancer. Pathobiology. 2018;85:96–107. doi: 10.1159/000487440. [DOI] [PubMed] [Google Scholar]
- 3.Schabath MB, Cote ML. Cancer progress and priorities: lung cancer. Cancer Epidemiol Biomarkers Prev. 2019;28:1563–1579. doi: 10.1158/1055-9965.EPI-19-0221. [DOI] [PMC free article] [PubMed] [Google Scholar]
- 4.Hoy H, Lynch T, Beck M. Surgical treatment of lung cancer. Crit Care Nurs Clin North Am. 2019;31:303–313. doi: 10.1016/j.cnc.2019.05.002. [DOI] [PubMed] [Google Scholar]
- 5.Ruiz-Cordero R, Devine WP. Targeted therapy and checkpoint immunotherapy in lung cancer. Surg Pathol Clin. 2020;13:17–33. doi: 10.1016/j.path.2019.11.002. [DOI] [PubMed] [Google Scholar]
- 6.Duma N, Santana-Davila R, Molina JR. Non-small cell lung cancer: epidemiology, screening, diagnosis, and treatment. Mayo Clin Proc. 2019;94:1623–1640. doi: 10.1016/j.mayocp.2019.01.013. [DOI] [PubMed] [Google Scholar]
- 7.Nagasaka M, Gadgeel SM. Role of chemotherapy and targeted therapy in early-stage non-small cell lung cancer. Expert Rev Anticancer Ther. 2018;18:63–70. doi: 10.1080/14737140.2018.1409624. [DOI] [PMC free article] [PubMed] [Google Scholar]
- 8.Xu P, Wang Y. Application of (18)F-FDG PET/CT in evaluation of curative effect and prognosis for small cell lung cancer. Zhong Nan Da Xue Xue Bao Yi Xue Ban. 2020;45:1255–1260. doi: 10.11817/j.issn.1672-7347.2020.190151. [DOI] [PubMed] [Google Scholar]
- 9.Choe J, Lee SM, Do KH, Kim S, Choi S, Lee JG, Seo JB. Outcome prediction in resectable lung adenocarcinoma patients: value of CT radiomics. Eur Radiol. 2020;30:4952–4963. doi: 10.1007/s00330-020-06872-z. [DOI] [PubMed] [Google Scholar]
- 10.Song P, Zhang J, Shang C, Zhang L. Curative effect assessment of immunotherapy for non-small cell lung cancer: the “blind area” of immune response evaluation criteria in solid tumors (iRECIST) Thorac Cancer. 2019;10:587–592. doi: 10.1111/1759-7714.13010. [DOI] [PMC free article] [PubMed] [Google Scholar]
- 11.Bucknell N, Hardcastle N, Jackson P, Hofman M, Callahan J, Eu P, Iravani A, Lawrence R, Martin O, Bressel M, Woon B, Blyth B, MacManus M, Byrne K, Steinfort D, Kron T, Hanna G, Ball D, Siva S. Single-arm prospective interventional study assessing feasibility of using gallium-68 ventilation and perfusion PET/CT to avoid functional lung in patients with stage III non-small cell lung cancer. BMJ Open. 2020;10:e042465. doi: 10.1136/bmjopen-2020-042465. [DOI] [PMC free article] [PubMed] [Google Scholar]
- 12.Chu LL, Knebel RJ, Shay AD, Santos J, Badawi RD, Gandara DR, Knollmann FD. CT perfusion imaging of lung cancer: benefit of motion correction for blood flow estimates. Eur Radiol. 2018;28:5069–5075. doi: 10.1007/s00330-018-5492-1. [DOI] [PubMed] [Google Scholar]
- 13.Issue information-declaration of helsinki. J Bone Miner Res. 2018;33:BM i–BM ii. doi: 10.1002/jbmr.3271. [DOI] [PubMed] [Google Scholar]
- 14.Koul R, Rathod S, Dubey A, Bashir B, Chowdhury A. Comparison of 7th and 8th editions of the UICC/AJCC TNM staging for non-small cell lung cancer in a non-metastatic North American cohort undergoing primary radiation treatment. Lung Cancer. 2018;123:116–120. doi: 10.1016/j.lungcan.2018.06.029. [DOI] [PubMed] [Google Scholar]
- 15.Bade BC, Dela Cruz CS. Lung cancer 2020: epidemiology, etiology, and prevention. Clin Chest Med. 2020;41:1–24. doi: 10.1016/j.ccm.2019.10.001. [DOI] [PubMed] [Google Scholar]
- 16.Akhurst T. Staging of non-small-cell lung cancer. PET Clin. 2018;13:1–10. doi: 10.1016/j.cpet.2017.09.004. [DOI] [PubMed] [Google Scholar]
- 17.Cheung CHY, Juan HF. Quantitative proteomics in lung cancer. J Biomed Sci. 2017;24:37. doi: 10.1186/s12929-017-0343-y. [DOI] [PMC free article] [PubMed] [Google Scholar]
- 18.Nasim F, Sabath BF, Eapen GA. Lung cancer. Med Clin North Am. 2019;103:463–473. doi: 10.1016/j.mcna.2018.12.006. [DOI] [PubMed] [Google Scholar]
- 19.Yan X, Li G. Preoperative systemic immune-inflammation index predicts prognosis and guides clinical treatment in patients with non-small cell lung cancer. Biosci Rep. 2020;40:BSR20200352. doi: 10.1042/BSR20200352. [DOI] [PMC free article] [PubMed] [Google Scholar]
- 20.Clay V, Papaxoinis G, Sanderson B, Valle JW, Howell M, Lamarca A, Krysiak P, Bishop P, Nonaka D, Mansoor W. Evaluation of diagnostic and prognostic significance of Ki-67 index in pulmonary carcinoid tumors. Clin Transl Oncol. 2017;19:579–586. doi: 10.1007/s12094-016-1568-z. [DOI] [PubMed] [Google Scholar]
- 21.Tung RT, Heyns J. Incidental findings of malignancy of the chest by single photon emission computed tomography myocardial perfusion imaging (SPECT-CT MPI): one year follow-up report. Kans J Med. 2020;13:280–284. doi: 10.17161/kjm.vol13.13822. [DOI] [PMC free article] [PubMed] [Google Scholar]
- 22.Wang M, Li B, Sun H, Huang T, Zhang X, Jin K, Wang F, Luo X. Correlation study between dual source CT perfusion imaging and the microvascular composition of solitary pulmonary nodules. Lung Cancer. 2019;130:115–120. doi: 10.1016/j.lungcan.2019.02.013. [DOI] [PubMed] [Google Scholar]
- 23.Xue DD, Xu JL, Shi DP. The (18)F-FDG positron emission tomography integrated computed tomography associate with intravoxel incoherent motion in prediction of EGFR expression in lung cancer. Zhonghua Yi Xue Za Zhi. 2020;100:1159–1163. doi: 10.3760/cma.j.cn112137-20190912-02016. [DOI] [PubMed] [Google Scholar]
- 24.Delaney FT, Fong KM, Lee JC. Primary thoracic cancers incidentally detected on CT attenuation correction images during myocardial perfusion scintigraphy. Clin Lung Cancer. 2018;19:e575–e579. doi: 10.1016/j.cllc.2018.03.018. [DOI] [PubMed] [Google Scholar]
- 25.Zhao L, Guan W, Han Y, Zhao Y. Comparative study on CT perfusion parameters of different types of lung cancer before and after chemoradiotherapy. J Biol Regul Homeost Agents. 2014;28:675–681. [PubMed] [Google Scholar]
- 26.Fraioli F, Anzidei M, Serra G, Liberali S, Fiorelli A, Zaccagna F, Longo F, Anile M, Catalano C. Whole-tumor CT-perfusion of unresectable lung cancer for the monitoring of anti-angiogenetic chemotherapy effects. Br J Radiol. 2013;86:20120174. doi: 10.1259/bjr.20120174. [DOI] [PMC free article] [PubMed] [Google Scholar]