

Abstract
Hepatocellular carcinoma (HCC) is one of the commonest lethal malignancies worldwide, and often diagnosed at an advanced stage, without any curative therapy. Immune checkpoint blockers targeting the programmed death receptor 1 (PD‐1) have shown impressive antitumor activity in patients with advanced‐stage HCC, while the response rate is only 30%. Inducible PD‐L1 overexpression may result in a lack of response to cancer immunotherapy, which is attributed to a mechanism of adaptive immune resistance. Our study investigated that the overexpression of PD‐L1 promoted the invasion and migration of liver cancer cells in vitro, and the induced overexpression of PD‐L1 in the tumor microenvironment could weaken the effects of anti‐PD‐1 immunotherapy in a BALB/c mouse model of liver cancer. CPI‐203, a small‐molecule bromodomain‐containing protein 4 (BRD4) inhibitor, which can potently inhibit PD‐L1 expression in vitro and in vivo, combined with PD‐1 antibody improved the response to immunotherapy in a liver cancer model. Cell transfection and chromatin immunoprecipitation assay manifested that BRD4 plays a key role in PD‐L1 expression; CPI‐203 can inhibit PD‐L1 expression by inhibiting the BRD4 occupation of the PD‐L1 promoter region. This study indicates a potential clinical immunotherapy method to reduce the incidence of clinical resistance to immunotherapy in patients with HCC.
Keywords: BRD4 inhibitor, IFN‐γ, immunotherapy, liver cancer, PD‐L1
Antibodies that block the PD‐1/PD‐L1 inhibition axis activate tumor‐specific T cells producing IFN‐γ, but continuous IFN‐γ leads to a PD‐L1 expression increase in tumor cells, which can engage the PD‐1 receptor on T cells to suppress antitumor immunity. CPI‐203, which can inhibit immunotherapy‐induced PD‐L1 expression, provides the conditions for efficacy of anti‐PD‐1 immunotherapy.

1. INTRODUCTION
Hepatocellular carcinoma (HCC) is the third leading cause of cancer‐related deaths worldwide. 1 The main risk factors for HCC include chronic hepatitis B/C virus infection. 2 Typically, HCC is often diagnosed at an advanced stage, and mainly palliative treatment options are available. 3 Programmed death ligand‐1 (PD‐L1) is constitutively expressed on tumor cells can interact with programmed cell death protein‐1 (PD‐1) on cytotoxic T cells, inhibiting the function of the T cell. 4 High PD‐L1 expression in tumor cells is associated with poorer outcomes in patients with HCC. 5 , 6 Recently, drugs targeting PD‐1/PD‐L1 immune checkpoints have shown impressive antitumor activity for patients with advanced stages of various cancers, such as melanoma, lung cancer, breast cancer, and HCC. 2 However, the response rates are generally low (20%‐40%). 7 , 8 , 9 Combination therapy with the immune checkpoint blockers is being researched. 10 , 11 , 12 , 13 , 14 , 15 However, it is too early to conclude whether a meaningful clinical benefit is obtained in combination therapy, because almost 59% of patients have to discontinue this immunotherapy due to serious immune‐related adverse events (irAEs). 16
The exhaustion of antigen‐specific CD8+ T cells during persistent infections and cancer has been well documented, and PD‐1 is a marker of CD8+ T‐cell exhaustion. 17 IFN‐γ is a primary factor released by activated CD8+ T cells, and plays an important role in the host defense mechanism. 18 Current findings indicate that IFN‐γ has dual roles: one as a marker of antitumor immunity, the other as an inducer of immune escape through various mechanisms, such as PD‐L1 expression, 19 which serves as a potent immune escape mechanism in cancer cells. 20 , 21 , 22
Bromodomain‐containing protein 4 (BRD4) is an epigenetic reader of histones for acetylated lysine, 23 which is overexpressed in many solid tumors, and predicts malignant progression as well as poor patient prognosis. 24 Several BRD4 inhibitors have been developed, mainly for acute leukemia, lymphoma, and multiple myeloma. But this has not been reported in patients with liver cancer. 25 , 26 Recent studies have revealed that BRD4 plays an important role in the regulation of PD‐L1 expression in cancer, 27 , 28 so, in this study, we investigated the antitumor effects of a BRD4 inhibitor in combination with PD‐1 antibody in HCC.
2. MATERIALS AND METHODS
2.1. Cell lines, reagents, and antibodies
Human liver cancer cell lines HepG2, HepG2.2.15, SMMC‐7721, Huh‐7, and BEL7402; murine liver cancer cell line H22; and human breast cancer cell line MDA‐MB‐231 were obtained from the ATCC. The cells were cultured in DMEM/RPMI‐1640 medium, with 10% fetal bovine serum and 1% penicillin/streptomycin in culture conditions of 5% CO2 in air at 37°C. CPI‐203 was purchased from MedChemExpress (MCE). Human antibodies specific for BRD4, GAPDH, and β‐actin were purchased from Cell Signaling Technology. Human anti‐PD‐L1 antibody was purchased from Abcam. Mouse antibody specific for PD‐L1 as well as recombinant human IFN‐γ were purchased from Proteintech. Mouse anti‐CD3–FITC, anti‐CD4–APC, anti‐CD8–PerCP‐Cy5.5, and anti‐PD‐L1–PE conjugated antibodies were purchased from BD Biosciences. PD‐1 antibody (αPD‐1, clone: RMP1‐14) and IgG2a isotype control (clone: 2A3) were purchased from BioXcell.
2.2. Cell cytotoxic assay
HepG2 cells were treated with the specified compounds at final concentration gradients for the indicated durations. MTT (working concentration 0.5 mg/mL) was added, and the cells were incubated for 4 h at 37°C. The medium was removed and DMSO was added, and the plates were placed in a shaking bed for mixing at a low speed for 15 min. Then, absorbance was detected at 570 nm using a microplate reader.
2.3. Colony‐formation assay
HepG2 cells were cultured in DMEM containing different concentrations of CPI‐203 (0.25, 0.5, and 1 μmol/L) for approximately 2 wk. When visible clones appeared, the medium was discarded, and the wells were washed twice with PBS. The HepG2 clones were fixed with 96% methanol for 20 min, stained with 1% crystal violet for 30 min, scanned, and photographed using an enzyme‐linked immunodot analyzer.
2.4. Transwell assay
The cells were washed twice with PBS and resuspended in serum‐free medium for adding into the upper chamber. The lower chambers were filled with medium containing 10% FBS. After incubation at 37°C for 24 h, the cells located at the underside of the chamber were washed with PBS, fixed with methanol, and stained with 0.5% crystal violet. Cells were imaged by inverted microscope and calculated.
2.5. RNA extraction and quantitative real‐time PCR
Total mRNA was extracted using an RNA extraction kit. Reverse transcription was carried out using the PrimeScript RT Reagent Kit. qRT‐PCR was conducted on a 96 Real‐Time System and analyzed on the LightCycler 480 System. The mRNA levels of genes were normalized to the GAPDH gene and calculated using the 2‐∆∆CT method. The primer sequences for PD‐L1, BRD4, and GAPDH are shown in Table S1.
2.6. Western blotting
Cells were lysed using RIPA buffer, centrifuged at 12 000 rpm at 4°C for 15 min, and the supernatant was collected. Protein samples were separated by SDS‐PAGE and transferred to a PVDF membranes. After blocking, the membranes were probed with a primary and a secondary antibody. Chemiluminescence signals were detected using an ECL reagent kit, and a multifunctional imaging system (ProteinSimple) was used for image acquisition.
2.7. Cell transfection
Small interfering RNAs (siRNAs) targeting BRD4 were designed by GenePharma, as shown in Table S2, and were transfected using the Lipo3000 transfection reagent according to the manufacturer's protocol; mRNA was collected for qRT‐PCR analysis. HepG2 cells were infected with pcDNA3.1‐HA‐BRD4 plasmid or pcDH‐PD‐L1 plasmid, with sequence as shown in Table S3, using the PolyjetTM transfection reagent according to the manufacturer's instructions, and mRNA or protein was collected for qRT‐PCR or western blot (WB) analysis.
2.8. Chromatin immunoprecipitation (ChIP) assay
Cells were cross‐linked and lysed; the chromatin was broken into 200–400‐bp fragments using an ultrasonic cell disruptor. Immunoprecipitation was performed with the BRD4 antibody at 4°C for at least 12 h, and then incubated with protein A agarose/salmon sperm DNA beads at 4°C for 1 h. The DNA was reverse‐cross‐linked and extracted using a DNA extraction kit, and qRT‐PCR was performed to estimate DNA sequence levels using the PD‐L1 promoter primer. The primer sequences used for the PD‐L1 promoter are shown in Table S1.
2.9. Dual‐luciferase reporter assay
The luciferase reporter plasmid was designated as pGL3‐PD‐L1. The Renilla plasmid pRL‐TK was used as an internal control. HepG2 cells were co‐transfected with a mixture of pGL3‐PD‐L1/pRL‐TK and Polyjet™ for 8 h in a medium containing IFN‐γ (100 ng/mL), CPI‐203 (5 μmol/L), or CPI‐203 combined with IFN‐γ for 48 h. PD‐L1 promoter activity was measured using the Dual‐Luciferase Reporter Assay System (Promega) according to the manufacturer's instructions.
2.10. Mouse tumor implantation
Male BALB/c mice (6‐8 wk old) were obtained from the Animal Research Center of Southern Medical University and maintained in a specific pathogen‐free (SPF) facility. All animal experiments were conducted in accordance with institutional guidelines and approved by the Animal Care and Use Committee of Southern Medical University. H22 cells were injected subcutaneously into the flanks of the BALB/c mice. The length and width for tumor diameters were measured using a vernier caliper, and tumor volumes (mm3) = (length × width × width)/2. When tumors reached approximately 100 mm3, the mice were randomly assigned to control or experimental groups.
2.11. ELISA assay
Serum samples were added to the 96‐well plates, and incubated with antibody for 2 h. The HRP conjugate working solution was added, and samples incubated for another 45 min. 3,3′,5,5′‐Tetramethylbenzidine (TMB) was added under dark conditions, and the terminating solution was added according to the experimental conditions. Dual‐wavelength absorption values at 450 and 570 nm were determined using an enzyme plate analyzer and the concentration was calculated.
2.12. Flow cytometry assay
Tumors were digested with PBS containing 2 mg/mL collagenase IV. Single‐cell suspensions were resuspended in FACS buffer, and stained with anti‐CD3–FITC, anti‐CD4–APC, anti‐CD8–PerCP‐Cy5.5, and anti‐PD‐L1–PE conjugated antibodies for 30 min at 4°C. The cells were then washed twice with FACS buffer and detected on a flow cytometer (BD LSRFortessa X‐20), and analyzed using FlowJo software.
2.13. Immunohistochemistry and H&E staining
The sections were deparaffinized in toluene and rehydrated in a gradient series of ethanol. Endogenous peroxides were quenched with 0.3% H2O2/methanol. After blocking with goat serum, the slides were incubated with anti‐PD‐L1 antibody and appropriate secondary antibodies. Slides were visualized using a DAB kit, followed by counterstaining with hematoxylin. Brown membranous staining was considered to be positive for PD‐L1 expression.
For H&E staining, the tissue sections were subjected to xylol deparaffinization, rehydration, and stained with hematoxylin solution. Here, 1% HCl solution was used for differentiation. The sections were then stained with eosin solution, dried overnight, and the results were observed using an inverted fluorescence microscope.
2.14. Data presentation and statistical analysis
GraphPad Prism 5.0 was used for making charts. Statistical analysis was performed using SPSS 22.0 software. Parametric data are presented as mean ±standard error of the mean (SEM). We used the Student t test for two‐group comparison or one‐way ANOVA for multiple comparisons. P < .05 was considered significant: P‐values were defined as *P < .05, **P < .01, and ***P < .001.
3. RESULTS
3.1. PD‐L1 overexpression in the tumor microenvironment leading to immune escape
BALB/c mice were used to examine the anti‐PD‐1 immunotherapeutic effects in liver cancer. PD‐1 antibody (αPD‐1) was administrated 3 times (Figure S1A,B). The results showed no statistically significant difference in tumor volume and tumor weight between the αPD‐1 group and the control group (Figure S1C,D). ELISA was used to detected levels of IFN‐γ in the serum, and the result showed that it was significantly higher in the αPD‐1 group than in the control group (Figure 1A).
FIGURE 1.

IFN‐γ and PD‐L1 were detected in the experiment. A, Serum levels of IFN‐γ were determined by ELISA (P < .05). B, Overexpression of PD‐L1 in HepG2 cells was verified by WB assay. C, Transwell assay was performed and the number of invasion cells was counted (P < .001). D, Expression of PD‐L1 in the tumor tissues was detected by IHC, brown color indicates the PD‐L1‐positive area (scale bars: 50 μm)
Programmed death ligand‐1 plays an important role in tumor immune evasion. To investigate the tumor‐intrinsic role of PD‐L1, wound‐healing assay and transwell assay were used to examine the tumor invasion and migration of PD‐L1 overexpression cells in vitro. Results showed that the overexpression of PD‐L1 promoted cancer cell invasion and migration (Figures 1B,C and S1E). Then PD‐L1 expression was further detected in the tumoral tissues using immunohistochemistry (IHC), showing that anti‐PD‐1 immunotherapy significantly induced PD‐L1 expression (Figure 1D). Therefore, we speculated that overexpression of PD‐L1 in the tumor microenvironment might affect the therapeutic effect of anti‐PD‐1 immunotherapy. So, it is inferred that blocking the elevation of PD‐L1 in the tumor microenvironment might promote the efficacy of anti‐PD‐1 immunotherapy.
3.2. CPI‐203 inhibited PD‐L1 expression in the tumor microenvironment
Analysis of the Cancer Genome Atlas (TCGA) database using the online database UALCAN (http://ualcan.path.uab.edu) showed that BRD4 was highly expressed in liver cancer tissues (Figure S2A). In addition, BRD4 expression in an hepatic cell line (L02) was lower than in hepatocarcinoma cell lines (Figure S2B). JQ1 is the most recognized and most widely used BRD4 inhibitor, however its clinical application is limited by poor water solubility, short half‐life, and relatively high toxicity. CPI‐203 is a new optimized compound that is based on the JQ1 structure (Figure S2C), and water solubility been improved, with extended half‐life, and is more targeted. MTT assay was used to explore the proliferation toxicity of JQ1 and CPI‐203 in the L02 line, and the results showed that CPI‐203 is less toxic than JQ1 (Figure 2A), which makes it potentially more suitable for clinical application. The clone formation assay showed that CPI‐203 (1 μmol/L) significantly inhibited clone formation in HepG2 (Figure 2B).
FIGURE 2.
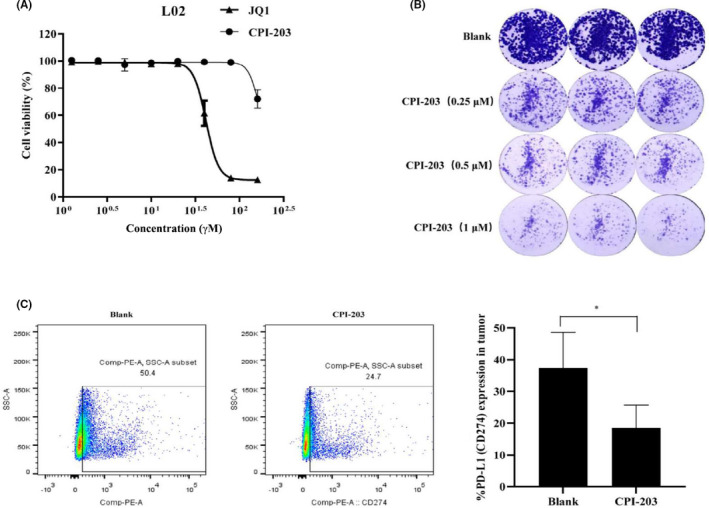
Bromodomain‐containing protein 4 inhibitors decrease the expression of PD‐L1 in liver cancer. A, L02 cells were treated with JQ1 (0, 0.625, 1.25, 2.5, 5, 10, 20, 40, 80, or 160 μmol/L) and CPI‐203 (0, 0.625, 1.25, 2.5, 5, 10, 20, 40, 80, or 160 μmol/L) for 48 h; proliferation was detected using MTT. B, Cells were seeded into six‐well plates, and cultured in different concentrations of CPI‐203 for about 2 wk. The clones were scanned using an enzyme‐linked immunodot analyzer. C, CPI‐203 was administrated in vivo, the tumor tissue single cells were stained by antibody, the percentage expression of PD‐L1 was detected by FCM (*P < .05)
Next, the tumor‐bearing BALB/c mice were treated with CPI‐203 for 10 d in vivo (Figure S2D), the results showed that there was no statistically difference between the 2 groups on tumor volume and weight (Figure S2E‐G). But. compared with the control group, CPI‐203 significantly decreased PD‐L1 expression in the tumor microenvironment (Figure 2C). To explore the relationship between PD‐L1 and CPI‐203 in vitro, the expression level of PD‐L1 in liver cancer cell lines, including Huh7, HepG2, SMMC7721, and HepG2.2.15, was detected by WB (Figure S3A). The results showed that the expression of PD‐L1 in HepG2.2.15 cell line was much higher than that in HepG2, Huh7, and SMMC7721 cell lines. Therefore, HepG2 and HepG2.2.15 cell lines were selected to represent 2 different expression states of PD‐L1 in this study. MTT assay showed that the inhibitory effect of CPI‐203 on cell proliferation of HepG2.2.15 cells was stronger than that of HepG2 cells, and further confirmed that the proliferation inhibitory effect of CPI‐203 on the HepG2/PD‐L1OE and HepG2.2.15/PD‐L1KO/OE cells, both of which stably overexpressed PD‐L1 without control by BRD4 (Figure S3B‐D), was weaker than the initial cell lines (Figure S3E‐G). These results indicated that CPI‐203 manifested an antitumor effect by inhibiting the expression of PD‐L1, and it is a suitable candidate for combination immunotherapy.
3.3. Significant antitumor effects of CPI‐203 in combination with anti‐PD‐1 immunotherapy in liver cancer
The antitumor effect of CPI‐203 combined with PD‐1 antibody on liver cancer was evaluated in vivo. To fully demonstrate the therapeutic effect of the PD‐1 antibody and CPI‐203, the administration of the PD‐1 antibody and CPI‐203 was extended to 14 d, among them, PD‐1 antibody was administrated 5 times (Figure 3A). Compared with the control group, the tumor in the combination group of CPI‐203 and PD‐1 antibody was significantly inhibited (Figure 3B,C), whereas the antitumor effect in the anti‐PD‐1 monotherapy group was observed until approximately 2 wk after administration (Figure 3D). The necrosis of tumoral tissue was more obvious in the combination group than in the other groups (Figure 3F). Also, the results showed that the expression of PD‐L1 significantly increased after the PD‐1 antibody was administered, however when combined with CPI‐203 the expression of PD‐L1 was significantly inhibited (Figure 3E).
FIGURE 3.

Antitumor effects of CPI‐203 combined with PD‐1 antibody in BALB/c mice. A, Schematic diagram of drug administration in BALB/c mice, there were 5 groups (n = 8): Isotype (IgG2a), CPI‐203, αPD‐1, and CPI‐203 plus αPD‐1 group. PD‐1 antibody was administrated every 3 d for a total of 5 times; CPI‐203 was administrated once daily, 14 times in total; IgG2a was the same as anti‐PD‐1. B, Photograph of the tumors in each group. C, Tumor volume was calculated using the formula and were analyzed. (*P < .05, **P < .01, ***P < .001). D, Tumor volume was calculated during the administration. E, Tumor single cells were stained with mouse anti‐PD‐L1–PE conjugated antibody, the percentage expression of PD‐L1 was analyzed by FCM. F, H&E staining of the tumor tissues in different treatment groups
According to the abovementioned experimental results, it appears that the PD‐1/PD‐L1 immune checkpoint inhibitors are effective for the treatment of liver cancer, but PD‐1 antibody or CPI‐203 both require a long time to exert their antitumor effects when administered separately. The combination therapy of CPI‐203 and PD‐1 antibody can exert a good antitumor effect in the initial stages of the treatment. We speculated that the initial failure to achieve an antitumor effect in the PD‐1 antibody group might be attributable to the overexpression of PD‐L1 in the tumor microenvironment. With prolonged administration of PD‐1 antibody, the antitumor effect was achieved only when sufficient PD‐1 antibodies were aggregated in the tumor microenvironment to block the binding of PD‐1and PD‐L1. The problems that should be also noted are that with prolonged administration of PD‐1 antibody, IFN‐γ was increased synchronically, also overexpression of PD‐L1 was induced by IFN‐γ. Immunotherapy efficacy and resistance will coexist, and which is dominant may be affected by the immune status of different individuals. However, CPI‐203 can block the induced expression of PD‐L1 and exerted synergistic antitumor effects initially. In this way, not only could immunotherapy resistance be avoided, but also dose increase in PD‐1 antibody could be avoided, and the incidence of immune‐related adverse events (irAEs) would be decreased.
We also detected the proportion of CD4+ and CD8+ T lymphocytes in the tumoral tissues by flow cytometry (FCM). Results indicated that there was no change between the groups in the percentage of CD3+CD4+ T and CD3+CD8+ T lymphocytes in the tumor and spleen tissues (Figure S4C,D). These suggested that the antitumor effect of the combination therapy was not dependent on the increase in cytotoxic T lymphocytes, but relied on the activation of cytotoxic T lymphocytes that originally existed in the tumor microenvironment.
IFN‐γ in the serum of all treatment groups was monitored using ELISA. The results showed that combination group did not significantly decrease or increase the serum IFN‐γ (Figure S4B). This result indicated that the inhibitory effect of CPI‐203 on PD‐L1 expression was not dependent on the inhibition of IFN‐γ, it was a direct regulation of PD‐L1 expression.
3.4. Adverse events monitored for the CPI‐203 plus anti‐PD‐1 therapy
Adverse events must be given equal attention when considering the improvement of therapeutic efficacy, especially the irAEs. First, the body weight of the mice was monitored during treatment and showed no significant changes in either group (Figure S4A). The lung tissues H&E staining showed no obvious immune‐related pneumonia in any of the therapy groups (Figure 4A), Colon tissues H&E staining showed that some follicular lymphocyte aggregated in the basal area of intestinal mucosa in the PD‐1 antibody group; while this was not observed in the combination treatment group (Figure 4B). Simultaneously, we examined the biochemical indices of the liver and kidney using a biochemical analyzer and conducted routine blood examination to determine the bone marrow function. All of these indicators showed no statistical differences among the groups (Figure 4C,D). Therefore, combination therapy with CPI‐203 and anti‐PD‐1 for liver cancer is clinically feasible.
FIGURE 4.

Adverse events were monitored. A, B, H&E staining of the lung and colon in each group (scale bars: 50 μm). C, Serum indicators of liver function: AST (glutamic‐oxalacetic transaminase), ALT (glutamate alanine aminotransferase), ALB (serum albumin), GLO (seroglobulin). Serum indicators of renal function: UREA (urea nitrogen). D, Bone marrow function was monitored by routine blood assay, white blood cell (WBC), percentage of lymphocytes (lymph %), percentage of intermediate cells (Mid %) and platelets (PLT)
3.5. CPI‐203 inhibited PD‐L1 expression in a non–IFN‐γ‐dependent manner
To investigate the regulatory effect of a BRD4 inhibitor on PD‐L1 expression, IFN‐γ was used to stimulate the HepG2 cell line in vitro to imitate the in vivo microenvironment. First, MTT assay was used to detect the proliferative toxicity of IFN‐γ and CPI‐203 on HepG2, excluding the cytotoxicity‐induced change in PD‐L1 expression. The results showed that IFN‐γ and CPI‐203 had no obvious effects on the proliferation of HepG2 (Figure S5A,B). The results demonstrated that IFN‐γ increased the expression of PD‐L1 in a dose‐dependent manner at the protein and mRNA level in HepG2 cells (Figure 5A,B). To better demonstrate the effect of BRD4 inhibitor on PD‐L1 expression, we selected a working concentration of 100 ng/mL for IFN‐γ; the results showed that the BRD4 inhibitors (JQ1 and CPI‐203) significantly inhibited the IFN‐γ induced PD‐L1 expression at the mRNA and protein levels (Figure 5C,D).
FIGURE 5.

Mechanisms of IFN‐γ and BRD4 inhibitors on PD‐L1 expression. A, B, HepG2 cells were treated with different concentrations of IFN‐γ (0, 10, 20, 40, 80, or 160 ng/mL) for 24 h, then PD‐L1 expression was detected using WB and qRT‐PCR. C, D, HepG2 cells were treated with IFN‐γ (100 ng/mL) or IFN‐γ combined with BRD4 inhibitors JQ1 and CPI‐203 (5 μmol/L) for 24 h and 48 h, then the PD‐L1 expression was detected using WB and qRT‐PCR (*P < .05). E, HepG2 cells were treated by IFN‐γ (100 ng/mL) with or without CPI‐203 (5 μmol/L) for 48 h, then proteins were collected for WB to detect phosphorylation of STAT1. F, Expression of PD‐L1 protein in HepG2 and MDA‐MB‐231 cells was detected by WB. G, HepG2 was treated with IFN‐γ (100 ng/mL) or IFN‐γ combined with CPI‐203 (1 μmol/L, 2 μmol/L, 5 μmol/L) for 48 h. H, MDA‐MB‐231 cells were treated with CPI‐203 (1 μmol/L, 2 μmol/L, 5 μmol/L) for 48 h. I, PD‐L1 promoter activity was detected using double luciferase reporter gene assay in HepG2 cells, treated with IFN‐γ (100 ng/mL) or CPI‐203 (5 μmol/L) for 48 h
The IFN‐γ–STAT1 signaling pathway is the main pathway for inducing PD‐L1 expression. 29 , 30 The phosphorylation of STAT1 was investigated to evaluate the mechanisms of CPI‐203 inhibition of PD‐L1 expression. WB results showed that IFN‐γ significantly induced the phosphorylation of STAT1, but CPI‐203 had no effect on it (Figure 5E).
Then, the triple‐negative breast cancer cell line MDA‐MB‐231, with high PD‐L1 protein expression, was selected to test whether CPI‐203 could inhibit PD‐L1 expression without IFN‐γ stimulation. The results showed that CPI‐203 could also inhibit the expression of PD‐L1 in MDA‐MB‐231 cells in the absence of IFN‐γ. Based on these results, it is speculated that CPI‐203 regulation of the expression of PD‐L1 is non–IFN‐γ pathway dependent and non‐HCC specific (Figure 5F‐H).
Next, the dual‐luciferase reporter gene assay results showed that IFN‐γ increased the PD‐L1 promoter activity, whereas CPI‐203 significantly inhibited PD‐L1 promoter activity in HepG2 cells, regardless of IFN‐γ stimulation (Figure 5I). This can infer that CPI‐203 has an inhibitory effect for PD‐L1 at the PD‐L1 promoter region.
3.6. CPI‐203 inhibited the BRD4 occupancy of the PD‐L1 promoter region
siRNAs that targeted BRD4 were used to investigate the role of BRD4 in regulating PD‐L1 expression in HepG2 (low expression of the PD‐L1 gene) and HepG2.2.15 (relatively high expression of the PD‐L1 gene) cell lines. When BRD4 was knocked down in HepG2 and HepG2.2.15 cell lines, the expression of PD‐L1 at mRNA level was suppressed both with or without IFN‐γ stimulation (Figure 6A‐C). In addition, when BRD4 was overexpressed in HepG2 and HepG2.2.15 cell lines, the expression of PD‐L1 at the mRNA level was increased (Figure 6D,E). Therefore, we inferred that BRD4 plays an important role in the regulation of PD‐L1 expression.
FIGURE 6.

Regulation of BRD4 in PD‐L1 gene expression. A, Gene levels of PD‐L1 in HepG2 and HepG2.2.15 cell lines were detected by qRT‐PCR. B, HepG2 cells was transfected by siRNA plasmid (siNC means negative control, siBRD4 802 and siBRD4 1379 were used for BRD4 knockdown) for 8 h, then stimulated with IFN‐γ (100 ng/mL) for 48 h. PD‐L1 mRNA was detect by qRT‐PCR. C, HepG2.2.15 was transfected with siRNA for 48 h, PD‐L1 mRNA was detect by qRT‐PCR. D, E, For BRD4 overexpression, transfection with DNA plasmid into HepG2 and HepG2.2.15 for 48 h. PD‐L1 mRNA was detect by qRT‐PCR. F, BRD4 occupation in the PD‐L1 promoter region was detected by ChIP‐qPCR in HepG2 cells when treated with IFN‐γ (100 ng/mL) or CPI‐203 (5 μmol/L) for 48 h
Next, ChIP‐qPCR was used to detect the mechanism of CPI‐203 on PD‐L1 expression. The results showed that CPI‐203 significantly downregulated the occupancy of BRD4 in the PD‐L1 promoter in HepG2 cells, whereas IFN‐γ had no significant effect on the BRD4 occupancy in the PD‐L1 promoter region (Figure 6F).
These experiments verified that even IFN–γ‐induced expression of PD‐L1 did not rely on the enrichment of BRD4 in the PD‐L1 promoter, but CPI‐203 can diminish the transcriptional activity of the PD‐L1 promoter by inhibiting BRD4 occupancy in the PD‐L1 promoter, in a non‐IFN‐dependent manner.
4. DISCUSSION
The liver is an important immune regulatory organ of the body, which adapts to the environment of antigen exposure through the development of innate immune tolerance. Continuous exposure to extrinsic antigen and active hepatitis B/C usually results in the depletion of T‐cell function. Therefore, immunotherapy can be used for the treatment of liver cancer. However, only a few patients with HCC can benefit from clinical immunotherapy. To solve this problem, we selected PD‐1 antibody to treat liver cancer in BALB/c mice in vivo. At first, no obvious antitumor effect of immunotherapy was observed when PD‐1 antibody was administrated 3 times. Possibly, immunotherapy encountered primary or acquired resistance; a previous publication has reported that the establishment of resistance relevant to immunotherapeutic failure may predate immunotherapy. 31 Next, the study showed that IFN‐γ was increased significantly in the PD‐1 antibody group, suggesting that PD‐1 antibody dose promoted the activation of T cells. But why does immunotherapy not show an antitumor effect?
IFN‐γ produced by activated tumor‐specific T cells can enhance tumor antigen presentation or direct anti‐proliferative and promoting apoptosis effects on tumor cells. 12 , 32 However, the continuous generation of IFN‐γ can lead to tumor progression 33 and immune escape. 29 , 34 , 35 For instance, IFN–γ‐induced overexpression of PD‐L1 on tumor cells that can engage with the PD‐1 receptor on T cells to suppress antitumor immunotherapy. 36 , 37 Hepatocytes isolated from healthy human liver express low levels of PD‐L1 when exposure to IFN‐γ results in the upregulation of PD‐L1, which in turn induces apoptosis of lymphocytes. 38
Programmed death ligand‐1 has been demonstrated as a predictive biomarker in previous studies; 39 , 40 however a series of clinical trials has shown that PD‐L1 may have the opposite effect when it exceeds a certain threshold, because it enables tumor cells to evade immune surveillance and also can reduce the efficacy of immunotherapy. 41 , 42 One study on liver cancer has shown that PD‐L1 is a marker of tumor aggression and is associated with poor prognosis. 5 There are constitutive and inducible forms of PD‐L1 expression. It is currently unclear whether constitutive PD‐L1 expression decreases or increases the effect of anti‐PD‐1/PD‐L1 therapy, 43 but inducible PD‐L1 may indeed result in a lack of response to cancer immunotherapy, which has been indicated as a mechanism of adaptive immune resistance. 34 Therefore, we speculated that inducible PD‐L1 in the tumor could inhibit the immunotherapeutic effects of the PD‐1 antibody. With regard to this, possibly immune resistance caused by PD‐L1 can be reversed by increasing the dosage or prolonging the duration of PD‐1 antibody. Many randomized clinical trials investigating anti‐PD‐1 therapy have shown that patients with improved progression‐free survival (PFS) or overall survival (OS) are often accompanied by a higher incidence of irAEs, consistent with prolonged exposure to PD‐1 therapy. 44 , 45 It is difficult for us to obtain a definite dosage of PD‐1 antibody from our pilot study, which can exert the immunotherapy without causing the irAEs. But the combination therapy can be used to reduce the inducible expression of PD‐L1 to avoid the occurrence of immune resistance.
CPI‐203, a small‐molecule inhibitor of BRD4, could inhibit PD‐L1 expression both in vitro and in vivo in our study, and the underlying mechanism showed that CPI‐203 inhibited BRD4 occupation in the PD‐L1 promoter region. The in vivo research showed that the immunotherapy effect of CPI‐203 through inhibiting PD‐L1 took a longer time to exert any antitumor effect, and that PD‐1 antibody did not show significant antitumor effects until 2 wk of continuous administration, while CPI‐203 combined with PD‐1 antibody exhibited a synergistic antitumor effect in the early stages of treatment. These findings seem to be beneficial for patients with advanced liver cancer, who often lose treatment opportunity because of their rapidly progressing disease.
Research also manifested that the efficacy of immunotherapy mainly depends on the activation of original T lymphocytes in tumor tissue and that inducible PD‐L1 in the tumor inhibits the PD‐1 immunotherapeutic effect. At the same time, the irAEs were monitored, the combination therapy conferred no obvious bone marrow, liver, and kidney toxicity. Additionally, no immune‐related inflammatory reactions were observed in the lung or intestinal tissues. Because of the methods for PD‐L1 detection and the complexity of immunotherapy itself, PD‐L1 is not a well defined indicator of immunotherapy, and the regulation of PD‐L1 deserves further study in the future. 46 Our studies generally concluded that PD‐L1 expression is closely related to the treatment of PD‐1 immune checkpoint inhibitors, inhibiting the induced PD‐L1 expression by combination therapy can improve the immunotherapy effect.
CONFLICT OF INTEREST
We have no conflicts of interest to declare.
Supporting information
Fig S1‐S6
Tab S1‐S3
ACKNOWLEDGMENTS
This work was financially supported by the National Natural Science Foundation of China (82073898) and major scientific and technological projects of Guangdong Province (2019B020202002) to S. Liu. S. Liu conceived the study, X. Niu designed and performed the experiments, S. Liu, X. Niu, and L. Li analyzed the data and wrote the manuscript. W. Wang and S. Li executed some experiments, X. Xu and C. Yang gave conceptual inputs.
Niu X, Wang W, Liang T, et al. CPI‐203 improves the efficacy of anti‐PD‐1 therapy by inhibiting the induced PD‐L1 overexpression in liver cancer. Cancer Sci.2022;113:28–40. doi: 10.1111/cas.15190
Niu, Wang, and Liang authors contributed equally.
Contributor Information
Lin Li, Email: li75lin@126.com.
Shuwen Liu, Email: liusw@smu.edu.cn.
REFERENCES
- 1. Sung H, Ferlay J, Siegel RL, et al. Global cancer statistics 2020: GLOBOCAN estimates of incidence and mortality worldwide for 36 cancers in 185 countries. CA Cancer J Clin. 2021;71:209‐249. [DOI] [PubMed] [Google Scholar]
- 2. Wang L, Wang FS. Clinical immunology and immunotherapy for hepatocellular carcinoma: current progress and challenges. Hepatol Int. 2019;13:521‐533. [DOI] [PubMed] [Google Scholar]
- 3. Yang JD, Hainaut P, Gores GJ, Amadou A, Plymoth A, Roberts LR. A global view of hepatocellular carcinoma: trends, risk, prevention and management. Nat Rev Gastroenterol Hepatol. 2019;16:589‐604. [DOI] [PMC free article] [PubMed] [Google Scholar]
- 4. Ohaegbulam KC, Assal A, Lazar‐Molnar E, Yao Y, Zang X. Human cancer immunotherapy with antibodies to the PD‐1 and PD‐L1 pathway. Trends Mol Med. 2015;21:24‐33. [DOI] [PMC free article] [PubMed] [Google Scholar]
- 5. Calderaro J, Rousseau B, Amaddeo G, et al. Programmed death ligand 1 expression in hepatocellular carcinoma: relationship With clinical and pathological features. Hepatology. 2016;64:2038‐2046. [DOI] [PubMed] [Google Scholar]
- 6. Finkelmeier F, Canli Ö, Tal A, et al. High levels of the soluble programmed death‐ligand (sPD‐L1) identify hepatocellular carcinoma patients with a poor prognosis. Eur J Cancer. 2016;59:152‐159. [DOI] [PubMed] [Google Scholar]
- 7. Pinter M, Jain RK, Duda DG. The current landscape of immune checkpoint blockade in hepatocellular carcinoma: a review. JAMA Oncol. 2021;7:113‐123. [DOI] [PMC free article] [PubMed] [Google Scholar]
- 8. Hamid O, Robert C, Daud A, et al. Five‐year survival outcomes for patients with advanced melanoma treated with pembrolizumab in KEYNOTE‐001. Ann Oncol. 2019;30:582‐588. [DOI] [PMC free article] [PubMed] [Google Scholar]
- 9. Brahmer JR, Govindan R, Anders RA, et al. The society for immunotherapy of cancer consensus statement on immunotherapy for the treatment of non‐small cell lung cancer (NSCLC). J Immunother Cancer. 2018;6:75. [DOI] [PMC free article] [PubMed] [Google Scholar]
- 10. Melero I, Berman DM, Aznar MA, Korman AJ, Pérez Gracia JL, Haanen J. Evolving synergistic combinations of targeted immunotherapies to combat cancer. Nat Rev Cancer. 2015;15:457‐472. [DOI] [PubMed] [Google Scholar]
- 11. Twyman‐Saint Victor C, Rech AJ, Maity A, et al. Radiation and dual checkpoint blockade activate non‐redundant immune mechanisms in cancer. Nature. 2015;520:373‐377. [DOI] [PMC free article] [PubMed] [Google Scholar]
- 12. Pardoll DM. The blockade of immune checkpoints in cancer immunotherapy. Nat Rev Cancer. 2012;12:252‐264. [DOI] [PMC free article] [PubMed] [Google Scholar]
- 13. Xu JM, Zhang Y, Jia R, et al. Anti‐PD‐1 antibody SHR‐1210 combined with apatinib for advanced hepatocellular carcinoma, gastric, or esophagogastric junction cancer: an open‐label, dose escalation and expansion study. Clin Cancer Res. 2019;25:515‐523. [DOI] [PubMed] [Google Scholar]
- 14. Yau T, Kang YK, Kim TY, et al. Efficacy and safety of nivolumab plus ipilimumab in patients with advanced hepatocellular carcinoma previously treated with sorafenib: the CheckMate 040 randomized clinical trial. JAMA Oncol. 2020;6:e204564. [DOI] [PMC free article] [PubMed] [Google Scholar]
- 15. Larkin J, Chiarion‐Sileni V, Gonzalez R, et al. Five‐year survival with combined nivolumab and ipilimumab in advanced melanoma. N Engl J Med. 2019;381:1535‐1546. [DOI] [PubMed] [Google Scholar]
- 16. Luoma AM, Suo S, Williams HL, et al. Molecular pathways of colon inflammation induced by cancer immunotherapy. Cell. 2020;182:655‐671. [DOI] [PMC free article] [PubMed] [Google Scholar]
- 17. Im SJ, Hashimoto M, Gerner MY, et al. Defining CD8(+) T cells that provide the proliferative burst after PD‐1 therapy. Nature. 2016;537:417‐421. [DOI] [PMC free article] [PubMed] [Google Scholar]
- 18. Nagao M, Nakajima Y, Kanehiro H, et al. The impact of interferon gamma receptor expression on the mechanism of escape from host immune surveillance in hepatocellular carcinoma. Hepatology. 2000;32:491‐500. [DOI] [PubMed] [Google Scholar]
- 19. Ikeda H, Old LJ, Schreiber RD. The roles of IFN gamma in protection against tumor development and cancer immunoediting. Cytokine Growth Factor Rev. 2002;13:95‐109. [DOI] [PubMed] [Google Scholar]
- 20. Mandai M, Hamanishi J, Abiko K, Matsumura N, Baba T, Konishi I. Dual faces of IFNγ in cancer progression: a role of PD‐L1 induction in the determination of pro‐ and antitumor immunity. Clin Cancer Res. 2016;22:2329‐2334. [DOI] [PubMed] [Google Scholar]
- 21. Taube JM, Anders RA, Young GD, et al. Colocalization of inflammatory response with B7–h1 expression in human melanocytic lesions supports an adaptive resistance mechanism of immune escape. Sci Transl Med. 2012;4:127‐137. [DOI] [PMC free article] [PubMed] [Google Scholar]
- 22. Hogg SJ, Beavis PA, Dawson MA, Johnstone RW. Targeting the epigenetic regulation of antitumour immunity. Nat Rev Drug Discov. 2020;19:776‐800. [DOI] [PubMed] [Google Scholar]
- 23. Belkina AC, Denis GV. BET domain co‐regulators in obesity, inflammation and cancer. Nat Rev Cancer. 2012;12:465‐477. [DOI] [PMC free article] [PubMed] [Google Scholar]
- 24. Zhang P, Dong Z, Cai J, et al. BRD4 promotes tumor growth and epithelial‐mesenchymal transition in hepatocellular carcinoma. Int J Immunopathol Pharmacol. 2015;28:36‐44. [DOI] [PubMed] [Google Scholar]
- 25. Devaiah BN, Lewis BA, Cherman N, et al. BRD4 is an atypical kinase that phosphorylates Serine2 of the RNA Polymerase II carboxy‐terminal domain. Proc Natl Acad Sci USA. 2012;109:6927‐6932. [DOI] [PMC free article] [PubMed] [Google Scholar]
- 26. Filippakopoulos P, Knapp S. Targeting bromodomains: epigenetic readers of lysine acetylation. Nat Rev Drug Discov. 2014;13:337‐356. [DOI] [PubMed] [Google Scholar]
- 27. Zhu H, Bengsch F, Svoronos N, et al. BET bromodomain inhibition promotes anti‐tumor immunity by suppressing PD‐L1 expression. Cell Rep. 2016;16:2829‐2837. [DOI] [PMC free article] [PubMed] [Google Scholar]
- 28. Hogg SJ, Vervoort SJ, Deswal S, et al. BET‐bromodomain inhibitors engage the host immune system and regulate expression of the immune checkpoint ligand PD‐L1. Cell Rep. 2017;18:2162‐2174. [DOI] [PMC free article] [PubMed] [Google Scholar]
- 29. Cha JH, Chan LC, Li CW, Hsu JL, Hung MC. Mechanisms controlling PD‐L1 expression in cancer. Mol Cell. 2019;76:359‐370. [DOI] [PMC free article] [PubMed] [Google Scholar]
- 30. Xue W, Li W, Zhang T, et al. Anti‐PD1 up‐regulates PD‐L1 expression and inhibits T‐cell lymphoma progression: possible involvement of an IFN‐gamma‐associated JAK‐STAT pathway. Onco Targets Ther. 2019;12:2079‐2088. [DOI] [PMC free article] [PubMed] [Google Scholar]
- 31. Yao H, Wang H, Li C, Fang JY, Xu J. Cancer cell‐intrinsic PD‐1 and implications in combinatorial immunotherapy. Front Immunol. 2018;9:1774. [DOI] [PMC free article] [PubMed] [Google Scholar]
- 32. Ribas A. Adaptive immune resistance: how cancer protects from immune attack. Cancer Discov. 2015;5:915‐919. [DOI] [PMC free article] [PubMed] [Google Scholar]
- 33. Alberts DS, Marth C, Alvarez RD, et al. Randomized phase 3 trial of interferon gamma‐1b plus standard carboplatin/paclitaxel versus carboplatin/paclitaxel alone for first‐line treatment of advanced ovarian and primary peritoneal carcinomas: results from a prospectively designed analysis of progression‐free survival. Gynecol Oncol. 2008;109:174‐181. [DOI] [PubMed] [Google Scholar]
- 34. Sharma P, Hu‐Lieskovan S, Wargo JA, Ribas A. Primary, adaptive, and acquired resistance to cancer immunotherapy. Cell. 2017;168:707‐723. [DOI] [PMC free article] [PubMed] [Google Scholar]
- 35. Benci JL, Xu B, Qiu Y, et al. Tumor interferon signaling regulates a multigenic resistance program to immune checkpoint blockade. Cell. 2016;167:1540‐1554. [DOI] [PMC free article] [PubMed] [Google Scholar]
- 36. Diskin B, Adam S, Cassini MF, et al. PD‐L1 engagement on T cells promotes self‐tolerance and suppression of neighboring macrophages and effector T cells in cancer. Nat Immunol. 2020;21:442‐454. [DOI] [PubMed] [Google Scholar]
- 37. Chen L. Co‐inhibitory molecules of the B7‐CD28 family in the control of T‐cell immunity. Nat Rev Immunol. 2004;4:336‐347. [DOI] [PubMed] [Google Scholar]
- 38. Muhlbauer M, Fleck M, Schutz C, et al. PD‐L1 is induced in hepatocytes by viral infection and by interferon‐alpha and ‐gamma and mediates T cell apoptosis. J Hepatol. 2006;45:520‐528. [DOI] [PubMed] [Google Scholar]
- 39. Topalian SL, Hodi FS, Brahmer JR, et al. Safety, activity, and immune correlates of Anti‐PD‐1 antibody in cancer. N Engl J Med. 2012;366:2443‐2454. [DOI] [PMC free article] [PubMed] [Google Scholar]
- 40. Herbst RS, Soria JC, Kowanetz M, et al. Predictive correlates of response to the anti‐PD‐L1 antibody MPDL3280A in cancer patients. Nature. 2014;515:563‐567. [DOI] [PMC free article] [PubMed] [Google Scholar]
- 41. Blank C, Gajewski TF, Mackensen A. Interaction of PD‐L1 on tumor cells with PD‐1 on tumor‐specific T cells as a mechanism of immune evasion: implications for tumor immunotherapy. Cancer Immunol Immunother. 2005;54:307‐314. [DOI] [PMC free article] [PubMed] [Google Scholar]
- 42. Wang GZ, Zhang L, Zhao XC, et al. The Aryl hydrocarbon receptor mediates tobacco‐induced PD‐L1 expression and is associated with response to immunotherapy. Nat Commun. 2019;10:1125. [DOI] [PMC free article] [PubMed] [Google Scholar]
- 43. Qian J, Wang C, Wang B, et al. The IFN‐γ/PD‐L1 axis between T cells and tumor microenvironment: hints for glioma anti‐PD‐1/PD‐L1 therapy. J Neuroinflammation. 2018;15:290. [DOI] [PMC free article] [PubMed] [Google Scholar]
- 44. Gong J, Chehrazi‐Raffle A, Reddi S, Salgia R. Development of PD‐1 and PD‐L1 inhibitors as a form of cancer immunotherapy: a comprehensive review of registration trials and future considerations. J Immunother Cancer. 2018;6:8. [DOI] [PMC free article] [PubMed] [Google Scholar]
- 45. Naidoo J, Wang X, Woo KM, et al. Pneumonitis in patients treated with anti‐programmed death‐1/programmed death ligand 1 therapy. J Clin Oncol. 2017;35:709‐717. [DOI] [PMC free article] [PubMed] [Google Scholar]
- 46. Patel SP, Kurzrock R. PD‐L1 expression as a predictive biomarker in cancer immunotherapy. Mol Cancer Ther. 2015;14:847‐856. [DOI] [PubMed] [Google Scholar]
Associated Data
This section collects any data citations, data availability statements, or supplementary materials included in this article.
Supplementary Materials
Fig S1‐S6
Tab S1‐S3