

Abstract
T‐cell memory is an important mechanism for long‐term protection against diverse pathogens. Generation and persistence of memory T cells are vital components of anti‐tumor immunity, given their ability to persist for prolonged durations, as well as activate and migrate rapidly. In the present study, we investigated the clinical and prognostic significance of T‐cell subsets in the peripheral circulation of patients with head and neck squamous cell carcinoma (HNSCC). Moreover, we calculated the enrichment scores of T‐cell subsets in primary tumor tissues and compared their clinical characteristics using a public database. Multivariate survival analyses of circulating T‐cell parameters revealed that clinical parameters, except M factor, were not independent prognostic factors, whereas proportions of CD8+ T cells, naïve T cells (TNs), effector memory T cells (TEMs), and CD38+CD8+ T cells were independent prognostic factors, suggesting the importance of these peripheral T‐cell parameters as independent prognostic biomarkers. Consistent with these results, the T‐cell enrichment analysis indicated that enrichment of CD8+ TNs in the tumor microenvironment was an independent prognostic factor. Moreover, an ex vivo experiment demonstrated significantly less cytotoxic activity in CD38+ T cells than in CD38− T cells. These findings suggest that T‐cell memory‐related parameters in both systemic immunity and the tumor microenvironment could be used as prognostic biomarkers regardless of clinical characteristics. Further characterization of circulating T cells would lead to the development of novel biomarkers for patients with HNSCC.
Keywords: cancer immunology, head and neck squamous cell carcinoma, peripheral blood mononuclear cell, T‐cell memory, tumor‐infiltrating lymphocyte
This study demonstrated that the proportion of circulating CD8+ T cells, naïve T cells, and effector memory T cells were independent prognostic factors in patients with HNSCC. Moreover, CD38 expression on circulating T cells correlated with an unfavorable prognosis.
Abbreviations
- DFS
disease‐free survival
- HNSCC
head neck squamous cell carcinoma
- HPV
human papillomavirus
- OS
overall survival
- TCGA
The Cancer Genome Atlas
- TCMs
central memory T cells
- TEFFs
effector T cells
- TEMs
effector memory T cells
- TIL
tumor‐infiltrating lymphocytes
- TNs
naïve T cells
- Tregs
regulatory T cells
1. INTRODUCTION
In the tumor microenvironment (TME), various stromal cells, such as immune cells, fibroblasts, mast cells, and vascular endothelial cells, are known to exist and interact with tumor cells. 1 , 2 Among immune cells, TILs, especially CD8+ CTLs, play pivotal roles in anti‐tumor immunity. 3 , 4 To escape from CTL‐mediated anti‐tumor immunity, tumor cells orchestrate immunosuppression by inducing dysfunction and exhaustion of CTLs, infiltration and activation of immunosuppressive cell types such as regulatory Tregs, tumor‐associated macrophages, and myeloid‐derived suppressor cells. 5 , 6 , 7 Cancer immunotherapies have been developed to induce efficient tumor eradication by targeting the interaction between immune and tumor cells. In addition, recent advances in immune checkpoint inhibitors (ICIs) have provided additional treatment options for various cancers, including HNSCC. 8 , 9 , 10 Anti‐PD‐1 antibodies targeting the programmed cell death 1/programmed cell death ligand 1 (PD‐1/PD‐L1) axis have been used to treat recurrent or metastatic HNSCC. However, only 20%‐30% of patients have benefitted from these therapies. To improve the efficacy of ICIs, crucial immunological parameters involved in the TME and systemic immunity need to be identified in patients with cancer.
T‐cell memory is an important mechanism for long‐term protection against diverse pathogens, including tumor antigens. 11 , 12 Antigen‐specific memory T cells are generated in response to pathogens and activated following pathogen re‐exposure. Unlike infectious diseases, cancer is a chronic disease, and a long‐lived immune response is required for tumor eradication by the host immunity. 13 Therefore, the generation and persistence of anti‐tumor memory T cells are vital features of anti‐tumor immunity, given their ability to persist for prolonged durations, as well as activate and migrate rapidly. Previous reports, including our investigation, have reported dynamic population changes in the peripheral circulation of patients with HNSCC. 14 , 15 , 16 In patients with HNSCC, a population shift from naïve T cells to effector memory T cells was observed when compared with healthy donors, suggesting the generation of anti‐tumor T cell memory. However, the clinical and prognostic values of increased memory T cells in the peripheral circulation remain elusive in patients with HNSCC.
Based on these findings, in the present study, we investigated the clinical and prognostic significance of T‐cell subsets in the peripheral circulation of patients with HNSCC. Moreover, we calculated the enrichment scores of T‐cell subsets in primary tumor tissues and compared them with clinical characteristics using a public database.
2. MATERIALS AND METHODS
2.1. Patients for flow cytometric analysis
Peripheral blood samples were collected from patients with HNSCC who were newly diagnosed and treated at Gunma University Hospital (Maebashi, Japan) between December 2012 and October 2015. Patients with a history of other malignant tumors, autoimmune diseases, infectious diseases, or hematologic diseases, as well as those receiving immunomodulatory drugs, were excluded. Finally, 62 patients were enrolled, including 6 patients with human papillomavirus (HPV)‐positive tumors, 52 patients with HPV‐negative tumors, and 4 patients without HPV‐related information (Table S1). Blood samples were collected before treatment initiation. Clinical information, including HPV status (p16 positivity), primary lesion, T factor, N factor, M factor, and TNM stage, were obtained from electronic medical records. TNM stage classification was based on the 7th edition of the International System for Staging adopted by the American Joint Committee on Cancer and the Union for International Cancer Control. The present study was approved by the Institutional Review Board of Gunma University (No. 12‐12) and was performed in accordance with the newest version of the Declaration of Helsinki. Written informed consent was obtained from all patients.
2.2. Flow cytometry
PBMCs were isolated by density gradient centrifugation using Ficoll‐Paque PLUS (GE Healthcare). Non‐specific binding of antibodies to Fc receptors was blocked using BD Fc Block™ (BD Bioscience). PBMCs were then stained with fluorescently labeled anti‐human monoclonal antibodies against CD3 (SK7), CD4 (RPA‐T4), CD8 (RPA‐T8), CD45RO (UCHL1), CD25 (M‐A251), CD62L (DREG‐56), CD127 (eBioRDR5), and CD38 (HIT2). Alternatively, PBMCs were stained with immunoglobulin isotype‐matched controls for CD38 expression. The antibodies used in the present study are listed in Table S2. Staining was performed at 4°C for 60 min, protected from light, in phosphate‐buffered saline with 1% heat‐inactivated fetal calf serum (Thermo Fisher Scientific) and 0.1% sodium azide (Sigma‐Aldrich). After staining, samples were immediately analyzed by flow cytometry using an Attune® acoustic focusing cytometer (Thermo Fisher Scientific). The acquired data were analyzed using FlowJo software (TreeStar).
2.3. Magnetic cell isolation and measurement of cytokine production
PBMCs obtained from patients with HNSCC were stained with biotin‐conjugated anti‐human CD38 monoclonal antibody (HIT2, BioLegend), followed by magnetic cell isolation of CD38+ cells using the EasySep Human Biotin Positive Selection Kit II (STEMCELL Technologies) in accordance with the manufacturer's instruction. CD38+ and CD38− cells (1 × 10⁵) were separately plated into 96‐well plates with Cell Activation Cocktail with Brefeldin A (BioLegend) and incubated for 8 h. Cells were then stained with fluorescently labeled anti‐human monoclonal antibodies against CD3 (SK7), CD4 (RPA‐T4), CD8 (RPA‐T8), granzyme B (GzmB, QA16A02, BioLegend), and interferon γ (IFNγ, B27, BioLegend). Intracellular staining for GzmB and IFNγ was performed using the eBioscience™ Foxp3/Transcription Factor Staining Buffer Set (Thermo Fisher Scientific). Stained samples were analyzed using an Attune® acoustic focusing cytometer and the data were analyzed using FlowJo software as described above.
2.4. TCGA data analysis
RNA‐sequencing data (Illumina HiSeq RNA‐seq V2, raw counts, and normalized counts) and clinical data were obtained from TCGA Research Network (TCGA Provisional version updated in 2016, http://cancergenome.nih.gov/). In total, 520 cases, comprising 97 HPV‐positive HNSCC and 423 HPV‐negative HNSCC cases, were analyzed.
2.5. Cell‐type enrichment analysis
We performed cell‐type enrichment analysis to evaluate the enrichment of T‐cell subsets in tumor tissues of TCGA dataset using the xCell tool. 17 Enrichment scores were calculated using the xCell R package, version 1.1.0. The calculated scores were visualized using the pheatmap R package, version 1.10.12.
2.6. Statistical analysis
Data were analyzed using GraphPad Prism version 8 (GraphPad Software, Inc) and R (version 4.0.3; The R Foundation for Statistical Computing) in combination with R studio version 1.3.1093 (R studio). Student t test and one‐way ANOVA for multiple pairwise testing were used to compare continuous variables between groups. Two‐sided P‐values < .05 were considered statistically significant. Survival curves were calculated using the Kaplan‐Meier method and compared using the log‐rank test. Receiver operating characteristic curves were plotted separately for survival analyses to verify the optimal cut‐off point for continuous variables. Multivariate regression analysis was performed using the Cox proportional hazards model. Variables were included in multivariate analyses when P‐values were < .05 in univariate analyses.
3. RESULTS
3.1. Relationship between T‐cell proportions and clinical parameters
Based on the acquired flow cytometry data, the proportion of T‐cell subsets and the expression of CD38 were analyzed in 62 patients with HNSCC, as previously reported. 15 In brief, CD8+ T cells were gated based on the expression of CD3 and CD8, and then divided into 4 subsets based on the expression of CD45RO and CD62L: naïve T cells (TN, CD45RO−CD62L+), central memory T cells (TCM, CD45RO+CD62L+), effector memory T cells (TEM, CD45RO+CD62L−), and effector T cells (TEFF, CD45RO−CD62L−). CD4+ T cells were gated based on the expression of CD3 and CD4, and Tregs were identified based on the expression of CD25 and the lack of CD127. The expression of CD38 was analyzed in both total CD4+ and CD8+ T cells. These results were compared statistically with clinical data including HPV status, primary lesion, T factor, N factor, M factor, and TNM stage (Table 1). The proportions of CD8+ T cells and TEMs were higher in patients with HPV‐positive HNSCC than in patients with HPV‐negative HNSCC. The proportion of TEM was highest among primary lesions in patients with oropharyngeal cancer. The proportion of TEFF correlated with later T factors and later TNM stages. The proportion of TCM was higher in M1 than in M0.
TABLE 1.
Relationship between T‐cell proportions and clinical parameters in 62 patients with HNSCC
| Variables | %T cells | %CD8+/T cells | %CD38+/CD8 | %TN/CD8 | %TCM/CD8 | %TEM/CD8 | %TEFF/CD8 | %CD4+/T cells | %CD38+/CD4 | %Treg/CD4 |
|---|---|---|---|---|---|---|---|---|---|---|
| Mean (SE) | Mean (SE) | Mean (SE) | Mean (SE) | Mean (SE) | Mean (SE) | Mean (SE) | Mean (SE) | Mean (SE) | Mean (SE) | |
| HPV status | ||||||||||
| Negative | 68.18 (1.39) | 20.72 (1.14) | 25.30 (1.88) | 10.20 (1.23) | 9.25 (0.91) | 50.47 (1.92) | 30.09 (2.08) | 46.74 (1.27) | 43.15 (1.81) | 4.69 (0.21) |
| Positive | 73.90 (5.49) | 30.67 (6.18) | 21.54 (4.98) | 7.44 (4.45) | 8.31 (2.00) | 65.60 (5.28) | 18.66 (3.56) | 46.68 (4.64) | 37.02 (6.13) | 4.47 (0.39) |
| P‐value | .21 | .01 | .52 | .48 | .74 | .01 | .07 | .99 | .29 | .74 |
| Primary lesion | ||||||||||
| Hypopharynx | 69.2 (3.12) | 19.85 (2.04) | 28.58 (4.63) | 12.72 (3.70) | 6.72 (1.43) | 44.24 (4.72) | 36.35 (5.37) | 48.13 (2.74) | 44.22 (5.99) | 4.57 (0.49) |
| Larynx | 67.87 (2.16) | 22.14 (2.00) | 23.06 (3.02) | 7.70 (1.50) | 12.24 (1.70) | 54.72 (2.71) | 25.35 (2.87) | 44.25 (1.90) | 41.57 (2.62) | 4.94 (0.37) |
| Oral cavity | 66.33 (2.40) | 19.13 (2.49) | 24.17 (4.67) | 12.72 (3.41) | 7.85 (1.72) | 44.96 (4.43) | 34.47 (5.57) | 45.77 (3.20) | 43.45 (4.40) | 4.17 (0.46) |
| Oropharynx | 70.82 (3.60) | 26.70 (3.32) | 23.04 (2.91) | 5.92 (2.28) | 8.70 (1.23) | 63.40 (2.98) | 21.98 (2.84) | 45.29 (3.31) | 38.38 (3.88) | 4.56 (0.26) |
| Paranasal cavity | 66.24 (5.28) | 18.95 (3.38) | 26.09 (4.38) | 12.03 (2.47) | 6.02 (1.07) | 48.86 (4.74) | 33.10 (4.58) | 50.37 (2.53) | 44.36 (2.02) | 4.54 (0.50) |
| P‐value | .85 | .25 | .84 | .19 | .06 | .003 | .06 | .60 | .82 | .74 |
| T factor | ||||||||||
| T1‐2 | 66.21 (2.19) | 21.09 (1.41) | 22.82 (2.98) | 9.38 (1.98) | 10.77 (1.43) | 56.16 (2.88) | 23.69 (2.64) | 44.14 (2.06) | 41.23 (3.14) | 4.58 (0.28) |
| T3‐4 | 69.67 (1.70) | 22.42 (1.79) | 25.58 (1.95) | 9.47 (1.38) | 8.13 (0.91) | 50.22 (2.29) | 32.19 (2.45) | 47.31 (1.45) | 42.44 (1.94) | 4.66 (0.25) |
| P‐value | .21 | .59 | .42 | .97 | .11 | .11 | .02 | .20 | .73 | .82 |
| N factor | ||||||||||
| Negative | 68.16 (1.92) | 22.74 (1.53) | 24.16 (2.25) | 7.75 (1.22) | 9.53 (1.19) | 54.10 (2.21) | 28.61 (2.65) | 44.50 (1.57) | 39.50 (1.94) | 4.67 (0.24) |
| Positive | 68.40 (1.92) | 20.84 (1.91) | 24.84 (2.53) | 11.48 (2.00) | 8.78 (1.04) | 50.81 (3.01) | 28.96 (1.65) | 47.89 (1.83) | 44.92 (2.88) | 4.58 (0.30) |
| P‐value | .93 | .43 | .84 | .10 | .64 | .37 | .93 | .16 | .11 | .80 |
| M factor | ||||||||||
| M0 | 68.38 (1.37) | 21.83 (1.22) | 24.56 (1.69) | 9.43 (1.56) | 8.99 (0.79) | 52.62 (1.85) | 28.97 (1.89) | 46.19 (1.21) | 42.11 (1.72) | 4.63 (0.19) |
| M1 | 61.90 (0.00) | 25.30 (0.00) | 18.80 (0.00) | 9.92 (0.00) | 21.90 (0.00) | 52.00 (0.00) | 16.20 (0.00) | 36.50 (0.00) | 32.00 (0.00) | 4.56 (0.00) |
| P‐value | .55 | .72 | .67 | .96 | .04 | .97 | .39 | .32 | .46 | .96 |
| TNM stage | ||||||||||
| I‐II | 67.14 (2.84) | 21.68 (1.64) | 20.63 (2.95) | 8.69 (2.08) | 11.85 (1.89) | 57.84 (2.90) | 21.61 (2.86) | 43.42 (2.68) | 38.42 (3.40) | 4.66 (0.39) |
| III‐IV | 68.66 (1.55) | 21.95 (1.53) | 25.80 (1.98) | 9.69 (1.36) | 8.27 (0.83) | 50.80 (2.19) | 31.26 (2.21) | 46.94 (1.32) | 43.18 (1.95) | 4.62 (0.21) |
| P‐value | .63 | .92 | .18 | .70 | .05 | .09 | .02 | .20 | .22 | .92 |
Abbreviations: HNSCC, head and neck squamous cell carcinoma; HPV, human papillomavirus; SE, standard error; TCM, central memory T cell; TEFF, effector T cell; TEM, effector memory T cell; TN, naïve T cell; Treg, regulatory T cell.
3.2. The proportions of T‐cell subsets were independent prognostic factors
We performed both univariate and multivariate survival analyses to investigate the prognostic significance of peripheral T‐cell subsets in 62 patients with HNSCC. Univariate survival analyses revealed that an increased proportion of CD8+ T cells and TEMs was a favorable prognostic factor for both DFS and OS, as shown in Figure 1A,B. In contrast, the proportion of CD38+ cells in CD8+ T cells, TNs, CD38+ cells in CD4+ T cells, and Tregs were unfavorable prognostic factors for DFS (Figure 1A). In addition, the increased proportions of total T cells, CD38+ cells in CD8+ T cells, and CD38+ cells in CD4+ T cells were unfavorable prognostic factors for OS (Figure 1B). Subsequent multivariate regression analysis indicated that the M factor, the proportion of CD8+ T cells, CD38+ cells in CD8+ T cells, and TNs were independent prognostic factors for DFS, whereas the proportion of TEMs was an independent prognostic factor for OS (Table 2).
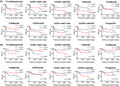
FIGURE 1.
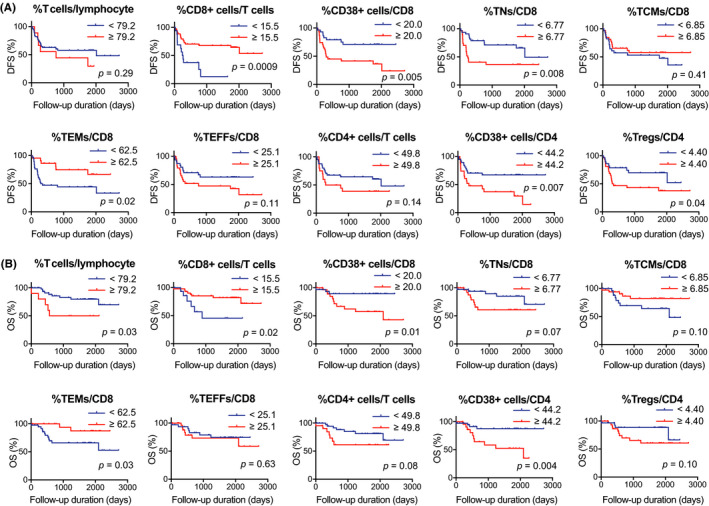
Univariate survival analyses based on circulating T‐cell parameters. A and B, Kaplan‐Meier survival curves based on proportions of T cells, CD8+ cells, CD38+ cells, TNs, TCMs, TEMs, TEFF, CD4+ cells, and Tregs in 62 patients with head and neck squamous cell carcinoma. A, Survival curves for DFS. B, Survival curves for OS. DFS, disease‐free survival; OS, overall survival; TCMs, central memory T cells; TEFF, effector T cells; TEMs, effector memory T cells; TNs, naïve T cells; Tregs, regulatory T cells
TABLE 2.
Univariate and multivariate survival analyses of OS and DFS in 62 patients with HNSCC
| Variables | Disease‐free survival | Overall survival | ||||
|---|---|---|---|---|---|---|
| Univariate | Multivariate | Univariate | Multivariate | |||
| P‐value | HR (95% CI) | P‐value | P‐value | HR (95% CI) | P‐value | |
| HPV status | ||||||
| Negative | .97 | .85 | ||||
| Positive | ||||||
| Primary lesion | ||||||
| Hypopharynx | .007 | 1 | .08 | |||
| Larynx | 0.52 (0.22‐1.20) | .13 | ||||
| Oral cavity | 0.70 (0.19‐2.59) | .59 | ||||
| Oropharynx | 1.00 (0.40‐2.50) | .99 | ||||
| Paranasal cavity | 0.80 (0.32‐2.01) | .64 | ||||
| T factor | ||||||
| T1‐2 | .007 | 1 | .36 | .02 | 1 | .84 |
| T3‐4 | 0.64 (0.25‐1.65) | 0.85 (0.17‐4.17) | ||||
| N factor | ||||||
| Negative | .01 | 1 | .19 | .17 | ||
| Positive | 0.60 (0.29‐1.28) | |||||
| M factor | ||||||
| M0 | <.0001 | 1 | .0004 | .90 | ||
| M1 | 137.5 (8.60‐2197.60) | |||||
| TNM stage | ||||||
| I‐II | <.0001 | 1 | .53 | .007 | 1 | 1.00 |
| III‐IV | 6.74 (6.61E‐06‐6.88E+18) | 7.15E+08 (0‐Inf) | ||||
| %T cells/lymphocyte | ||||||
| <79.2 | .29 | .03 | 1 | .12 | ||
| ≥79.2 | 3.02 (0.74‐12.36) | |||||
| %CD8+ cells/T cells | 1 | |||||
| <15.5 | .0009 | 1 | .03 | .02 | 0.26 (0.07‐1.01) | .05 |
| ≥15.5 | 0.43 (0.20‐0.94) | |||||
| %CD38+ cells/CD8 | ||||||
| <20.0 | .005 | 1 | .03 | .01 | 1 | .36 |
| ≥20.0 | 2.49 (1.10‐5.64) | 1.89 (0.48‐7.51) | ||||
| %TN/CD8 | ||||||
| <6.77 | .008 | 1 | .003 | .07 | ||
| ≥6.77 | 3.49 (1.52‐8.03) | |||||
| %TCM/CD8 | ||||||
| <6.85 | .41 | .10 | ||||
| ≥6.85 | ||||||
| %TEM/CD8 | ||||||
| <62.5 | .02 | 1 | .67 | .03 | 1 | .03 |
| ≥62.5 | 0.81 (0.32‐2.09) | 0.18 (0.04‐0.89) | ||||
| %TEFF/CD8 | ||||||
| <25.1 | .11 | .63 | ||||
| ≥25.1 | ||||||
| %CD4+ cells/T cells | ||||||
| <49.8 | .14 | .08 | ||||
| ≥49.8 | ||||||
| %CD38+ cells/CD4 | ||||||
| <44.2 | .007 | 1 | .13 | .004 | 1 | .07 |
| ≥44.2 | 1.77 (0.84‐3.74) | 3.06 (0.90‐10.43) | ||||
| %Tregs/CD4 | ||||||
| <4.4 | .04 | 1 | .67 | .10 | ||
| ≥4.4 | 1.19 (0.53‐2.69) | |||||
Abbreviations: CI, confidence interval; DFS, disease‐free survival; HNSCC, head and neck squamous cell carcinoma; HPV, human papillomavirus; HR, hazard ratio; OS, overall survival; TCM, central memory T cell; TEFF, effector T cell; TEM, effector memory T cell; TN, naïve T cell.
3.3. Relationship between T‐cell enrichments and clinical parameters
T‐cell enrichment scores were calculated using the xCell tool (Figure 2A). The enrichment scores were then compared with clinical parameters. As shown in Table 3, the scores of CD4+ T cells, Th1 cells, Th2 cells, CD8+ T cells, CD8+ TN, CD8+ TCM, and CD8+ TEM significantly correlated with some clinical parameters, whereas no correlation was observed between Treg scores and clinical parameters.
FIGURE 2.
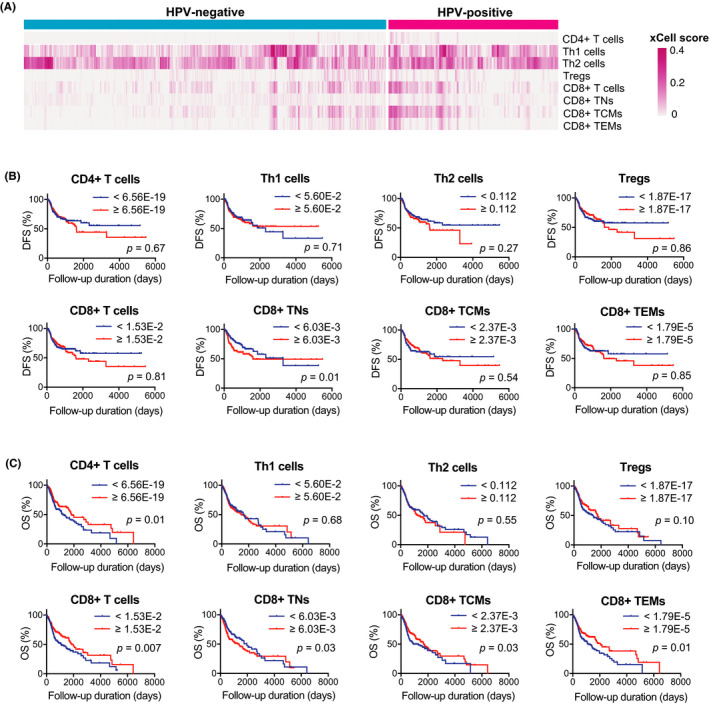
Univariate survival analyses based on enrichment scores of T‐cell subsets. A, Heat map of enrichment scores of T‐cell subsets calculated using xCell tool in 97 HPV‐positive HNSCCs and 423 HPV‐negative HNSCCs obtained from TCGA database. B and C, Kaplan‐Meier survival curves based on enrichment scores of CD4+ T cells, Th1 cells, Th2 cells, Tregs, CD8+ T cells, CD8+ TNs, CD8+ TCMs, and CD8+ TEMs. B, Survival curves for DFS. C, Survival curves for OS. DFS, disease‐free survival; HNSCC, head neck squamous cell carcinoma; HPV, human papillomavirus; OS, overall survival; TCGA, The Cancer Genome Atlas; TCMs, central memory T cells; TEMs, effector memory T cells; TNs, naïve T cells; Tregs, regulatory T cells
TABLE 3.
Relationship between T‐cell enrichment scores and clinical parameters in 520 patients with HNSCC
| Variables | CD4+ T cells | Th1 cells | Th2 cells | Tregs | CD8+ T cells | CD8+ TN | CD8+ TCM | CD8+ TEM |
|---|---|---|---|---|---|---|---|---|
| Mean (SE) ×10−3 | Mean (SE) ×10−3 | Mean (SE) ×10−3 | Mean (SE) ×10−3 | Mean (SE) ×10−3 | Mean (SE) ×10−3 | Mean (SE) ×10−3 | Mean (SE) ×10−3 | |
| HPV status | ||||||||
| Negative | 1.32 (0.199) | 69.7 (3.53) | 114 (3.64) | 7.98 (0.731) | 23.5 (1.53) | 9.55 (0.443) | 18.3 (1.43) | 8.06 (0.797) |
| Positive | 4.82 (1.22) | 91.9 (7.76) | 131 (6.35) | 8.33 (1.55) | 36.6 (4.95) | 11.3 (1.25) | 45.2 (5.66) | 14.15 (2.96) |
| P‐value | <.0001 | .007 | .04 | .84 | .001 | .11 | <.0001 | .006 |
| Primary lesion | ||||||||
| Hypopharynx | 1.15 (0.775) | 128 (30.4) | 107 (23.9) | 7.35 (4.46) | 21.6 (15.4) | 10.1 (4.16) | 25.4 (16.7) | 13.0 (10.5) |
| Larynx | 1.49 (0.503) | 51.6 (4.34) | 115 (6.38) | 5.32 (1.07) | 12.6 (1.93) | 5.81 (0.668) | 13.6 (1.94) | 4.01 (0.949) |
| Oral cavity | 1.66 (0.321) | 75.9 (4.12) | 115 (4.03) | 8.96 (0.849) | 27.8 (1.86) | 11.1 (0.529) | 21.4 (1.85) | 9.24 (0.956) |
| Oropharynx | 6.10 (1.66) | 105 (12.2) | 142 (8.75) | 8.07 (2.48) | 48.3 (8.18) | 10.5 (1.72) | 64.0 (8.86) | 21.9 (5.44) |
| P‐value | .0002 | <.0001 | .13 | .16 | <.0001 | <.0001 | <.0001 | <.0001 |
| T factor | ||||||||
| T1‐2 | 2.75 (0.588) | 74.0 (5.36) | 113 (5.07) | 8.73 (1.09) | 32.7 (2.75) | 10.2 (0.689) | 29.8 (2.94) | 11.4 (1.51) |
| T3‐4 | 1.45 (0.260) | 73.8 (4.03) | 119 (4.12) | 7.58 (0.826) | 21.4 (1.80) | 9.69 (0.55) | 18.9 (1.84) | 7.68 (1.00) |
| P‐value | .03 | .97 | .38 | .39 | .0004 | .59 | .0009 | .03 |
| N factor | ||||||||
| Negative | 1.36 (0.261) | 63.7 (4.16) | 112 (4.60) | 7.44 (0.940) | 26.8 (2.43) | 8.86 (0.616) | 22.1 (2.34) | 8.65 (1.20) |
| Positive | 2.20 (0.450) | 75.7 (4.53) | 122 (4.57) | 8.40 (0.931) | 24.5 (2.09) | 10.7 (0.609) | 22.8 (2.30) | 8.70 (1.17) |
| P‐value | .13 | .06 | .11 | .47 | .49 | .04 | .84 | .98 |
| M factor | ||||||||
| M0 | 2.00 (0.291) | 73.4 (3.30) | 116 (3.23) | 8.09 (0.665) | 26.2 (1.59) | 9.79 (0.438) | 23.5 (1.65) | 9.23 (0.868) |
| M1 | 3.05E‐16 (2.21E‐16) | 70.7 (2.72) | 134 (15.3) | 1.47 (1.47) | 3.42 (2.22) | 6.23 (3.06) | 6.53 (2.79) | 1.06 (1.04) |
| P‐value | .50 | .94 | .57 | .32 | .15 | .42 | .31 | .35 |
| TNM stage | ||||||||
| I‐II | 1.85 (0.439) | 69.9 (6.86) | 111 (6.14) | 9.23 (1.48) | 33.5 (3.64) | 9.82 (0.961) | 27.8 (3.57) | 11.5 (2.00) |
| III‐IV | 2.01 (0.342) | 75.0 (3.67) | 118 (3.71) | 7.72 (0.738) | 23.9 (1.71) | 9.90 (0.480) | 22.1 (1.83) | 8.56 (0.943) |
| P‐value | .81 | .52 | .31 | .35 | .01 | .94 | .15 | .15 |
Abbreviations: HNSCC, head and neck squamous cell carcinoma; HPV, human papillomavirus; SE, standard error; TCM, central memory T cell; TEM, effector memory T cell; TN, naïve T cell; Tregs, regulatory T cells.
3.4. The enrichment of CD8+ TNs was an unfavorable prognostic factor
We performed both univariate and multivariate survival analyses to investigate the prognostic significance of the T‐cell enrichment in TCGA cohort. Univariate survival analyses revealed that the enrichment of CD8+ TNs was an unfavorable prognostic factor for both DFS and OS (Figure 2B,C). In addition, the enrichment of CD4+ T cells, CD8+ T cells, CD8+ TCMs, and CD8+ TEMs was a favorable prognostic factor for OS (Figure 2C). Multivariate regression analysis revealed that HPV status and CD8+ TN enrichment were independent prognostic factors for DFS, whereas T factor, M factor, and CD8+ TN enrichment were independent prognostic factors for OS (Table 4).
TABLE 4.
Univariate and multivariate survival analyses of OS and DFS in 520 patients with HNSCC
| Variables | Disease‐free survival | Overall survival | ||||
|---|---|---|---|---|---|---|
| Univariate | Multivariate | Univariate | Multivariate | |||
| P‐value | HR (95% CI) | P‐value | P‐value | HR (95% CI) | P‐value | |
| HPV status | ||||||
| Negative | .03 | 1 | .04 | .13 | ||
| Positive | 0.57 (0.33‐0.97) | |||||
| Primary lesion | ||||||
| Hypopharynx | .16 | .14 | ||||
| Larynx | ||||||
| Oral cavity | ||||||
| Oropharynx | ||||||
| T factor | ||||||
| T0‐2 | .001 | 1 | .09 | .0002 | 1 | .01 |
| T3‐4 | 1.55 (0.93‐2.57) | 1.89 (1.15‐3.10) | ||||
| N factor | ||||||
| Negative | .06 | .04 | 1 | .17 | ||
| Positive | 1.30 (0.89‐1.89) | |||||
| M factor | ||||||
| M0 | .26 | .001 | 1 | .002 | ||
| M1 | 5.32 (1.88‐15.00) | |||||
| TNM stage | ||||||
| I‐II | .01 | 1 | .31 | .009 | 1 | .30 |
| III‐IV | 1.40 (0.73‐2.67) | 0.70 (0.36‐1.36) | ||||
| xCell CD4+ T cells | ||||||
| <6.56E‐19 | .67 | .01 | 1 | .09 | ||
| ≥6.56E‐19 | 0.74 (0.53‐1.04) | |||||
| xCell Th1 cells | ||||||
| <5.60E‐2 | .71 | .68 | ||||
| ≥5.60E‐2 | ||||||
| xCell Th2 cells | ||||||
| <0.112 | .27 | .55 | ||||
| ≥0.112 | ||||||
| xCell Tregs | ||||||
| <1.87E‐17 | .86 | .10 | ||||
| ≥1.87E‐17 | ||||||
| xCell CD8+ T cells | ||||||
| <1.53E‐2 | .81 | .007 | 1 | .36 | ||
| ≥1.53E‐2 | 0.82 (0.55‐1.24) | |||||
| xCell CD8+ TN | ||||||
| <6.03E‐3 | .01 | 1 | .01 | .03 | 1 | .006 |
| ≥6.03E‐3 | 1.62 (1.12‐2.34) | 1.59 (1.14‐2.20) | ||||
| xCell CD8+ TCM | ||||||
| <2.37E‐3 | .54 | .03 | 1 | .97 | ||
| ≥2.37E‐3 | 1.01 (0.69‐1.46) | |||||
| xCell CD8+ TEM | ||||||
| <1.79E‐5 | .85 | .01 | 1 | .21 | ||
| ≥1.79E‐5 | 0.77 (0.51‐1.16) | |||||
Abbreviations: CI, confidence interval; DFS, disease‐free survival; HNSCC, head and neck squamous cell carcinoma; HPV, human papillomavirus; HR, hazard ratio; OS, overall survival; TCM, central memory T cell; TEM, effector memory T cell; TN, naïve T cell.
3.5. CD38+ T cells exhibited less cytotoxic activities than CD38− cells
To investigate the cytotoxic activity of circulating CD38+ T cells compared with CD38− T cells in patients with HNSCC, we measured the production of GzmB and IFNγ in CD38+ cells and CD38− cells separately (Figure 3). CD38+ T cells, especially CD4+ T cells, exhibited significantly less production of both cytokines. These results were confirmed using blood samples from multiple patients.
FIGURE 3.
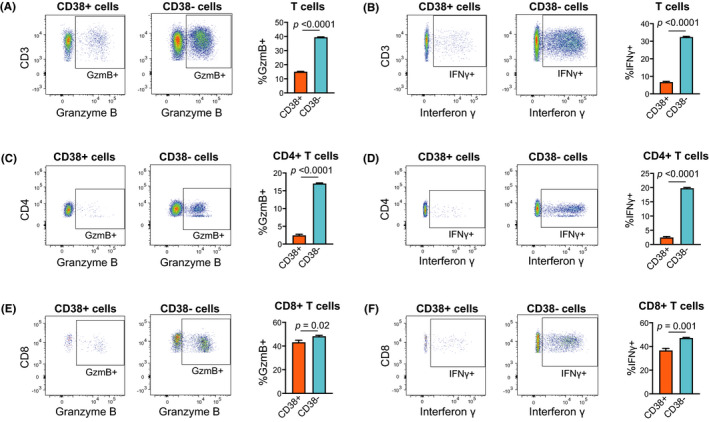
CD38+ T cells exhibited less cytotoxic activity than CD38− cells. PBMCs obtained from patients with head neck squamous cell carcinoma were sorted into CD38+ and CD38− fractions. The cytokine production in each fraction was measured using flow cytometry. A and B, Granzyme B (GzmB) or interferon γ (IFNγ) production by total T cells. C and D, GzmB or IFNγ production by CD4+ T cells. E and F, GzmB or IFNγ production by CD8+ T cells
4. DISCUSSION
In the present study, we demonstrated that the proportions of circulating CD8+ T cells, TNs, and TEMs were independent prognostic factors in patients with HNSCC. Interestingly, the expression of the activation marker CD38 in peripheral CD8+ T cells significantly correlated with shorter DFS. Ex vivo experiments demonstrated significantly less cytotoxic activity in CD38+ T cells than in CD38− T cells. Moreover, the enrichment of TNs in the tumor microenvironment was an independent prognostic factor for both shorter DFS and OS. In addition to clinical parameters, circulating T‐cell profiling can be used as a prognostic biomarker for patients with HNSCC.
As expected, univariate survival analyses of circulating T cells revealed that clinical parameters, including T factor, N factor, M factor, TNM stage, and primary lesion, correlated with prognosis in 62 patients with HNSCC. Notably, in multivariate survival analyses, these clinical parameters, except the M factor, were not independent prognostic factors, whereas the proportions of CD8+ T cells, TNs, TEMs, and CD38+ CD8+ T cells were independent prognostic factors. Importantly, there was no correlation between these T‐cell parameters and T factor, N factor, M factor, TNM stage, and primary lesion (except TEMs), suggesting the importance of these peripheral T‐cell parameters as independent prognostic biomarkers. In the peripheral blood of humans, several differentiation states of T cells have been identified based on the expression of surface markers, including CD45RO, CD45RA, CD62L, and C‐chemokine receptor 7 (CCR7). Memory T cells are subdivided into CD45RO+CD45RA−CD62L+CCR7+ TCMs and CD45RO+CD45RA−CD62L−CCR7− TEMs. TCMs traffic to lymphoid tissues and exhibit a greater proliferative capacity; in contrast, TEMs can migrate to multiple peripheral tissues and present greater effector functions. 11 , 12 The presence of tumor antigen‐specific memory T cells provides several benefits for anti‐tumor activities, including rapid activation and differentiation into effector cells, enhanced migration capacity, and prolonged persistence. In the present study, the increased proportion of TEMs was a favorable prognostic factor, whereas that of TNs was an unfavorable prognostic factor. Moreover, consistent with these results, TCGA analysis revealed that the enrichment of CD8+ TNs in the TME was an independent prognostic factor for both unfavorable DFS and OS. These results indicated that the generation and persistence of anti‐tumor T‐cell memory in both the systemic immune system and TME are crucial for improving the survival of patients with HNSCC, regardless of clinical characteristics. Our finding is consistent with previous studies that have reported a positive correlation between the enrichment of intratumor memory T cells and favorable prognosis in solid malignancies, including oral squamous cell carcinoma, colorectal cancer, and ovarian cancer. 18 , 19 , 20 In addition to these studies, the present study elucidated the prognostic value of T‐cell memory in the systemic immune system. Recent studies have reported a correlation between the increased proportion of circulating memory T cells and clinical response to ICIs in patients with melanoma and non–small‐cell lung cancer (NSCLC). 21 , 22 , 23 , 24 , 25 Accordingly, the possibility of circulating memory T cells as a prognostic marker would be worth investigating, and in addition as a predictive biomarker for ICI treatment response in patients with HNSCC.
The present study also indicated a correlation between CD38 expression on T cells and unfavorable prognosis. This result was unexpected because CD38 has been recognized as an activation marker involved in lymphocyte activation, proliferation, migration, and adhesion. 26 , 27 , 28 , 29 To further characterize circulating CD38+ T cells, we performed ex vivo experiments and demonstrated significantly less production of GzmB and IFNγ in CD38+ cells than in CD38− T cells. This result suggests the impaired cytotoxic activity of CD38+ T cells in the peripheral blood of patients with HNSCC, which could relate to an unfavorable prognosis. In clinical settings, CD38 expression on T cells reportedly corresponds to recently activated early effector cells in NSCLC and melanoma. 30 , 31 Moreover, the increased density of CD38+ TILs in hepatocellular carcinoma (HCC) correlated with improved prognosis. 32 However, accumulating evidence have suggested that CD38 is a multifunctional molecule, and the clinical significance of CD38 expression remains controversial. For instance, CD38 has been found to induce resistance to PD‐1/PD‐L1 blockade by CD8+ T‐cell suppression in an HCC model. 33 In patients with pancreatic ductal adenocarcinoma (PDAC), the increased expression of CD38 and CD101 on TILs reportedly correlated with later‐stage tumors and shorter survivals. 34 Moreover, anti‐CD38 treatment induced significant increases in helper T cells, CTLs, memory T cells, and T‐cell clonality in patients with multiple myeloma. 35 These findings suggest that CD38 expression not only represents the lymphocyte activation status but is also involved in diverse mechanisms, including immunosuppression and tumor progression, in cancer patients. Although the mechanism needs to be further investigated, the results of the present study suggest the possibility of CD38 expression on peripheral T cells as a predictive biomarker for HNSCC.
In conclusion, the present study revealed that proportions of circulating CD8+ T cells, TNs, and TEMs in the peripheral circulation were independent prognostic factors in patients with HNSCC. Moreover, CD38 expression in circulating T cells correlated with an unfavorable prognosis. Accordingly, further characterization of circulating T cells would facilitate the development of novel biomarkers for patients with HNSCC.
DISCLOSURE
The authors have no conflict of interest.
Supporting information
Table S1‐S2
ACKNOWLEDGMENTS
This work was supported in part by a Grant‐in‐Aid for Scientific Research (B) 20H03834 (KC) and Grant‐in‐Aid for Young Scientists 20K18243 (HT) from the Ministry of Education, Culture, Sports, Science and Technology, Japan.
Takahashi H, Sakakura K, Ida S, et al. Circulating naïve and effector memory T cells correlate with prognosis in head and neck squamous cell carcinoma. Cancer Sci.2022;113:53–64. doi: 10.1111/cas.15195
REFERENCES
- 1. Labani‐Motlagh A, Ashja‐Mahdavi M, Loskog A. The tumor microenvironment: a milieu hindering and obstructing antitumor immune responses. Front Immunol. 2020;11:940. [DOI] [PMC free article] [PubMed] [Google Scholar]
- 2. Joyce JA. Therapeutic targeting of the tumor microenvironment. Cancer Cell. 2005;7:513‐520. [DOI] [PubMed] [Google Scholar]
- 3. Partlová S, Bouček J, Kloudová K, et al. Distinct patterns of intratumoral immune cell infiltrates in patients with HPV‐associated compared to non‐virally induced head and neck squamous cell carcinoma. Oncoimmunology. 2015;4:e965570. [DOI] [PMC free article] [PubMed] [Google Scholar]
- 4. Mandal R, Şenbabaoğlu Y, Desrichard A, et al. The head and neck cancer immune landscape and its immunotherapeutic implications. JCI Insight. 2016;1:e89829. [DOI] [PMC free article] [PubMed] [Google Scholar]
- 5. Tong CC, Kao J, Sikora AG. Recognizing and reversing the immunosuppressive tumor microenvironment of head and neck cancer. Immunol Res. 2012;54:266‐274. [DOI] [PubMed] [Google Scholar]
- 6. Chen SMY, Krinsky AL, Woolaver RA, Wang X, Chen Z, Wang JH. Tumor immune microenvironment in head and neck cancers. Mol Carcinog. 2020;59:766‐774. [DOI] [PMC free article] [PubMed] [Google Scholar]
- 7. Wondergem NE, Nauta IH, Muijlwijk T, Leemans CR, van de Ven R. The immune microenvironment in head and neck squamous cell carcinoma: on subsets and subsites. Curr Oncol Rep. 2020;22:81. [DOI] [PMC free article] [PubMed] [Google Scholar]
- 8. Couzin‐Frankel J. Breakthrough of the year 2013. Cancer immunotherapy. Science. 2013;342:1432‐1433. [DOI] [PubMed] [Google Scholar]
- 9. Ferris RL, Blumenschein G, Fayette J, et al. Nivolumab for recurrent squamous‐cell carcinoma of the head and neck. N Engl J Med. 2016;375:1856‐1867. [DOI] [PMC free article] [PubMed] [Google Scholar]
- 10. Burtness B, Harrington KJ, Greil R, et al. Pembrolizumab alone or with chemotherapy versus cetuximab with chemotherapy for recurrent or metastatic squamous cell carcinoma of the head and neck (KEYNOTE‐048): a randomised, open‐label, phase 3 study. Lancet. 2019;394:1915‐1928. [DOI] [PubMed] [Google Scholar]
- 11. Kaech SM, Cui W. Transcriptional control of effector and memory CD8+ T cell differentiation. Nat Rev Immunol. 2012;12:749‐761. [DOI] [PMC free article] [PubMed] [Google Scholar]
- 12. Farber DL, Yudanin NA, Restifo NP. Human memory T cells: generation, compartmentalization and homeostasis. Nat Rev Immunol. 2014;14:24‐35. [DOI] [PMC free article] [PubMed] [Google Scholar]
- 13. Liu Q, Sun Z, Chen L. Memory T cells: strategies for optimizing tumor immunotherapy. Protein Cell. 2020;11:549‐564. [DOI] [PMC free article] [PubMed] [Google Scholar]
- 14. Turksma AW, Bontkes HJ, van den Heuvel H, et al. Effector memory T‐cell frequencies in relation to tumour stage, location and HPV status in HNSCC patients. Oral Dis. 2013;19:577‐584. [DOI] [PubMed] [Google Scholar]
- 15. Takahashi H, Sakakura K, Mito I, Ida S, Chikamatsu K. Dynamic changes in immune cell profile in head and neck squamous cell carcinoma: immunomodulatory effects of chemotherapy. Cancer Sci. 2016;107:1065‐1071. [DOI] [PMC free article] [PubMed] [Google Scholar]
- 16. Kuss I, Donnenberg AD, Gooding W, Whiteside TL. Effector CD8+CD45RO‐CD27‐T cells have signalling defects in patients with squamous cell carcinoma of the head and neck. Br J Cancer. 2003;88:223‐230. [DOI] [PMC free article] [PubMed] [Google Scholar]
- 17. Aran D, Hu Z, Butte AJ. xCell: digitally portraying the tissue cellular heterogeneity landscape. Genome Biol. 2017;18:220. [DOI] [PMC free article] [PubMed] [Google Scholar]
- 18. Zhou C, Li J, Wu Y, Diao P, Yang J, Cheng J. High density of intratumor CD45RO(+) memory tumor‐infiltrating lymphocytes predicts favorable prognosis in patients with oral squamous cell carcinoma. J Oral Maxillofac Surg. 2019;77:536‐545. [DOI] [PubMed] [Google Scholar]
- 19. Pagès F, Berger A, Camus M, et al. Effector memory T cells, early metastasis, and survival in colorectal cancer. N Engl J Med. 2005;353:2654‐2666. [DOI] [PubMed] [Google Scholar]
- 20. Lieber S, Reinartz S, Raifer H, et al. Prognosis of ovarian cancer is associated with effector memory CD8(+) T cell accumulation in ascites, CXCL9 levels and activation‐triggered signal transduction in T cells. Oncoimmunology. 2018;7:e1424672. [DOI] [PMC free article] [PubMed] [Google Scholar]
- 21. Manjarrez‐Orduño N, Menard LC, Kansal S, et al. Circulating T cell subpopulations correlate with immune responses at the tumor site and clinical response to PD1 inhibition in non‐small cell lung cancer. Front Immunol. 2018;9:1613. [DOI] [PMC free article] [PubMed] [Google Scholar]
- 22. Tietze JK, Angelova D, Heppt MV, et al. The proportion of circulating CD45RO(+)CD8(+) memory T cells is correlated with clinical response in melanoma patients treated with ipilimumab. Eur J Cancer. 2017;75:268‐279. [DOI] [PubMed] [Google Scholar]
- 23. Subrahmanyam PB, Dong Z, Gusenleitner D, et al. Distinct predictive biomarker candidates for response to anti‐CTLA‐4 and anti‐PD‐1 immunotherapy in melanoma patients. J Immunother Cancer. 2018;6:18. [DOI] [PMC free article] [PubMed] [Google Scholar]
- 24. Takeuchi Y, Tanemura A, Tada Y, Katayama I, Kumanogoh A, Nishikawa H. Clinical response to PD‐1 blockade correlates with a sub‐fraction of peripheral central memory CD4+ T cells in patients with malignant melanoma. Int Immunol. 2018;30:13‐22. [DOI] [PubMed] [Google Scholar]
- 25. Krieg C, Nowicka M, Guglietta S, et al. High‐dimensional single‐cell analysis predicts response to anti‐PD‐1 immunotherapy. Nat Med. 2018;24:144‐153. [DOI] [PubMed] [Google Scholar]
- 26. Quarona V, Zaccarello G, Chillemi A, et al. CD38 and CD157: a long journey from activation markers to multifunctional molecules. Cytometry B Clin Cytom. 2013;84:207‐217. [DOI] [PubMed] [Google Scholar]
- 27. Malavasi F, Deaglio S, Damle R, Cutrona G, Ferrarini M, Chiorazzi N. CD38 and chronic lymphocytic leukemia: a decade later. Blood. 2011;118:3470‐3478. [DOI] [PMC free article] [PubMed] [Google Scholar]
- 28. Deaglio S, Vaisitti T, Aydin S, Ferrero E, Malavasi F. In‐tandem insight from basic science combined with clinical research: CD38 as both marker and key component of the pathogenetic network underlying chronic lymphocytic leukemia. Blood. 2006;108:1135‐1144. [DOI] [PubMed] [Google Scholar]
- 29. Wo YJ, Gan ASP, Lim X, et al. The roles of CD38 and CD157 in the solid tumor microenvironment and cancer immunotherapy. Cells. 2019;9:26. [DOI] [PMC free article] [PubMed] [Google Scholar]
- 30. Tassi E, Grazia G, Vegetti C, et al. Early effector T lymphocytes coexpress multiple inhibitory receptors in primary non‐small cell lung cancer. Cancer Res. 2017;77:851‐861. [DOI] [PubMed] [Google Scholar]
- 31. Anichini A, Molla A, Vegetti C, et al. Tumor‐reactive CD8+ early effector T cells identified at tumor site in primary and metastatic melanoma. Cancer Res. 2010;70:8378‐8387. [DOI] [PubMed] [Google Scholar]
- 32. Garnelo M, Tan A, Her Z, et al. Interaction between tumour‐infiltrating B cells and T cells controls the progression of hepatocellular carcinoma. Gut. 2017;66:342‐351. [DOI] [PMC free article] [PubMed] [Google Scholar]
- 33. Chen L, Diao L, Yang Y, et al. CD38‐mediated immunosuppression as a mechanism of tumor cell escape from PD‐1/PD‐L1 blockade. Cancer Discov. 2018;8:1156‐1175. [DOI] [PMC free article] [PubMed] [Google Scholar]
- 34. Zhang M, Yang J, Zhou J, et al. Prognostic values of CD38(+)CD101(+)PD1(+)CD8(+) T cells in pancreatic cancer. Immunol Invest. 2019;48:466‐479. [DOI] [PubMed] [Google Scholar]
- 35. Krejcik J, Casneuf T, Nijhof IS, et al. Daratumumab depletes CD38+ immune regulatory cells, promotes T‐cell expansion, and skews T‐cell repertoire in multiple myeloma. Blood. 2016;128:384‐394. [DOI] [PMC free article] [PubMed] [Google Scholar]
Associated Data
This section collects any data citations, data availability statements, or supplementary materials included in this article.
Supplementary Materials
Table S1‐S2