

Abstract
An interlaboratory comparison study was conducted by the Vitamin D Standardization Program (VDSP) to assess the performance of ligand binding assays (Part 2) for the determination of serum total 25-hydroxyvitamin D [25(OH)D]. Fifty single-donor samples were assigned target values for concentrations of 25-hydroxyvitamin D2 [25(OH)D2], 25-hydroxyvitamin D3 [25(OH)D3], 3-epi-25-hydroxyvitamin D3 [3-epi-25(OH)D3], and 24R,25-dihydroxyvitamin D3 [24R,25(OH)2D3] using isotope dilution liquid chromatography – tandem mass spectrometry (ID LC-MS/MS). VDSP Intercomparison Study 2 Part 2 includes results from 17 laboratories using 32 ligand binding assays. Assay performance was evaluated using mean % bias compared to the assigned target values and using linear regression analysis of the test assay mean results and the target values. Only 50% of the ligand binding assays achieved the VDSP criterion of mean % bias ≤ |±5%|. For the 13 unique ligand binding assays evaluated in this study, only 4 assays were consistently within ±5% mean bias and 4 assays were consistently outside ±5% mean bias regardless of the laboratory performing the assay. Based on multivariable regression analysis using the concentrations of individual vitamin D metabolites in the 50 single-donor samples, most assays underestimate 25(OH)D2 and several assays (Abbott, bioMérieux, DiaSorin, IDS-EIA, and IDS-iSYS) may have cross-reactivity from 24R,25(OH)2D3. The results of this interlaboratory study represent the most comprehensive comparison of 25(OH)D ligand binding assays published to date and is the only study to assess the impact of 24R,25(OH)2D3 content using results from a reference measurement procedure.
Keywords: 25-hydroxyvitamin D3 [25(OH)D3]; 25-hydroxyvitamin D2 [25(OH)D2]; total 25-hydroxyvitamin D [25(OH)D]; 24R,25-dihydroxyvitamin D3 [24R,25(OH)2D3]; liquid chromatography – tandem mass spectrometry (LC-MS/MS); ligand binding assay
Graphical Abstract

Introduction
The Vitamin D Standardization Program (VDSP) [1] was established in 2010 to assist in the standardization of measurements of serum total 25-hydroxyvitamin D [25(OH)D], the primary marker of vitamin D status and defined as the sum of 25-hydroxyvitamin D2 [25(OH)D2] and 25-hydroxyvitamin D3 [25(OH)D3]. Studies have demonstrated that results for the determination of serum total 25(OH)D vary significantly depending on the assay used [2–5] and recent reviews have discussed the difficulties in assessing vitamin D status [5–12]. The various components of the VDSP reference measurement system have been described previously [1,13] including the development of Standard Reference Materials (SRMs) for the determination of vitamin D metabolites [14–16] and results of an interlaboratory comparison study to assess the performance of ligand binding assays and liquid chromatography – tandem mass spectrometry (LC-MS/MS) methods [4]. Performance criteria for 25(OH)D assay measurement variability and bias have been established by the VDSP, i.e., Coefficient of Variation (CV) ≤ 10% and mean bias ≤ |±5%| [17,18].
Since the first VDSP intercomparison study in 2011, a number of studies have evaluated the performance of ligand binding assays for the determination of 25(OH)D. Depreter et al. [19] and Heijboer et al. [20] evaluated three and six automated 25(OH)D assays, respectively, and compared the results with an isotope dilution (ID) LC-MS/MS method. Cavalier et al. [21–25] evaluated the performance of several commercial ligand binding assays for the measurement of 25(OH)D in various population studies and benchmarked the results against a VDSP-traceable LC-MS/MS procedure. Elsenberg et al. [26] compared results from five automated 25(OH)D assays with an ID LC-MS/MS method for 20 reference samples and observed significant differences among the assays for healthy donor sera. Bjerg et al. [8] analyzed 200 patient serum samples using seven different assays for 25(OH)D and reported that all achieved the precision requirement of the VDSP (CV ≤ 10%); however only two assays achieved an accuracy bias of ≤ |±5%| when they compared results with SRM 972a. Hutchinson et al. [27] verified the old and new generations of the Abbott total 25(OH)D assays and compared results to an LC-MS/MS assay. Annema et al. [28] evaluated the Abbott re-standardized Architect assay and found that the assay slightly underestimates 25(OH)D levels at low concentrations. Garnett et al. [29] evaluated the Abbott Architect and Roche Cobas assays for their recoveries of 25(OH)D2 and 25(OH)D3 and concluded that caution should be used in interpreting results using the Abbott assay in patients supplemented with vitamin D2. Lim et al. [30] evaluated the performance of three ligand binding assays for serum total 25(OH)D, with particular emphasis on the Abbott assay, and compared results with an ID LC-MS/MS method. They concluded that the re-standardized Abbott assay “has acceptable performance in a clinical setting. However, there is still a need for further standardization of vitamin D measurement among the automated ligand binding assays” [30].
As part of continuing efforts toward standardization of serum 25(OH)D measurements, the VDSP conducted a second interlaboratory comparison of 25(OH)D assays, denoted as VDSP Intercomparison Study 2. In this paper, Part 2 of Intercomparison Study 2, the results are presented for the performance assessment of 32 ligand binding assays (13 unique assays) for the determination of 25(OH)D. Part 1 of Intercomparison Study 2 reported results for 15 LC-MS/MS assays and is described elsewhere in this same journal issue [13]. The 50 single-donor serum samples used in this study were assigned target values for 25(OH)D2, 25(OH)D3, 3-epi-25-hydroxyvitamin D3 [3-epi-25(OH)D3], and 24R,25-dihydroxyvitamin D3 [24R,25(OH)2D3] using ID LC-MS/MS methods. Eight of the 50 single-donor samples had high concentrations of 25(OH)D2 (>30 nmol/L) providing an excellent assessment of assay response to both 25(OH)D2 and 25(OH)D3. The contributions of 25(OH)D2, 25(OH)D3, 3-epi-25(OH)D3, and 24R,25(OH)2D3 to each assay’s response for 25(OH)D were estimated using multivariable regression analysis, which demonstrated significant differences among assays for response and recovery of 25(OH)D2 and 25(OH)D3 and contributions from 24R,25(OH)2D3 for several assays.
Methods
Intercomparison Study 2 - Coordination and responsibilities
As described in Part 1 of Intercomparison Study 2 [13], the study was co-designed and coordinated by the National Institute of Standards and Technology (NIST) and the National Institutes of Health, Office of Dietary Supplements (NIH-ODS) through the VDSP, including acquisition and distribution of 50 single-donor serum samples, recruitment of participating laboratories, and compilation of the results [31].
Single-donor serum samples and value assignment
The measurand for the study was serum total 25(OH)D in concentration units of nanomoles per liter, defined as the sum of the concentrations of 25(OH)D2 and 25(OH)D3 and excluding the concentration of 3-epi-25(OH)D3. The 50 single-donor serum samples used for Intercomparison Study 2 were procured as described elsewhere [13]. Mass fraction (ng/g) of 25(OH)D2, 25(OH)D3, 3-epi-25(OH)D3, and 24R,25(OH)2D3 were determined in each of the single-donor serum samples using ID LC-MS/MS-based methods [32,33] as described elsewhere [13].
Results used for Intercomparison Study 2
VDSP Intercomparison Study 2 (Part 2) consists of results from two studies conducted simultaneously: (1) a single-laboratory study evaluating 12 ligand binding assays focusing on variability and bias and (2) a multi-laboratory commutability study among 17 laboratories using 20 assays to assess the commutability of SRMs and PT/EQA samples. Each participant received a set of the 50 single-donor serum samples and was provided with a protocol for the analysis of the study samples as described previously [13].
Analyses for the single-laboratory study within Intercomparison Study 2 were performed at the University of Liege (Belgium) following the same protocol as the participants in the commutability study with the exception that duplicate measurements were performed for each assay on two separate days (n = 4) for each of the 50 single-donor serum samples [34]. Whereas the intralaboratory study used all four replicates to assess assay variability and bias, the performance assessment reported in Intercomparison Study 2 used the mean of the four replicates.
Ligand binding assays evaluated in Intercomparison Study 2
The 32 ligand binding assays used in 17 laboratories are summarized in Table 1. The calibrator and reagent information for the 20 assays from the commutability study are provided in Table S1 (see Supplementary Information, ESM); similar information for the 12 ligand binding assays from the single-laboratory study are reported elsewhere [34]. For 7 of the 13 unique ligand binding assays, results were obtained from the assay manufacturer’s laboratory, and the remaining results were from laboratories using the specified assay. Results were available from multiple laboratories for 10 assays, i.e., results from five labs for Abbott; results from three labs for bioMérieux, DiaSorin, IDS-SYS, Roche, and Siemens); results from two labs for Beckman Coulter, DIAsource, IDS-EIA, and SNIBE prototype; and a single set of results from Bio-Rad, Diazyme, and Fujirebio Inc. The assays in this study included the most frequently represented ligand binding assays reported in recent External Vitamin D Quality Assurance Scheme (DEQAS) exercises [35], i.e., DiaSorin, Roche, Siemens, IDS-iSYS, and Abbott. To avoid repetition of the assay kit name, the assay will be identified by the manufacturer’s name only.
Table 1.
Laboratories Participating in VDSP Interlaboratory Study 2 Using Ligand Binding Assays
| Lab No. | Participant | Assay Manufacturer | Assay Model | Assay Type |
|---|---|---|---|---|
| 1 | Abbott Diagnostics, DE | Abbott | Architect 25-OH Vitamin D; Architect i2000SR | CLIA/CMIA |
| 18 | Golwilkar Metropolis Health Services Pvt. Ltd., IN | Abbott | Architect 25-OH Vitamin D; Architect i2000 SR | CLIA/CMIA |
| 23 | Imperial College Healthcare, UK | Abbott | Architect 25-OH Vitamin D; Architect i2000 SR | CLIA/CMIA |
| 27 | National University of Medical Sciences, PK | Abbott | Architect 25-OH Vitamin D; Architect i2000 SR | CLIA/CMIA |
| 40-1 | University of Liège, BE | Abbott | Architect 25-OH Vitamin D; Architect i1000 SR | CLIA/CMIA |
| 26 | National Institute of Public Health, NL | Beckman Coul. | Access 25(OH) Vitamin D Total; Access-2 | CLIA |
| 40-2 | University of Liège, BE | Beckman Coul. | Access 25(OH) Vitamin D Total; Access-2 | CLIA |
| 3 | bioMérieux, FR | bioMérieux | VIDAS 25 OH Vitamin D Total; Vidas Legacy | ELFA |
| 34 | University of Chester, UK | bioMérieux | VIDAS 25 OH Vitamin D Total; Mini-Vidas | ELFA |
| 40-3 | University of Liège, BE | bioMérieux | VIDAS 25 OH Vitamin D Total; Vidas | ELFA |
| 40-4 | University of Liège, BE | bioMérieux | VIDAS 25 OH Vitamin D Total; Vidas | ELFA |
| 4 | Bio-Rad Laboratories, Inc., USA | Bio-Rad | BioPlex 2200 25(OH) Vitamin D; BioPlex 2200 | FCIA |
| 9 | University of Liège, BE | DiaSorin | Liaison 25 OH Vitamin D Total; Liaison XL | CLIA |
| 24 | Imperial College Healthcare, UK | DiaSorin | Liaison 25 OH Vitamin D Total; Liaison XL | CLIA |
| 40-5 | University of Liège, BE | DiaSorin | Liaison 25 OH Vitamin D Total; Liaison XL | CLIA |
| 40-6 | University of Liège, BE | DIASource | 25OH Vitamin D Total ELISA; Thermo Fischer Multiskan FC with incubator | ELISA |
| 2 | Awareness Technology, USA | DIAsource | 25OH Vitamin D Total ELISA; ChemWell 2910 | ELISA |
| 40-7 | University of Liège, BE | Diazyme | EZ Vitamin D Total | ITA |
| 40-8 | University of Liège, BE | Fujirebio Inc. | 25-OH Vitamin D; Lumipulse G1200 | CLIA |
| 21 | Immunodiagnostic Systems (IDS), UK | IDS-EIA | IDS-EIA 25-Hydroxy Vitamin DS EIA; IDS | EIA |
| 40-9 | University of Liège, BE | IDS-EIA | 25-Hydroxy Vitamin D EIA (IDS); Thermo Fischer Multiskan FC with incubator | EIA |
| 39 | Yale University, USA | IDS-iSYS | IDS-iSYS 25-Hydroxy Vitamin DS (IDS-iSYS-l)a | CLIA |
| 20 | Immunodiagnostic Systems (IDS), UK | IDS-iSYS | IDS-iSYS 25VitDS (IDS-iSYS-2)a | CLIA |
| 40-10 | University of Liège, BE | IDS-iSYS | IDS-iSYS 25VitDS (IDS-iSYS-2)a | CLIA |
| 19 | Hospital Israelita Albert Einstein, BR | Roche | Vitamin D Total II; Modular Analytics E-170 | ECLIA |
| 29 | St. Vincent’s University Hospital, IE | Roche | Vitamin D Total II; Cobas e602 | ECLIA |
| 40-11 | University of Liège, BE | Roche | Vitamin D Total II (Cobas e411) | CLIA |
| 30 | Siemens-Healthineers, USA | Siemens | Vitamin D Total (VitD); ADVIA Centaur XP | CLIA |
| 40 | University of Liège, BE | Siemens | Vitamin D Total (VitD); ADVIA Centaur XPT | CLIA |
| 40-12 | University of Liège, BE | Siemens | Vitamin D Total (VitD); ADVIA Centaur XPT | CLIA |
| 31 | SNIBE, CN | SNIBEb,c | Prototype MAGLUMI 25-OH Vitamin D; MAGLUMI 2000 | CLIA |
| 5 | Care S.r.l., IT | SNIBEb,c | Prototype MAGLUMI 25-OH Vitamin D; MAGLUMI 2000 | CLIA |
CLIA = Chemiluminescence Ligand binding assay
CMIA = Chemiluminescence Microparticle Ligand binding assay
ELFA = Enzyme-Linked Fluorescence Assay
ECLIA = Electrochemiluminescence ligand binding assay
ELISA = Enzyme-Linked Immunosorbent Assay
EIA = Electrochemical ligand binding assay
FCIA = Flow Competitive Ligand binding assay
ITA = Immunoturbidimetric assay
Two different IDS-iSYS kits were used in the study, 25-Hydroxy Vitamin DS and 25VitDS, which are designated as IDS-iSYS-1 and IDS-iSYS-2, respectively. The 25VitDS (IDS-iSYS-2) is the currently available kit.
SNIBE = Shenzhen New Industries Biomedical Engineering Co., Ltd.
Prototype MAGLUMI 25-OH Vitamin D kit was used in this study; prototype is not equivalent to current MAGLUMI 25-OH Vitamin D kit per personal communication from SNIBE.
Results and discussion
Target concentrations for 25(OH)D2, 25(OH)D3, 3-epi-25(OH)D3, and 24R,25(OH)2D3 were assigned for the 50 single-donor serum samples, and the results are reported in Part 1 of this study [13]. The concentration of serum total 25(OH)D ranged from 16 nmol/L to 148 nmol/L, with 25(OH)D3 ranging from 9 nmol/L to 141 nmol/L. Of particular importance in evaluating the performance of the various ligand binding assays was the inclusion of eight samples with 25(OH)D2 concentrations of >30 nmol/L. Although concentrations of 25(OH)D2 >30 nmol/L are infrequent in a healthy U.S. population [36,37], these samples provided an excellent test of the assays’ performance to assess whether they have equivalent response and/or recovery for both 25(OH)D2 and 25(OH)D3 [38].
Assay performance assessments
For Intercomparison Study 2 (Part 2), the performance of 13 unique ligand binding assays was evaluated and compared using the mean of two replicates for 20 assays in the commutability study and the mean of four replicates for the 12 assays in the single-laboratory study. The results for the analysis of the 50 single-donor samples reported by all laboratories in Intercomparison Study 2 are provided as two Excel files in the ESM identified as Data VDSP Commutability Study 2 and VDSP Intralaboratory Study. With the availability of results for the same assay from multiple laboratories, assay performance as applied in different laboratories could be assessed. The results of the various performance evaluations will be discussed in general and then each unique assay will be discussed individually in more detail. The assays performance characteristics were compared for both the 50 single-donor sample set and for the subset of the 42 single-donor samples remaining after omitting the samples with concentrations of 25(OH)D2 >30 nmol/L.
Descriptive statistics for assays
The mean, standard deviation, minima, and maxima for total 25(OH)D for the 50- and 42-sample sets and the 8 high 25(OH)D2 concentration samples are summarized in Tables S2 and S3, respectively, in ESM. Mean values for the ligand binding assays ranged from 69 nmol/L to 99 nmol/L whereas mean values for the LC-MS/MS assays ranged from 74 nmol/L to 89 nmol/L [13]. For the eight samples with high 25(OH)D2 concentrations, the mean 25(OH)D concentration ranged from 71 nmol/L to 161 nmol/L for the ligand binding assays compared to a range of 110 nmol/L to 138 nmol/L for LC-MS/MS and 97.3 nmol/L for the NIST LC-MS/MS RMP.
Regression analysis
Using the mean of replicates and the NIST assigned values for total 25(OH)D, the linear regression and 95% prediction intervals (PIs) were calculated for each assay. The results of the regression analysis are summarized in Table 2 for both the 50-sample set and the 42-sample subset. The regression analysis plots for selected ligand binding assays (DiaSorin, Abbott, Siemens, and Bio-Rad) are shown in Figs. 1 and 2. Similar plots for the remaining laboratories are included in the ESM as Figs. S1 to S14.
Table. 2.
Ordinary Deming Regression Analysis for Ligand Binding Assays Based on the Mean of Replicatesa
| Lab No. | Assay | All 50 Samples (nmol/L) | 42 Samples excluding high 25(OH)D2 (nmol/L) | Difference 50 minus 42 Sample Sets | ||||||||||||||||||||||||||||
|---|---|---|---|---|---|---|---|---|---|---|---|---|---|---|---|---|---|---|---|---|---|---|---|---|---|---|---|---|---|---|---|---|
| 95% PI | 95% PI | |||||||||||||||||||||||||||||||
| Slope | Int. | Min | Max | Width | R2 | Slope | Int. | Min | Max | Width | R2 | Slope | Width | R2 | ||||||||||||||||||
| 1 | Abbott | 0.890 | 7.35 | −33.2 | 48.0 | 81.3 | 0.712 | 1.200 | −7.89 | −20.9 | 5.1 | 26.0 | 0.972 | −0.310 | 55.3 | −0.260 | ||||||||||||||||
| 18 | Abbott | 0.885 | 6.83 | −33.9 | 47.6 | 81.5 | 0.709 | 1.194 | −8.50 | −22.2 | 5.2 | 27.4 | 0.968 | −0.309 | 54.1 | −0.259 | ||||||||||||||||
| 23 | Abbott | 0.884 | 6.95 | −33.6 | 47.5 | 81.1 | 0.712 | 1.194 | −8.57 | −22.0 | 4.8 | 26.8 | 0.970 | −0.310 | 54.3 | −0.258 | ||||||||||||||||
| 27 | Abbott | 0.860 | 8.64 | −31.6 | 48.9 | 80.5 | 0.704 | 1.160 | −6.20 | −17.8 | 4.4 | 22.2 | 0.976 | −0.300 | 58.3 | −0.272 | ||||||||||||||||
| 40-1 | Abbott | 0.863 | 7.28 | −33.3 | 47.9 | 81.2 | 0.700 | 1.164 | −7.65 | −22.8 | 7.5 | 30.3 | 0.960 | −0.301 | 50.9 | −0.260 | ||||||||||||||||
| 26 | Beckman | 1.220 | −11.3 | −38.4 | 15.9 | 54.3 | 0.910 | 1.175 | −8.53 | −23.6 | 6.5 | 30.1 | 0.869 | 0.045 | 24.2 | 0.041 | ||||||||||||||||
| 40-2 | Beckman | 1.157 | −12.7 | −41.2 | 15.7 | 56.9 | 0.894 | 1.111 | −10.1 | −42.2 | 22.1 | 64.3 | 0.846 | 0.046 | −7.4 | 0.048 | ||||||||||||||||
| 3 | bioMérieux | 1.013 | 0.13 | −50.7 | 51.0 | 101.7 | 0.651 | 1.335 | −16.1 | −48.2 | 16.1 | 64.3 | 0.867 | −0.322 | 37.4 | −0.216 | ||||||||||||||||
| 34 | bioMérieux | 1.053 | 1.13 | −53.1 | 55.3 | 108.4 | 0.638 | 1.397 | −16.3 | −50.8 | 18.2 | 69.0 | 0.861 | −0.344 | 39.4 | −0.223 | ||||||||||||||||
| 40-3 | bioMérieux | 1.005 | 7.21 | −46.1 | 60.5 | 106.6 | 0.626 | 1.337 | −9.25 | −42.5 | 24.0 | 66.5 | 0.861 | −0.332 | 40.1 | −0.235 | ||||||||||||||||
| 40-4 | bioMérieux | 0.976 | 2.53 | −48.2 | 53.2 | 106.0 | 0.638 | 1.309 | −14.2 | −43.5 | 15.0 | 58.5 | 0.884 | −0.333 | 47.5 | −0.246 | ||||||||||||||||
| 4 | Bio-Rad | 0.957 | 0.96 | −27.8 | 29.8 | 57.6 | 0.855 | 1.073 | −5.01 | −34.6 | 24.6 | 59.2 | 0.861 | −0.116 | −1.6 | −0.006 | ||||||||||||||||
| 9 | DiaSorin | 0.858 | 4.82 | −24.8 | 34.5 | 59.3 | 0.814 | 1.037 | −4.17 | −25.7 | 17.4 | 43.1 | 0.907 | −0.179 | 16.2 | −0.093 | ||||||||||||||||
| 24 | DiaSorin | 0.983 | 7.86 | −27.5 | 43.2 | 70.7 | 0.797 | 1.201 | −3.02 | −26.3 | 20.3 | 46.6 | 0.914 | −0.218 | 24.1 | −0.117 | ||||||||||||||||
| 40-5 | DiaSorin | 0.935 | 3.12 | −29.7 | 36.0 | 65.7 | 0.805 | 1.130 | −6.49 | −30.7 | 17.7 | 48.4 | 0.897 | −0.195 | 17.3 | −0.092 | ||||||||||||||||
| 2 | DIAsource | 1.283 | 0.49 | −82.3 | 83.3 | 165.6 | 0.471 | 1.665 | −18.9 | −97.0 | 59.2 | 156.2 | 0.555 | −0.382 | 9.4 | −0.084 | ||||||||||||||||
| 40-6 | DIAsource | 1.278 | −7.07 | −63.4 | 49.2 | 112.6 | 0.697 | 1.576 | −21.2 | −61.7 | 19.3 | 81.0 | 0.834 | −0.298 | 31.6 | −0.137 | ||||||||||||||||
| 40-7 | Diazyme | 0.988 | −0.73 | −29.4 | 30.0 | 59.4 | 0.859 | 1.085 | −6.22 | −34.6 | 22.2 | 56.8 | 0.857 | −0.097 | 2.6 | 0.002 | ||||||||||||||||
| 40-8 | Fujirebio | 1.027 | −3.58 | −12.4 | 5.2 | 17.6 | 0.986 | 1.067 | −5.74 | −13.7 | 2.2 | 15.9 | 0.986 | −0.040 | 1.7 | 0.000 | ||||||||||||||||
| 21 | IDS-EIA | 0.965 | 12.5 | −25.9 | 50.9 | 76.8 | 0.762 | 1.185 | 1.07 | −27.6 | 29.7 | 57.3 | 0.870 | −0.220 | 19.5 | −0.108 | ||||||||||||||||
| 40-9 | IDS-EIA | 0.775 | 9.48 | −20.5 | 39.5 | 60.0 | 0.771 | 0.918 | 2.25 | −24.8 | 29.3 | 54.1 | 0.823 | −0.143 | 5.9 | −0.052 | ||||||||||||||||
| 39 | IDS-iSYS-1 | 0.896 | 12.1 | −15.6 | 39.9 | 55.5 | 0.845 | 1.026 | 5.70 | −19.4 | 30.8 | 50.2 | 0.876 | −0.130 | 5.3 | −0.031 | ||||||||||||||||
| 20 | IDS-iSYS-2 | 1.274 | −11.3 | −40.9 | 18.4 | 59.3 | 0.901 | 1.092 | −2.0 | −19.5 | 15.5 | 35.0 | 0.941 | 0.182 | 24.3 | −0.040 | ||||||||||||||||
| 40-10 | IDS-iSYS-2 | 1.309 | −7.59 | −41.6 | 26.4 | 68.0 | 0.897 | 1.090 | 3.31 | −16.5 | 23.2 | 39.7 | 0.936 | 0.219 | 28.3 | −0.039 | ||||||||||||||||
| 19 | Roche | 1.193 | −10.8 | −61.3 | 39.7 | 101.0 | 0.734 | 1.476 | −25.1 | −66.4 | 16.3 | 82.7 | 0.843 | −0.283 | 18.3 | −0.109 | ||||||||||||||||
| 29 | Roche | 1.126 | −5.72 | −53.5 | 42.1 | 95.6 | 0.736 | 1.391 | −19.0 | −57.0 | 18.9 | 75.9 | 0.852 | −0.265 | 19.7 | −0.116 | ||||||||||||||||
| 40-11 | Roche | 1.006 | −1.92 | −21.8 | 17.9 | 39.7 | 0.931 | 1.097 | −6.48 | −24.6 | 11.6 | 36.2 | 0.941 | −0.091 | 3.5 | −0.010 | ||||||||||||||||
| 30 | Siemens | 1.215 | −9.82 | −42.8 | 23.1 | 65.9 | 0.874 | 1.046 | −0.18 | −29.4 | 29.1 | 58.5 | 0.850 | 0.169 | 7.4 | 0.024 | ||||||||||||||||
| 40 | Siemens | 1.186 | −9.15 | −42.2 | 23.9 | 66.1 | 0.867 | 1.010 | 1.09 | −27.1 | 29.3 | 56.4 | 0.854 | 0.176 | 9.7 | 0.013 | ||||||||||||||||
| 40-12 | Siemens | 1.144 | −10.6 | −44.4 | 23.0 | 70.6 | 0.856 | 0.959 | −0.28 | −27.7 | 27.2 | 56.5 | 0.843 | 0.185 | 14.1 | 0.013 | ||||||||||||||||
| 5 | SNIBEb | 0.840 | 26.2 | −23.6 | 75.9 | 99.5 | 0.599 | 1.125 | 11.9 | −27.7 | 51.4 | 79.1 | 0.784 | −0.285 | 20.4 | −0.185 | ||||||||||||||||
| 31 | SNIBEb | 1.120 | 0.56 | −62.5 | 63.7 | 126.2 | 0.598 | 1.499 | −18.3 | −60.6 | 23.9 | 84.5 | 0.830 | −0.379 | 41.7 | −0.232 | ||||||||||||||||
| Mean | 1.036 | 0.75 | −38.7 | 40.2 | 79.1 | 0.767 | 1.198 | −7.2 | −34.7 | 20.2 | 55.0 | 0.878 | −0.161 | 24.2 | −0.111 | |||||||||||||||||
| SD | 0.153 | 8.9 | 15.4 | 17.8 | 28.2 | 0.119 | 0.180 | 8.4 | 18.2 | 12.5 | 26.4 | 0.079 | 0.189 | 18.8 | 0.107 | |||||||||||||||||
For laboratories 1 through 40, mean of two replicates; for assays 40-1 through 40-12, mean of 4 replicates. Int. = intercept, Min = minimum value on y-axis for PI, Max = maximum value on y-axis for PI, and Width = width of PI (Min + Max).
SNIBE prototype assay that is not equivalent to current SNIBE assay.
Figure 1.
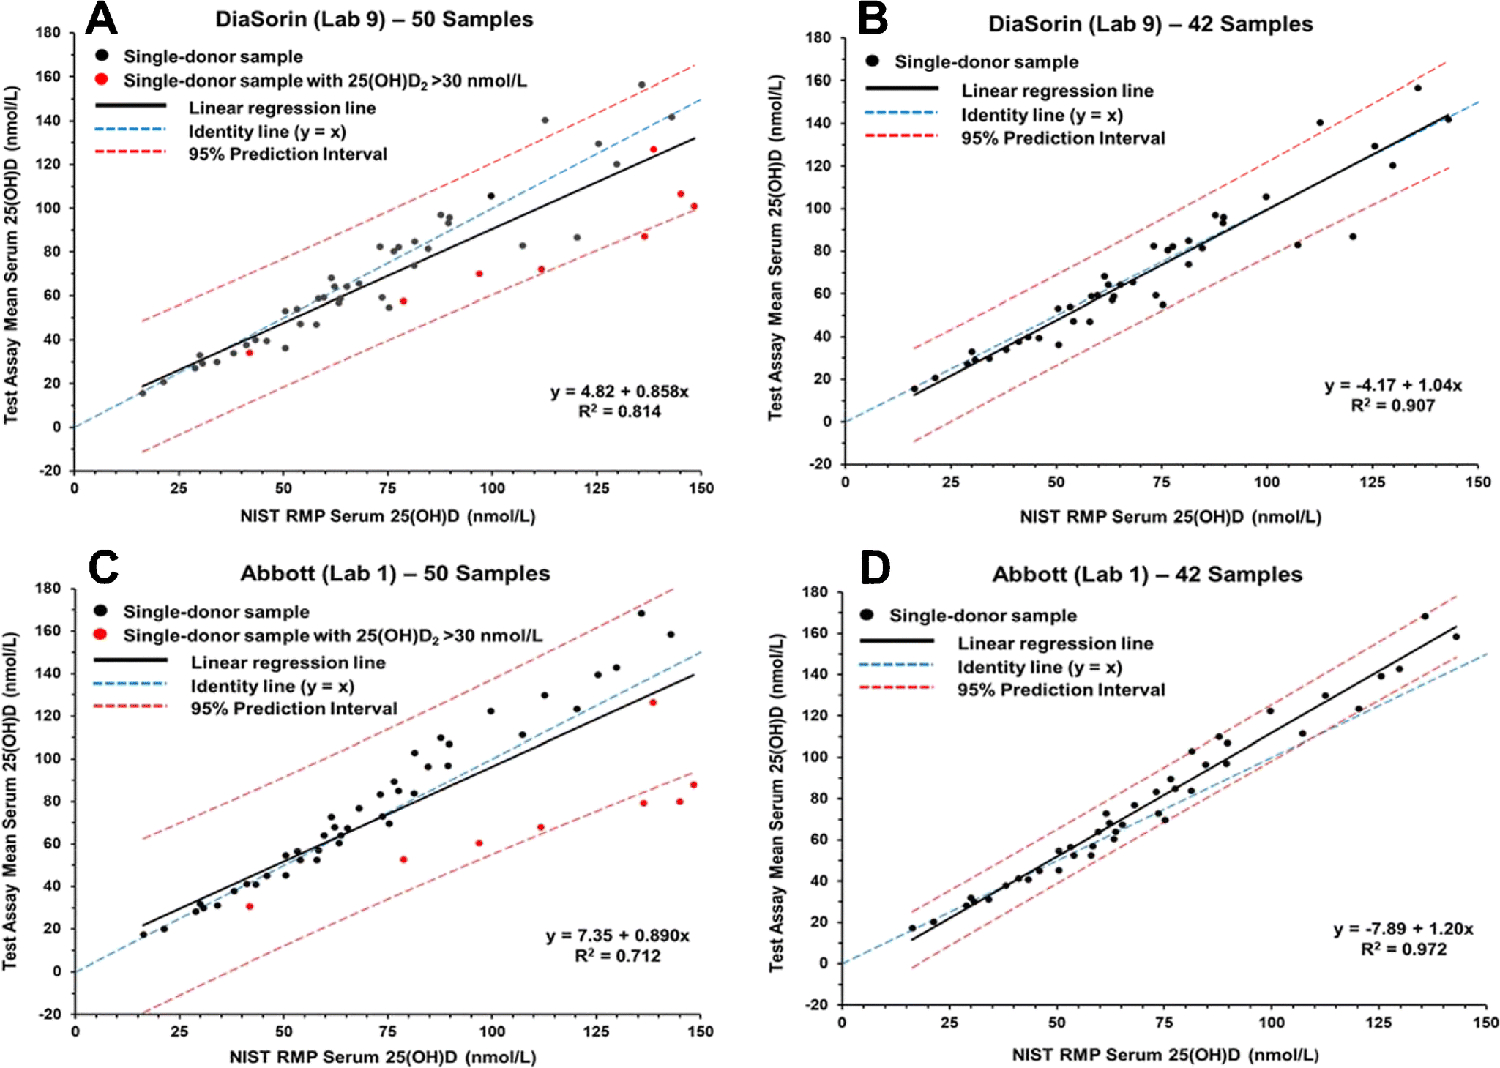
Results for determination of serum total 25(OH)D in single-donor samples versus the NIST assigned target value for the DiaSorin assay (Lab 9) (A and B) and Abbott assay (Lab 1) (C and D).
Figure 2.
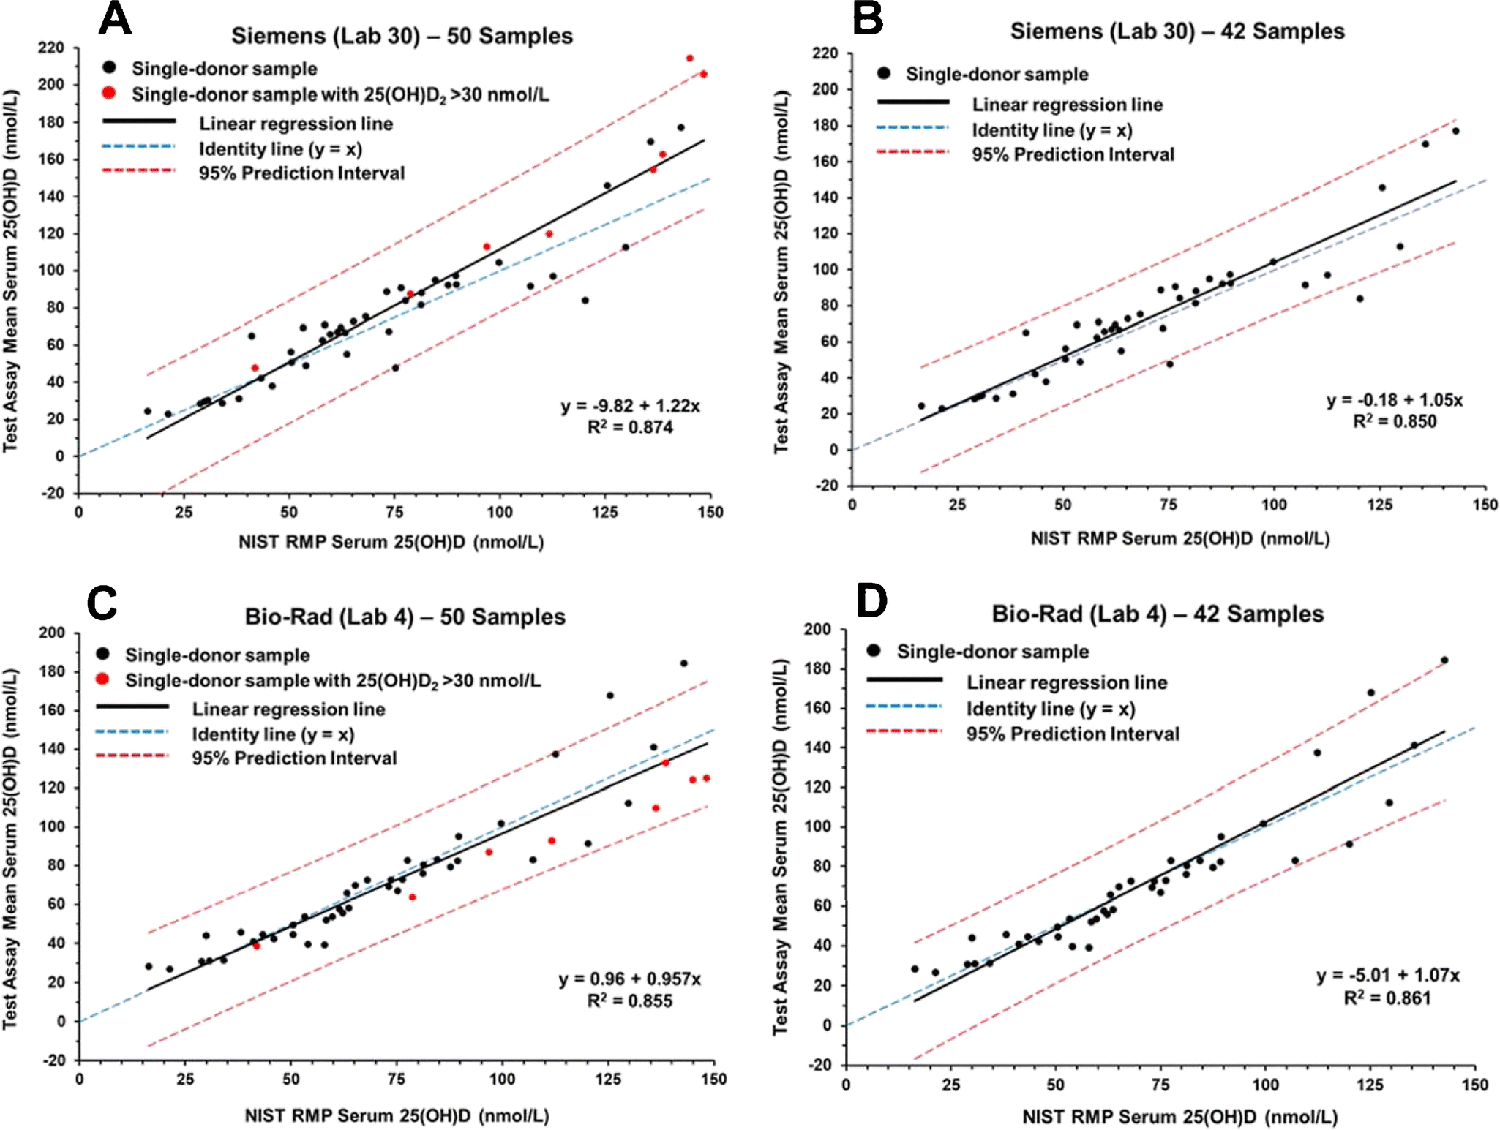
Results for determination of serum total 25(OH)D in single-donor samples versus the NIST assigned target value for the Siemens assay (Lab 30) (A and B) and Bio-Rad assay (Lab 4) (C and D).
As shown in Table 2, there are significant differences in the slope and R2 values among the various ligand binding assays and between the set of 50 samples and the subset of 42 samples. Using the 50-sample set, the slopes among the ligand binding assays range from 0.775 (IDS-EIA) to 1.31 (IDS-iSYS-2) with R2 values ranging from 0.471 (DIAsource) to 0.986 (Fujirebio Inc.). For the 42-sample subset, the slopes range from 0.918 (IDS-EIA) to 1.50 (SNIBE prototype) with R2 values ranging from 0.555 (DIAsource) to 0.986 (Fujirebio Inc.). The PI width ranged from 17.6 nmol/L (Fujirebio Inc.) to 166 nmol/L (DIAsource) for the 50 samples and from 15.9 nmol/L to 156 nmol/L for the 42-sample set. The differences between the 50- and 42-sample sets for the PI width ranged from 1.7 nmol/L (Fujirebio Inc.) to 58 nmol/L (Abbott).
The regression analysis plots shown in Figs. 1 and 2 illustrate three different ligand binding assay behaviors. The DiaSorin assay (Fig. 1A and 1B) and the Abbott assay (Figs. 1C and 1D) represent a group of assays, including bioMérieux (ESM Figs. S4 and S5), IDS-EIA (ESM Fig. S9), Roche (ESM Figs. S11C and S11D and Fig. S12), and SNIBE prototype (ESM Fig. S14) that show an increase in slope when the eight high 25(OH)D2 concentration samples are removed from the analyses. The Siemens assay (Figs. 2A and 2B) is representative of assays, including IDS-iSYS-2 (ESM Figs. S10C and S10D and S11A and S11B) and Beckman Coulter (Fig. S3) that show a decrease in slope when the high 25(OH)D2 concentration samples are omitted. The Bio-Rad assay (Figs. 2C and 2D) represents a group of assays including Diazyme (ESM Figs. S8A and S8B) and Fujirebio Inc. (ESM Figs. S8C and S8D) that have significantly smaller differences in slope for the analyses of the 50-sample and 42-sample sets, i.e., these assays are not significantly influenced by the high 25(OH)D2 concentration samples.
Bias analysis
The % bias for each assay was determined by comparison of the assay results with the NIST target measurements for each of the 50 single-donor samples. The mean % bias results are summarized in Table 3 for both the 50- and 42-sample sets and for the high 25(OH)D2 concentration 8-sample set in Table S4 (see ESM). Plots of mean % bias compared to the NIST target values are shown in Fig. 3 for four assays: (A) Abbott, (B) DiaSorin, (C) IDS-iSYS-2, and (D) bioMérieux representing different assay behaviors. Similar plots for the remaining ligand binding assays are shown in Figs. S15 to S21 (see ESM). The Abbott, bioMérieux, and DiaSorin assays represent a group of assays that have significant negative bias for samples with concentrations of 25(OH)D2 > 30 nmol/L. The Abbott assay (Fig. 3A) has a slight positive bias when the 42-sample subset is used; however, the significant negative bias for the high concentration 25(OH)D2 samples places the % mean bias for all 50 samples ≤ |±5%|. Results from the other four laboratories using the Abbott assay were similar (see ESM Fig. S15). In addition to the Abbott, bioMérieux, and DiaSorin assays, several other assays also had negative bias for the high concentration 25(OH)D2 samples including IDS-EIA (ESM Figs. S19A and S19B), Roche (ESM Figs. S20A, S20B, and S20C), and SNIBE prototype (ESM Figs. S21C and S21D). The IDS-iSYS-2 assay (Fig. 3C) has a positive bias for the samples with high concentrations of 25(OH)D2. Similar behavior is exhibited by the Siemens (ESM Figures S20D, S21A, and S21B) and Beckman Coulter assays (ESM Figs. S16A and S16B).
Table 3.
Bias Analysis for Ligand Binding Assays Based on the Mean of Replicatesa
| Lab No. | Assay | % Bias - All 50 Samples | % Bias - 42 Samples (Excluding High 25(OH)D2 | ||||||||||||||||||||||||
|---|---|---|---|---|---|---|---|---|---|---|---|---|---|---|---|---|---|---|---|---|---|---|---|---|---|---|---|
| Obs. | Mean | SD | Min | Max | % ≤ 5%b | Obs. | Mean | SD | Min | Max | % ≤ 5%b | ||||||||||||||||
| 1 | Abbott | 50 | −0.16 | 18.0 | −44.9 | 26.7 | 30 | 42 | 6.31 | 9.82 | −9.97 | 26.7 | 36 | ||||||||||||||
| 18 | Abbott | 50 | −1.52 | 18.0 | −44.7 | 25.2 | 28 | 42 | 4.82 | 10.2 | −12.5 | 25.2 | 33 | ||||||||||||||
| 23 | Abbott | 50 | −1.38 | 17.7 | −44.6 | 25.4 | 28 | 42 | 4.86 | 10.1 | −18.8 | 25.4 | 33 | ||||||||||||||
| 27 | Abbott | 50 | −1.18 | 17.7 | −48.1 | 25.3 | 34 | 42 | 5.28 | 8.83 | −11.5 | 25.3 | 40 | ||||||||||||||
| 40-1 | Abbott | 50 | −2.71 | 17.9 | −45.9 | 25.1 | 32 | 42 | 3.65 | 9.94 | −15.2 | 25.1 | 38 | ||||||||||||||
| 26 | Beckman Coulter | 50 | 6.68 | 20.4 | −34.0 | 102 | 30 | 42 | 5.89 | 21.6 | −34.0 | 102 | 33 | ||||||||||||||
| 40-2 | Beckman Coulter | 50 | −1.96 | 18.0 | −42.6 | 63.4 | 18 | 42 | −3.25 | 19.0 | −42.6 | 63.4 | 17 | ||||||||||||||
| 3 | bioMérieux | 49 | 1.13 | 24.8 | −40.8 | 56.1 | 6 | 41 | 7.39 | 21.0 | −29.6 | 56.1 | 7 | ||||||||||||||
| 34 | bioMérieux | 49 | 7.07 | 27.2 | −37.8 | 67.7 | 8 | 41 | 13.8 | 23.4 | −26.9 | 67.7 | 10 | ||||||||||||||
| 40-3 | bioMérieux | 49 | 12.0 | 27.4 | −39.3 | 62.5 | 8 | 41 | 19.6 | 21.8 | −30.1 | 62.5 | 10 | ||||||||||||||
| 40-4 | bioMérieux | 49 | 1.23 | 24.0 | −43.2 | 54.4 | 14 | 41 | 8.0 | 18.9 | −30.4 | 54.4 | 18 | ||||||||||||||
| 4 | Bio-Rad | 50 | −0.74 | 18.9 | −32.0 | 74.8 | 28 | 42 | 1.68 | 19.6 | −32.0 | 74.8 | 31 | ||||||||||||||
| 9 | DiaSorin | 50 | −6.78 | 14.3 | −36.1 | 24.9 | 28 | 42 | −3.05 | 11.9 | −27.9 | 24.9 | 33 | ||||||||||||||
| 24 | DiaSorin | 50 | 11.0 | 17.8 | −29.9 | 44.9 | 14 | 42 | 15.9 | 14.0 | −19.6 | 44.9 | 14 | ||||||||||||||
| 40-5 | DiaSorin | 50 | −1.62 | 16.2 | −32.2 | 34.3 | 18 | 42 | 2.42 | 13.9 | −25.8 | 34.3 | 19 | ||||||||||||||
| 2 | DIAsource | 49 | 30.5 | 58.8 | −24.5 | 379 | 8 | 42 | 37.5 | 61.2 | −18.0 | 379 | 10 | ||||||||||||||
| 40-6 | DIAsource | 50 | 17.2 | 31.8 | −31.8 | 148 | 16 | 42 | 22.9 | 30.2 | −22.4 | 148 | 17 | ||||||||||||||
| 40-7 | Diazyme | 50 | −2.93 | 20.4 | −51.9 | 49.5 | 20 | 42 | −2.12 | 21.9 | −51.9 | 49.5 | 17 | ||||||||||||||
| 40-8 | Fujirebio Inc. | 50 | −3.60 | 6.8 | −25.2 | 12.9 | 48 | 42 | −3.48 | 7.30 | −25.2 | 12.9 | 45 | ||||||||||||||
| 21 | IDS-EIA | 50 | 15.7 | 20.5 | −27.1 | 64.4 | 12 | 42 | 20.4 | 17.8 | −26.3 | 64.4 | 14 | ||||||||||||||
| 40-9 | IDS-EIA | 50 | −8.2 | 16.7 | −34.3 | 39.0 | 16 | 42 | −4.7 | 15.6 | −34.3 | 39.0 | 19 | ||||||||||||||
| 39 | IDS-iSYS-1 | 50 | 8.75 | 19.9 | −25.1 | 78.1 | 24 | 42 | 12.7 | 19.2 | −25.1 | 78.1 | 24 | ||||||||||||||
| 20 | IDS-iSYS-2 | 50 | 10.2 | 16.7 | −12.7 | 82.3 | 32 | 42 | 5.63 | 10.4 | −12.7 | 32.5 | 39 | ||||||||||||||
| 40-10 | IDS-iSYS-2 | 50 | 19.6 | 15.8 | −15.7 | 65.3 | 8 | 42 | 14.9 | 11.2 | −15.7 | 65.3 | 10 | ||||||||||||||
| 19 | Roche | 50 | 2.54 | 26.9 | −44.2 | 76.8 | 14 | 42 | 6.64 | 26.7 | −44.2 | 76.8 | 17 | ||||||||||||||
| 29 | Roche | 50 | 4.12 | 25.3 | −41.8 | 71.1 | 10 | 42 | 8.44 | 24.5 | −41.8 | 71.1 | 12 | ||||||||||||||
| 40-11 | Roche | 50 | −1.7 | 11.6 | −22.2 | 39.0 | 34 | 42 | −0.02 | 11.6 | −22.2 | 39.0 | 38 | ||||||||||||||
| 30 | Siemens | 50 | 7.87 | 18.7 | −36.2 | 59.0 | 16 | 42 | 5.39 | 18.5 | −36.2 | 59.0 | 19 | ||||||||||||||
| 40 | Siemens | 49 | 6.30 | 17.7 | −30.8 | 62.6 | 31 | 42 | 3.98 | 17.1 | −30.8 | 62.6 | 33 | ||||||||||||||
| 40-12 | Siemens | 50 | −0.40 | 18.5 | −50.7 | 48.5 | 34 | 42 | −3.3 | 17.8 | −50.7 | 48.5 | 38 | ||||||||||||||
| 5 | SNIBEc | 50 | 28.0 | 37.3 | −33.0 | 140 | 14 | 42 | 36.5 | 34.0 | −5.73 | 140 | 12 | ||||||||||||||
| 31 | SNIBEc | 50 | 15.0 | 32.3 | −41.5 | 109 | 8 | 42 | 22.1 | 28.7 | −25.5 | 109 | 7 | ||||||||||||||
| Mean | 5.31 | 21.7 | −35.8 | 69.9 | 21 | 8.65 | 19.0 | −26.7 | 68.4 | 23 | |||||||||||||||||
| SD | 9.48 | 9.2 | 9.7 | 64.7 | 11 | 10.7 | 10.2 | 11.5 | 65.0 | 12 | |||||||||||||||||
For laboratories 1 through 40, mean of two replicates; for assays 40-1 through 40-12, mean of four replicates. Obs. = Number of observations (samples analyzed), Min = largest negative % bias value, Max = largest positive % bias.
Percentage of individual sample bias values (mean of two replicates) within ± 5% mean bias.
SNIBE prototype assay which is not equivalent to current SNIBE assay.
Figure 3.
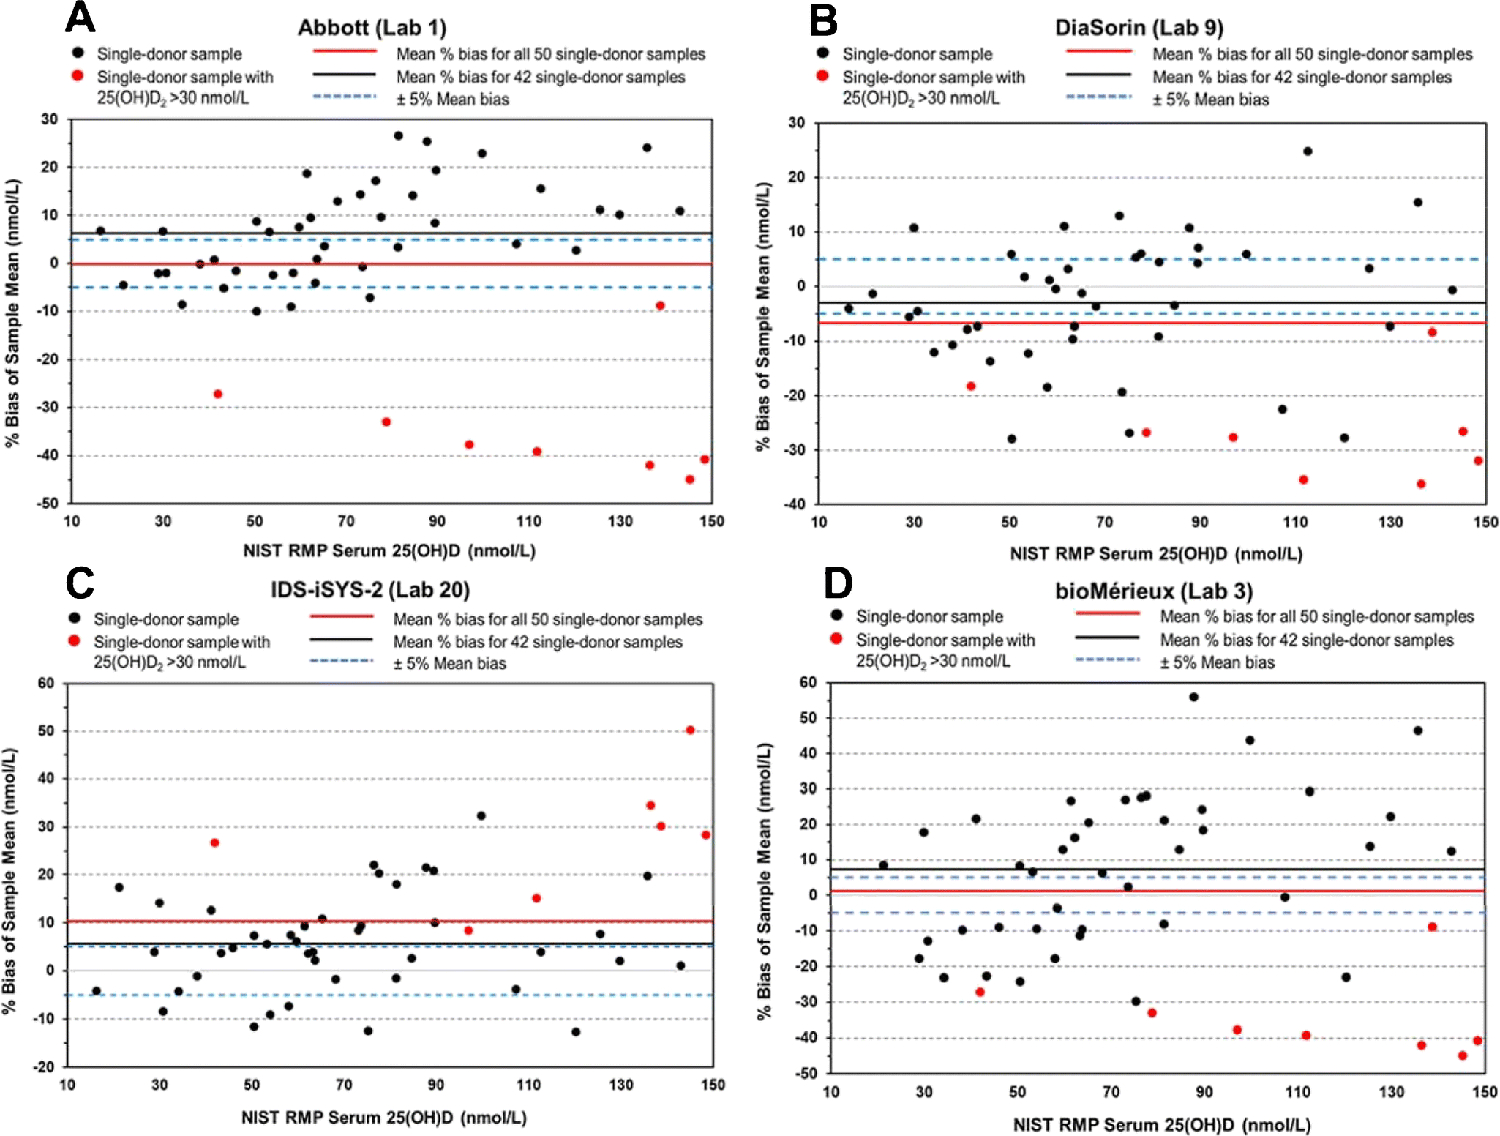
Mean % bias for the determination of serum total 25(OH)D in 50 single-donor samples compared with the NIST target values for Abbott assay (Lab 1) (A), DiaSorin assay (Lab 9) (B), IDS-iSYS-2 assay (Lab 20) (C), and bioMérieux assay (Lab 3) (D).
The percentage of the 50 single-donor samples with mean % bias within ±5% are also included in Table 3. Even though 50% of the 32 ligand binding assays met the VDSP criterion of mean % bias ≤ |±5%|, the percentage of individual samples with mean % bias within the VDSP criterion of ±5% bias is low ranging from only 6% (bioMérieux) to a high of 48% (Fujirebio Inc.) As shown in Fig. 3D (and Table 3) for the bioMérieux assay (Lab 3), even though the overall mean % bias for all 50 single-donor samples is within the VDSP criterion of ±5% (i.e., 1.1%), only three mean results for individual samples (6%) are within the criterion. The percentage of samples within various limits beyond ±5% are summarized in Table S5 (see ESM).
To illustrate the impact of high 25(OH)D2 concentrations on assay performance, the mean % bias for the 42 samples with normal 25(OH)D2 concentrations and the 8 samples with high 25(OH)D2 concentrations are compared graphically in Fig. 4. For most of the assays, high 25(OH)D2 concentrations produce a negative bias; the exceptions were Beckman Coulter, IDS-iSYS-2, and Siemens, which produced a positive bias. For almost all assays with multiple results (i.e., Abbott, bioMérieux, DiaSorin, DIAsource, IDS-iSYS-2, Roche, Siemens, and SNIBE prototype), the mean % bias values were consistent, particularly for the high concentration 25(OH)D2 samples. Only the % mean bias results for IDS-EIA were inconsistent between the two laboratories using this assay.
Figure 4.
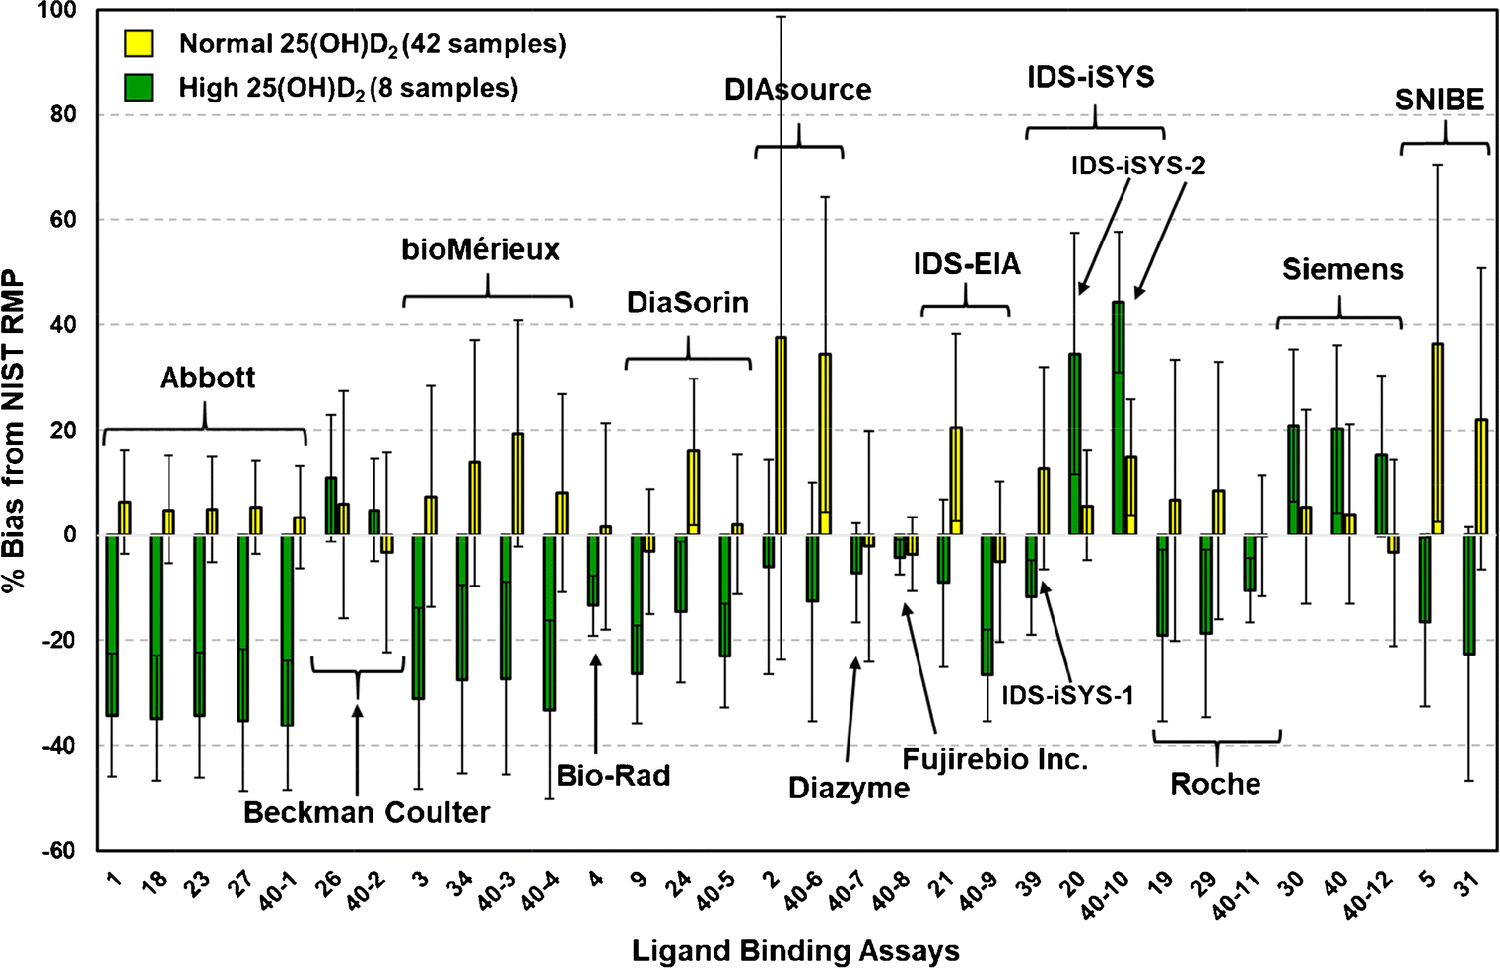
Mean % bias for various ligand binding assays for single-donor samples with normal concentrations of 25(OH)D2 (42 samples) (yellow bar) and with high concentrations (>30 nmol/L) of 25(OH)D2 (8 samples) (green bar). Error bars are the SD of the % mean bias for the sample sets.
Influence of concentrations of 25(OH)D2, 25(OH)D3, 3-epi-25(OH)D3 24R,25(OH)2D3 on assay performance
Multivariable regression analysis was performed for the test assay result for serum total 25(OH)D using the NIST values of each metabolite as independent variables as described previously [13] and the results are summarized in Table 4. The multivariable regression analysis indicates that most of the ligand binding assays evaluated have some difficulties with 25(OH)D2 resulting in an underestimation (Abbott, bioMérieux, Bio-Rad, DiaSorin, Diazyme, IDS-EIA, Roche, and SNIBE prototype) or an overestimation (Beckman Coulter, IDS-iSYS, and Siemens) of this metabolite’s contribution. Only the Fujirebio Inc. assay appears to have equivalent contributions for 25(OH)D2 and 25(OH)D3. For 25(OH)D3, the Beckman Coulter, Bio-Rad, DIAsource, Fujirebio Inc., and SNIBE prototype all appear to have near unity responses, whereas the Abbott, Diazyme, and Siemens assays underestimated the 25(OH)D3 contribution slightly; bioMérieux, DiaSorin, IDS-iSYS-2, and IDS-EIA significantly underestimated 25(OH)D3; and the Roche assay significantly overestimated the contribution of 25(OH)D3. It appeared that the DIAsource assay included a contribution for 3-epi-25(OH)D3 in the estimate for 25(OH)D with a corresponding underestimation of 25(OH)D3; however, this was observed only for one of the two sets of results for DIAsource. Multiple laboratories using Abbott, bioMérieux, DiaSorin, and IDS-EIA consistently include 24R,25(OH)2D3 in the estimate of total 25(OH)D. Lab 39 using the IDS-iSYS-1 assay includes 24R,25(OH)2D3 in the estimate of total 25(OH)D with a possible contribution for the IDS-iSYS-2 assay. Cashman et al. [39] investigated the impact of 24R,25(OH)2D3 on 25(OH)D assay performance and observed that 24R,25(OH)2D3 contributed to a positive bias in some ligand binding assays. In spiking experiments using the IDS-EIA assay compared with LC-MS/MS results, Cashman et al. [39] calculated a mean factor of 2.79 by which the ligand binding assay overresponded to 24R,25(OH)2D3 content. For the five assays that have probable contributions from 24R,25(OH)2D3 (Table 4), the scaling parameters for 24R,25(OH)2D3 are between 2.0 and 6.0, which compare favorably with the factor of 2.8 calculated by Cashman et al. [39]. The multivariable regression analysis was also performed with the inclusion of results from the 29 SRMs and PT/EQA samples with the 50 single-donor samples, and the results are summarized in Table S6 (see ESM). The multivariable regression using 79 samples provided only minor changes compared to using only the 50 single-donor samples, i.e., the DIAsource assay no longer had a contribution from 3-epi-25(OH)D3 and the contribution of 24R,25(OH)2D3 became significant for the second SNIBE prototype assay.
Table 4.
Multivariable Linear Regression Analysis for Ligand Binding Assays for 50 Single-Donor Samplesa
| Lab No. | Assay Manufacturer | R2 | 25(OH)D2 | SE | 25(OH)D3 | SE | 3-epi-25(OH)D3 | SE | 24R,25(OH)2D3 | SE |
|---|---|---|---|---|---|---|---|---|---|---|
| 1 | Abbott | 0.989 | 0.546 | 0.018 | 0.892 | 0.040 | 1.23 | 0.43 | 2.00 | 0.37 |
| 18 | Abbott | 0.989 | 0.538 | 0.018 | 0.858 | 0.040 | 1.34 | 0.42 | 2.20 | 0.37 |
| 23 | Abbott | 0.987 | 0.548 | 0.020 | 0.894 | 0.044 | 0.31 | 0.48 | 2.48 | 0.41 |
| 27 | Abbott | 0.991 | 0.522 | 0.017 | 0.892 | 0.037 | 1.38* | 0.40* | 1.61 | 0.34 |
| 40-1 | Abbott | 0.978 | 0.535 | 0.026 | 0.891 | 0.057 | −0.19 | 0.61 | 2.60 | 0.52 |
| 26 | Beckman Coulter | 0.926 | 1.21 | 0.06 | 1.10 | 0.13 | 4.05 | 1.40 | −1.88 | 1.20 |
| 40-2 | Beckman Coulter | 0.900 | 1.17 | 0.07 | 1.12 | 0.14 | 1.79 | 1.56 | −1.35 | 1.33 |
| 3 | bioMérieux | 0.973 | 0.577 | 0.034 | 0.520 | 0.073 | 2.37 | 0.78 | 6.06 | 0.67 |
| 34 | bioMérieux | 0.968 | 0.587 | 0.039 | 0.532 | 0.084 | 2.44 | 0.89 | 6.40 | 0.77 |
| 40-3 | bioMérieux | 0.955 | 0.563 | 0.044 | 0.592 | 0.096 | 1.00 | 0.98 | 6.32 | 0.88 |
| 40-4 | bioMérieux | 0.970 | 0.548 | 0.035 | 0.600 | 0.076 | 1.56 | 0.81 | 5.60 | 0.69 |
| 4 | Bio-Rad | 0.888 | 0.834 | 0.060 | 0.960 | 0.129 | 1.18 | 1.40 | 0.11 | 1.19 |
| 9 | DiaSorin | 0.959 | 0.632 | 0.033 | 0.593 | 0.072 | 0.88 | 0.78 | 3.58 | 0.66 |
| 24 | DiaSorin | 0.960 | 0.700 | 0.038 | 0.717 | 0.082 | 1.25 | 0.88 | 3.75 | 0.76 |
| 40-5 | DiaSorin | 0.953 | 0.684 | 0.039 | 0.634 | 0.084 | 0.80 | 0.91 | 4.12 | 0.78 |
| 2 | DIAsource | 0.992 | 1.04 | 0.02 | 0.856 | 0.036 | 2.04 | 0.39 | 0.22 | 0.34 |
| 40-6 | DIAsource | 0.874 | 0.841 | 0.090 | 1.00 | 0.19 | 1.23 | 2.09 | 4.44 | 1.79 |
| 40-7 | Diazyme | 0.887 | 0.865 | 0.062 | 0.844 | 0.133 | 1.55 | 1.44 | 1.08 | 1.23 |
| 40-8 | Fujirebio Inc. | 0.990 | 0.983 | 0.018 | 1.00 | 0.039 | 0.51 | 0.41 | 0.23 | 0.35 |
| 21 | IDS-EIA | 0.923 | 0.678 | 0.053 | 0.653 | 0.113 | 2.01 | 1.22 | 3.58 | 1.05 |
| 40-9 | IDS-EIA | 0.913 | 0.582 | 0.045 | 0.421 | 0.097 | −0.13 | 1.04 | 4.70 | 0.89 |
| 39 | IDS-iSYS-1 | 0.930 | 0.728 | 0.044 | 0.621 | 0.096 | −0.33 | 1.04 | 3.96 | 0.89 |
| 20 | IDS-iSYS-2 | 0.961 | 1.34 | 0.05 | 0.667 | 0.099 | 2.21 | 1.07 | 2.67** | 0.92 |
| 40-10 | IDS-iSYS-2 | 0.971 | 1.46 | 0.04 | 0.814 | 0.090 | 0.12 | 0.97 | 2.60** | 0.82 |
| 19 | Roche | 0.866 | 0.858 | 0.086 | 1.25 | 0.18 | 3.36 | 2.00 | −0.44 | 1.70 |
| 29 | Roche | 0.876 | 0.808 | 0.078 | 1.20 | 0.17 | 3.60 | 1.82 | −0.82 | 1.56 |
| 40-11 | Roche | 0.958 | 0.896 | 0.037 | 0.976 | 0.080 | 1.45 | 0.87 | 0.19 | 0.74 |
| 30 | Siemens | 0.908 | 1.28 | 0.07 | 0.877 | 0.146 | 2.05 | 1.58 | 0.44 | 1.35 |
| 40 | Siemens | 0.908 | 1.26 | 0.07 | 0.843 | 0.144 | 1.5 | 1.5 | 0.65 | 1.32 |
| 40-12 | Siemens | 0.907 | 1.23 | 0.06 | 0.747 | 0.140 | 1.40 | 1.51 | 1.19 | 1.29 |
| 31 | SNIBEb | 0.871 | 0.624 | 0.085 | 0.944 | 0.184 | 1.2 | 2.0 | 4.1 | 1.7 |
| 5 | SNIBEb | 0.852 | 0.500 | 0.070 | 0.626* | 0.152* | −0.2 | 1.6 | 4.6 | 1.4 |
For laboratories 1 through 40, mean of two replicates; for assays 40–1 through 40-12, mean of four replicates.
SNIBE prototype assay which is not equivalent to current SNIBE assay.
Color Key for X1, X2, X1, and X4 from multivariable regression equation:
 Estimate between 0.9 to 1.1 with near equivalent response for both 25(OH)D2 and 25(OH)D3
 Underestimated (< 0.9)
 Overestimated (> 1.1)
 Significant contribution to the estimate (p < 0.0001)
 No significant contribution to the estimate (p > 0.0001)
Indicates possible contribution to the estimate (0.0001 > p < 0.001)
Indicates possible contribution to the estimate (p < 0.005)
Performance of individual ligand binding assays
Abbott –
This study included results for the Abbott assay from five different laboratories including the assay manufacturer’s laboratory. The results among the five laboratories were consistent as shown in Tables 2 and 3 (and Fig. 4) indicating robust assay performance. The Abbott assay has a significant underestimation of 25(OH)D2 as indicated by multivariable regression analysis results in Table 4 and by the significant change in slope of the regression line when the high 25(OH)D2 concentration samples are removed (i.e., 0.30, Table 2 and Figs. 1C and 1D). The 25(OH)D3 is slightly underestimated and 24R,25(OH)2D3 appears to contribute to the response for total 25(OH)D. The mean % bias is slightly negative (1% to 2%) for the 50-sample set, but approximately 4% to 6% positively biased when only the normal 25(OH)D2 concentration samples are evaluated. The percentage of individual samples within the ±5% criterion is consistently between 28% and 34%, one of the highest percentages for any assay. However, there is a significant and consistent negative bias of 34% to 36% for the set of high 25(OH)D2 concentration samples when using the Abbott assay (see ESM Table S4). Several recent studies [27,30] have evaluated and compared the Abbott assay with other ligand binding assays and with a reference ID LC-MS/MS method. Lim et al. [30] compared the Abbott assay with the Roche, Siemens, and LC-MS/MS assays using the four levels of SRM 972a. For the Abbott assay, they observed a positive bias (18%) for SRM 972 Level 1 and negative bias (12%) for Level 3, which has a high concentration of 25(OH)D2; these results are similar to results observed in this study. Garnett et al. [29] investigated the efficacy of the Abbott and the Roche assays for recovery of 25(OH)D2 and 25(OH)D3 and found that the two assays had similar response for 25(OH)D3 but the Abbott assay was significantly negatively biased compared to ID LC-MS/MS assay for 25(OH)D2, which is in agreement with the results of this study. Wyness and Straseski [40] evaluated six assays including the Abbott assay and found that the Abbott and Roche assays underestimated 25(OH)D2 by about 25%.
Beckman Coulter –
Two laboratories provided results using the Beckman Coulter assay, and the results were slightly inconsistent (ESM Figs. S16A and S16B), with one laboratory achieving the ≤ |±5%| bias criterion while the other laboratory was slightly outside the criterion (6%) for both the 50- and 42-sample sets. The Beckman Coulter assay was not significantly influenced by the removal of the high concentration 25(OH)D2 samples (ESM Fig. S3). The Beckman Coulter assay is one of only three assays that exhibited a positive bias (11% and 5%) rather than a negative bias for the samples with high 25(OH)D2 concentrations (ESM Table S4), which was confirmed by the significant overestimation of the contributions of both 25(OH)D2 and 25(OH)D3 based on the multivariable linear regression analysis. Percentage of individual samples within ±5% bias was 30% and 18% for the two laboratories. Elsenberg et al. [26] observed significantly higher bias (26%) for the Beckman Coulter assay compared to their LC-MS/MS method.
bioMérieux –
Four sets of results were available for the bioMérieux assay including results from the manufacturer’s laboratory; results among the four laboratories were inconsistent relative to meeting the % bias criterion with two laboratories within and two laboratories outside ±5%. The bioMérieux assay had the lowest percentage of individual samples within ±5% mean bias at 6% to 8%. There is a significant change in slope of the regression line (i.e., −0.33) when the high concentration 25(OH)D2 samples are excluded (Figs. S4 and S5, ESM). The bioMérieux assay has a significant underestimation of 25(OH)D2 similar to the Abbott assay. The response for 25(OH)D3 is also underestimated significantly, and 24R,25(OH)2D3 does contribute to the response for 25(OH)D based on the multivariable linear regression analysis.
Bio-Rad –
The manufacturer’s laboratory provided the only results for the Bio-Rad assay, which exhibited low mean % bias of −0.7 with 28% of individual samples within ≤±5% mean bias. (Fig. S17B, ESM). The Bio-Rad assay was not significantly influenced by the removal of the high concentration 25(OH)D2 samples as demonstrated when Figs. 2C and 2D are compared. Based on the multivariable linear regression, contributions to total 25(OH)D were appropriate for 25(OH)D3 but slightly underestimated for 25(OH)D2 with no contributions from the other metabolites.
DiaSorin –
Three sets of results using the DiaSorin assay were included in this study; however, no results were provided by the assay manufacturer’s laboratory. Only one laboratory (Lab 40–5) using the DiaSorin assay achieved the ≤ |±5%| bias criterion for the 50-sample set (Figure 3B, and Figs. S17C and S17D, ESM). Lab 24 (Fig. S17C, ESM) reported significant positive bias (11% and 16%) for both the 50-sample and 42-sample sets, respectively. The DiaSorin assay showed significant negative bias for the high concentration 25(OH)D2 samples (approximately 15% to 35%). The percentage of individual samples with % mean bias ≤ |±5%| ranged from 14% to 28% for the 50-sample set. Multivariable linear regression analysis indicated that the DiaSorin assay significantly underestimated both 25(OH)D2 and 25(OH)D3 and that 24R,25(OH)2D3 also contributed to the estimate of 25(OH)D. When comparing the DiaSorin assay to a reference LC-MS/MS method, Black et al. [41] found that the DiaSorin was 17% lower than the reference method. A study by de Konig et al. [42] also found that the DiaSorin assay had a significant negative bias (36%) in samples with high 25(OH)D2 levels. Wyness and Straseski [40] observed that the DiaSorin assay had the lowest slope of six assays evaluated indicating under recovery compared to LC-MS/MS.
DIAsource –
Results for the DIAsource assay were available from two laboratories. The DIAsource assay exhibited significant positive bias (from 17% to 37%) for both the 50-sample and 42-sample sets (ESM Figs. S18A and S18B) with only 8% and 16% of the 50 samples falling within ±5% mean bias (Table 3). One of the DIAsource assay results had the lowest R2 value from the linear regression analysis at 0.471 and 0.555 for the 50-sample and 42-sample sets, respectively (Table 2 and ESM Figs. S7A and S7B), and regression analyses produced slopes of 1.28 and 1.66 for the 50- and 42-sample sets, respectively. The contributions to 25(OH)D based on the multivariable regression analysis were inconsistent for the two sets of assay results with a potential contribution from 3-epi-25(OH)D3 (Table 4) for one assay result (Lab 2); however, this metabolite contribution was not found to be significant when the SRMs and PT/EQA samples were included in the regression analysis (ESM Table S5).
Diazyme –
Results for the Diazyme assay were from the intralaboratory study [34]. Diazyme met the ≤ |±5%| criterion for mean % bias and had 20% of the individual samples within ±5%. The samples with high concentrations of 25(OH)D2 had little influence on the mean % bias with only a small change in slope between the 50- and 42-sample sets (ESM Fig. S18C). Both 25(OH)D2 and 25(OH)D3 were similarly underestimated in the 25(OH)D response based on the multivariable regression analysis with no contribution from the other metabolites.
Fujirebio Inc. –
The Fujirebio Inc. assay was part of the intralaboratory study [34], and it met the ≤|±5%| mean bias criterion. The Fujirebio Inc. assay was not significantly biased by the high 25(OH)D2 single-donor samples, and it had a slope near 1.00 from the regression analyses of both the 50-sample and 42-sample sets (ESM Figs. S8C and S8D). Multivariable regression analysis also confirmed that 25(OH)D2 and 25(OH)D3 were equally and appropriately estimated in the 25(OH)D response with no contributions from other metabolites. Elsenberg et al. [26] evaluated the Fujirebio Inc. assay along with four other assays and benchmarked it to the University of Ghent RMP [43] method using 20 reference samples. They found the Fujirebio Inc. assay had a −14% bias compared to the RMP, which is significantly higher than the bias observed in this study (−4%). When comparing their ID LC-MS/MS assay with the ligand binding assays using 52 random patient samples, they observed a bias for the Fujirebio Inc. assay of −7.3% which is in better agreement with this current study [26].
IDS-iSYS –
Three laboratories, including the assay manufacturer’s laboratory, provided results using two different IDS-iSYS kits (see Table 1) with IDS-iSYS-2 as the kit in current use. The two IDS-iSYS kits, which are denoted as IDS-iSYS-1 and IDS-iSYS-2 in Table 1, behaved differently in the performance assessment. All three labs using IDS-iSYS met the % mean bias criterion. However the percentage of individual samples with % mean bias ≤ |±5%| was 8% to 32% for the IDS-iSYS-2 and 24% for the IDS-iSYS-1. The slopes for the linear regression analysis were significantly different for the IDS-iSYS-1 and IDS-iSYS-2 (0.90 vs. 1.3). For the high concentration 25(OH)D2 set, IDS-iSYS-1 (Lab 39) has a −12% bias whereas the two labs using IDS-iSYS-2 have bias of 34% and 44% (ESM Table S4). The study by Elsenberg et al. [26] reported a similar positive bias of 33% for patient samples using the IDS-iSYS assay. In contrast, a recent report by Denimal et al. [44] evaluated the new re-standardized IDS-iSYS assay using DEQAS samples with NIST-assigned values and found the bias compared to the NIST values to be less than 5%. The IDS-iSYS-2 assay significantly overestimates the 25(OH)D2 and underestimates the 25(OH)D3 contribution to the 25(OH)D assay response, whereas the IDS-iSYS-1 underestimates both 25(OH)D2 and 25(OH)D3 and has a contribution from 24R,25(OH)2D3.
IDS-EIA –
Two laboratories reported results using the IDS-EIA assay including the assay manufacturer’s laboratory, and the results varied considerably between the two laboratories with significant positive bias in one laboratory and a negative bias in the second laboratory (Table 3 and Figs. S19A and S19B, ESM) and percentage of individual samples within ±5% was relatively low (12% and 16%). The slope change for the linear regression analysis between the 50- and 42-sample sets was moderate (−0.14 and −0.22). Multivariable linear regression analysis revealed that the assay significantly underestimated both 25(OH)D2 and 25(OH)D3 with a possible contribution from 24R,25(OH)2D3 to the estimate of 25(OH)D.
Roche –
Three laboratories provided results using the Roche assay with all three laboratories meeting the % bias criterion for the 50-sample set with the percentage of individual samples within ±5% ranging from 10% to 34%. However, only one laboratory (Lab 40–11) met the % mean bias criterion for the 42-sample set (Table 3). All three laboratories had significant negative bias for the high 25(OH)D2 samples (10% to 19%, ESM Table S4). The Roche assay had significant change in slope for the regression lines for two laboratories (−0.28) whereas the change for the third lab was only −0.09. Using the Roche assay, contributions of 25(OH)D2 are slightly underestimated in all three laboratories and the 25(OH)D3 is significantly overestimated in two laboratories with no contributions from 3-epi-25(OH)D3 or 24R,25(OH)2D3. Using an earlier version of the Roche assay, Elsenberg et al. [26] observed significantly higher bias (21%) compared to their LC-MS/MS method, and Wyness and Straseski [40] reported that the assay underestimated 25(OH)D2 by about 25%.
Siemens –
Results using the Siemens assay were reported by three laboratories including the assay manufacturer’s laboratory. For the 42-sample sample set, the Siemens assay had small bias (both positive and negative) with only one laboratory slightly outside the ±5% criterion (Table 3); for the 50-sample set only one lab met the mean % bias criterion. The slope for the regression line was significantly influenced by the high 25(OH)D2 samples with a mean change of 0.18. Of the 50 individual samples, 16% to 34% were within ±5% mean bias. All three laboratories had significant positive bias (15% to 21%) for the high 25(OH)D2 concentration samples (Table S4 and Figs. S20D, S21A, and S21B, ESM). Wyness and Straseski [40] also reported that the Siemens assay had a positive bias for 25(OH)D2.
SNIBE Prototype –
Based on two sets of results (including the manufacturer’s laboratory), the SNIBE prototype has a significant positive % mean bias (15% and 28%) and low percentage of individual samples within ±5% (8% and 14%); the positive bias increases when the high concentration 25(OH)D2 samples are removed (Table 3 and ESM Figs. S21C and S21D). The slope change with exclusion of the high concentration 25(OH)D2 was significant for both laboratories (−0.28 and −0.38).The SNIBE prototype assay significantly underestimated 25(OH)D2 with no contributions from the other metabolites. Interestingly, the contribution for 25(OH)D3 for one laboratory was not significant based on the multivariable regression analysis for the 50 samples; however, the 25(OH)D3 as well as the 24R,25(OH)2D3 were found to be significant when the SRMs and PT/ETA samples were included in the regression analysis (Table S6, ESM).
Conclusions
Intercomparison Study 2 significantly improved on the information obtained from the first VDSP intercomparison study not only by the identification of the assays and laboratories but also by the total number of assays evaluated. For Intercomparison Study 1, three of the eight ligand binding assays evaluated achieved ≤ |±5%| bias. In this second study, 16 of 32 ligand binding assays evaluated for the 50 single-donor samples were within ±5% bias. For the 42-sample subset, the results were only slightly different with 13 of 32 assays achieving the bias criterion. With 13 unique ligand binding assays evaluated in Intercomparison Study 2, only 5 assays were consistently within the ±5% bias criterion, i.e., Abbott (5), Bio-Rad (1), Diazyme (1), Fujirebio Inc. (1), and Roche (3) (number in parentheses indicates number of labs using the assay), and 4 assays were consistently outside the ±5% bias criterion (for the 50-sample set), i.e., DIAsource (2), SNIBE prototype (2), IDS-iSYS (3), and IDS-EIA (2). The remaining assays were both within and outside the ±5% bias depending on the laboratory using the assay, i.e., Beckman Coulter (2), bioMérieux (4), DiaSorin (3), and Siemens (3). Based on the relatively low % of individual samples within the ±5% mean % bias observed in this study for ligand binding assays as well as for the LC-MS/MS assays [13], the VDSP should re-evaluate and modify the performance criteria to include a component reflecting this aspect. The results of this interlaboratory comparison study provide the most comprehensive comparison of ligand binding assay performance for determination of serum total 25(OH)D published to date, and it is the only study to assess the impact of 24R,25(OH)2D3 on assay performance using results from a reference measurement procedure.
Supplementary Material
Acknowledgements
The authors acknowledge David L. Duewer (NIST) for his suggestions and discussions regarding multivariable linear regression analysis. Bruno Emanuelli and Angelo Maggio (Care S.r.l), Vincent Chen and Jinyun Yuan (SNIBE), and Manisha Patwardhan (Golwilkar Metropolis Health Services Pvt. Ltd.) are acknowledged for contributing results to this study.
Funding
The Office of Dietary Supplements at the National Institutes of Health (NIH-ODS) provided partial funding for this study to the National Institute of Standards and Technology (NIST).
Footnotes
Publisher's Disclaimer: This Author Accepted Manuscript is a PDF file of a an unedited peer-reviewed manuscript that has been accepted for publication but has not been copyedited or corrected. The official version of record that is published in the journal is kept up to date and so may therefore differ from this version.
Human Subjects Ethics
The National Institute of Standards and Technology Research Protections Office reviewed the protocol for this project and determined that it is “not human subjects research” as defined in 15 CFR 27, the Common Rule for the Protection of Human Subjects. The laboratory study participants agreed to the publication of their measurements data, laboratory identification, and measurement assay platform identification.
Conflict of Interest
S.A. Wise is an Editor of the journal Analytical and Bioanalytical Chemistry and was not involved in peer reviewing this manuscript. Several of the coauthors are employees of companies that produce assays that were evaluated in this study. There are no financial or nonfinancial competing interests for any of the coauthors.
Publisher's Disclaimer: Disclaimer
Certain commercial equipment or materials are identified in this paper to specify adequately the experimental procedure. Such identification does not imply recommendation or endorsement by the National Institute of Standards and Technology or the National Institutes of Health, nor does it imply that the materials or equipment identified are necessarily the best available for the purpose.
References
- 1.Sempos CT, Vesper HW, Phinney KW, Thienpont LM, Coates PM, VDSP (2012) Vitamin D status as an international issue: National surveys and the problem of standardization. Scand J Clin Lab Invest 72:32–40. doi: 10.3109/00365513.2012.681935 [DOI] [PubMed] [Google Scholar]
- 2.Binkley N, Dawson-Hughes B, Durazo-Arvizu R, Thamm M, Tian L, Merkel JM, et al. (2017) Vitamin D measurement standardization: The way out of the chaos. J Steroid Biochem Mol Biol 173:117–121. doi: 10.1016/j.jsbmb.2016.12.002 [DOI] [PubMed] [Google Scholar]
- 3.Binkley N, Krueger D, Cowgill CS, Plum L, Lake E, Hansen KE, et al. (2004) Assay variation confounds the diagnosis of hypovitaminosis D: A call for standardization. J Clin Endocrinol Metab 89 (7):3152–3157. doi: 10.1210/jc.2003-031979 [DOI] [PubMed] [Google Scholar]
- 4.Wise SA, Phinney KW, Tai SSC, Camara JE, Myers GL, Durazo-Arvizu R, et al. (2017) Baseline assessment of 25-hydroxyvitamin D assay performance: A Vitamin D Standardization Program (VDSP) interlaboratory comparison study. J AOAC Int 100 (5):1244–1252. doi: 10.5740/jaoacint.17-0258 [DOI] [PubMed] [Google Scholar]
- 5.Sempos CT, Binkley N (2020) 25-Hydroxvitamin D assay standardization and vitamin D guidelines paralysis. Public Health Nutrition 23 (7):1153–1164. doi: 10.1017/S1368980019005251 [DOI] [PMC free article] [PubMed] [Google Scholar]
- 6.Altieri B, Cavalier E, Bhattoa HP, Perez-Lopez FR, Lopez-Baena MT, Perez-Roncero GR, et al. (2020) Vitamin D testing: advantages and limits of the current assays. European Journal of Clinical Nutrition 74 (2):231–247. doi: 10.1038/s41430-019-0553-3 [DOI] [PubMed] [Google Scholar]
- 7.Bivona G, Lo Sasso B, Iacolino G, Gambino CM, Scazzone C, Agnello L, et al. (2019) Standardized measurement of circulating vitamin D 25(OH)D and its putative role as a serum biomarker in Alzheimer’s disease and Parkinson’s disease. Clin Chim Acta 497:82–87. doi: 10.1016/j.cca.2019.07.022 [DOI] [PubMed] [Google Scholar]
- 8.Bjerg LN, Halgreen JR, Hansen SH, Morris HA, Jorgensen NR (2019) An evaluation of total 25-hydroxyvitamin D assay standardization: Where are we today? J Steroid Biochem Mol Biol 190:224–233. doi: 10.1016/j.jsbmb.2019.03.015 [DOI] [PubMed] [Google Scholar]
- 9.Fraser WD, Tang JCY, Dutton JJ, Schoenmakers I (2020) Vitamin D measurement, the debates continue, new analytes have emerged, developments have variable outcomes. Calcified Tissue International 106 (1):3–13. doi: 10.1007/s00223-019-00620-2 [DOI] [PubMed] [Google Scholar]
- 10.Herrmann M, Farrell CJL, Pusceddu I, Fabregat-Cabello N, Cavalier E (2017) Assessment of vitamin D status - a changing landscape. Clin Chem Lab Med 55 (1):3–26. doi: 10.1515/cclm-2016-0264 [DOI] [PubMed] [Google Scholar]
- 11.Makris K, Sempos C, Cavalier E (2020) The measurement of vitamin D metabolites: part I-metabolism of vitamin D and the measurement of 25-hydroxyvitamin D. Horm-Int J Endocrinol Metab 19 (2):81–96. doi: 10.1007/s42000-019-00169-7 [DOI] [PubMed] [Google Scholar]
- 12.Stokes CS, Lammert F, Volmer DA (2018) Analytical methods for quantification of vitamin D and implications for research and clinical practice. Anticancer Res 38 (2):1137–1144. doi: 10.21873/anticanres.12332 [DOI] [PubMed] [Google Scholar]
- 13.Wise SA, Camara JE, Sempos CT, Burdette CQ, Hahm G, Nalin F, et al. (2022) Interlaboratory comparison of 25-hydroxyvitamin D assays: Vitamin D Standardization Program (VDSP) intercomparison study 2 – Part 1 Liquid chromatography – tandem mass spectrometry (LC-MS/MS) assays – Impact of 3-epi-25-hydroxyvitamin D3 on assay performance. Anal Bioanal Chem, in press [DOI] [PubMed] [Google Scholar]
- 14.Phinney KW, Bedner M, Tai SSC, Vamathevan VV, Sander LC, Sharpless KE, et al. (2012) Development and certification of a Standard Reference Material for vitamin D metabolites in human serum. Anal Chem 84 (2):956–962. doi: 10.1021/ac202047n [DOI] [PMC free article] [PubMed] [Google Scholar]
- 15.Phinney KW, Sempos CT, Tai SSC, Camara JE, Wise SA, Eckfeldt JH, et al. (2017) Baseline assessment of 25-hydroxyvitamin D reference material and proficiency testing/external quality assurance material commutability: A Vitamin D Standardization Program Study. J AOAC Int 100 (5):1288–1293. doi: 10.5740/jaoacint.17-0291 [DOI] [PubMed] [Google Scholar]
- 16.Tai SSC, Nelson MA, Bedner M, Lang BE, Phinney KW, Sander LC, et al. (2017) Development of Standard Reference Material (SRM) 2973 vitamin D metabolites in frozen human serum (high level). J AOAC Int 100 (5):1294–1303. doi: 10.5740/jaoacint.17-0182 [DOI] [PubMed] [Google Scholar]
- 17.Binkley N, Sempos CT, VDSP (2014) Standardizing vitamin D assays: The way forward. J Bone Miner Res 29 (8):1709–1714. doi: 10.1002/jbmr.2252 [DOI] [PMC free article] [PubMed] [Google Scholar]
- 18.Stockl D, Sluss PM, Thienpont LM (2009) Specifications for trueness and precision of a reference measurement system for serum/plasma 25-hydroxyvitamin D analysis. Clin Chim Acta 408 (1–2):8–13. doi: 10.1016/j.cca.2009.06.027 [DOI] [PubMed] [Google Scholar]
- 19.Depreter B, Heijboer AC, Langlois MR (2013) Accuracy of three automated 25-hydroxyvitamin D assays in hemodialysis patients. Clin Chim Acta 415:255–260. doi: 10.1016/j.cca.2012.10.056 [DOI] [PubMed] [Google Scholar]
- 20.Heijboer AC, Blankenstein MA, Kema IP, Buijs MM (2012) Accuracy of 6 Routine 25-Hydroxyvitamin D Assays: Influence of Vitamin D Binding Protein Concentration. Clin Chem 58 (3):543–548. doi: 10.1373/clinchem.2011.176545 [DOI] [PubMed] [Google Scholar]
- 21.Cavalier E, Lukas P, Bekaert AC, Carlisi A, Le Goff C, Delanaye P, et al. (2017) Analytical and clinical validation of the new Abbot Architect 25(OH) D assay: fit for purpose? Clin Chem Lab Med 55 (3):378–384. doi: 10.1515/cclm-2016-0566 [DOI] [PubMed] [Google Scholar]
- 22.Cavalier E, Lukas P, Bekaert AC, Peeters S, Le Goff C, Yayo E, et al. (2016) Analytical and clinical evaluation of the new Fujirebio Lumipulse (R) G non-competitive assay for 25(OH)-vitamin D and three immunoassays for 25(OH) D in healthy subjects, osteoporotic patients, third trimester pregnant women, healthy African subjects, hemodialyzed and intensive care patients. Clin Chem Lab Med 54 (8):1347–1355. doi: 10.1515/cclm-2015-0923 [DOI] [PubMed] [Google Scholar]
- 23.Cavalier E, Lukas P, Crine Y, Peeters S, Carlisi A, Le Goff C, et al. (2014) Evaluation of automated immunoassays for 25(OH)-vitamin D determination in different critical populations before and after standardization of the assays. Clin Chim Acta 431:60–65. doi: 10.1016/j.cca.2014.01.026 [DOI] [PubMed] [Google Scholar]
- 24.Cavalier E, Rousselle O, Ferrante N, Carlisi A, Le Goff C, Souberbielle JC (2013) Technical and clinical evaluation of the VITROS (R) Immunodiagnostic Products 25-OH Vitamin D Total Assay - comparison with marketed automated immunoassays and a liquid chromatography-tandem mass spectrometry method. Clin Chem Lab Med 51 (10):1983–1989. doi: 10.1515/cclm-2013-0138 [DOI] [PubMed] [Google Scholar]
- 25.Moreau E, Bacher S, Mery S, Le Goff C, Piga N, Vogeser M, et al. (2016) Performance characteristics of the VIDAS (R) 25-OH Vitamin D Total assay - comparison with four immunoassays and two liquid chromatography-tandem mass spectrometry methods in a multicentric study. Clin Chem Lab Med 54 (1):45–53. doi: 10.1515/cclm-2014-1249 [DOI] [PubMed] [Google Scholar]
- 26.Elsenberg E, ten Boekel E, Huijgen H, Heijboer AC (2017) Standardization of automated 25-hydroxyvitamin D assays: How successful is it? Clin Biochem 50 (18):1126–1130. doi: 10.1016/j.clinbiochem.2017.06.011 [DOI] [PubMed] [Google Scholar]
- 27.Hutchinson K, Healy M, Crowley V, Loew M (2017) Verification of Abbott 25-(OH)-vitamin D assay on the architect system. Practical Laboratory Medicine 7:27–35. doi: 10.1016/j.plabm.2017.01.001 [DOI] [PMC free article] [PubMed] [Google Scholar]
- 28.Annema W, Nowak A, von Eckardstein A, Saleh L (2018) Evaluation of the new restandardized Abbott Architect 25-OH Vitamin D assay in vitamin D-insufficient and vitamin D-supplemented individuals. J Clin Lab Anal 32 (4). doi: 10.1002/jcla.22328 [DOI] [PMC free article] [PubMed] [Google Scholar]
- 29.Garnett E, Li J, Rajapakshe D, Tam E, Meng QH, Devaraj S (2019) Efficacy of two vitamin D immunoassays to detect 25-OH vitamin D2 and D3. Practical laboratory Medicine 17:e00130. doi: 10.1016/j.plabm.2019.e00130 [DOI] [PMC free article] [PubMed] [Google Scholar]
- 30.Lim YK, Park AJ, Kweon OJ, Choi JH (2019) Performance evaluation and measurement uncertainty determination of the new version of the Abbott Architect 25-OH Vitamin D 5P02 Assay. Am J Clin Pathol 151 (2):209–216. doi: 10.1093/ajcp/aqy131 [DOI] [PubMed] [Google Scholar]
- 31.Camara J, Hoofnagle A, Carter G, Sempos C (2015) Take Two: Gearing up for the next vitamin D commutability study. Clinical Laboratory News (February 1, 2015) [Google Scholar]
- 32.Tai SSC, Bedner M, Phinney KW (2010) Development of a candidate reference measurement procedure for the determination of 25-hydroxyvitamin D3 and 25-hydroxyvitamin D2 in human serum using isotope-dilution liquid chromatography-tandem mass spectrometry. Anal Chem 82 (5):1942–1948. doi: 10.1021/ac9026862 [DOI] [PMC free article] [PubMed] [Google Scholar]
- 33.Tai SSC, Nelson MA (2015) Candidate reference measurement procedure for the determination of (24R),25-dihydroxyvitamin D3 in human serum using isotope-dilution liquid chromatography-tandem mass spectrometry. Anal Chem 87 (15):7964–7970. doi: 10.1021/acs.analchem.5b01861 [DOI] [PubMed] [Google Scholar]
- 34.Wise SA, Camara JE, Sempos CT, Lukas P, Le Goff C, Peeters S, et al. (2021) Vitamin D Standardization Program (VDSP) Intralaboratory study for the assessment of 25-hydroxyvitamin D assay performance. J Steroid Biochem Mol Biol 212:105917. doi: 10.1016/j.jsbmb.2021.105917 [DOI] [PMC free article] [PubMed] [Google Scholar]
- 35.Carter GD, Berry J, Durazo-Arvizu R, Gunter E, Jones G, Jones J, et al. (2018) Hydroxyvitamin D assays: An historical perspective from DEQAS. J Steroid Biochem Mol Biol 177:30–35. doi: 10.1016/j.jsbmb.2017.07.018 [DOI] [PubMed] [Google Scholar]
- 36.Schleicher RL, Sternberg MR, Lacher DA, Sempos CT, Looker AC, Durazo-Arvizu RA, et al. (2016) The vitamin D status of the US population from 1988 to 2010 using standardized serum concentrations of 25-hydroxyvitamin D shows recent modest increases. Am J Clin Nutr 104 (2):454–461. doi: 10.3945/ajcn.115.127985 [DOI] [PMC free article] [PubMed] [Google Scholar]
- 37.Schleicher RL, Sternberg MR, Looker AC, Yetley EA, Lacher DA, Sempos CT, et al. (2016) National estimates of serum total 25-hydroxyvitamin D and metabolite concentrations measured by liquid chromatography-tandem mass spectrometry in the US population during 2007–2010. J Nutr 146 (5):1051–1061. doi: 10.3945/jn.115.227728 [DOI] [PMC free article] [PubMed] [Google Scholar]
- 38.Cavalier E, Wallace AM, Carlisi A, Chapelle JP, Delanaye P, Souberbielle JC (2011) Cross-reactivity of 25-hydroxy vitamin D2 from different commercial immunoassays for 25-hydroxy vitamin D: an evaluation without spiked samples. Clin Chem Lab Med 49 (3):555–558. doi: 10.1515/cclm.2011.072 [DOI] [PubMed] [Google Scholar]
- 39.Cashman KD, Hayes A, Galvin K, Merkel J, Jones G, Kaufmann M, et al. (2015) Significance of Serum 24,25-Dihydroxyvitamin D in the Assessment of Vitamin D Status: A Double-edged Sword? Clin Chem 61 (4):636–645. doi: 10.1373/clinchem.2014.234955 [DOI] [PubMed] [Google Scholar]
- 40.Wyness SP, Straseski JA (2015) Performance characteristics of six automated 25-hydroxyvitamin D assays: Mind your 3s and 2s. Clin Biochem 48 (16–17):1089–1096. doi: 10.1016/j.clinbiochem.2015.08.005 [DOI] [PubMed] [Google Scholar]
- 41.Black LJ, Anderson D, Clarke MW, Ponsonby AL, Lucas RM, Ausimmune Investigator G (2015) Analytical Bias in the Measurement of Serum 25-Hydroxyvitamin D Concentrations Impairs Assessment of Vitamin D Status in Clinical and Research Settings. PLoS One 10 (8). doi: 10.1371/journal.pone.0135478 [DOI] [PMC free article] [PubMed] [Google Scholar]
- 42.de Koning L, Al-Turkmani MR, Berg AH, Shkreta A, Law T, Kellogg MD (2013) Variation in clinical vitamin D status by DiaSorin Liaison and LC-MS/MS in the presence of elevated 25-OH vitamin D-2. Clin Chim Acta 415:54–58. doi: 10.1016/j.cca.2012.09.002 [DOI] [PubMed] [Google Scholar]
- 43.Stepman HCM, Vanderroost A, Van Uytfanghe K, Thienpont LM (2011) Candidate reference measurement procedures for serum 25-hydroxyvitamin D3 and 25-hydroxyvitamin D2 by using isotope-dilution liquid chromatography-tandem mass spectrometry. Clin Chem 57 (3):441–448. doi: 10.1373/clinchem.2010.152553 [DOI] [PubMed] [Google Scholar]
- 44.Denimal D, Roux S, Duvillard L (2018) Evaluation of the new restandardized 25-hydroxyvitamin D assay on the iSYS platform. Clin Biochem 52:156–160. doi: 10.1016/j.clinbiochem.2017.11.011 [DOI] [PubMed] [Google Scholar]
Associated Data
This section collects any data citations, data availability statements, or supplementary materials included in this article.