Abstract
Lead (Pb) is a well-known neurotoxicant and environmental hazard. Recent experimental evidence has linked Pb exposure with neurological deterioration leading to neurodegenerative diseases, such as Alzheimer’s disease. To understand brain regional distribution of Pb and its interaction with other metal ions, we used synchrotron micro-x-ray fluorescence technique (μ-XRF) to map the metal distribution pattern and to quantify metal concentrations in mouse brains. Lead-exposed mice received oral gavage of Pb acetate once daily for 4 weeks; the control mice received sodium acetate. Brain tissues were cut into slices and subjected for analysis. Synchrotron μ-XRF scans were run on the PETRA III P06 beamline (DESY). Coarse scans of the entire brain were performed to locate the cortex and hippocampus, after which scans with higher resolution were run in these areas. The results showed that: a) the total Pb intensity in Pb-exposed brain slices was significantly higher than in control brain; b) Pb typically deposited in localized particles of <10 um2 in both the Pb-exposed and control brain slices, with more of these particles in Pb-exposed samples; c) selenium(Se) was significantly correlated with Pb in these particles in the cortex and hippocampus/corpus callosum regions in the Pb-exposed samples, and the molar ratio of the Se and Pb in these particles is close to 1:1. These results indicated that Se may play a crucial role in Pb-induced neurotoxicity. Our findings call for further studies to investigate the relationship between Pb exposure and possible Se detoxification responses, and the implication in the etiology of Alzheimer’s disease.
Keywords: Lead, Selenium, Synchrotron XRF, Neurotoxicity
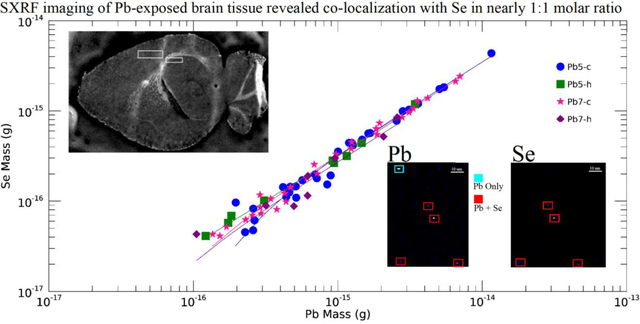
Graphical Abstract
INTRODUCTION
Metal toxicity has long been studied and linked to a number of negative health effects (Chen et al., 2020, 2015; Liu et al., 2021; Strausak et al., 2001), particularly neurological effects (Desai and Kaler, 2008; Miao et al., 2021; Okuda et al., 1997; Shaw and Tomljenovic, 2013; Zhu et al., 2017). One of the most widely present metals in the modern environment, despite its known toxicity, is lead (Pb). The presence of Pb in the environment is due to its extensive uses in modern industry, batteries, petroleum products and paint over the years, in combination with water contamination from Pb pipes. Lead affects many bodily systems, including, but not limited to, renal (Hou et al., 2019; Loghman-Adham, 1997; Wang et al., 2018), cardiovascular (Fewtrell et al., 2004; Navas-Acien et al., 2007), and respiratory (Lu et al., 2018; Mohammed et al., 2015). It has been shown that the main target of Pb toxicity is the nervous system (Chen et al., 2016).
Studies showed that cumulative exposure to Pb is associated with a decline in cognitive performance (Farooqui et al., 2017; Stewart and Schwartz, 2007; Weuve et al., 2009), motor function (Fraser et al., 2006; Wasserman et al., 2000), and possibly neurodegenerative diseases such as Alzheimer’s disease (AD) (Gu et al., 2012; Wu et al., 2008) and Parkinson’s disease (PD) (Coon et al., 2006; Weisskopf et al., 2010). Results by magnetic resonance imaging (MRI) technique revealed a reduced hippocampal volume in Pb-exposed smelting workers compared to age-matched control workers (Jiang et al., 2008). Animal studies showed Pb exposure can either affect the expression of amyloid precursor protein (APP) or inhibit the clearance mechanism and therefore increase beta-amyloid (Aβ) accumulation in both rodent and nonhuman primate models (Basha et al., 2005; Behl et al., 2009; Gu et al., 2012; Wu et al., 2008). Previous X-ray fluorescence studies showed high levels of Pb present in beta amyloid plaques—one of the key indicators of AD (Gu et al., 2012).
Despite the epidemiological evidences to show the association between Pb exposure and neurological effects and neurodegenerative diseases, and the animal studies to show the neurotoxicity of Pb exposure, the mechanism underlying the Pb neurotoxicity is still largely unknown. Several neurotoxicological mechanisms have been proposed including disturbing cell homeostasis by replacing other elements (Ca, Mg, Fe, etc.) (Boskabady et al., 2018), production of free-radicals that induce oxidative stress (Shilpa et al., 2021; Wu et al., 2020), and DNA myelination in AD pathology (Bihaqi, 2019). In this project, we employed a synchrotron micro-x-ray fluorescence (μXRF) technique to investigate the interaction of Pb and other metals, especially selenium (Se) which is a known antioxidant and has been shown to have an antagonistic effect on Pb (Huang et al., 2021; Jin et al., 2017; Yin et al., 2019), in brain and to explore the possible mechanism of Pb neurotoxicity.
Synchrotron μXRF offers high spatial resolution for elemental distribution mapping, on the order of microns or nanometers, with the ability to measure multiple elements in one scan. In addition, SXRF is not destructive. These virtues allow for the preservation of the sample so that it can be used for more than one experiment, if needed. SXRF has a high sensitivity for trace elements of biological importance, which, coupled with its non-destructive characteristics, make it an extremely desirable technique for experiments involving tissue samples. In this study, we used transgenic mice whose brains are known to overexpress with amyloid plaques. By using synchrotron XRF, we scanned brain slices of Pb-exposed and control mice, analyzed metal distributions including Pb and Se distribution, and compared Pb and Se concentrations and distributions in different regions between Pb-exposed and control mice. The results shed light on brain distribution of Pb and its interaction with other metals in transgenic mice with or without subchronic Pb exposure.
MATERIALS AND METHODS
Animals
The Tg-SwDI APP mice were used in the study (Gu et al., 2012). Mice were purchased from the Jackson Laboratory (Bar Harbor, ME) and bred in the laboratory of Animal Center at Indiana University School of Medicine. We are interested in using this model to study the role of Pb in amyloid plaque formation in future studies. Two groups of mice were used: one exposed to Pb and one control group. A total of six animals were raised, with three in each group. Animals were housed in collective cages with 3 animals per cage. They were maintained in a 12-hour light/dark cycle facility with an average temperature of 22°C. They were fed with Envigo Rodent Diet 2018 (Madison, Wisconsin). The datasheet provided by Envigo indicated a Se content of 0.23 mg/kg and a Pb content below the detection limit.
Treatment for both groups began when the mice were two months of age. The mice in the Pb-exposed group orally received 27 mg Pb/kg as 50 mg/kg Pb acetate (Sigma-Aldrich) (PbAc) in 100 μl water once daily for 4 weeks. The animals in the control group received 25 mg/kg of Na-acetate (NaAc). This is a standard procedure in Pb toxicity research to balance the acetate in the Pb dose. This dose regiment was based on a previous study showing Pb-induced cognitive impairment of Tg-SWDI mice (Gu et al., 2012). No animals were lost due to the Pb treatment and no significant changes in body weight were observed compared to the controls. The mice were sacrificed at 3 months of age and brains were extracted. The mice were treated and handled according to the IACUC protocol which was reviewed and approved by the Indiana University Animal Care and Use Committee and the Purdue University Animal Care and Use Committee. This protocol is also in adherence to the ARRIVE guidelines (Kilkenny 2010).
Sample Preparation
Brains were extracted from Pb-exposed and control mice and stored in a −80°C freezer. They were taken out and sliced to 10 μm thin pieces along the sagittal plane using a cryomicrotome. The brain slices were then attached to the surface of a 4 μm Ultralene® thin film (SPEX SamplePrep, New Jersey) which was fixed in a 24 × 36 mm plastic holder. An example of the sample set up is shown in Fig. S1 in the supplemental material.
Four samples were scanned: two Pb-exposed (Pb5 and Pb7) and two control (Ct4 and Ct7), with Pb5 and Pb7 from one Pb-exposed male mouse and Ct4 and Ct7 from one control male mouse. The number refers to the slice of the brain scanned. Samples with minimal damage from the cutting and mounting process were selected and each Pb-exposed sample was best matched with a control sample of similar slice (i.e. Pb5 → Ct4; Pb7 → Ct7).
Samples were kept in a −80°C freezer. Prior to transporting the samples, two (Pb5 and Ct4) were removed from the freezer, air dried, and stored in a room temperature container for approximately 5 days before they were scanned. The remaining samples (Pb7 and Ct7) were kept frozen on dry ice during the transportation process and were air dried immediately before they were scanned.
Experimental Setup
The X-ray fluorescence measurements were performed at the Microprobe endstation of Beamline P06 at the PETRA III storage ring at the Deutsches Elektronen-Synchrotron DESY utilizing a Maia X-ray fluorescence detector system (Falkenberg et al., 2017). The undulator beam was monochromatized by a cryogenically cooled double crystal monochromator at 18 keV, which allows optimum detection of Pb-L X-ray fluorescence. The beam was focused to 1 × 0.6 μm2 (hor. × ver.) using a rhodium (Rh) coated Kirkpatrick-Baez (KB) mirror optic yielding a flux in the focused beam of ~ 2 × 10¹⁰ photons/s. The Maia 384C detector is positioned between the KB system and sample in backscatter geometry with the incident beam passing through a hole in the center of the detector. The detector sensor is a 500 μm thick silicon (Si) monolithic array of 384 detector elements of 1 mm2 area, shown in Fig. S2 in the supplemental material. The detector design is optimized for a target-to-detector sensor distance of 10 mm, which corresponds to a total solid angle of 1.3 sr. The detector sensor is sealed with a 50 μm thick beryllium (Be) window which is recessed in the detector housing. The design distance from the housing to the sample surface is 2 mm. Scans of the 10 μm thick mice brain samples generated several million counts per second in the Maia detector at moderate detector deadtime and energy resolution (< 300 eV FWHM at 5.9 keV). Elements down to atomic number 15 (phosphorus) are detected. Accurate positioning and motion control of the sample is achieved by an encoder-controlled stage system providing 50 mm travel range with 20 nm precision. The incremental encoder signals from the sample stages are fed directly into the Maia control unit to ensure accurate correlation between detector signal and sample position in continuous scanning mode. Dwell times per pixel can be as short as 0.1 ms, but for the mice brain analysis 10–150 ms exposure per scan point was used in order to provide adequate statistics for trace element analysis. For instance, an image of 0.5 × 0.5 mm2 size could be measured in 10 hours with 1 μm2 resolution and 150 ms dwell time.
The slides holding the brain samples were mounted to a holder with sticky tape (Fig. S1). The slide holder was attached to the stage through a magnetic kinematic mount. The samples were mounted normal to the beam to ensure an even scan. Precise alignment of the sample was done under the optical microscope at the beamline. For each sample, a coarse overview scan of the entire sample was performed initially. From this scan, a smaller region of interest was located in the cortex for a finer scan. In the Pb-exposed samples, further smaller regions including the hippocampus and corpus callosum were scanned. For the overview scans, 25 microns and 10 ms were used for the step size and dwell time, respectively. For the finer scans, the step size was 1 micron and the dwell time ranged between 100–150 ms. Scan duration and resolution needed were taken into consideration when choosing the step size, dwell time and overall scan size.
Peak Fitting and Image Processing
Spectral deconvolution and image frames were generated using the GeoPIXE software using a Dynamic Analysis method. Reference metal foils (Mn and Au) were measured for energy calibration and as external standard for quantification. GeoPIXE displays real-time elemental images of the sample during the scan. Quantitative analysis is done after completion of the measurement.
In order to calculate the fluorescence yield, the thickness, density, and chemical formula of the tissue sample and Ultralene film were specified. The tissue is 10 μm thick and is assumed to be equivalent to cellulose (density= 1.5 g/cm3, formula= C6H10O5). The Ultralene film is 4 μm thick and has a density of 0.855 g/cm3 and a chemical formula of C3H6. The samples had the same elemental composition with variation in the concentrationtherefore, the same fit model was applied to all of the samples. From the spectra, dynamic analysis (DA) matrices were generated to create quantitative elemental images.
Elemental distributions images for all the analyzed elements were produced based on the concentrations in each pixel. Element maps were exported in TIFF format displaying counts or areal density loading per pixel. Further processing and presentation of spectral and elemental information including pixel thresholding, particle identification and correlation, and statistical analysis was performed using the program package IDL (L3Harris Geospatial, CO., USA).
RESULTS AND DISCUSSION
Characteristics of brain samples and brain scans
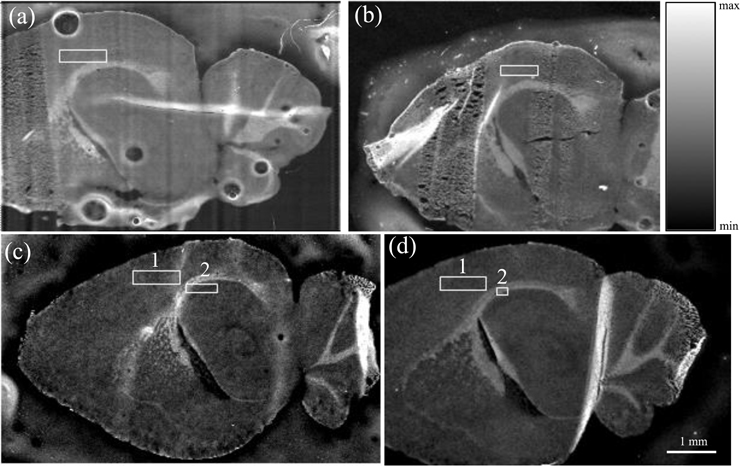
Four samples were scanned, including two from control mice (Ct4, Ct7) and two from Pb-exposed (Pb5, Pb7). All four samples were first scanned in their entirety with a low resolution (25 μm), from which smaller areas were selected for higher resolution (1 μm) scans. An area in the cortex region was scanned in all four samples (suffixed “−c” in later notation), with an additional area scanned in the corpus callosum/hippocampus (suffixed “−h” in later notation) in the two Pb-exposed samples, for a total of 6 higher resolution scans. The regions for the smaller scans are shown with a white box on the coarse scan for each sample in Fig. 1a–1d.
Figure 1. SXRF scans of the four mice brain samples under investigation utilizing the Compton scatter signal.
The locations of the high-resolution scans on the respective coarse scan are indicated. (a). Cortex region of the Ct4 sample. (b). Cortex region of the Ct7 sample. (c). (1) Cortex region of the Pb5 sample, and (2) Hippocampus/corpus callosum region of the Pb5 sample. (d). (1) Cortex region of the Pb7 sample, and (2) Hippocampus/corpus callosum region of the Pb7 sample
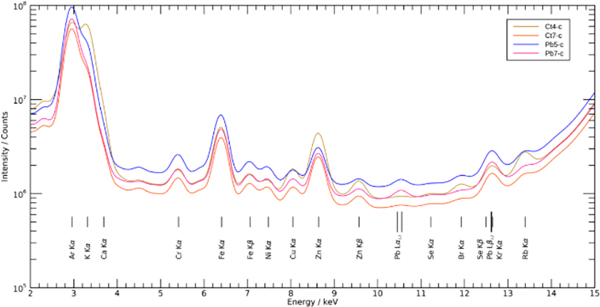
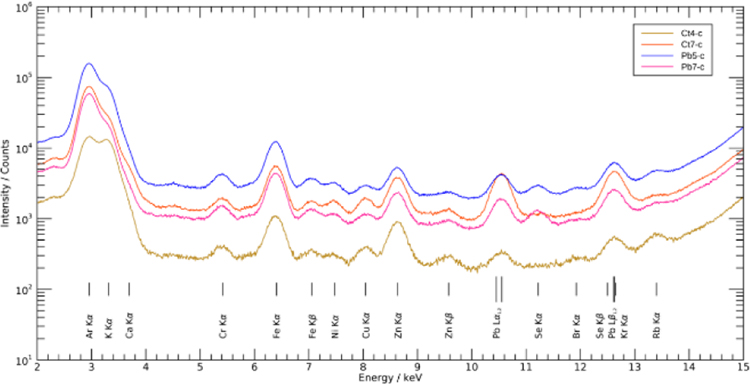
The spectra from all the pixels in the selected cortex and hippocampus/corpus callosum areas, defined in Fig. 1, of the Pb-exposed and control slices were summed together to compare the total Pb intensities. The resulting summed spectra for each cortex scan are shown in Fig. 2. The results revealed the presence of Pb along with other biologically and environmentally relevant elements. The Pb-L X-ray peak at approximately 10.5 keV (Lα1= 10.5515 keV and Lα2= 10.4995 keV) was clearly observed in the Pb-exposed samples, and less so in the control. As the Pb intensity was proportional to the amount of Pb present in the sample, Fig. 2 showed that the amount of Pb deposited in the selected area of cortex in the Pb-exposed mice was much higher than that in the control animals. The Pb Lβ1 and Pb Lβ2 peaks at 12.6137 and 12.6226 keV respectively, overlap the krypton Kα peak, which results from the excitation of the air environment and explains the prominent peak in both the Pb-exposed and control samples.
Figure 2. Summed spectra from all samples in cortex region.
The Pb-L X-ray peak existed at approximately 10.5 keV and a second Pb-L X-ray peak was at 12.6 keV.
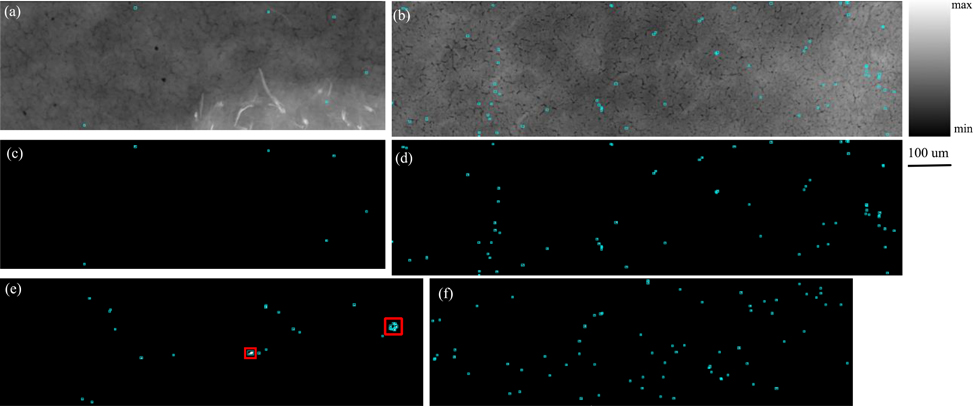
The Pb containing pixels of the scanned arrays were further grouped and analyzed to identify “particles” of Pb. This grouping was performed via a neighbor search of non-zero Pb pixel values in the 8 pixels immediately surrounding a Pb containing pixel. The minimum resultant particle size was 1 pixel. The resulting maps from this analysis for the selected areas are shown in Fig. 3. These images correspond to the regions outlined in the cortex on Fig. 1. Compton images for these regions are also shown for the Ct4-c (Fig. 3a) and Pb5-c (Fig. 3b) samples. Binary mask maps of the Pb particles are shown in Fig. 3c–f. The binary levels were set according to pixel values below (black) and above (white) the Pb minimum detection limit (MDL) of an areal density of 10 ng/cm2. In both the Pb-exposed and control samples, Pb is concentrated in micro scale particles, so the white pixels (determined to be above the MDL) were then outlined by cyan polygons to make them easier to visualize. Pixels below this MDL were excluded from further analysis. Comparing the control (Fig. 3c and 3e) to the Pb-exposed (Fig. 3d and 3f), the number of Pb-containing particles appears visibly greater in the Pb-exposed samples.
Figure 3. Distribution maps from the cortex region of each sample.
Cyan polygons indicate presence of Pb-containing particle. (a). Compton map of Ct4-c (900 × 301 pixels). (b). Compton map of Pb5-c (1210 × 321 pixels). (c). Pb mask image from Ct4-c (900 × 301 pixels). (d). Pb mask image from Pb5-c (1210 × 321 pixels). (e). Pb mask image from Ct7-c, with two regions of interest outlined in red (1000 × 301 pixels). (f). Pb mask image from Pb7-c (1000 × 301 pixels)
Table 1 lists the partical number and mass values of regions of interest (ROI) for cortex scans. It became apparent that, when normalized for scan size, the number of Pb particles per mm2 was much greater in the Pb-exposed samples than controls. The Total Mass of the Pb-containing particles and Mass-density were comparable across the Pb-exposed scans. The disparity between the two controls seemed likely to be attributed to a large Pb particle present in sample Ct7-c. There existed a large Pb particle close to the center of the scan as well as a ring of high-Pb particles on the right side (Fig. 3e, shown in red boxes). The center particle was much greater in size (approximately 50 μm2) than the average and had a high Pb area density. This large particle could be an existing structure that preferentially accumulated Pb molecules. It is possible that structures similar to this one may exist in the other samples, but were missed by the small scan regions. This particle accounted for approximately 76% of the total Pb mass in the scanned sample area. Comparing the Pb-exposed samples to Ct4-c, it was evident that there was more Pb (by both mass and particle density) in the Pb-exposed scans than in Ct4-c.
Table 1.
Particle statistics from cortex scans
| Sample | # Pb Particles | Particle # density (particles/mm2) | Total Mass Pb particles (× 10−15 g) | Mean Mass Pb particles (× 10−15 g) | Mass-density (× 10−15 g/mm2) |
|---|---|---|---|---|---|
| Ct4-c | 6 | 22 | 10.1 | 1.69 | 37.3 |
| Ct7-c | 26 | 86 | 206 | 7.94 | 686 |
| Pb5-c | 69 | 177 | 86.6 | 1.25 | 223 |
| Pb7-c | 69 | 229 | 64.3 | 0.931 | 213 |
Note: values represent the ROI from cortex scans.
There was slight variation in the size and shape of the areas containing Pb particles, however, the majority of such particles were contained within small areas, with an average size of approximately 2 μm2 and an average mass in the order of 1 femtogram (1 × 10 −15 g). Examples of Pb-containing particles from each scan are presented in Fig. S3. It seemed probable and even likely that the pixels were larger than the actual particle size, due to the convolution with the finite beam profile and scan step size. With this areal size, it was also likely the particles did not extend through the full depth of the tissue section (10 μm).
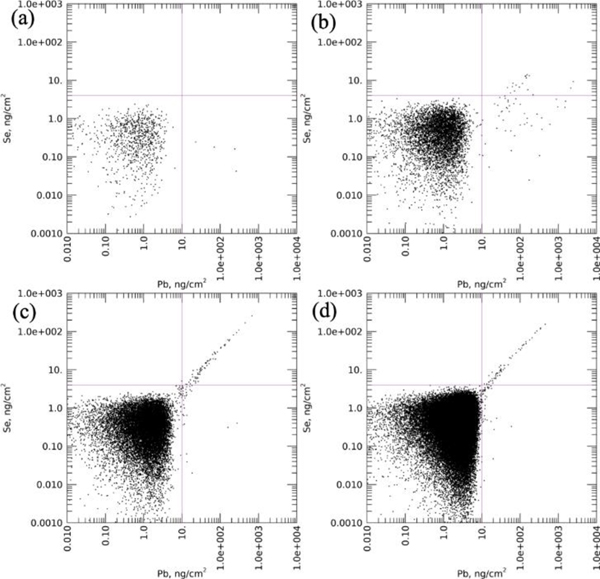
Further investigation of these Pb-containing particles resulted in the discovery of a correlation with Se. The relationship between Se vs. Pb for each sample is shown in association plots of area density per pixel for the two elements (control: Fig.4a,b; exposed: Fig.4c,d). Detection limits were selected of 10 ng/cm2 and 4 ng/cm2 for Pb and Se, respectively, as indicated by the crosshairs. Above these detection limits, a strong linear association between Pb and Se became evident in the Pb-exposed samples particularly at high area densities of both elements, i.e. the upper-right quadrant (Fig. 4c,d). The association was much less strong in the control samples (Fig. 4a,b). The lower right-hand quadrant of these figures showed a number of pixels with high Pb, but with no detectible Se. These high-Pb, low-Se points in Fig. 4b were obtained from the one large particle and a ring of high-Pb particles in Ct7-c (Fig. 3e, shown in red boxes).
Figure 4. Association scatterplots showing Se vs. Pb in the cortex region of all samples.
(a). Ct4-c; (b). Ct7-c; (c). Pb5-c; (d). Pb7-c. The selected detection limits were indicated by crosshairs. A linear correlation can be seen in the Pb-exposed samples.
The spectra from Pb-containing particles with Pb above the MDL were extracted and compared in Fig. 5. The Pb peaks clearly existed in all of the samples, including the control; yet the Se peak was prominent only in the Pb-exposed samples. This unexpected, yet interesting observation suggested that some yet-to-be-identified mechanisms may be activated upon Pb accumulated in brain regions, as suggested by others (Deng et al., 2015; Rastogi et al., 1976).
Figure 5. Spectra from Pb particles above the MDL in scanned cortex region.
The Pb-L X-ray peak existed at approximately 10.5 keV and a second Pb-L X-ray peak was at 12.6 keV. The Se-K X-ray peak existed at approximately 11.2 keV.
The Pb peak observed in the Ct7-c spectrum, when only the Pb particles above the MDL were considered, was comparable to that seen in the Pb-exposed spectra. Again, this was the result of the large Pb particle, described above. Despite this high concentration of Pb in ROI, the concentration of Se was comparable to that seen in Ct4-c, suggesting a different mechanism underlying the observation in the Pb-exposed vs. control brain.
These Pb particles were further discriminated by their Se content: those with any Se above the Se detection limit were deemed overall to contain Se, even if Se was not present in all pixels of the Pb particle. From this point, the Pb particles with Se above the detection limit were referred to as Pb/Se particles, and those with Se below the detection limit, as Pb particles.
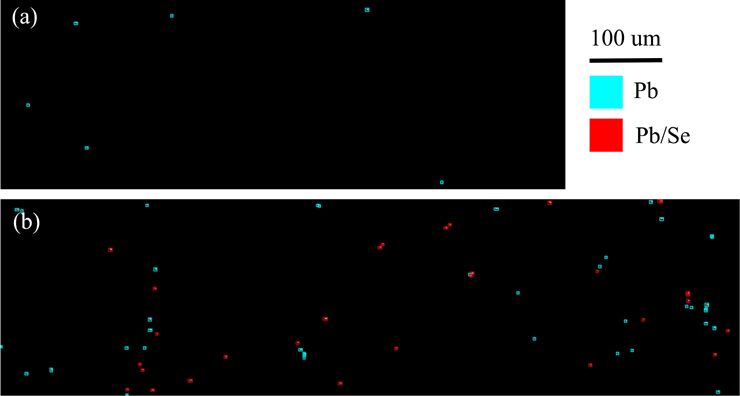
Similar to the distribution maps presented earlier, the data in Fig. 6 present the Pb distribution maps for the Ct4 and Pb5 cortex regions, respectively. Red polygons indicate the presence of Pb/Se particles, whereas cyan indicates Pb with no detectible Se. From these images, we observed that the number of Pb/Se particles was much greater in the Pb-exposed sample, as indicated by the greater number of red polygons in Fig. 6b, than in 6a, where there were no Pb/Se particles observed. The cyan polygons in the Ct4 samples were represented on Fig. 4a by the points in the lower right quadrant. Similar results were observed in the Ct7 and Pb7 samples, with the only difference being the presence of six Pb/Se particles in the Ct7 sample.
Figure 6. Distribution maps from the cortex region of each sample.
Cyan indicates Pb particle with no detectible Se, red indicates Pb particle with Se. (a) Pb mask map from Ct4-c. (b). Pb mask map from Pb5-c.
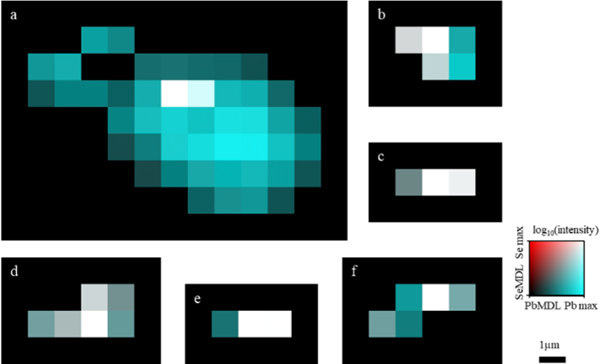
Figure 7 represents typical Pb/Se particles from each sample, with the exception of sample Ct4 because it did not contain any detectible Se. Pixels that appear white have the highest intensity of Pb and Se, whereas pixels with only detectible Pb or Se are shown in cyan or red, respectively. As previously discussed regarding the Pb particles in Figs. S3, the size and shape of particles show very slight variation across all scans, with the majority being small and the particles being contained in area that was, on average, approximately 3 μm2. The large Pb particle observed in Ct7-c previously discussed is shown in Fig. 7a. As mentioned earlier, and indicated by the white pixels, there were Se pixels above the MDL detected within this large particle, suggesting a possible relationship between Pb and Se, albeit different from that observed in the Pb-exposed.
Figure 7. Examples of Pb particles with detectible Se.
(a,b). Examples from Ct7 cortex. (c,d). Examples from Pb5 cortex. (e,f). Examples from Pb7 cortex.
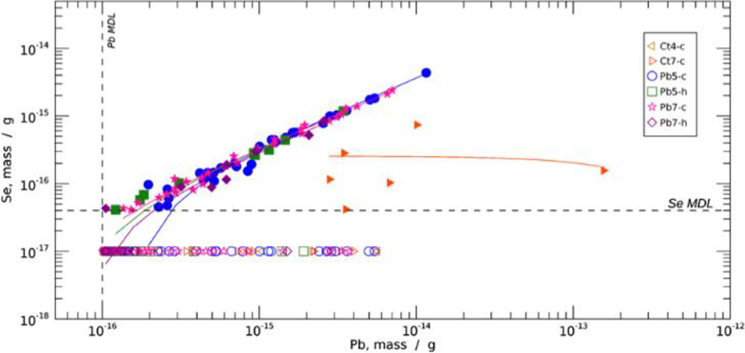
The mass of Pb and Se in each 1 × 1 μm pixel was determined from the areal density of that pixel, and then the masses of each pixel within the particle were summed to determine the total mass of the particle. The relationship between Pb and Se with all identified particles is shown in Fig. 8. The open and filled symbols represent those particles with Se below and above the Se MDL respectively; the Se-below symbols were plotted with an arbitrary, non-zero value of Se (1 × 10⁻¹⁷ g) below the indicated Se detection limit, for visualization on the logarithmic scale. There were no Pb particles containing Se found in the scanned region of sample Ct4.
Figure 8. Scatterplot of Pb vs. Se mass for all detected Pb containing particles.
Pb particles with Se above (filled symbols) and below (open symbols, arbitrary Se value) the Se detection limit. A linear fit has been applied to the Pb/Se particles within each sample, with the linear coefficients indicated in Table 2. The MDLs for each element are as indicated.
The quantitative relationship between Pb and Se was determined with a linear fit, with the linear coefficients shown in Table 2. For all dosed samples, the linear fit to Se and Pb mass in the particles gave gradients in the range 0.28 – 0.35, indicating a strong, consistent correlation of these elements in these samples, and molar mass ratio of these elements approaching 1:1. The intersections of the linear fits is small relative to the MDLs and can essentially be neglected. The six Pb/Se particles of the Ct-7 sample showed Pb content to be independent of Se content. The existence of Se in the high Pb-containing particles does suggest the existence of an unidentified physiological process that controls brain Pb and Se accumulation in these regions, albeit different from one that occurs in the Pb-exposed brain.
Table 2.
Coefficients of lines in Fig. 8
| Sample | Linear fit gradient, Se, Pb, mass | Intersection | Molar ratio |
|---|---|---|---|
| Ct4-c | - | - | - |
| Ct7-c | 3.7 × 10⁻⁴ | 1.03 × 10⁻¹⁶ | - |
| Pb5-c | 0.35 | −3.70 × 10⁻¹⁷ | 0.92 |
| Pb5-h | 0.31 | 1.33 × 10⁻¹⁸ | 0.82 |
| Pb7-c | 0.33 | −1.36 × 10⁻¹⁷ | 0.88 |
| Pb7-h | 0.28 | −7.28 × 10⁻¹⁸ | 0.73 |
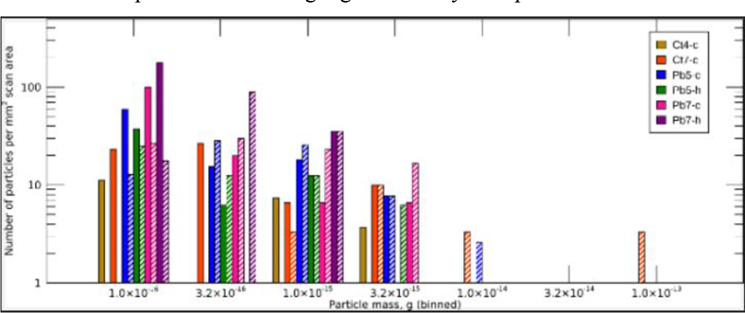
The number density of particles, per mm2 of scan area, compared to the mass of the particles is shown in Fig. 9. Pb particles (solid bars) and Pb/Se particles (hatched bars) are indicated. The particle masses were binned into half-decade bins. The particle numbers were apparently dominated by lighter particles, with the number of particles decreasing logarithmically with particle mass bin.
Figure 9. Pb/Se and Pb particle masses in each sample scan, relative to mm2 of scan area.
Pb particles (solid bars) and Pb/Se particles (hatched bars) are indicated.
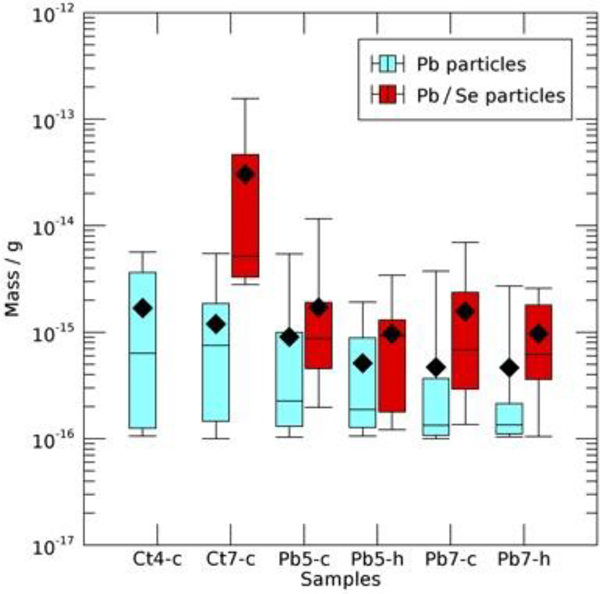
The mass distribution information of Fig. 9 was complemented by a statistical analysis of the distribution of particle masses within each sample scan area, shown in the box-and-whisker plot of Fig. 10. Lead and Pb/Se particles are shown in cyan and red, respectively. The boxes show the middle two quartiles of particle masses either side of the median line, and the whiskers bound the upper and lower quartiles. The mean particle mass is shown by a black diamond. While there was significant overlap in the mass distribution, the bulk of Pb particles appeared to show the tendency towards the lower mass, with lower means, than the Pb/Se particles in the same sample scan area. Typically, the largest particles contained Se.
Figure 10. Box and whisker plots of particles within each sample scan area, presenting quartile ranges of sample sizes.
Pb and Pb/Se particles are indicated in cyan and red respectively, and mean mass values are indicated by black diamonds.
We also observed that for the selected cortex region, brain Pb in Pb-exposed mice was much higher than those in the control animals. Lead largely deposited within very small areas (approximately 2 μm2 on average) with an average mass on the order of 1 femtogram (1 × 10⁻¹⁵ g). The number density of Pb particles present in the Pb-exposed samples was greater than that of controls. Lead strongly correlated with Se in some of these particles, which tended to be heavier. In addition, we found that the number of these Pb/Se particles was greater in the Pb-exposed than the control, the stoichiometric relationship between the two elements was consistent across the Pb-exposed samples and the molar ratio ranged between 0.73 and 0.92. This value was not calculated in the control samples because there did not exist any detectable Pb/Se particles in the scanned region of Ct4-c and Ct7-c did not exhibit a reasonable linear fit gradient.
Pb and Se in hippocampus and corpus callosum regions
The same analysis was performed on the scans of the hippocampus/corpus callosum regions. The region scanned in the sample Pb5 (denoted “Pb5-h”) contained the part of both the hippocampus and corpus callosum, whereas the region in sample Pb7 (denoted “Pb7-h”) contained mainly the corpus callosum. It is important to note that there were not control match scans in this region; thus all results presented were compared to the Pb-exposed cortex regions. Spectral data from these two regions are presented in Fig. S4 where a clear Pb peak was observed. Similar to the cortex regions, the Compton maps are presented in Fig. 11(a,b) for the Pb5-h and Pb7-h, respectively, and in Fig. 11 (c–d) for Pb distribution maps for these regions. Again, the cyan polygons outline particles with an areal density greater than 10 ng/cm2.
Figure 11. Distribution maps from the hippocampus/corpus callosum region of each sample. Cyan polygons indicate presence of Pb-containing particle.
(a). Compton map of Pb5-h (800 × 200 pixels). (b). Compton map of Pb7-h (300 × 200 pixels). (c). Pb mask image from Pb5-h (800 × 200 pixels). (d). Pb mask image from Pb7-h (300 × 200 pixels).
Similar particle statistics are summarized in Table 3 for the Pb-containing particles in the hippocampus/corpus callosum regions. When normalized, the particle and mass densities were much greater in the Pb7-h scan. This could be due to the difference in areas scanned, i.e., Pb5-h contained primarily the hippocampus, while Pb7-h primarily contained the corpus callosum. The Pb-containing particles observed in the hippocampus/corpus callosum were, on average, slightly less massive than those observed in the cortex and contained within in a slightly smaller area (average of 2 μm2).
Table 3.
Particle statistics from hippocampus/corpus callosum scans.
| Sample | # Pb Particles | Particle # density (particles/mm2) | Total Mass Pb particles (× 10−15 g) | Mean Pb Particle Mass (× 10−15 g) | Mass-density (× 10−15 g/mm2) |
|---|---|---|---|---|---|
| Pb5-h | 18 | 111 | 13.3 | 0.738 | 82.6 |
| Pb7-h | 20 | 353 | 13.3 | 0.666 | 236 |
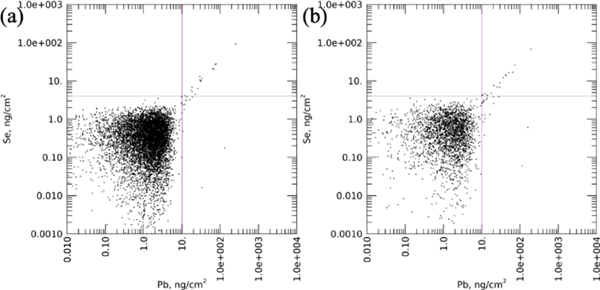
The association of areal density per pixel for Se vs. Pb was plotted for both regions (Fig. 12). The same detection limits of 4 ng/cm2 for Se and 10 ng/cm2 for Pb were used. The results were similar to those seen in the Pb-exposed cortex regions, with a strong correlation between Pb and Se, particularly at high concentrations of the two elements.
Figure 12. Association scatterplots showing Se vs. Pb in the hippocampus/corpus callosum region of Pb-exposed samples.
(a). Pb5-h; (b). Pb7-h. A strong linear correlation is seen.
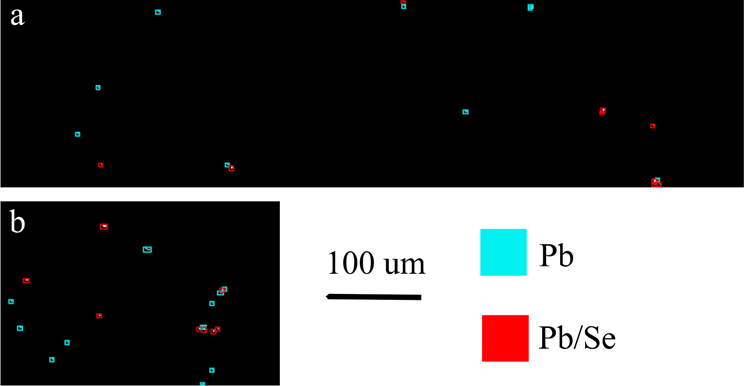
Spectral data for Pb particles above the MDL is presented in Fig. S5; similar to the cortex region, a Se peak was observed in these two samples. The Pb/Se particles are shown in red on Fig. 13, where the cyan polygons represent Pb particles that did not have detectable Se. The results of this analysis were comparable to the results seen in the cortex region.
Figure 13. Distribution maps from the hippocampus/corpus callosum region of each sample.
Cyan indicates Pb particle with no detectible Se, red indicates Pb particle with Se. (a). Pb mask map from Pb5-h. (b). Pb mask map from Pb7-h.
Noticeably, both of these scans were from the Pb-exposed mice. Although there were no control-matched scans to the Pb-exposed hippocampus and corpus callosum regions, the results from these scans again echoed that of the cortex region. Once normalized for scan area, the mass-density of Pb was comparable in both regions and the average mass of Pb particle and area containing the particle were comparable across the two regions. This suggests that Pb deposits in a similar manner in the cortex and hippocampus/corpus callosum regions that were scanned.
Other groups have observed the non-homogenous deposition of Pb in different brain regions in human samples (Zoeger et al., 2005), but the co-deposition of Pb and Se in different regions in Pb-exposed mouse was a new discovery. Previous studies (Rastogi et al., 1976) have shown that higher concentrations of Pb do lead to higher concentrations of Se; but it has not yet been seen that the two elements deposit in the same location.
The reason for this coexistence in the Pb-exposed samples is still unknown, though this relationship has been studied previously (El-Ansary et al., 2017; Othman and el Missiry, 1998; Rastogi et al., 1976). It has been suggested that Se, a known antioxidant, is capable of interacting with Pb in some way to counteract the toxic properties of Pb through selenoprotein P (SEPP). SEPP is responsible for transporting Se across the blood brain barrier (El-Ansary et al., 2017). It is known that SEPP quickly migrated to the brain in Se-starved mice once they were fed with selenocysteine containing compounds. SEPP has been reported by Chen et al. to have metal binding properties, including the ability to bind to Pb (Burk and Hill, 2005). The role of SEPP also extends to invoke glutathione peroxidase function, which is an enzyme that reduces free radical oxygen molecules. Similarly, Se has been shown to have antagonistic properties to Pb (Jiayong et al., 2020; Wu et al., 2020; Yin et al., 2019).
The existing data in literature have also suggested that Se counteracts the toxicity of other heavy metals. For example, the survival of mercury (Hg)-exposed zebrafish larvae significantly increased when pretreated with Se, suggesting that Se reduces the toxic properties of Hg (Dolgova et al., 2019). Other groups have also found that Hg(II) and Se(−II), the two most abundant species of the respective elements, can form inert Hg-Se nanoparticles in the brain (Gajdosechova et al., 2016; Manceau et al., 2021). The formation of such insoluble nanoparticles decreases the bioavailability of Hg, thereby neutralizing the Hg-induced neurotoxicity. It is possible that a similar reaction may be occurring with toxic Pb(II) and Se(−II), as Wu et al. has shown that Se-containing peptides can protect against oxidative damage from Pb(II) (Wu et al., 2020). In both cases, i.e., the HgSe nanoparticles in literature and the particles discovered here, the molar ratio of the two elements was approximately 1:1. Thus, the hypothetical stable Pb-Se complex deserves further investigation.
The result that the Pb:Se molar ratio in the Pb-containing particles of the Pb-exposed samples differs from that observed in the control suggests that there may be a threshold of Pb concentration in the brain, above which the protective mechanisms may be activated to counteract Pb toxicity. Se at high levels is toxic; but at the appropriate level it may detoxify Pb in the brain. The use of Se as a treatment in neurodegenerative diseases has been studied, although the results are inconclusive. Some researchers suggest that Se can attenuate beta-amyloid production and subsequently beta-amyloid induced neurotoxicity (Deng et al., 2015), while others report no preventative outcomes with increased Se intake (Kryscio et al., 2017). Further studies in this line of investigation to explore the precise subcellular co-localization and ensuing interactions between these two metals with regards to their concentration ratios, molecular species, and the exact moiety of Pb-Se complexes in specific brain regions will shed light in understanding the role of Se in protecting against Pb-induced neurotoxicity and possible Pb-associated AD pathoetiology.
CONCLUSION
Through the use of synchrotron micro x-ray fluorescence, different brain regions of a Pb-exposed mouse and a control mouse were scanned for elemental distribution and concentration. The results show a higher concentration of Pb in the brain of Pb-exposed mouse. Lead molecules deposit largely in small particles of brain slices with an average size of 3 μm2. In addition, there is a strong correlation between Pb and Se in these particles, suggesting co-localization of Pb with Se in these particles. These results indicate that Se may play an important role in the detoxification of Pb neurotoxicity.
Future work will be conducted to confirm these results as well as to further investigate the relationship between Pb and Se. Histological and pathological stains will be obtained to fuse with the elemental distribution mapping to determine the structures the elements are deposited in. We also plan to expand our study to include mice that have been exposed to a combination of Pb and Se as well as Se only to further clarify the role Se plays in Pb exposure and neurotoxicity in general.
Supplementary Material
Highlights.
Synchrotron XRF was used to map lead distribution in mouse brain tissue
Lead deposited in small, localized spots (<10 um2) in selected brain regions
Selenium co-localized with lead in brains of exposed mice
Molar ratio of selenium:lead in exposed brains approached 1:1
ACKNOWLEDGEMENTS
Funding: This work was supported by NIH/NIEHS [Grant Number R01 ES027078]; by Purdue Research Foundation, and by the Fulbright Global Scholar Award.
Footnotes
Declaration of interests
The authors declare that they have no known competing financial interests or personal relationships that could have appeared to influence the work reported in this paper.
CONFLICTS OF INTEREST
There are no conflicts to declare.
Publisher's Disclaimer: This is a PDF file of an unedited manuscript that has been accepted for publication. As a service to our customers we are providing this early version of the manuscript. The manuscript will undergo copyediting, typesetting, and review of the resulting proof before it is published in its final form. Please note that during the production process errors may be discovered which could affect the content, and all legal disclaimers that apply to the journal pertain.
DATA AVAILABILITY
The data underlying this article will be shared on reasonable request to the corresponding author.
REFERENCES
- Basha MR, Wei W, Bakheet SA, Benitez N, Siddiqi HK, Ge YW, Lahiri DK, Zawia NH, 2005. The fetal basis of amyloidogenesis: Exposure to lead and latent overexpression of amyloid precursor protein and β-amyloid in the aging brain. Journal of Neuroscience 25, 823–829. 10.1523/JNEUROSCI.4335-04.2005 [DOI] [PMC free article] [PubMed] [Google Scholar]
- Behl M, Zhang Y, Zheng W, 2009. Involvement of insulin-degrading enzyme in the clearance of beta-amyloid at the blood-CSF barrier: Consequences of lead exposure. Cerebrospinal Fluid Research 6, 11. 10.1186/1743-8454-6-11 [DOI] [PMC free article] [PubMed] [Google Scholar]
- Bihaqi SW, 2019. Early life exposure to lead (Pb) and changes in DNA methylation: Relevance to Alzheimer’s disease. Reviews on Environmental Health 34, 187–195. 10.1515/reveh-2018-0076 [DOI] [PubMed] [Google Scholar]
- Boskabady M, Marefati N, Farkhondeh T, Shakeri F, Farshbaf A, Boskabady MH, 2018. The effect of environmental lead exposure on human health and the contribution of inflammatory mechanisms, a review. Environment International 120, 404–420. 10.1016/j.envint.2018.08.013 [DOI] [PubMed] [Google Scholar]
- Burk RF, Hill KE, 2005. Selenoprotein P: An extracellular protein with unique physical characteristics and a role in selenium homeostasis. Annual Review of Nutrition 25, 215–235. 10.1146/annurev.nutr.24.012003.132120 [DOI] [PubMed] [Google Scholar]
- Chen J, Zhang S, Tong J, Teng Xiaojie, Zhang Z., Li S, Teng Xiaohua, 2020. Whole transcriptome-based miRNA-mRNA network analysis revealed the mechanism of inflammation-immunosuppressive damage caused by cadmium in common carp spleens. Science of the Total Environment 717. 10.1016/j.scitotenv.2020.137081 [DOI] [PubMed] [Google Scholar]
- Chen P, Chakraborty S, Peres T. v., Bowman AB, Aschner M, 2015. Manganese-induced neurotoxicity: From C. elegans to humans. Toxicology Research 4, 191–202. 10.1039/c4tx00127c [DOI] [PMC free article] [PubMed] [Google Scholar]
- Chen P, Miah MR, Aschner M, 2016. Metals and Neurodegeneration. F1000Research 5, 1–12. 10.12688/f1000research.7431.1 [DOI] [PMC free article] [PubMed] [Google Scholar]
- Coon S, Stark A, Peterson E, Gloi A, Kortsha G, Pounds J, Chettle D, Gorell J, 2006. Whole-body lifetime occupational lead exposure and risk of Parkinson’s disease. Environmental Health Perspectives 114, 1872–1876. 10.1289/ehp.9102 [DOI] [PMC free article] [PubMed] [Google Scholar]
- Deng Z, Fu H, Xiao Y, Zhang B, Sun G, Wei Q, Ai B, Hu Q, 2015. Effects of selenium on lead-induced alterations in Aβ production and Bcl-2 family proteins. Environmental Toxicology and Pharmacology 39. 10.1016/j.etap.2014.11.010 [DOI] [PubMed] [Google Scholar]
- Desai V, Kaler SG, 2008. Role of copper in human neurological disorders. American Journal of Clinical Nutrition 88, 855–858. 10.1093/ajcn/88.3.855s [DOI] [PubMed] [Google Scholar]
- Dolgova N. v., Nehzati S, Macdonald TC, Summers KL, Crawford AM, Krone PH, George GN, Pickering IJ, 2019. Disruption of selenium transport and function is a major contributor to mercury toxicity in zebrafish larvae. Metallomics. 10.1039/c8mt00315g [DOI] [PubMed] [Google Scholar]
- El-Ansary A, Bjørklund G, Tinkov AA, Skalny A. v., al Dera H, 2017. Relationship between selenium, lead, and mercury in red blood cells of Saudi autistic children. Metabolic Brain Disease 32. 10.1007/s11011-017-9996-1 [DOI] [PubMed] [Google Scholar]
- Falkenberg G, Fleissner Gerta, Fleissner Guenther, Alraun P, Boesenberg U, Spiers K, 2017. Large-scale high-resolution micro-XRF analysis of histological structures in the skin of the pigeon beak. X-Ray Spectrometry. 10.1002/xrs.2769 [DOI] [Google Scholar]
- Farooqui Z, Bakulski KM, Power MC, Weisskopf MG, Sparrow D, Spiro A, Vokonas PS, Nie LH, Hu H, Park SK, 2017. Associations of cumulative Pb exposure and longitudinal changes in Mini-Mental Status Exam scores, global cognition and domains of cognition: The VA Normative Aging Study. Environmental Research 152, 102–108. 10.1016/j.envres.2016.10.007 [DOI] [PMC free article] [PubMed] [Google Scholar]
- Fewtrell LJ, Prüss-Üstün A, Landrigan P, Ayuso-Mateos JL, 2004. Estimating the global burden of disease of mild mental retardation and cardiovascular diseases from environmental lead exposure. Environmental Research 94, 120–133. 10.1016/S0013-9351(03)00132-4 [DOI] [PubMed] [Google Scholar]
- Fraser S, Muckle G, Després C, 2006. The relationship between lead exposure, motor function and behaviour in Inuit preschool children. Neurotoxicology and Teratology 28, 18–27. 10.1016/j.ntt.2005.10.008 [DOI] [PubMed] [Google Scholar]
- Gajdosechova Z, Lawan MM, Urgast DS, Raab A, Scheckel KG, Lombi E, Kopittke PM, Loeschner K, Larsen EH, Woods G, Brownlow A, Read FL, Feldmann J, Krupp EM, 2016. In vivo formation of natural HgSe nanoparticles in the liver and brain of pilot whales. Scientific Reports. 10.1038/srep34361 [DOI] [PMC free article] [PubMed] [Google Scholar]
- Gu H, Robison G, Hong L, Barrea R, Wei X, Farlow MR, Pushkar YN, Du Y, Zheng W, 2012. Increased β-amyloid deposition in Tg-SWDI transgenic mouse brain following in vivo lead exposure. Toxicology Letters 213. 10.1016/j.toxlet.2012.07.002 [DOI] [PMC free article] [PubMed] [Google Scholar]
- Hou G, Surhio MM, Ye H, Gao X, Ye Z, Li J, Ye M, 2019. Protective effects of a Lachnum polysaccharide against liver and kidney injury induced by lead exposure in mice. International Journal of Biological Macromolecules 124, 716–723. 10.1016/j.ijbiomac.2018.11.133 [DOI] [PubMed] [Google Scholar]
- Huang H, Chen J, Sun Q, Liu Y, Tang Y, Teng X, 2021. NLRP3 inflammasome is involved in the mechanism of mitigative effect of selenium on lead-induced inflammatory damage in chicken kidneys. Environmental Science and Pollution Research 28, 10898–10908. 10.1007/s11356-020-11322-w [DOI] [PubMed] [Google Scholar]
- Jiang YM, Long LL, Zhu XY, Zheng H, Fu X, Ou SY, Wei DL, Zhou HL, Zheng W, 2008. Evidence for altered hippocampal volume and brain metabolites in workers occupationally exposed to lead: A study by magnetic resonance imaging and 1H magnetic resonance spectroscopy. Toxicology Letters. 10.1016/j.toxlet.2008.07.009 [DOI] [PMC free article] [PubMed] [Google Scholar]
- Jiayong Z, Shengchen W, Xiaofang H, Gang S, Shiwen X, 2020. The antagonistic effect of selenium on lead-induced necroptosis via MAPK/NF-κB pathway and HSPs activation in the chicken spleen. Ecotoxicology and Environmental Safety 204, 1–8. 10.1016/j.ecoenv.2020.111049 [DOI] [PubMed] [Google Scholar]
- Jin X, Xu Z, Zhao X, Chen M, Xu S, 2017. The antagonistic effect of selenium on lead-induced apoptosis via mitochondrial dynamics pathway in the chicken kidney. Chemosphere 180, 259–266. 10.1016/j.chemosphere.2017.03.130 [DOI] [PubMed] [Google Scholar]
- Kryscio RJ, Abner EL, Caban-Holt A, Lovell M, Goodman P, Darke AK, Yee M, Crowley J, Schmitt FA, 2017. Association of antioxidant supplement use and dementia in the prevention of Alzheimer’s disease by Vitamin E and selenium trial (PREADViSE). JAMA Neurology 74. 10.1001/jamaneurol.2016.5778 [DOI] [PMC free article] [PubMed] [Google Scholar]
- Liu Y, Yu M, Cui J, Du Y, Teng X, Zhang Z, 2021. Heat shock proteins took part in oxidative stress-mediated inflammatory injury via NF-κB pathway in excess manganese-treated chicken livers. Ecotoxicology and Environmental Safety 226, 112833. 10.1016/j.ecoenv.2021.112833 [DOI] [PubMed] [Google Scholar]
- Loghman-Adham M, 1997. Renal effects of environmental and occupational lead exposure. Environmental Health Perspectives. 10.2307/3433873 [DOI] [PMC free article] [PubMed] [Google Scholar]
- Lu J, Jiang H, Liu B, Baiyun R, Li S, Lv Y, Li D, Qiao S, Tan X, Zhang Z, 2018. Grape seed procyanidin extract protects against Pb-induced lung toxicity by activating the AMPK/Nrf2/p62 signaling axis. Food and Chemical Toxicology 116, 59–69. 10.1016/j.fct.2018.03.034 [DOI] [PubMed] [Google Scholar]
- Manceau A, Gaillot AC, Glatzel P, Cherel Y, Bustamante P, 2021. In Vivo Formation of HgSe Nanoparticles and Hg-Tetraselenolate Complex from Methylmercury in Seabirds-Implications for the Hg-Se Antagonism. Environmental Science and Technology. 10.1021/acs.est.0c06269 [DOI] [PubMed] [Google Scholar]
- Miao Z, Zhang K, Bao R, Li J, Tang Y, Teng X, 2021. Th1/Th2 imbalance and heat shock protein mediated inflammatory damage triggered by manganese via activating NF-κB pathway in chicken nervous system in vivo and in vitro. Environmental Science and Pollution Research 28, 44361–44373. 10.1007/s11356-021-13782-0 [DOI] [PubMed] [Google Scholar]
- Mohammed AA, Mohamed FY, El-Okda ES, Ahmed AB, 2015. Blood lead levels and childhood asthma. Indian Pediatrics 52, 303–306. 10.1007/s13312-015-0628-8 [DOI] [PubMed] [Google Scholar]
- Navas-Acien A, Guallar E, Silbergeld EK, Rothenberg SJ, 2007. Lead exposure and cardiovascular disease - A systematic review. Environmental Health Perspectives 115, 472–482. 10.1289/ehp.9785 [DOI] [PMC free article] [PubMed] [Google Scholar]
- Okuda B, Iwamoto Y, Tachibana H, Sugita M, 1997. Parkinsonism after acute cadmium poisoning. Clinical Neurology and Neurosurgery 99, 263–265. 10.1016/S0303-8467(97)00090-5 [DOI] [PubMed] [Google Scholar]
- Othman AI, el Missiry MA, 1998. Role of Selenium against Lead Toxicity in Male Rats. Journal of Biochemical and Molecular Toxicology 12. [DOI] [PubMed] [Google Scholar]
- Rastogi SC, Clausen J, Srivastava KC, 1976. Selenium and lead: Mutual detoxifying effects. Toxicology 6. 10.1016/0300-483X(76)90041-X [DOI] [PubMed] [Google Scholar]
- Shaw CA, Tomljenovic L, 2013. Aluminum in the central nervous system (CNS): Toxicity in humans and animals, vaccine adjuvants, and autoimmunity. Immunologic Research 56, 304–316. 10.1007/s12026-013-8403-1 [DOI] [PubMed] [Google Scholar]
- Shilpa O, Anupama KP, Antony A, Gurushankara HP, 2021. Lead (Pb)-induced oxidative stress mediates sex-specific autistic-like behaviour in Drosophila melanogaster. Molecular Neurobiology. 10.1007/s12035-021-02546-z [DOI] [PubMed] [Google Scholar]
- Stewart WF, Schwartz BS, 2007. Effects of lead on the adult brain: A 15-year exploration. American Journal of Industrial Medicine 50, 729–739. 10.1002/ajim.20434 [DOI] [PubMed] [Google Scholar]
- Strausak D, Mercer JFB, Dieter HH, Stremmel W, Multhaup G, 2001. Copper in disorders with neurological symptoms: Alzheimer’s, Menkes, and Wilson diseases. Brain Research Bulletin 55, 175–185. 10.1016/S0361-9230(01)00454-3 [DOI] [PubMed] [Google Scholar]
- Wang X, An Y, Jiao W, Zhang Z, Han H, Gu X, Teng X, 2018. Selenium Protects against Lead-induced Apoptosis via Endoplasmic Reticulum Stress in Chicken Kidneys. Biological Trace Element Research 182, 354–363. 10.1007/s12011-017-1097-9 [DOI] [PubMed] [Google Scholar]
- Wasserman GA, Musabegovic A, Liu X, Kline J, Factor-Litvak P, Graziano JH, 2000. Lead exposure and motor functioning in 4 1/2 -year-old children: The Yugoslavia prospective study. Journal of Pediatrics 137, 555–561. 10.1067/mpd.2000.109111 [DOI] [PubMed] [Google Scholar]
- Weisskopf MG, Weuve J, Nie H, Saint-Hilaire MH, Sudarsky L, Simon DK, Hersh B, Schwartz J, Wright RO, Hu H, 2010. Association of cumulative lead exposure with Parkinson’s disease. Environmental Health Perspectives 118, 1609–1613. 10.1289/ehp.1002339 [DOI] [PMC free article] [PubMed] [Google Scholar]
- Weuve J, Korrick SA, Weisskopf MA, Ryan LM, Schwartz J, Nie H, Grodstein F, Hu H, 2009. Cumulative exposure to lead in relation to cognitive function in older women. Environmental Health Perspectives 117, 574–580. 10.1289/ehp.11846 [DOI] [PMC free article] [PubMed] [Google Scholar]
- Wu J, Basha MR, Brock B, Cox DP, Cardozo-Pelaez F, McPherson CA, Harry J, Rice DC, Maloney B, Chen D, Lahiri DK, Zawia NH, 2008. Alzheimer’s Disease (AD)-like pathology in aged monkeys after infantile exposure to environmental metal lead (Pb): Evidence for a developmental origin and environmental link for AD. Journal of Neuroscience 28, 3–9. 10.1523/JNEUROSCI.4405-07.2008 [DOI] [PMC free article] [PubMed] [Google Scholar]
- Wu J, Li P, Shi Y, Fang Y, Zhu Y, Fan F, Pei F, Xia J, Xie M, Hu Q, 2020. Neuroprotective effects of two selenium-containing peptides, TSeMMM and SeMDPGQQ, derived from selenium-enriched rice protein hydrolysates on Pb2+-induced oxidative stress in HT22 cells. Food and Chemical Toxicology 135, 1–7. 10.1016/j.fct.2019.110932 [DOI] [PubMed] [Google Scholar]
- Yin K, Yang Z, Gong Y, Wang D, Lin H, 2019. The antagonistic effect of Se on the Pb-weakening formation of neutrophil extracellular traps in chicken neutrophils. Ecotoxicology and Environmental Safety 173, 225–234. 10.1016/j.ecoenv.2019.02.033 [DOI] [PubMed] [Google Scholar]
- Zhu Y, Jiao X, An Y, Li S, Teng X, 2017. Selenium against lead-induced apoptosis in chicken nervous tissues via mitochondrial pathway. Oncotarget 8, 108130–108145. 10.18632/oncotarget.22553 [DOI] [PMC free article] [PubMed] [Google Scholar]
- Zoeger N, Streli C, Wobrauschek P, Jokubonis C, Pepponi G, Roschger P, Bohic S, Osterode W, 2005. Elemental mapping in slices of human brain by SR-μXRF. Powder Diffraction. 10.1154/1.1913725 [DOI] [Google Scholar]
Associated Data
This section collects any data citations, data availability statements, or supplementary materials included in this article.
Supplementary Materials
Data Availability Statement
The data underlying this article will be shared on reasonable request to the corresponding author.


