Abstract
Background:
Chronic pancreatitis (CP) is an inflammatory disease of the pancreas with loss of exocrine/endocrine functions as well as development of fibrosis. Dysbiosis of gut microbiome has been shown to be involved in the pathogenesis of many disease processes. Therefore, we aim to investigate the alteration in gut microbiome associated with CP in caerulein-induced mouse model.
Methods:
CP was induced in C57Bl/6 by using caerulein injections (50 μg/kg/h, i.p., x7, twice weekly for 10 weeks). Stool samples were collected either one week after end of injection (10-week CP) or 6 weeks (16-week CP). DNA was extracted from stool samples and V4 region of 16S rDNA was sequenced for microbiome analysis.
Results:
CP was strongly associated with the alteration in the composition of the gut microbiome, evidenced by differences in α and β diversity. When β diversity was measured using both weighted and unweighted UniFrac distances, stool from control mice is significantly different from mice on 10-week or 16-week CP (q < 0.01). The α-diversity measured by Faith’s phylogenetic diversity was lowest in stool from healthy control and highest in stool from mice with 16-week CP (p < 0.001). Bacteria taxa differentially enriched in CP samples were detected using linear discriminant analysis. Bacteria from genus Bifidobacterium, Akkermansia, and Desulfovibrio were enriched in samples from 10-week CP mice. Bacteria from genus Allobaculum, Prevotella, and Bacteroides were enriched in samples from 16-week CP mice.
Conclusion:
Together, these analyses reveal pronounced alteration in the gut microbiome composition, diversity, and function when mice develop CP.
Keywords: Chronic pancreatitis, microbiome, mouse, 16S sequencing
Introduction
Pancreatitis is an inflammatory disease of the pancreas leading to significant morbidity, mortality, and hospitalization1. Within the US alone, over 300,000 patients are hospitalized every year for pancreatitis and over $2 billion is spent on their care2. Acute pancreatitis (AP) is the most commonly occurring form of pancreatitis1 and is caused by premature intra-acinar activation of trypsinogen and other proteolytic enzymes, resulting in pancreatic acinar injury and an inflammatory response3. Long-term and recurrent AP can progress to chronic pancreatitis (CP). CP is characterized by recurrent process of inflammation with concurrent sequelae of an acute episode and progressive inflammatory and fibrotic changes, along with the destruction of pancreatic structures, leading to impaired functions of exocrine and endocrine4 pancreas. CP typically develops the clinical features of abdominal pain, pancreatic exocrine insufficiency (PEI), and diabetes4, 5. Pain and pain-associated disability distinctly reduces patients’ quality of life and ultimately leads to early death. Known causes of CP include long-time exposure to alcohol and smoking, metabolic and vascular diseases, autoimmune or genetic disorders. However, in a significant proportion of CP cases, the underlying cause remains unclear, and they are labeled as sporadic or idiopathic4–6.
In pancreatic-related diseases, gut microbiota alterations are associated with acute pancreatitis, chronic pancreatitis, and pancreatic cancer6–9. The normal pancreas is not in direct contact with gut microbiota and was previously considered devoid of any microbiome. However, gut microbiota have since been found to be associated with intestinal barrier dysfunction in many diseases, including pancreatitis7, 10. Patients with CP are more likely to suffer from small intestinal bacterial overgrowth (SIBO) due to reduced synthesis of antimicrobial peptides and bicarbonate as well as impaired motility11–13. SIBO treatment has also been found to benefit patients with PEI14, 15. Antimicrobial peptides secreted by pancreatic acinar cells can help maintain gut microbiota homeostasis and barrier function12, 16,17. The gut microbiome change associated with CP has been investigated in several clinical and preclinical studies. Decreased alpha diversity and shifts in beta diversity have been reported in CP patients vs healthy control. Decrease in bacteria from Proteobacteria and increase in Bacteroidetes and Faecalibacterium have also been reported in CP patients7, 18–20. In CP mice, Han et al reported depletion of Lachnospiraceae and Ruminiclostridium and increase of Bacteroides and Alloprevotella genera in CP model induced by ethanol and caerulein combination21. In the current study, we use a caerulein-induced mouse model to investigate the caerulein-associated alteration in diversity, composition, and function of gut microbiota in CP.
Materials and methods
Experimental animals
Wild-type (WT) mice (C57BL/6; 4–6 weeks) were purchased from the Jackson Laboratory (Bar Harbor, Maine, USA). Animals were housed and maintained three to five per cage and maintained on a 12-h light/dark cycle, constant temperature (72 ± 1 °F) and 50% humidity. Food and tap water were available ad libitum. All animal experimental protocols were approved by the Institutional Animal Care and Use Committee at the University of Miami. All procedures were conducted in line with the guidelines set forth by the National Institutes of Health Guide for the Care and Use of Laboratory Animals.
Animal model for chronic pancreatitis
C57BL/6J mice were first randomly divided into 3 groups with 5 to 8 mice per group [Control (n=8), CP10 (n=7) and CP16 (n=5)]. Mice in the CP group were given an intraperitoneal injection of sterile phosphate-buffered saline (PBS) containing caerulein (50μg/kg BW, Bachem, USA), while mice in the control group were injected intraperitoneally with the same volume of PBS. Caerulein was injected 7 times, at hourly intervals, twice a week for 10 weeks to induce chronic pancreatitis (CP10). One week after continuous administration of caerulein for 10 weeks, was euthanized (CP10) while other group of mice was kept for 6 more weeks (CP16). Mice kept in the same group were randomized (group-wise) to discount the cage effect in microbiome studies. Animals were euthanized at different time points according to protocols approved by University of Miami Animal Care Committee. Gut contents were collected aseptically. Pancreas tissues were formalin-fixed for paraffin embedding and histochemical analysis. The severity of CP and regeneration were compared between groups.
Histology
Control, CP10, and CP16 mouse pancreases were fixed in 10% formalin and embedded in paraffin. The sections (5 μm) were cut using microtome and stained with hematoxylin and eosin, and slides were assessed using microscope (Leica microsystems, Germany) at original magnification 10 × 10 and processed in Adobe Photoshop.
Sirius red staining and measurements
Tissue sections were stained using picrosirius red staining solution (Chondrex Inc, WA, USA) according to the manufacturer’s instructions. The sirius red-stained area was quantified using ImageJ software by selecting stained fibers in five fields at a magnification of ×20 under a light microscope.
16S rRNA gene sequencing
Stool samples were collected under aseptic conditions from all mice after sacrificing. DNA was isolated using DNeasy 96 PowerSoil Pro QIAcube HT Kit with QIAcube HT liquid-handling machine (Qiagen, Maryland, USA). Two extraction controls were included to remove potential contamination from samples. Sequencing was performed by the University of Minnesota Genomics Center. The hypervariable regions V4 region of 16S rRNA gene was PCR amplified using the forward primer 515F (GTGCCAFCMGCCGCGGTAA), reverse primer 806R (GGACTACHVGGGTWTCTAAT), Illumina adaptors, and molecular barcodes to produce 427 base pair (bp) amplicons. Amplicons were sequenced with the Illumina MiSeq v.3 platform, generating 300-bp paired-end reads. The extraction controls could not be PCR amplified and were therefore excluded from the sequencing process.
Bioinformatic analysis
Demultiplexed sequence reads were clustered into amplicon sequence variants (ASVs) with the DADA2 package (version 1.16.0)22 implemented in R (version 4.0.3) and RStudio (version 1.4.1106). The steps of the DADA2 pipeline include error filtering, trimming, learning of error rates, denoising, merging of paired reads, and removal of chimeras. On average, 26761 sequence reads per sample were kept after error filtering and other steps (Supplemental Table S1). During trimming, the forward and reverse reads were truncated at positions 230 and 180 to remove low-quality tails. During the learning of error rates, the nbases parameter was set to 1e08. The ASV table generated by DADA2 was imported into the QIIME2 pipeline for diversity analyses and taxonomic assignment23. Diversity analyses were performed by using the qiime diversity core-metrics-phylogenetic script with sampling depth of 10,000. Taxonomic assignment of ASVs was done to the genus level using a naive Bayesian classifier24 implemented in QIIME2 with Greengenes reference database (13_8 99%)25. MicrobiomeAnalyst26 was also used for generating bar plots. LDA Effect Size (LEfSe)27 was generated by uploading the taxonomic assignment table to the galaxy app (https://huttenhower.sph.harvard.edu/galaxy/) to detect differentially abundant taxa across groups. The threshold on the logarithmic LDA score for discriminative features was set to 2. PICRUSt is a computational approach to predict the functional composition of a metagenome using 16S data with reference genomes from Greegenes25 and IMG28 databases. Briefly, gene content was inferred with a precomputed reference OTU tree and a gene content table. Then the metagenome inferences algorithm utilized the user’s input OTU table to identify the corresponding OTU from the reference tree, generating a metagenome table. All prediction was implemented within galaxy app (https://huttenhower.sph.harvard.edu/galaxy/). KEGG orthologs29 was used to predict metagenome. KEGG pathway was categorized to pathway hierarchy level 2. BugBase30 is a microbiome analysis algorithm that predicts high-level phenotypes present in microbiome samples using 16S amplicon data (https://bugbase.cs.umn.edu/documentation.html). Briefly, precalculated files that specify the predicted gene content associations for each OTU were generated using PICRUSt. With user’s OTU table as an input file, BugBase predicts that an OTU possesses a phenotype based on an empirical annotation from databases (IMG28, KEGG29, and PATRIC31).
Statistical analysis
We determined if the within-group (α) diversity differed across treatments using a pairwise Kruskal-Wallis test. Additionally, we determined if between-treatment (β) diversity differed with a pairwise permutational multivariate analysis of variance (PERMANOVA). All other data were analyzed with GraphPad Prism 8. Multiple group comparison was analyzed using one-way analysis of variance (ANOVA) followed by Tukey’s multiple comparisons test.
Data availability
Sequence data are available at the NCBI database under BioProject accession number PRJNA729715.
Ethics statement
All authors had access to all data and have reviewed and approved the final manuscript.
Results
The establishment of chronic pancreatitis (CP) model
The successful establishment of the CP model was confirmed by histology images (Figure S1) as previously reported32. The histology image demonstrated that 10 weeks of caerulein-induced chronic pancreatitis caused severe damage to the pancreas. H&E staining (Figure S1B) showed signs of acinar loss, fibrosis, microscopic duct dilatations, tubular complexes, immune cell infiltration, and edema. The presence of pervasive sirius red staining of collagen in figure S1D showed a substantial amount of collagen, which is indicative of severe fibrosis. Inflammation and fibrosis persisted till 16 weeks and the pancreatic histology of CP16 was not significantly different from CP10 (data not shown).
Altered microbiome diversity during CP
Stool samples were collected for 16S rDNA sequencing to study the perturbation of the microbiome. Among all samples, 492 unique ASVs were identified (Supplemental Table S2). CP was strongly associated with the alteration in the composition of the gut microbiome, evidenced by differences in α (within-sample) and β (between-sample) diversity. When β diversity was measured using both weighted and unweighted UniFrac distances and visualized with principal-coordinate analysis (PCoA) plots, stool from control mice significantly clustered apart from mice on 10-week or 16-week CP (q < 0.01) (Figure 1A, B). Stool from mice on 10-week CP was also significantly different from mice on 16-week CP (q < 0.01) (Figure 1A, B). The α-diversity was measured by Faith’s phylogenetic diversity and visualized with rarefaction plot. The α-diversity was lowest in stool from healthy control and highest in stool from mice with 16-week CP (p < 0.001) (Figure 1C, D). The α-diversity was also significantly lower in stool from mice with 10-week CP than stool from mice with 16-week CP (p < 0.001) (Figure 1C, D). Higher α-diversity demonstrated that more unique bacterial taxa were present in the gut when mice developed CP. Together, these analyses revealed pronounced changes in the gut microbial diversity when mice develop CP.
Figure 1. Alpha and beta diversity of bacteria in CP stool samples.
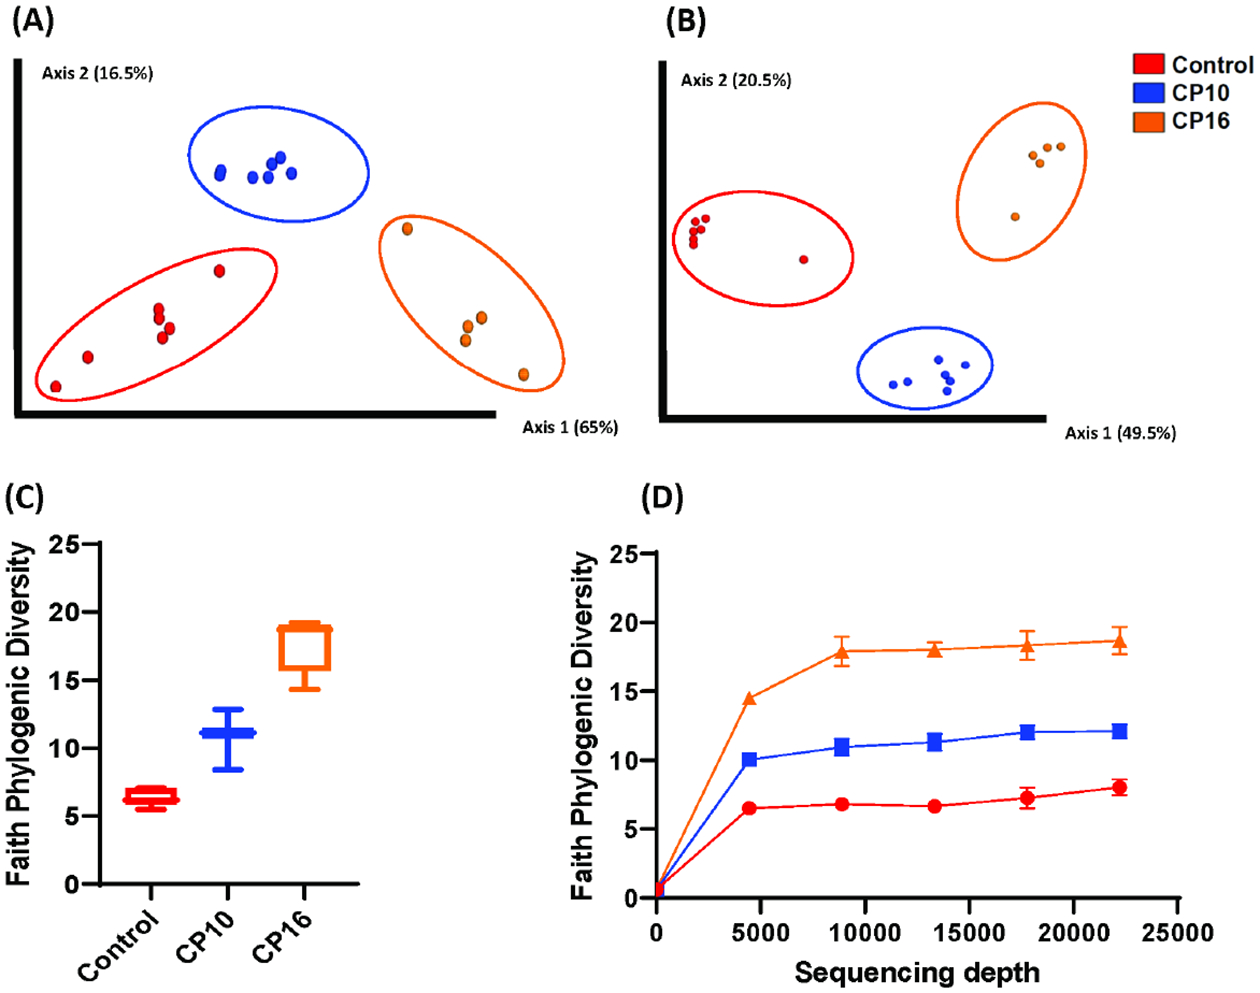
Analysis of α and β-diversity of samples within our study. Samples include control (n=7), CP10 (n=7), CP16 (n=5). (A) Principal coordinates analysis (PCoA) plot of weighted UniFrac distances (metric of β -diversity). q < 0.01 among all three groups. (B) Principal coordinates analysis (PCoA) plot of unweighted UniFrac distances (metric of β -diversity). q < 0.01 among all three groups. (C) Faith Phylogenic Diversity (metric of α-diversity) at sequencing depth 20000. p < 0.001 among all three groups. (D) Rarefaction plot for Faith phylogenetic diversity (metric of α-diversity). Error bars represent SEM.
Altered microbiome composition during CP
Microbial composition analysis was also performed from phylum to genus levels to identify the bacterial taxa that are altered by the development of CP. At the phylum level, 12 bacterial phyla were identified, with Firmicutes, Bacteroidetes, Actinobacteria, and Proteobacteria being the most abundant and Verrucomicrobia, Deferribacteres, TM7, and Tenericutes being less abundant (Figure 2A). The development of CP was significantly associated with the Firmicutes to Bacteroidetes ratio. The ratio was 5.24±1.183 in the control group, having the tendency (P = 0.07) to be higher than the ratio in the CP10 group (2.59±0.46) (Figure S2). The ratio in the control group was significantly higher (P = 0.01) than the ratio in the CP16 group (1.26±0.06) (Figure S2). No significant difference was detected between the CP10 and CP16 groups. A decrease of the Firmicutes to Bacteroidetes ratio indicated proliferation of Bacteroidetes (yellow bar) and decline of Firmicutes (green bar), which can be visually confirmed in Figure 2A. LefSe (Linear Discriminant Analysis (LDA) Effect Size) analysis was also performed among samples to determine the bacterial taxa that were differentially enriched. Indeed, the plot of the LDA score has also confirmed that, compared to the CP10 group, phylum Firmicutes was enriched in the control group (Figure 3A). Similarly, phylum Bacteroidetes was more differentially expressed in CP16 when compared to control (Figure 3B). The change was also significant at the order and family level. Bacteria from family Bacteroidacace, Prevotellaceae, Helicobacteraece, and Rikenellaceae were more abundant in the microbiome of mice from the 16-week CP group than the other two groups (Figure 3D, S3). Similarly, bacteria from family Desulfovibrionaceae were absent from the control sample but were present in high abundance in samples from mice in the 10-week and 16-week CP groups (Figure 3D, S3). In control samples, bacteria from family Lactobacillales and Turicibacteraceae were more abundant than the other two groups. At the genus level, more than 90 different genera were identified. Genera Lactobacillus, Allobaculum, Bifidobacterium, Turicibacter, and an unknown genus from family S24–7 were most abundant (Figure 2B). In control samples, Lactobacillus, Turicibacter, Oscillospira, Coprococcus, and Clostridium were differentially enriched when compared to samples from the CP10 group (Figure 3A). In contrast, Bifidobacterium, Akkermansia, Desulfovibrio, Corynebacterium, Streptococcus, Anaerofustis, and Christensenella were overrepresented in CP10 samples (Figure 3A). As compared to the control, CP16 showed a significant number of changed genera. Allobaclum, Prevotella, Bacteroides, Oscillospira, and Ruminococcus were among the top discriminative genera (Figure 3B). When comparing CP16 to CP10 group, the same group of genera Allobaculum, Prevotella, Bacteroides, Oscillospira, Ruminococcus, and Sutterella was more abundant (Figure 3C).
Figure 2. bacterial composition in stool samples.
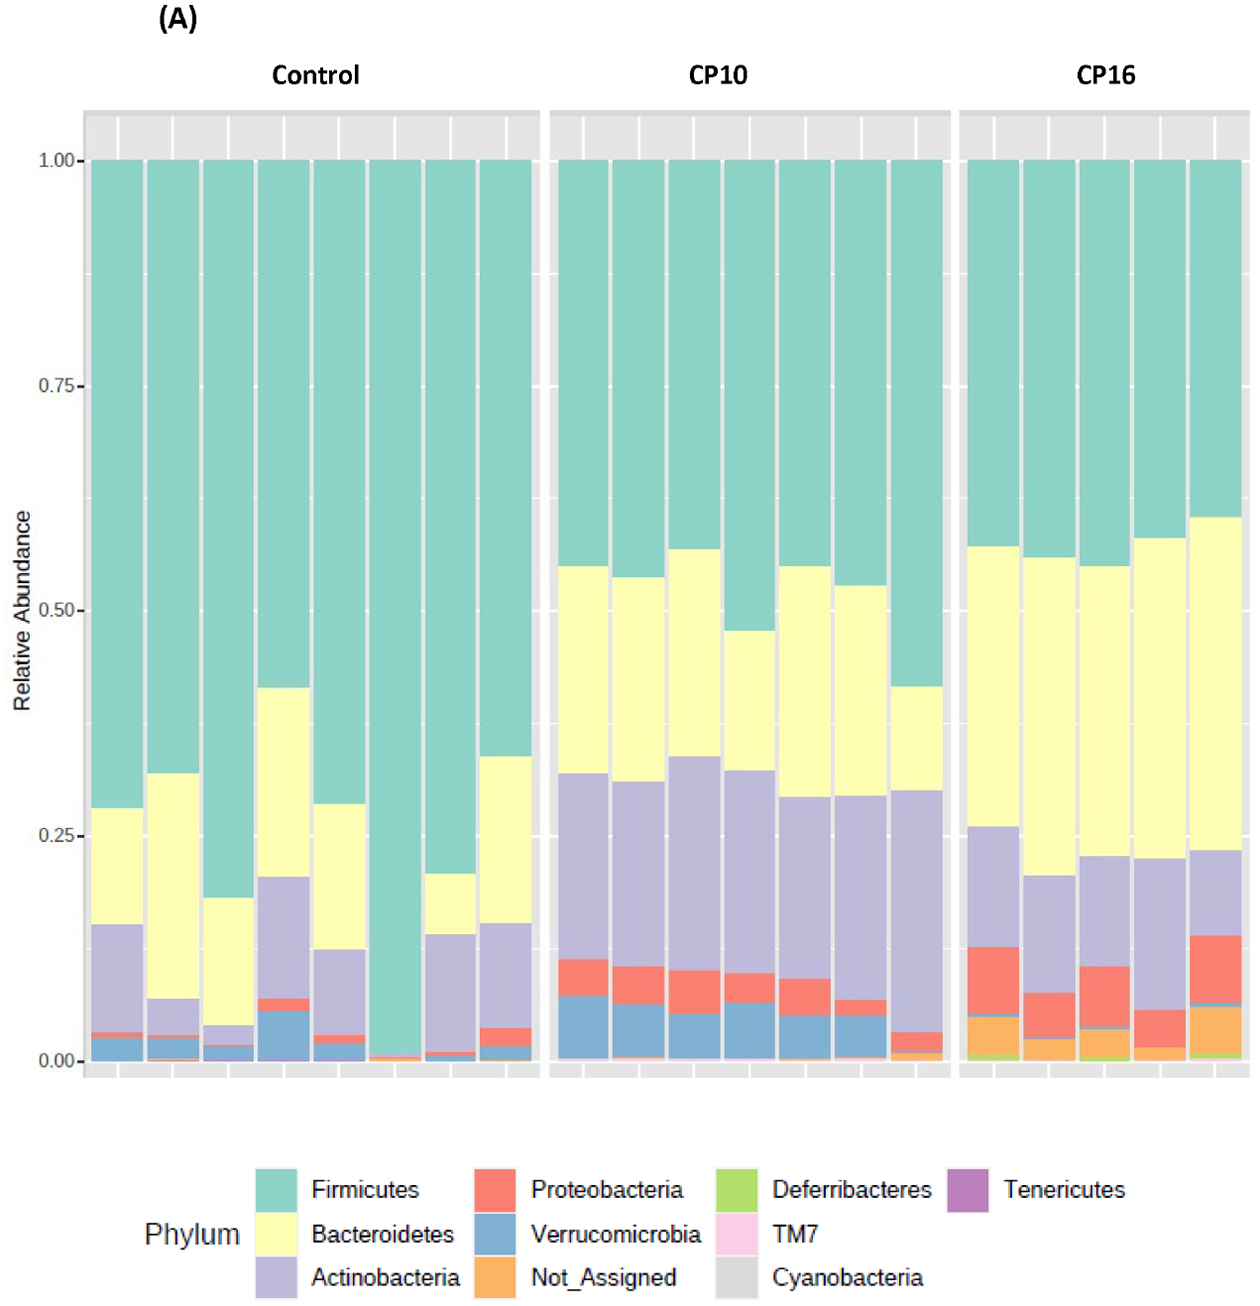
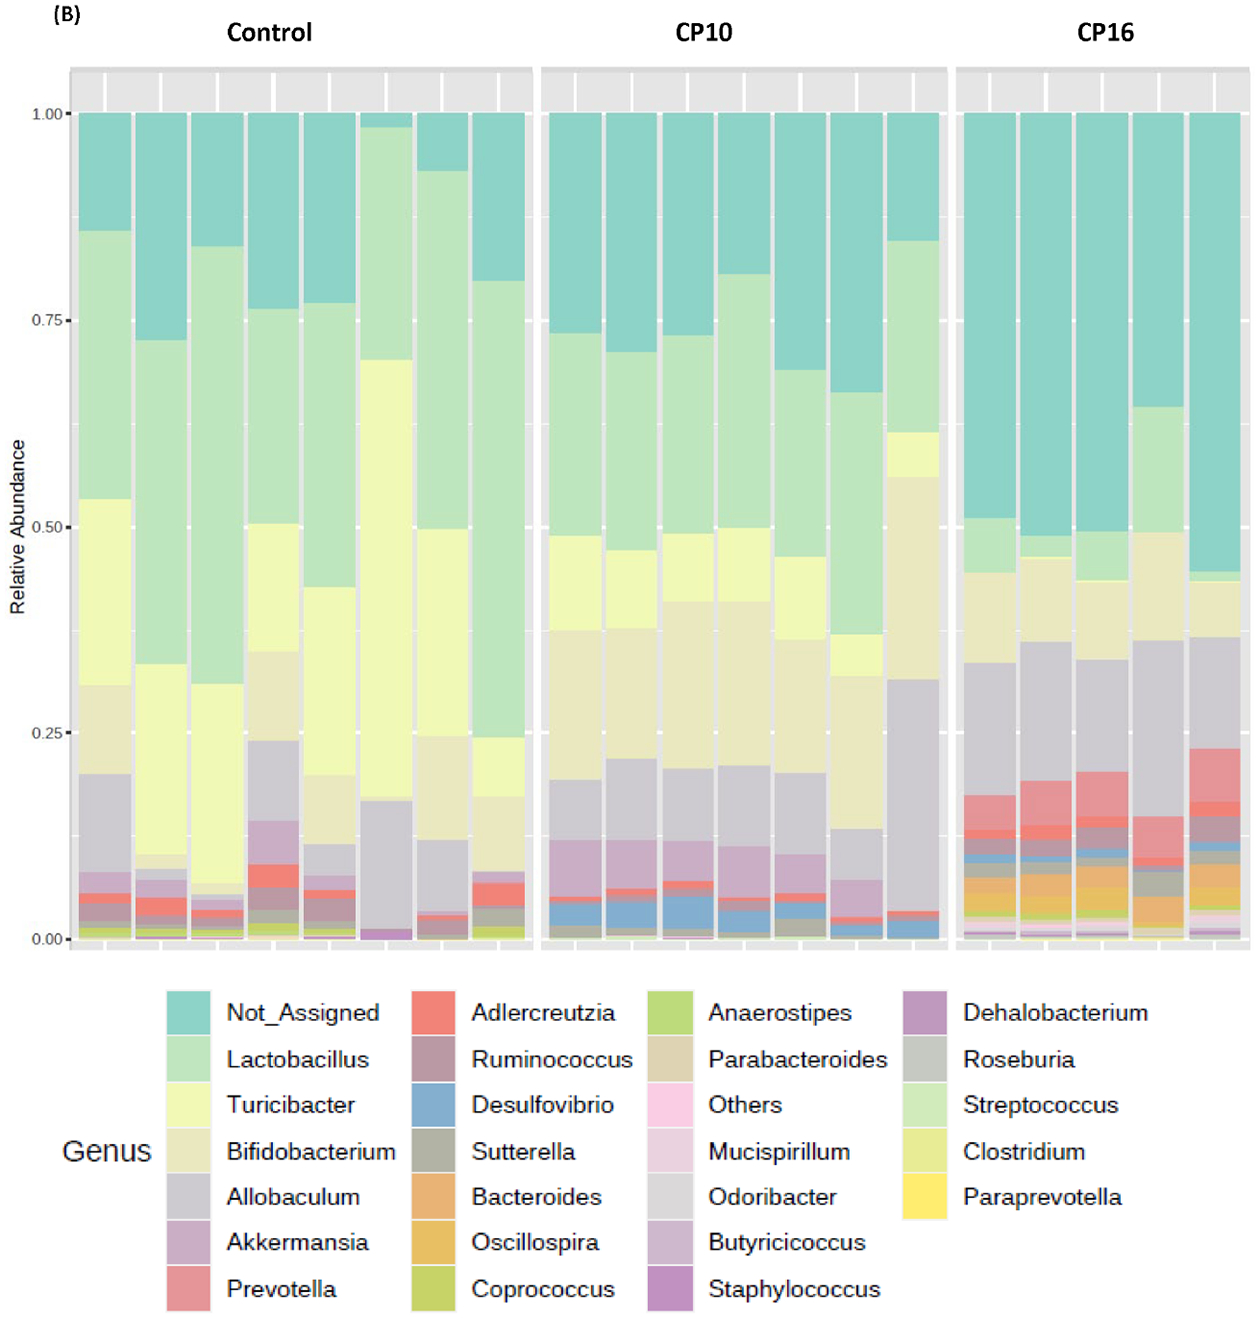
Bacterial composition in stool samples. Samples include control (n=8), CP10 (n=7), CP16 (n=5). (A) OTU relative frequency at the phylum level. (B) OTU relative frequency at the genus level.
Figure 3. LefSe (Linear Discriminant Analysis Effect Size) analysis of bacterial taxa among samples.
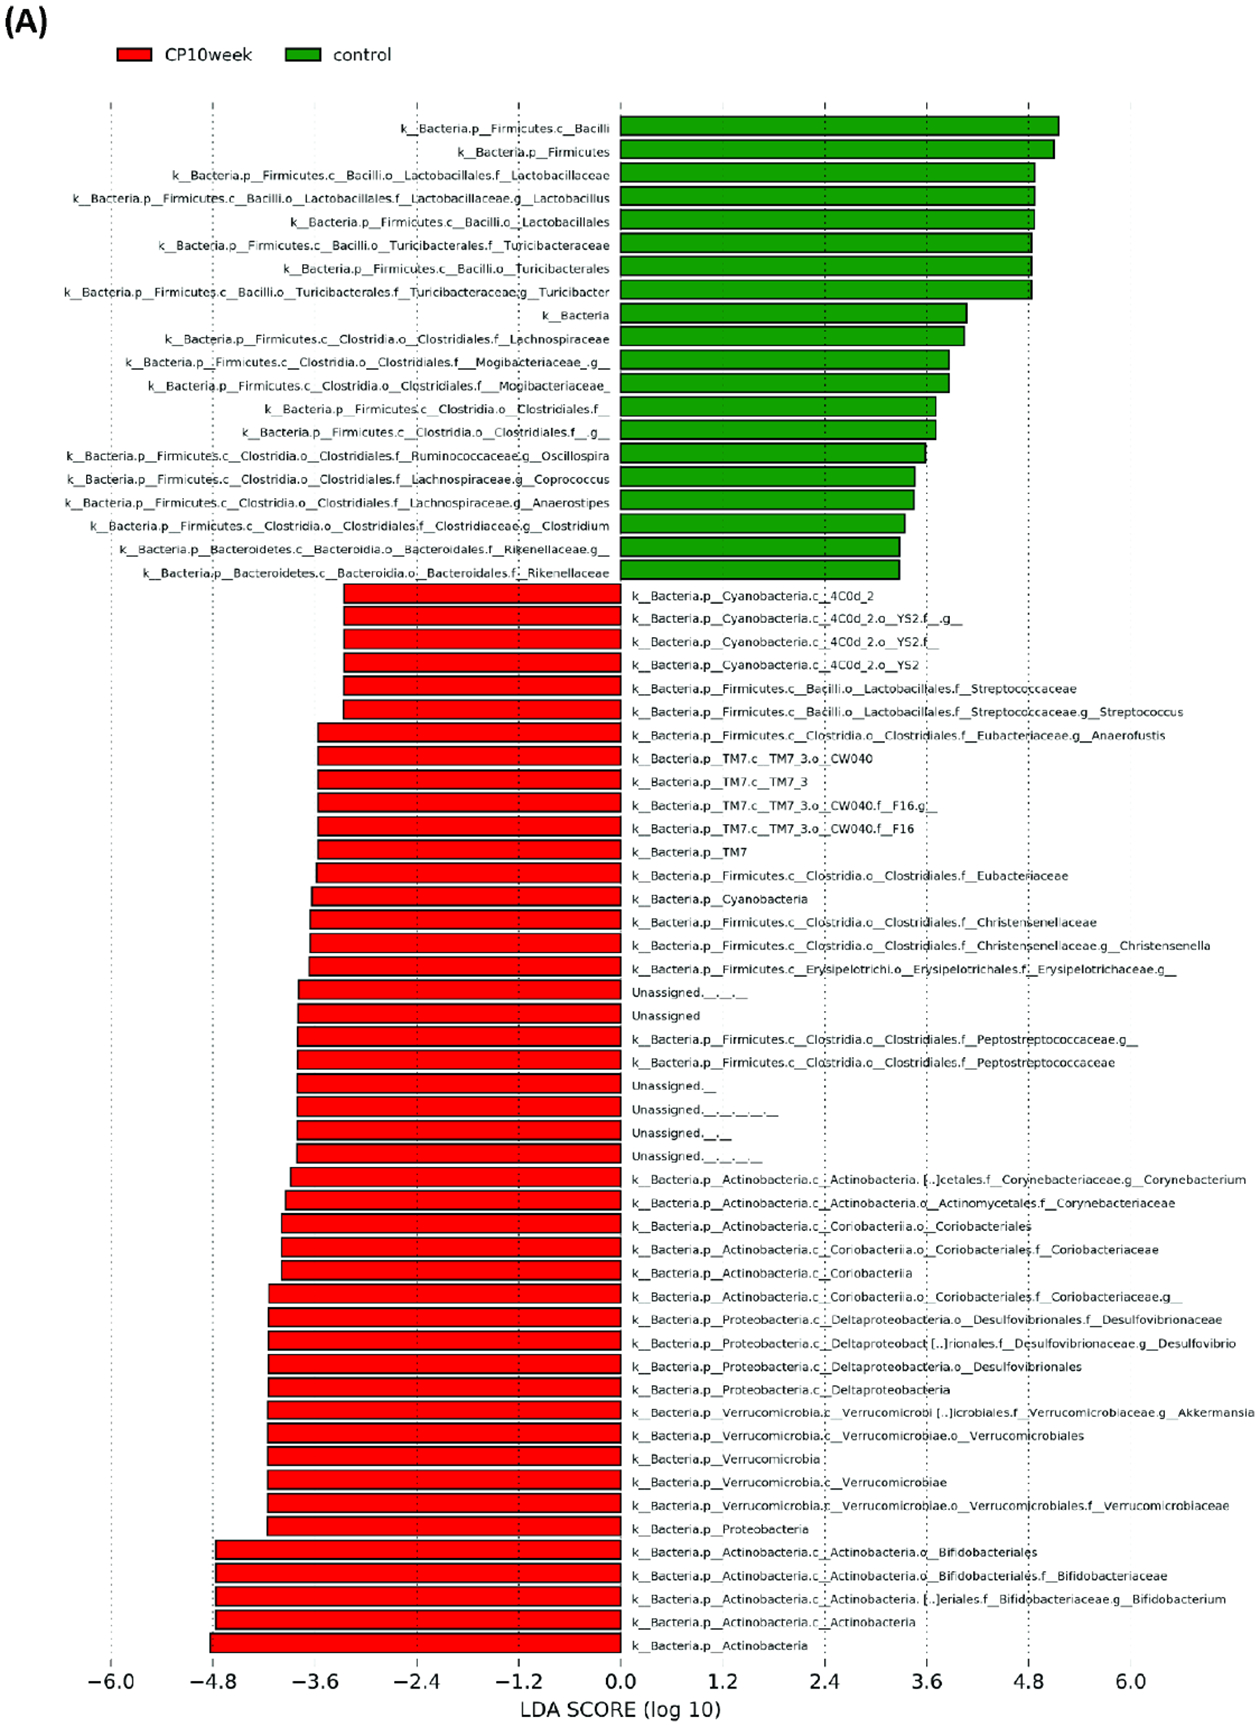
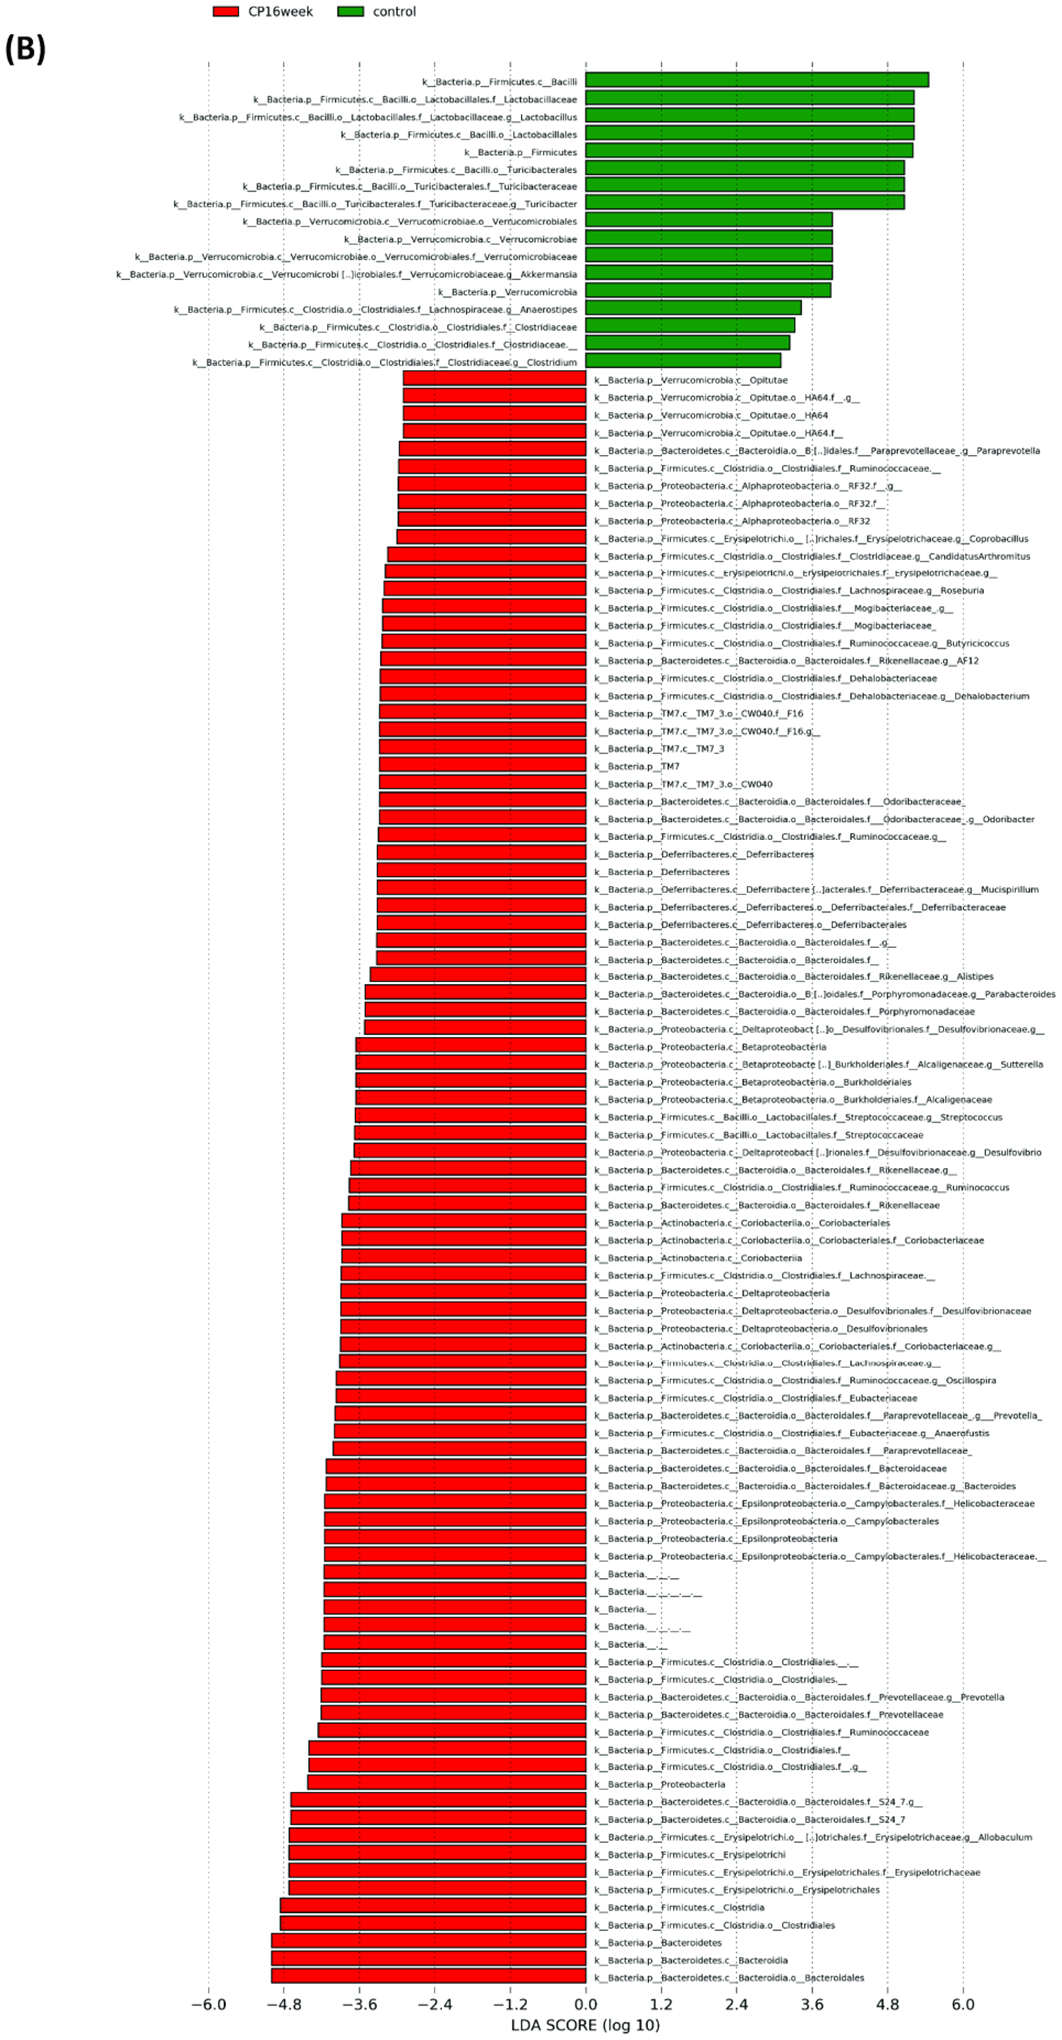
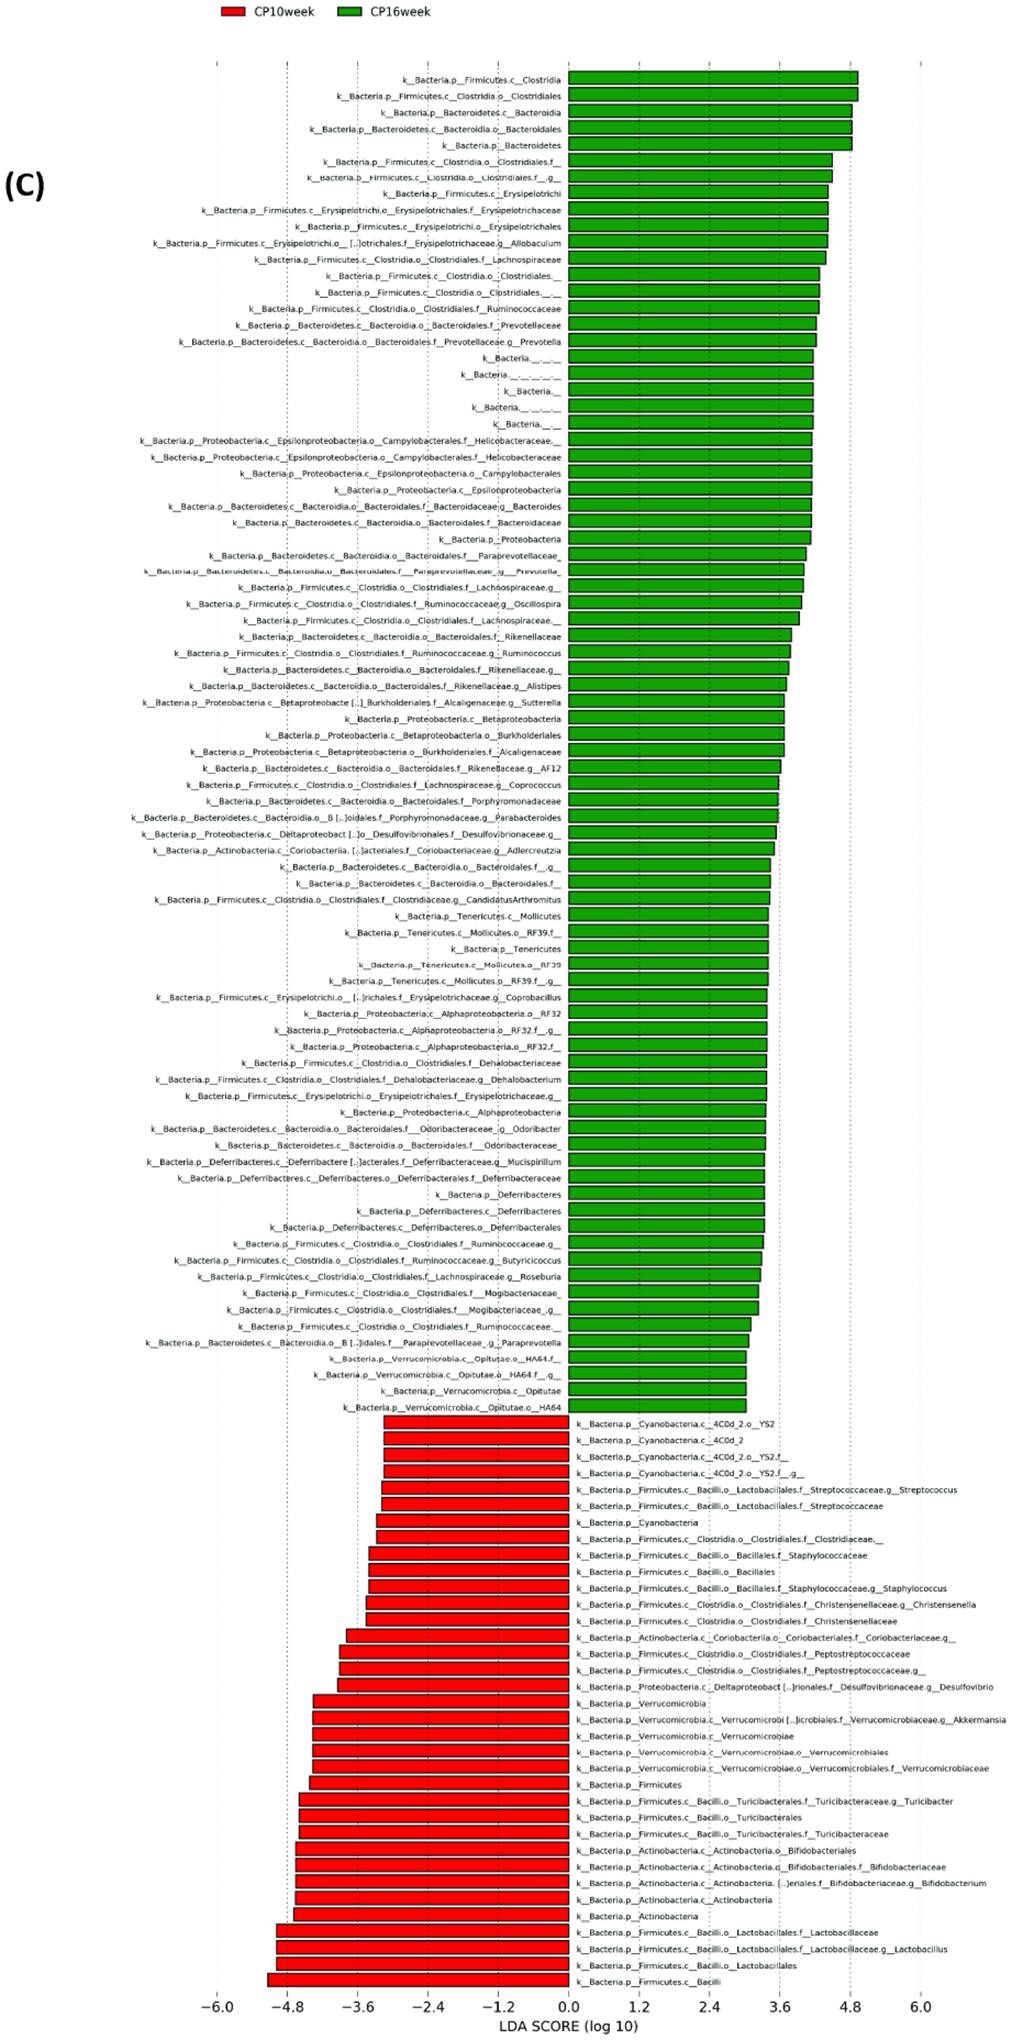
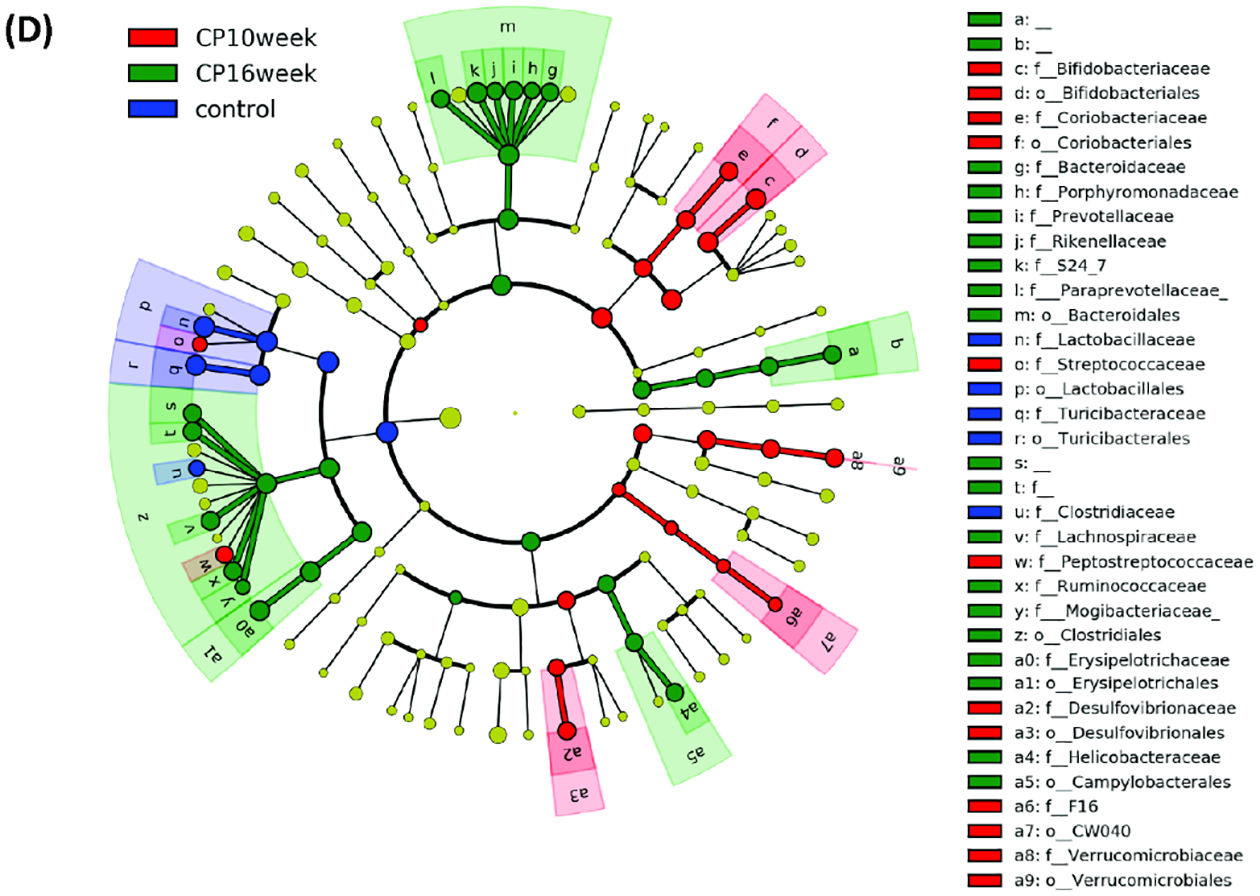
LefSe (Linear Discriminant Analysis Effect Size) analysis of bacterial taxa among samples. (A) Top discriminative bacteria taxa between stool sample from CP10 and stool from control. (B) Top discriminative bacterial taxa between stool sample from CP16 and stool from control. (C) Top discriminative bacterial taxa between stool sample from CP10 and stool from CP16. (D) Cladogram representing the LEfSe results of top differential bacterial taxa among all stool samples. Order and family level taxa were labeled. Empty label names indicated unidentified taxa.
Altered microbial function during CP
To further characterize the impact of CP on the functional gut microbiome, the metagenome was predicted with PICRUSt algorithm (Phylogenetic Investigation of Communities by Reconstruction of Unobserved States) using 16S rRNA gene sequence, and functions were categorized with KEGG pathways. In the predicted gut metagenome from CP10, metabolism of amino acids, glycan, and vitamins were the most up-regulated functions of the gut microbiome when comparing to the control (Figure 4A). The biosynthesis of the secondary metabolites, digestive and excretory system, cell mobility were also notably over-represented compared to the control (Figure 4A). In contrast, membrane transport, replication and repair, and environmental adaption were among the most discriminative functions in the control group as compared to CP10 (Figure 4A). Similarly, in the predicted gut metagenome from CP16, amino acid metabolism, cell mobility, energy metabolism, metabolism of the cofactors, vitamins, glycan as well as biosynthesis of secondary metabolites are up regulated when comparing to the control group (Figure 4B). On the contrary, replication and repair, translation, metabolism of xenobiotics, cellular processes and signaling are the most dominant functions in the control metagenome (Figure 4B). There are also a few differences when comparing the metagenome between the CP10 and CP16 samples. Cell mobility, energy metabolism, metabolism of cofactors, and vitamins are over-represented in the CP16 sample (Figure 4C). On the other hand, replication and repair, xenobiotics metabolism, genetic information processing, lipid metabolism, and terpenoid and polyketide metabolism are most abundant in the CP10 samples (Figure 4C).
Figure 4. The functionality of the gut microbiota was predicted using PICRUSt.
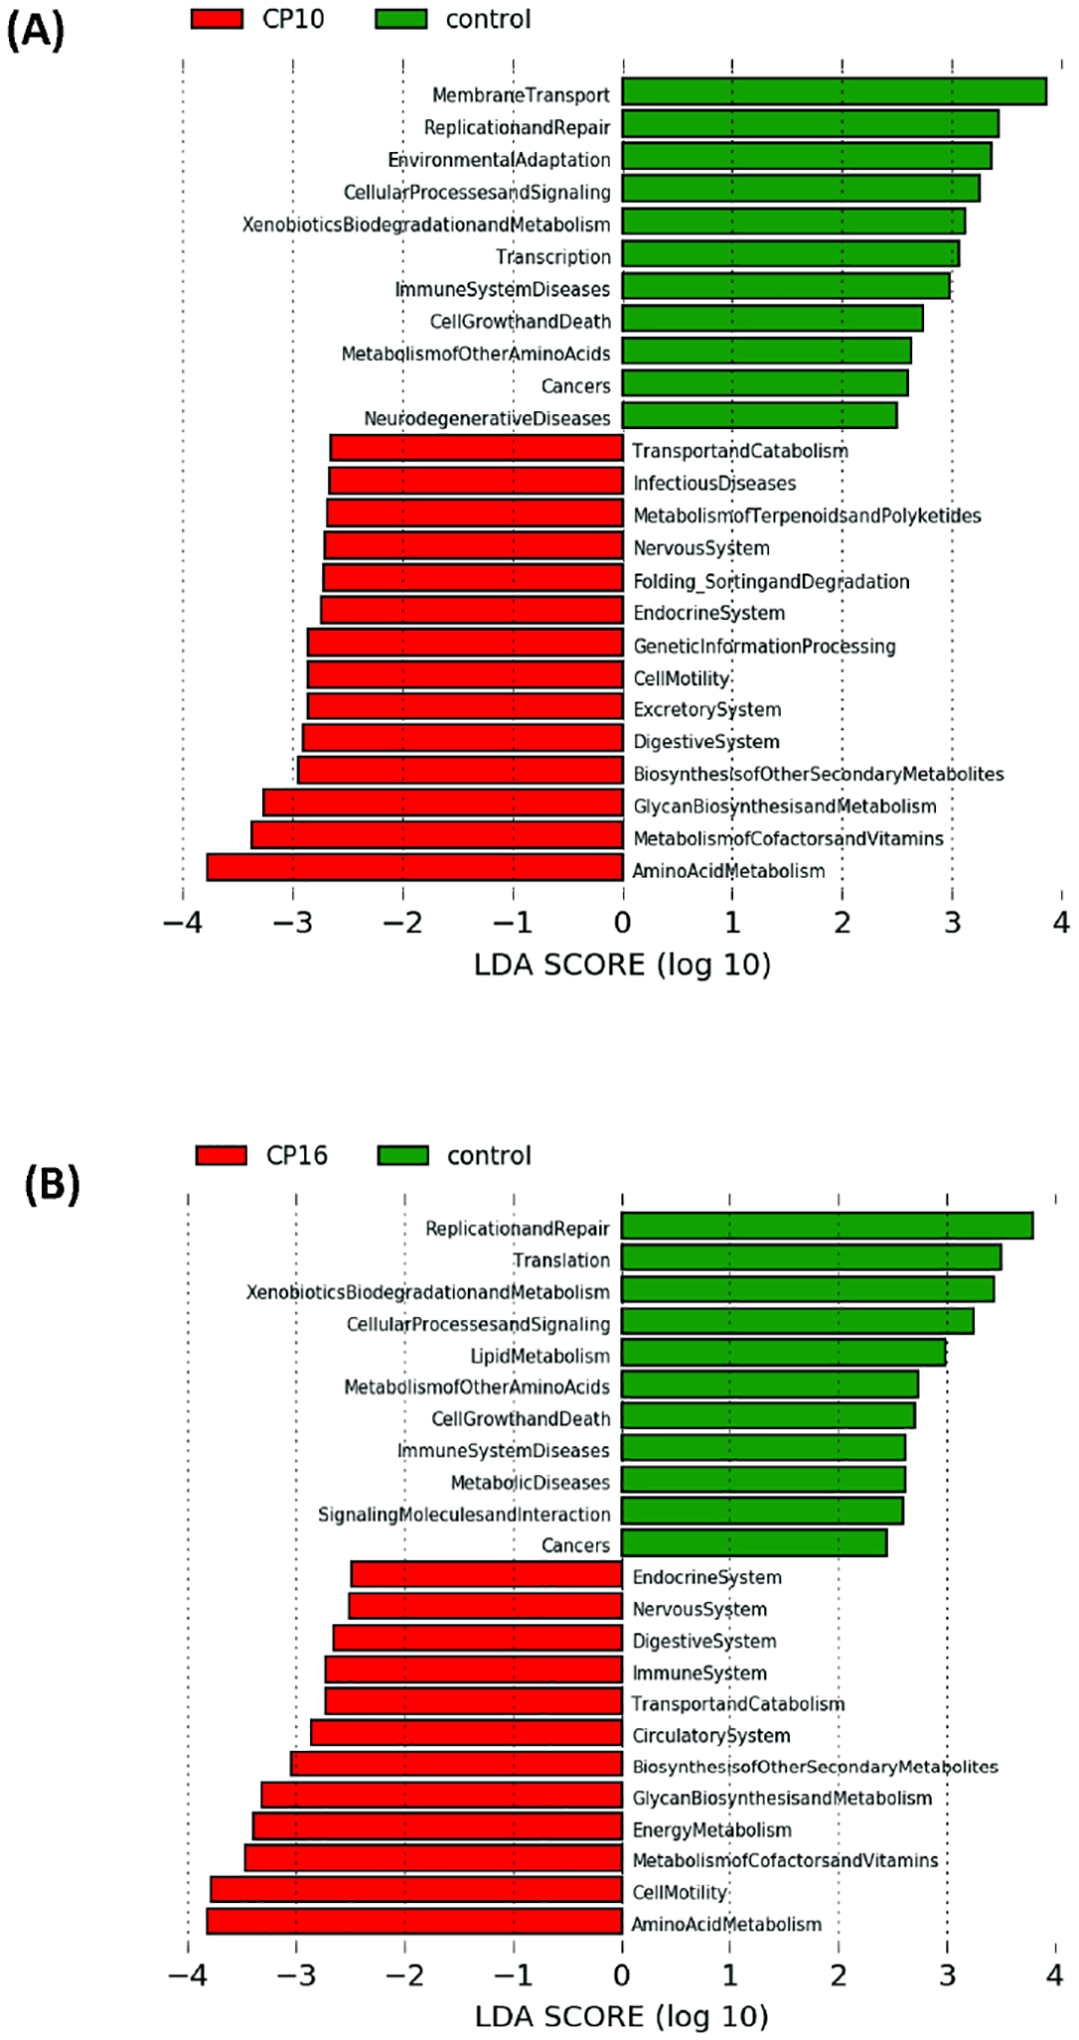
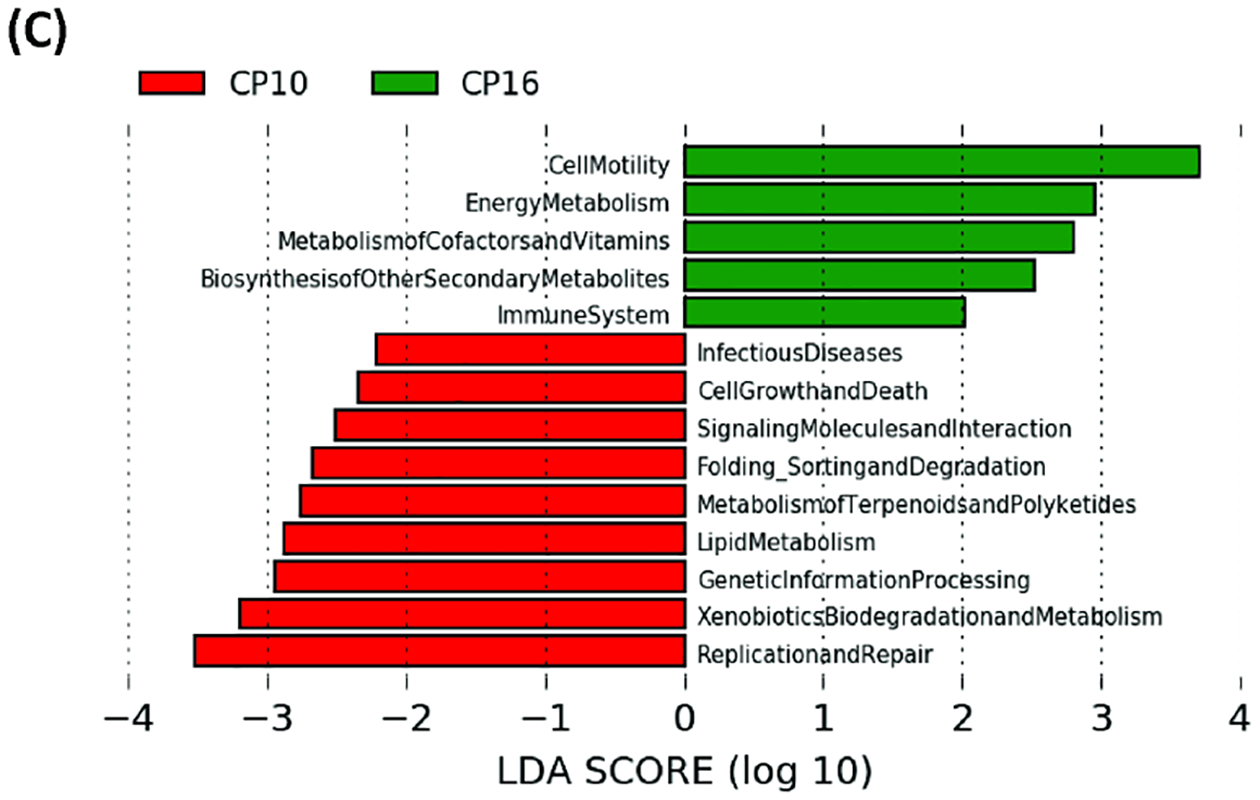
The functionality of the gut microbiota was predicted using PICRUSt (Phylogenetic Investigation of Communities by Reconstruction of Unobserved States). Data are presented in a histogram with Linear LefSe (Linear Discriminant Analysis Effect Size) analysis between groups. (A) Between stool from CP10 and stool from control. (B) Between stool from CP16 and stool from control. (C) Between stool from CP10 and stool from CP16.
BugBase software was used to predict high-level microbial phenotypes. The control sample had the highest proportion of Gram-positive bacteria as compared to CP10 and CP16 samples (p < 0.05) (Figure 5A). The relative abundance of Gram-positive bacteria did not differ between CP10 and CP16 samples (p = 0.4) (Figure 5A). The predicted relative abundance of Gram-negative bacteria had the opposite percentage as expected, with the control sample having a lower number than CP10 or CP16 (p < 0.05) (Figure 5B). Similarly, the relative abundance of Gram-negative bacteria did not differ between CP10 and CP16 samples (p = 0.43) (Figure 5B). The CP16 sample had a higher abundance of anaerobic bacteria than CP10 (p < 0.01) or control (p < 0.01) (Figure 5C). The CP10 sample had a higher proportion of anaerobic bacteria than the control (p< 0.01) (Figure 5C). The control sample had higher relative abundance of facultative bacteria than CP10 (p< 0.01) or CP16 (p < 0.01) (Figure 5D). The CP10 sample had a higher proportion of facultative bacteria than CP16 (p < 0.01) (Figure 5D). In contrast, the control sample had a lower relative abundance of aerobic bacteria than CP10 (p < 0.05) or CP16 (p < 0.05) (Figure 5E). The CP10 sample had a higher proportion of aerobic bacteria than CP16 (p < 0.05) (Figure 5E). In terms of potential pathogenic bacteria, the CP16 sample had a higher percentage than CP10 (p < 0.01) or control (p < 0.01) (Figure 5F). The relative abundance of pathogenic bacteria did not differ between control and CP10 (p = 0.12).
Figure 5. High-level phenotypes analysis predicted by BugBase software.
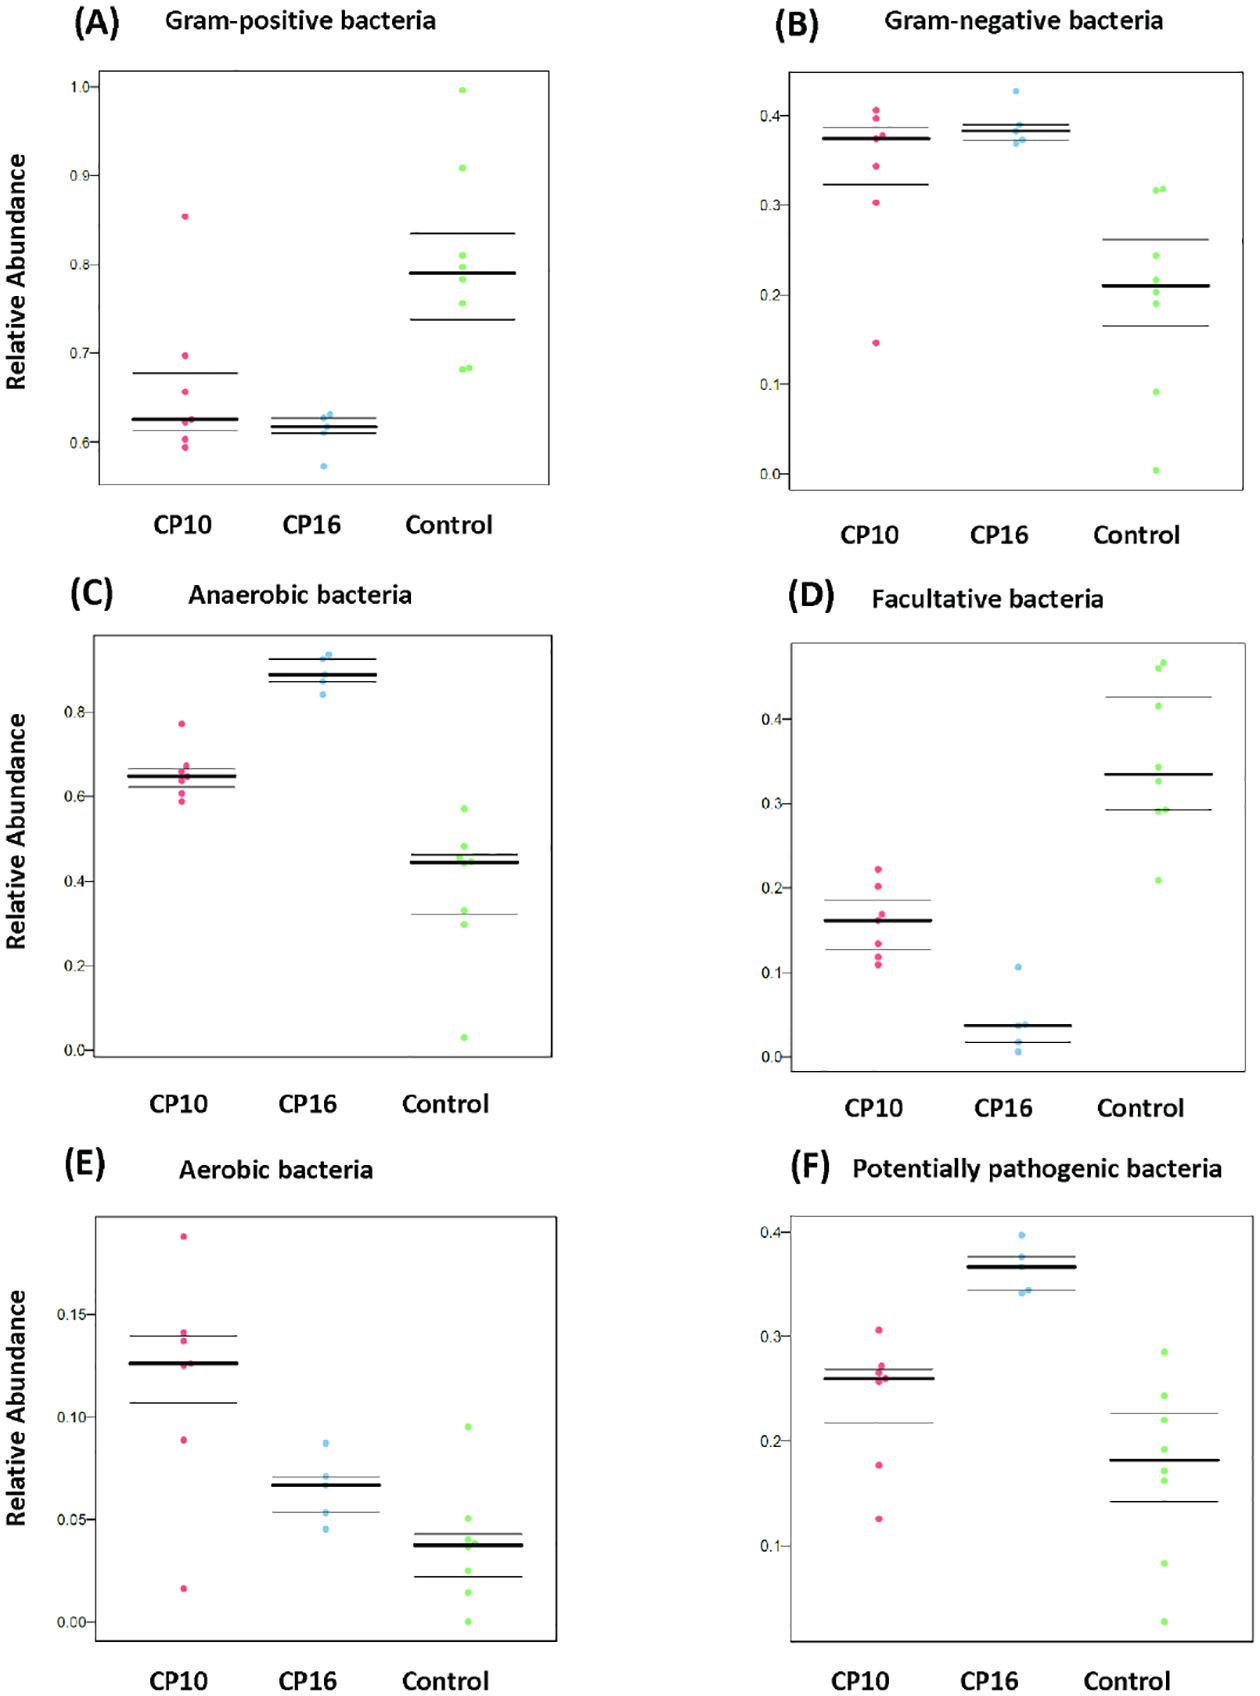
High-level phenotypes analysis was predicted by BugBase software. (A) predicted relative abundance of Gram-positive bacteria. P < 0.05 between CP10 vs control and CP16 vs control. Not significant between CP10 and CP16. (B) predicted relative abundance of Gram-negative bacteria. P < 0.05 between CP10 vs control and CP16 vs control. Not significant between CP10 and CP16. (C) predicted relative abundance of anaerobic bacteria. P < 0.01 among all three groups. (D) predicted relative abundance of facultative bacteria. P < 0.01 among all three groups. (E) predicted relative abundance of aerobic bacteria. P < 0.05 among all three groups. (F) predicted relative abundance of potentially pathogenic bacteria. P < 0.01 between CP16 vs control and CP16 vs CP10. Not significant between CP10 and control.
Discussion
In the current study, we investigated the alteration of gut microbiome when mice were induced CP with caerulein in 10-week and 16-week models. Mice with 10-week CP or 16-week CP had a very distinct gut microbiome composition and higher α-diversity compared to control mice. Moreover, we characterized the functional gut microbiome, indicating that potentially pathogenic Gram-negative bacteria were enriched in mice with CP. Further, pathway analysis showed metabolism of amino acids, glycan, vitamins, and secondary metabolites were up regulated in the gut metagenome in mice with CP.
Our study findings differed from some recent work in the field. For example, a study using 6-week ethanol and caerulein combination to induce CP showed decreased bacterial richness and diversity in a mouse model21. In human patients with CP as well, a decrease in the sample diversity was observed when compared to healthy individuals6, 18, 19. A similar trend was also reported in patients with chronic alcoholic pancreatitis20. One clinical study reported no difference in richness or diversity between CP and normal patients from the pancreas sample33. One plausible explanation for the contrasting findings may be that the disruption of digestive enzyme secretion (pancreatic exocrine insufficiency) and endocrine dysfunction/diabetes in the CP model may have led to maldigestion of fat and other nutrients, thereby changing the availability of the nutrients to the gut microbiota4. Improper digestion of food components from gastrointestinal tract may have increased the availability of the nutrients to the gut microbiota, potentially causing the increased bacterial community diversity in our study. Moreover, the reduction of antimicrobial peptides secreted by pancreatic acinar cells can also lead to gut microbiota overgrowth, therefore increasing the α diversity17. Both acute and chronic exposure to alcohol can extensively modify the microbiome composition, cause bacterial overgrowth, and disrupt the mucosal barrier function34. Bacteria from genera Lactococci, Pediococci, Lactobacilli, and Akkermansia muciniphila were depleted by alcohol in mice studies35–37. In human studies, bacteria from phyla Bacteroidetes and Proteobacteria, families Lachnospiraceae and Ruminococcaceae were depleted by alcohol treatment38, 39. Therefore, using alcohol in a mouse study or having alcohol drinkers in a human study is itself a confounding factor. The difference in α diversity observed between studies may be mostly dependent on the mechanism and reagents used to induce CP.
In accordance with most clinical and preclinical studies6, 18, 19, we also discovered significant changes in beta diversity when mice develop CP. Thomas et al. reported no clustering at the genus level by principle coordinate analysis between healthy pancreas and CP, however pancreas tissue was processed rather than fecal sample33. Additionally, we also showed that the change in microbiome caused by CP is still progressing even after 6 weeks without caerulein injection (Figure 1A, B). More potentially pathogenic bacteria were predicted in CP16 (Figure 4F) indicated that the microbiome is not recovering to the original status. Inflammation and fibrosis persist and there was no significant difference in terms of pancreatic histology between groups CP10 and CP16 despite the change in microbiome, suggesting that there was no recovery in pancreatic tissue. The surplus of nutrients available to the lower gut microbiota could be one of the driving factors for the proliferation of pathogenic bacteria. These suggested the change in the microbiome associated with CP has long-term consequences with persistent pathogen enrichment. Moreover, lower α diversity itself may not be the sole indicator or predictor for worse outcomes since our study had the opposite outcome with higher α diversity and still more pathogenic bacteria.
Further, our findings showed that the intestinal microbial community of mice with CP was significantly altered from normal mice on various taxonomic levels. On the phylum level, we have observed a decrease in Firmicutes to Bacteroidetes ratio, which was consistent with a previous mice study21. The impact of CP at the phylum level showed mixed responses in human studies. Zhou et al. reported lower Firmicutes abundance in the gut microbiome of the CP group than control group19. However, another study observed an increase in the Firmicutes to Bacteroidetes ratio in CP patients18. In patients with chronic alcoholic pancreatitis, Bacteroidetes were less abundant in patients than control20. It is worth noting that, in the human study, patients often take other prescriptions that might affect the microbiome. In the alcoholic pancreatitis study, different patient groups have a different proportion of proton pump inhibitors users that could change the gut environment. Moreover, alcohol consumption itself could change the Firmicutes to Bacteroidetes ratio34.
On the genus and species level, the reported bacteria that were affected were inconsistent across studies that among pre-clinical and clinical studies. From the 6-week CP model study in mice, the relative abundances of Bacteroides and Alloprevotella genera were increased in the CP sample21. We discovered a different, and a much longer list of bacteria genera that were over-represented by CP, including Bifidobacterium, Akkermansia, Desulfovibrio, Corynebacterium Streptococcus, Anaerofustis, Christensenella in CP10 and Allobaclum, Prevotella, Bacteroides, Oscillospira, Ruminococcus in CP16. In human patients, discordant distinguishing organisms were reported between studies. The abundances of Escherichia-Shigella genus were high in human gut microbiomes in the CP group whereas that of Faecalibacterium was lower in CP group19. Similarly, there was a reduction in the abundance of Faecalibacterium prausnitzii and Ruminococcus bromii from controls to CP patiens18. Frost et al. reported the group of facultative pathogenic bacteria including Citrobacter, Enterobacter, Enterococcus and others showed a 2.8-fold increase in CP patients samples when compared with controls6. Eight genera were more frequent in patients with chronic alcoholic pancreatitis with Klebsiella, Enterococcus and Sphingomonas being the most overrepresented20. The control group in this study were regular drinkers so that might have an impact on the baseline microbiome. Hamada et al reported that the proportions of Bacteroides, Streptococcus and Clostridium species were higher in patients with CP patients40. However, the comparison was made between autoimmune pancreatitis and CP.
We also predicted the function of the gut microbiome with 16S sequencing and PICRUSt predictive algorithm. As a result of the changing availability of nutrients to the gut microbiota, metabolism of amino acid, glycan, vitamins were more active in both CP10 and CP16 samples when comparing to control. Increased activity of secondary metabolites and cell mobility also indicated increased nutrient supply to the gut bacteria due to maldigestion caused by insufficient digestive enzyme secretion. Our phenotype prediction also showed a higher percentage of Gram-negative bacteria, aerobic bacteria as well as potential pathogenic bacteria. Han et al. had reported a similar prediction in alcohol and caerulein induced CP mice study21. In human studies, lipopolysaccharide biosynthesis and bacterial invasion of epithelial cells were predicted to be enriched in the CP group18, 19, indicating Gram-negative pathogenic bacteria were more prevalent in CP associated microbiome. Future studies should focus on therapeutic and intervention approaches to ameliorate dysbiosis caused by CP. Antibiotics that are more effective to Gram-negative bacteria41 could be used to eliminate the expansion of such pathogens in CP patients. Pancreatic Enzyme Replacement42 could be another direction to limit the overflow of the undigested nutrient to the gut, therefore, reducing the proliferation of pathogenic bacteria.
The alteration in microbiota composition, diversity, and function are not unique to CP. In other forms of chronic inflammation, such as inflammatory bowel disease (IBD), healthy control and different IBD types formed a distinct cluster in the PCoA plot. Ileal Crohn’s disease patients had low gut microbial richness. Enterobacteriaceae is correlated with ileal Crohn’s disease, Alistipes massiliensis is correlated with ulcerative colitis and Ruminococcaceae with healthy control43. The microbiomes of patients with IBD encode more oxidative stress and nutrient transport pathways and fewer pathways related to carbohydrate metabolism, SCFA synthesis and amino acid synthesis44.
In summary, our study has revealed pronounced alteration in the gut microbiome composition, diversity, and gut microbiome function when mice develop CP. Further studies are merited to investigate the longitudinal progression of the microbiome and the therapeutic approach to ameliorate the dysbiosis associated with CP.
Supplementary Material
Figure S1. H&E and sirius red staining of the pancreas tissue. (A) H&E staining of control pancreas. (B) Representative histology shown by H&E staining of pancreas after induction of caerulein-induced chronic pancreatitis (50μg/kg, hourly ×7, twice a week ×10 weeks). (C) sirius red staining (fluorescence) of control pancreas. (D) sirius red staining (fluorescence) of pancreas of induction of caerulein induced CP.
Figure S2. Phylum Firmicutes to Bacteroidetes ratio among all samples. P = 0.07 between control and CP10, P= 0.01 between Control and CP16. Not significant between CP10 and CP16. Samples include control (n=8), CP10 (n=7), CP16 (n=5).
Figure S3. Heatmap of OTU abundance at family level. Sequencing counts was normalized by adding a psuedocount of 1 and then taking the log10 of the table.
Acknowledgements
This study was supported by a grant from NIDDK, 5R01DK117576. The authors declare no conflicts of interest.
We would like to thank April Mann (University of Miami) for reviewing the manuscript.
Footnotes
Publisher's Disclaimer: This is a PDF file of an unedited manuscript that has been accepted for publication. As a service to our customers we are providing this early version of the manuscript. The manuscript will undergo copyediting, typesetting, and review of the resulting proof before it is published in its final form. Please note that during the production process errors may be discovered which could affect the content, and all legal disclaimers that apply to the journal pertain.
References
- 1.Lankisch PG, Apte M, Banks PA: Acute pancreatitis. The Lancet 2015; 386: 85–96. [DOI] [PubMed] [Google Scholar]
- 2.Fagenholz PJ, Ferna C, Harris NS, Pelletier AJ, Camargo CA Jr: Direct medical costs of acute pancreatitis hospitalizations in the united states. Pancreas 2007; 35: 302–307. [DOI] [PubMed] [Google Scholar]
- 3.Dawra R, Sah RP, Dudeja V, Rishi L, Talukdar R, Garg P et al. : Intra-acinar trypsinogen activation mediates early stages of pancreatic injury but not inflammation in mice with acute pancreatitis. Gastroenterology 2011; 141: 2210–2217. e2212. [DOI] [PMC free article] [PubMed] [Google Scholar]
- 4.Majumder S, Chari ST: Chronic pancreatitis. The Lancet 2016; 387: 1957–1966. [DOI] [PubMed] [Google Scholar]
- 5.Pham A, Forsmark C: Chronic pancreatitis: Review and update of etiology, risk factors, and management. FResearch 2018; 7. [DOI] [PMC free article] [PubMed] [Google Scholar]
- 6.Frost F, Weiss FU, Sendler M, Kacprowski T, Rühlemann M, Bang C et al. : The gut microbiome in patients with chronic pancreatitis is characterized by significant dysbiosis and overgrowth by opportunistic pathogens. Clinical Translational Gastroenterology 2020; 11. [DOI] [PMC free article] [PubMed] [Google Scholar]
- 7.Brubaker L, Luu S, Hoffman K, Wood A, Cagigas MN, Yao Q et al. : Microbiome changes associated with acute and chronic pancreatitis: A systematic review. Pancreatology 2020; 22: 1–14. [DOI] [PMC free article] [PubMed] [Google Scholar]
- 8.Riquelme E, Zhang Y, Zhang L, Montiel M, Zoltan M, Dong W et al. : Tumor microbiome diversity and composition influence pancreatic cancer outcomes. Cell 2019; 178: 795–806. e712. [DOI] [PMC free article] [PubMed] [Google Scholar]
- 9.Ammer-Herrmenau C, Pfisterer N, Weingarten MF, Neesse A: The microbiome in pancreatic diseases: Recent advances and future perspectives. United European Gastroenterology Journal 2020; 8: 878–885. [DOI] [PMC free article] [PubMed] [Google Scholar]
- 10.Li X-Y, He C, Zhu Y, Lu N-H: Role of gut microbiota on intestinal barrier function in acute pancreatitis. World Journal of Gastroenterology 2020; 26: 2187. [DOI] [PMC free article] [PubMed] [Google Scholar]
- 11.Chonchubhair HMN, Bashir Y, Dobson M, Ryan BM, Duggan SN, Conlon KC: The prevalence of small intestinal bacterial overgrowth in non-surgical patients with chronic pancreatitis and pancreatic exocrine insufficiency (pei). Pancreatology 2018; 18: 379–385. [DOI] [PubMed] [Google Scholar]
- 12.Akshintala VS, Talukdar R, Singh VK, Goggins M: The gut microbiome in pancreatic disease. Clinical Gastroenterology Hepatology 2019; 17: 290–295. [DOI] [PMC free article] [PubMed] [Google Scholar]
- 13.Capurso G, Signoretti M, Archibugi L, Stigliano S, Delle Fave G: Systematic review and meta-analysis: Small intestinal bacterial overgrowth in chronic pancreatitis. United European gastroenterology journal 2016; 4: 697–705. [DOI] [PMC free article] [PubMed] [Google Scholar]
- 14.Kumar K, Ghoshal UC, Srivastava D, Misra A, Mohindra S: Small intestinal bacterial overgrowth is common both among patients with alcoholic and idiopathic chronic pancreatitis. Pancreatology 2014; 14: 280–283. [DOI] [PubMed] [Google Scholar]
- 15.Trespi E, Ferrieri A: Intestinal bacterial overgrowth during chronic pancreatitis. Current medical research and opinion 1999; 15: 47–52. [DOI] [PubMed] [Google Scholar]
- 16.Chen J, Huang C, Wang J, Zhou H, Lu Y, Lou L et al. : Dysbiosis of intestinal microbiota and decrease in paneth cell antimicrobial peptide level during acute necrotizing pancreatitis in rats. PLoS One 2017; 12: e0176583. [DOI] [PMC free article] [PubMed] [Google Scholar]
- 17.Ahuja M, Schwartz DM, Tandon M, Son A, Zeng M, Swaim W et al. : Orai1-mediated antimicrobial secretion from pancreatic acini shapes the gut microbiome and regulates gut innate immunity. Cell metabolism 2017; 25: 635–646. [DOI] [PMC free article] [PubMed] [Google Scholar]
- 18.Jandhyala SM, Madhulika A, Deepika G, Rao GV, Reddy DN, Subramanyam C et al. : Altered intestinal microbiota in patients with chronic pancreatitis: Implications in diabetes and metabolic abnormalities. Scientific reports 2017; 7: 1–10. [DOI] [PMC free article] [PubMed] [Google Scholar]
- 19.Zhou C-H, Meng Y-T, Xu J-J, Fang X, Zhao J-L, Zhou W et al. : Altered diversity and composition of gut microbiota in chinese patients with chronic pancreatitis. Pancreatology 2020; 20: 16–24. [DOI] [PubMed] [Google Scholar]
- 20.Ciocan D, Rebours V, Voican CS, Wrzosek L, Puchois V, Cassard A-M et al. : Characterization of intestinal microbiota in alcoholic patients with and without alcoholic hepatitis or chronic alcoholic pancreatitis. Scientific reports 2018; 8: 1–12. [DOI] [PMC free article] [PubMed] [Google Scholar]
- 21.Han M-M, Zhu X-Y, Peng Y-F, Lin H, Liu D-C, Li L: The alterations of gut microbiota in mice with chronic pancreatitis. Annals of translational medicine 2019; 7. [DOI] [PMC free article] [PubMed] [Google Scholar]
- 22.Callahan BJ, McMurdie PJ, Rosen MJ, Han AW, Johnson AJA, Holmes SP: Dada2: High-resolution sample inference from illumina amplicon data. Nature methods 2016; 13: 581. [DOI] [PMC free article] [PubMed] [Google Scholar]
- 23.Bolyen E, Rideout JR, Dillon MR, Bokulich NA, Abnet CC, Al-Ghalith GA et al. : Reproducible, interactive, scalable and extensible microbiome data science using qiime 2. Nature biotechnology 2019; 37: 852–857. [DOI] [PMC free article] [PubMed] [Google Scholar]
- 24.Bokulich NA, Kaehler BD, Rideout JR, Dillon M, Bolyen E, Knight R et al. : Optimizing taxonomic classification of marker-gene amplicon sequences with qiime 2’s q2-feature-classifier plugin. Microbiome 2018; 6: 1–17. [DOI] [PMC free article] [PubMed] [Google Scholar]
- 25.McDonald D, Price MN, Goodrich J, Nawrocki EP, DeSantis TZ, Probst A et al. : An improved greengenes taxonomy with explicit ranks for ecological and evolutionary analyses of bacteria and archaea. The ISME journal 2012; 6: 610–618. [DOI] [PMC free article] [PubMed] [Google Scholar]
- 26.Chong J, Liu P, Zhou G, Xia J: Using microbiomeanalyst for comprehensive statistical, functional, and meta-analysis of microbiome data. Nature Protocols 2020; 15: 799–821. [DOI] [PubMed] [Google Scholar]
- 27.Segata N, Izard J, Waldron L, Gevers D, Miropolsky L, Garrett WS et al. : Metagenomic biomarker discovery and explanation. Genome biology 2011; 12: 1–18. [DOI] [PMC free article] [PubMed] [Google Scholar]
- 28.Markowitz VM, Chen I-MA, Palaniappan K, Chu K, Szeto E, Grechkin Y et al. : Img: The integrated microbial genomes database and comparative analysis system. Nucleic acids research 2012; 40: D115–D122. [DOI] [PMC free article] [PubMed] [Google Scholar]
- 29.Kanehisa M, Sato Y, Kawashima M, Furumichi M, Tanabe M: Kegg as a reference resource for gene and protein annotation. Nucleic acids research 2016; 44: D457–D462. [DOI] [PMC free article] [PubMed] [Google Scholar]
- 30.Ward T, Larson J, Meulemans J, Hillmann B, Lynch J, Sidiropoulos D et al. : Bugbase predicts organism-level microbiome phenotypes. BioRxiv 2017: 133462. [Google Scholar]
- 31.Davis JJ, Wattam AR, Aziz RK, Brettin T, Butler R, Butler RM et al. : The patric bioinformatics resource center: Expanding data and analysis capabilities. Nucleic acids research 2020; 48: D606–D612. [DOI] [PMC free article] [PubMed] [Google Scholar]
- 32.Sah RP, Dudeja V, Dawra RK, Saluja AK: Cerulein-induced chronic pancreatitis does not require intra-acinar activation of trypsinogen in mice. Gastroenterology 2013; 144: 1076–1085. e1072. [DOI] [PMC free article] [PubMed] [Google Scholar]
- 33.Thomas RM, Gharaibeh RZ, Gauthier J, Beveridge M, Pope JL, Guijarro MV et al. : Intestinal microbiota enhances pancreatic carcinogenesis in preclinical models. Carcinogenesis 2018; 39: 1068–1078. [DOI] [PMC free article] [PubMed] [Google Scholar]
- 34.Capurso G, Lahner E: The interaction between smoking, alcohol and the gut microbiome. Best practice research Clinical gastroenterology 2017; 31: 579–588. [DOI] [PubMed] [Google Scholar]
- 35.Yan AW, E. Fouts D, Brandl J, Stärkel P, Torralba M, Schott E et al. : Enteric dysbiosis associated with a mouse model of alcoholic liver disease. Hepatology 2011; 53: 96–105. [DOI] [PMC free article] [PubMed] [Google Scholar]
- 36.Bull-Otterson L, Feng W, Kirpich I, Wang Y, Qin X, Liu Y et al. : Metagenomic analyses of alcohol induced pathogenic alterations in the intestinal microbiome and the effect of lactobacillus rhamnosus gg treatment. PloS one 2013; 8: e53028. [DOI] [PMC free article] [PubMed] [Google Scholar]
- 37.Lowe PP, Gyongyosi B, Satishchandran A, Iracheta-Vellve A, Ambade A, Kodys K et al. : Alcohol-related changes in the intestinal microbiome influence neutrophil infiltration, inflammation and steatosis in early alcoholic hepatitis in mice. PloS one 2017; 12: e0174544. [DOI] [PMC free article] [PubMed] [Google Scholar]
- 38.Rao R, Seth A, Sheth P: Recent advances in alcoholic liver disease i. Role of intestinal permeability and endotoxemia in alcoholic liver disease. American Journal of Physiology-Gastrointestinal and Liver Physiology 2004; 286: G881–G884. [DOI] [PubMed] [Google Scholar]
- 39.Chen Y, Yang F, Lu H, Wang B, Chen Y, Lei D et al. : Characterization of fecal microbial communities in patients with liver cirrhosis. Hepatology 2011; 54: 562–572. [DOI] [PubMed] [Google Scholar]
- 40.Hamada S, Masamune A, Nabeshima T, Shimosegawa T: Differences in gut microbiota profiles between autoimmune pancreatitis and chronic pancreatitis. The Tohoku journal of experimental medicine 2018; 244: 113–117. [DOI] [PubMed] [Google Scholar]
- 41.Pontefract BA, Ho HT, Crain A, Kharel MK, Nybo SE: Drugs for gram-negative bugs from 2010–2019: A decade in review; In: Open Forum Infectious Diseases, Oxford University Press; US, 2020; pp. ofaa276. [DOI] [PMC free article] [PubMed] [Google Scholar]
- 42.Brennan GT, Saif MW: Pancreatic enzyme replacement therapy: A concise review. Journal of the pancreas 2019; 20: 121. [PMC free article] [PubMed] [Google Scholar]
- 43.Halfvarson J, Brislawn CJ, Lamendella R, Vázquez-Baeza Y, Walters WA, Bramer LM et al. : Dynamics of the human gut microbiome in inflammatory bowel disease. Nature microbiology 2017; 2: 1–7. [DOI] [PMC free article] [PubMed] [Google Scholar]
- 44.Schirmer M, Garner A, Vlamakis H, Xavier RJ: Microbial genes and pathways in inflammatory bowel disease. Nature Reviews Microbiology 2019; 17: 497–511. [DOI] [PMC free article] [PubMed] [Google Scholar]
Associated Data
This section collects any data citations, data availability statements, or supplementary materials included in this article.
Supplementary Materials
Figure S1. H&E and sirius red staining of the pancreas tissue. (A) H&E staining of control pancreas. (B) Representative histology shown by H&E staining of pancreas after induction of caerulein-induced chronic pancreatitis (50μg/kg, hourly ×7, twice a week ×10 weeks). (C) sirius red staining (fluorescence) of control pancreas. (D) sirius red staining (fluorescence) of pancreas of induction of caerulein induced CP.
Figure S2. Phylum Firmicutes to Bacteroidetes ratio among all samples. P = 0.07 between control and CP10, P= 0.01 between Control and CP16. Not significant between CP10 and CP16. Samples include control (n=8), CP10 (n=7), CP16 (n=5).
Figure S3. Heatmap of OTU abundance at family level. Sequencing counts was normalized by adding a psuedocount of 1 and then taking the log10 of the table.
Data Availability Statement
Sequence data are available at the NCBI database under BioProject accession number PRJNA729715.


