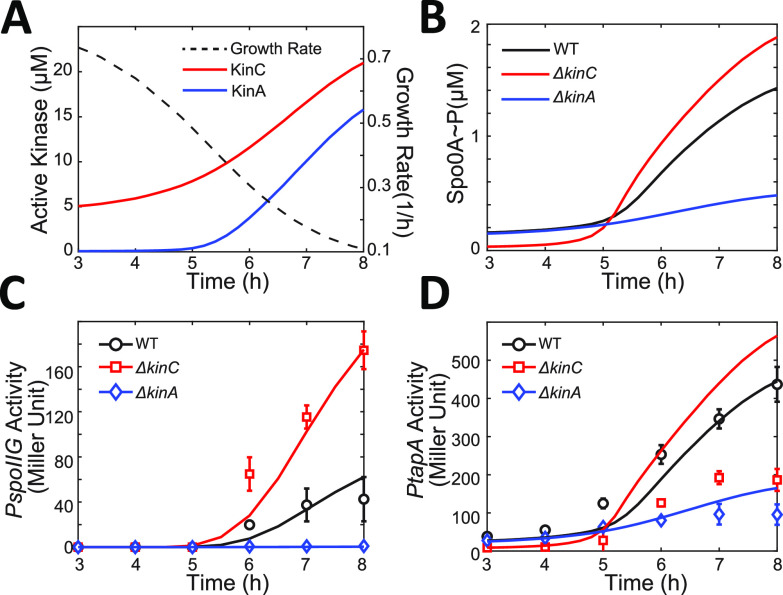
FIG 3.
Effect of growth rate changes explains the roles of KinC at different growth stages. (A) Predicted dynamics of the concentration of active KinA/KinC (solid lines, left y axis) and growth rate (dashed line, right y axis). The growth rate dynamics are calculated with a model that is fitted to the experimental data (see Materials and Methods for details). (B) Predicted dynamics of Spo0A∼P concentration in WT, ΔkinC, and ΔkinA strains. (C and D) Predicted dynamics of PspoIIG (C) and tapA (D) activity in WT, ΔkinC, and ΔkinA strains. The solid line represents a model fit for the PspoIIG activity dynamics. The experimental data presented in Fig. 1 are rearranged and presented as different markers.

