Abstract
The identification of factors determining whether a lesion progresses, destabilizes or becomes quiescent remains a challenge. Wall or endothelial shear stress (WSS or ESS, respectively), the frictional force acting on the lumen wall, is strongly associated with changes in the natural history of lesions. Several clinical intravascular imaging studies have shown a clear link between disturbed flow, typically characterized by low WSS, and plaque growth. In support of these studies, in-vitro experiments of shear stress have identified several mechanisms promoting atherosclerosis. More recently, the relationship between WSS and major adverse cardiac events has been explored. Improvements in coronary computed tomography angiography (CCTA) image resolution and quality has allowed for the calculation of WSS from CT. In this review, we provide an introduction to WSS, highlight important human and animal intravascular-based WSS studies, and discuss CT-based WSS studies to date. Finally, we discuss future directions of CCTA and WSS computation.
1. Introduction
The past few decades have witnessed extensive investigations to characterize individual coronary artery plaques in an effort to identify plaques likely to progress, destabilize, and cause a new major adverse cardiac event (MACE), so that potentially life-saving intervention strategies could be preemptively deployed. Initial investigations utilized invasive intravascular imaging with IVUS or OCT, and focused primarily on anatomic characterization of plaque morphology, plaque burden, fibrous cap thickness, and minimal lumen area. Long-term outcomes studies, however, underscored that while anatomic characterization of plaques was an essential foundation to understand current and future plaque behavior, the majority of plaques, even ostensibly high-risk plaques based on anatomic characterization, did not progress and instead remained quiescent.1–4 It was clear that additional features of atherosclerosis vascular biology were critically contributing to the ongoing natural history of individual plaques. A major thrust of more recent basic and translational research has therefore focused on the biomechanical forces impacting the arterial wall and the plaque, since these pathophysiologic processes may provide the crucial incremental stimulus that determines whether a particular plaque will progress, destabilize, or become quiescent.5–8
The resolution of current invasive imaging approaches, IVUS or OCT, are sufficiently accurate to characterize the arterial lumen, wall and plaque anatomy, and, when coupled with coronary angiography to provide 3-D representation of the coronary artery, enable computational fluid dynamics (CFD) approaches to investigate the hemodynamic and pathophysiologic characteristics affecting individual plaques. While these anatomic and hemodynamic studies are becoming more predictive of adverse future MACE6,8 the inherent invasive nature of these methodologic approaches cannot be applied to large-scale screening of individuals with CAD, or at risk for CAD, and it would be invaluable to develop non-invasive imaging methods that allow risk-assessment for a broader range of patient populations. Coronary CT angiography (CCTA) has become an indispensable tool to non-invasively characterize coronary arteries, and, as methods have improved, the temporal and spatial resolution of CCTA may now be suitable for widespread application to risk-stratify individual plaques. The purpose of this review is to provide an update on the application of CCTA to characterize the local shear stress environment of coronary arteries to determine its feasibility and accuracy for non-invasive risk-stratification of individual coronary lesions.
2. Mechanical forces affecting coronary arteries
Arteries experience a variety of mechanical stresses, due to the pulsatile nature of blood flow, the arterial topography in 3-D space, and the mechanical properties of the arterial wall and its constituents, including the atherosclerotic plaque9,10 (Fig. 1). Tensile and compressive stress are perpendicular to the artery wall and represent outward and inward stresses respectively, while wall or endothelial shear stress (WSS or ESS) represents the tangential force of the friction of the flowing blood across the vascular endothelium.
Fig. 1.
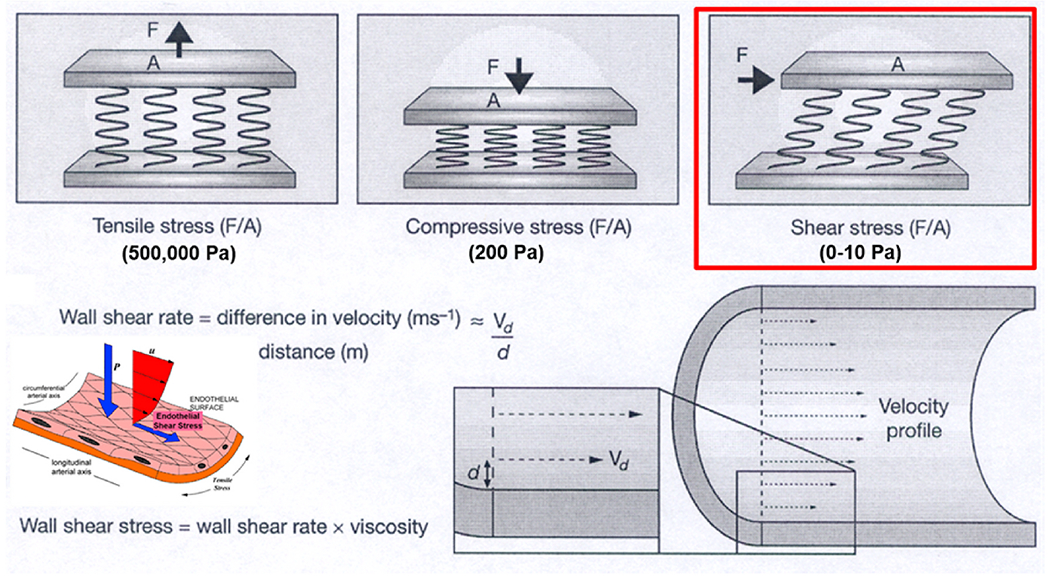
Model of shear stress and application of the model within a blood vessel (modified from Slager CJ et al. Nat Clin Pract Cardiovasc Med 2005).
The magnitude of ESS, typically in the range of 0–10 Pa (orders of magnitude lower that tensile and compressive stresses), constitutes a uniquely biologic and physiologic process of local inflammation and atherogenesis, or quiescence. Individual endothelial cells are equipped with mechanoreceptors capable of detecting minute differences in its environment of shear stress, which simultaneously activate a complex network of intracellular pathways that cross-talk with each other11 (Fig 2A) and modulate a broad constellation of cellular functions and morphology11 (Fig. 2B).
Fig. 2.
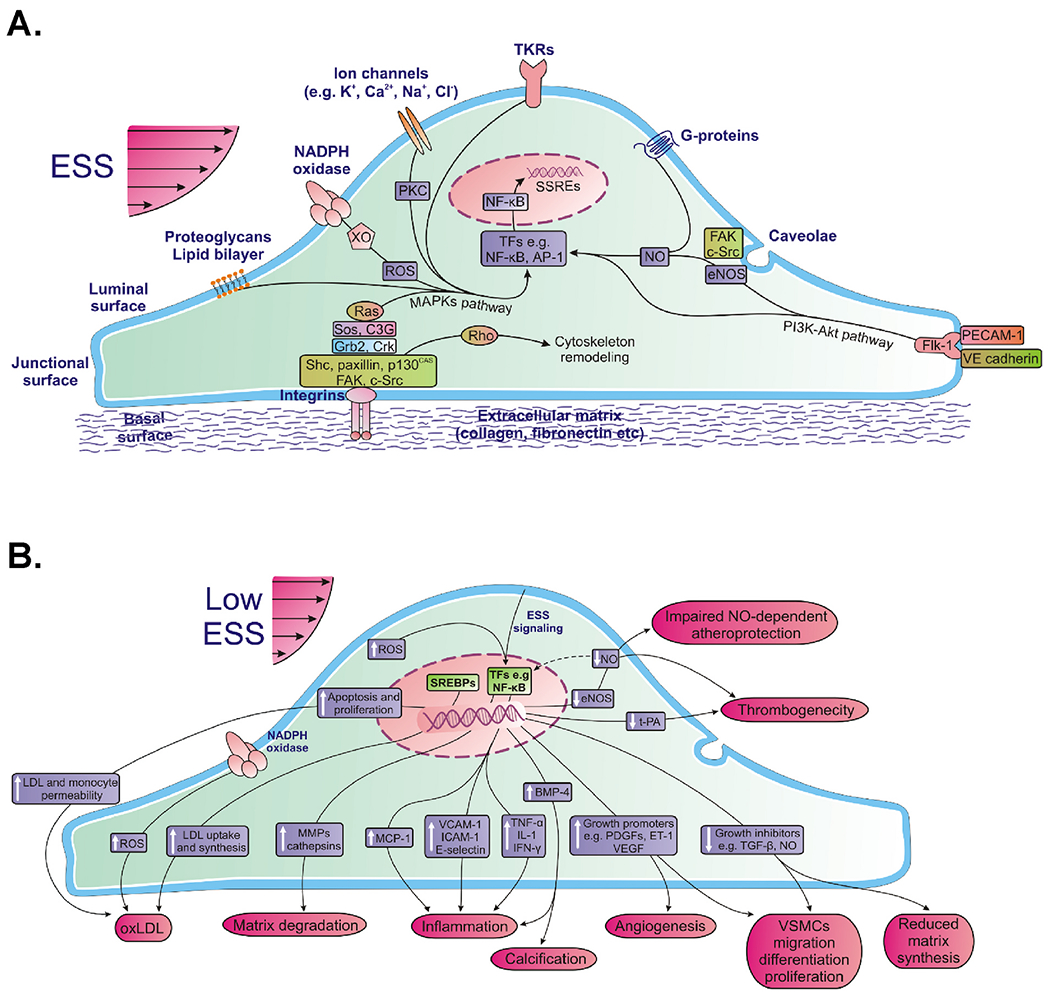
Local endothelial shear stress (ESS) is sensed by luminal endothelial mechanoreceptors, such as ion channels (K+, Ca2+, Na+, Cl−), G-proteins, caveolae, tyrosine kinase receptors (TKRs), nicotinamide adenine dinucleotide phosphate(NADPH) oxidase and xanthine oxidase (XO), plasma membrane lipid bilayer, and heparan sulfate proteoglycans. Also, ESS signals are transmitted through the cytoskeleton to the basal or junctional endothelial surface, where certain integrins or a mechanosensory complex consisting of platelet endothelial cell adhesion molecule-1 (PECAM-1) and Flk-1 are activated, respectively, and initiate a downstream signaling cascade. Activated integrins phosphorylate and activate a multiple complex of non-receptor tyrosine kinases (FAK, c-Src, Shc, paxillin, and p130CAS), adaptor proteins (Grb2, Crk), and guanine nucleotide exchange factors(Sos, C3G), thereby activating Ras family GTPase. Active Ras plays a pivotal role in intracellular transduction of ESS signals as it triggers various parallel downstream cascades of serine kinases; each of these kinases phosphorylates and hence activates the next one downstream, ultimately activating mitogen-activated protein kinases (MAPKs). Besides integrin-mediated mechanotransduction, ESS activates a number of other downstream signaling pathways initiated by luminal or junctional mechanoreceptors. These pathways include the production of reactive oxygen species (ROS) from NADPH oxidase and XO, activation of protein kinase C (PKC), activation of Rho family small GTPases (which mediate the remodeling cytoskeleton resulting in temporary or permanent structural changes of ECs), release of endothelial nitric oxide synthase (eNOS) and other signaling molecules from caveolae, and activation of phosphoinositide-3 kinase (PI3K)-Akt cascade. Ultimately, all of these signaling pathways lead to phosphorylation of several transcription factors (TFs), such as nuclear factor-kappa β (NF-κB) and activator protein-1 (AP-1). These TF proteins bind positive or negative shear stress responsive elements (SSREs) at promoters of mechanosensitive genes inducing or suppressing their expression, thereby modulating cellular function and morphology (modified from Chatzizisis Y et al. JACC 2007).
3. Nature of fluid flow and shear stress within coronary arteries
Fluid flow in the coronary arteries is characterized by its direction and magnitude, and can be categorized as laminar flow with or without disturbance. Disturbed flow manifests as eddies, low flow, and changes in flow direction, and are typically located at the outer waist of a bifurcation, the inner aspect of a curve, and up- and down-stream from a luminal obstruction.
Measurement of shear stress requires accurate reconstruction of the coronary artery lumen in 3-D space (typically using intravascular imaging, such as IVUS or OCT coupled with coronary angiography, or non-invasive imaging, such as CCTA) and coronary blood flow (either measured or assumed), which are then combined through computational fluid dynamics (CFD) simulations to determine the direction and magnitude of local shear stress.
3.1. Effect of different shear stress values on endothelial cells and vascular status
The physiologic and pathophysiologic effects of local ESS of different magnitudes have been studied extensively. The threshold values of ESS associated with different biologic consequences are currently not absolute. This can be attributed to differences in experimental models, species utilized and limited outcome studies in humans, as well as potential differences in genetic and cultural backgrounds and concomitant risk factors, such as lipid values.12,13
3.1.1. Physiologic shear stress
Physiologic ESS is typically in the range of ~1–2.5 Pa and occurs in relatively straight arterial segments without obstruction.14,15 Physiologic pulsatile, laminar ESS constitutes the most potent stimulus for continuous NO production by the endothelium. NO is a key component of normal vascular tone, that possesses strong anti-inflammatory, anti-apoptotic, anti-mitogenic, and anti-thrombotic properties.11
3.1.2. Low shear stress
In arterial regions with disturbed flow, low ESS (< ~1Pa) down-regulates vasculoprotective pathways, and upregulates pro-inflammatory, pro-atherogenic, and pro-thrombotic pathways (Fig 2B). In serial invasive studies using large animal models, there is an inverse relationship between the magnitude of local low ESS at baseline and the magnitude of the local pro-inflammatory and pro-atherogenic processes at long-term followup.16
Low ESS also increases the permeability of the endothelial surface to LDL, promotes flow stagnation and the subsequent prolongation of the residence time of circulating LDL, which facilitate the infiltration of LDL into the sub-endothelial space. Low ESS also attracts inflammatory cells to the vascular wall, where they weaken the arterial wall leading to outward remodeling and also contribute to fibrous cap thinning, thus rendering the plaque more prone to rupture. The enlarging plaque induced by low ESS also leads to subintimal ischemia which stimulates the local proliferation of the vasa vasorum, which are structurally immature and prone to intraplaque hemorrhage.
3.1.3. High shear stress
There have been fewer studies examining the effect of high ESS (> ~2.5 Pa) on inflammation and atherosclerosis compared to low ESS.10,15,17 Arterial regions exposed to high SS in a uniform direction in animal models of early atherosclerosis are generally protected from atherosclerosis.9,14,18 In-vitro normal human endothelial cell transcriptomic studies suggest that high ESS may both amplify the atheroprotective effects of laminar shear, in part through the KLF2 axis, and also promote plaque disruption by upregulation of ATF family signaling.19
Ex-vivo studies of human coronary arteries in patients with more advanced atherosclerosis suggest that the location of plaque rupture is associated with high ESS.20 Longitudinal and cross-sectional human coronary and carotid studies have shown an increase in plaque necrotic core, calcium, increased strain, development of expansive remodeling, and presence of intraplaque hemorrhage, large necrotic core, napkinring sign in areas exposed to high ESS.12,15 High shear stress also induces platelet dysfunction that exacerbates the local thrombotic propensity.21 Further experimental studies of the effects of chronic high ESS (~5 Pa) and super-high ESS (~15–25 Pa) are needed to further address the mechanisms by which high ESS may promote plaque destabilization.
4. Pathobiologic/pathophysiologic environments leading to plaque destabilization and MACE
Relatively long-term serial imaging studies in swine demonstrate that chronic exposure to low ESS is associated with increased intimal media thickness, lipid accumulation and accumulation of activated inflammatory cells,16 associated with fibrous cap thinning and exacerbation of excessive expansive remodeling.26 A preliminary report illustrates an example of rupture of a complex coronary plaque occurring in an upstream portion of the plaque associated with low ESS.22 Other studies indicate that plaque rupture occurs at the site of high ESS located in the upstream or throat portion of plaque.6,23,24
As plaque progresses, especially as it enlarges and encroaches into the lumen, areas of high ESS at the throat of the obstruction will be located in relatively close proximity to areas of low ESS located upstream and downstream from the throat. Furthermore, plaques are typically not a simple “volcano” with a single peak and a simple upslope and downslope, but a complex pathobiologic and geometric structure with multiple peaks and troughs up- and down-stream from the peak8 (Fig. 3). It can be very challenging methodologically to determine if a particular adverse outcome such as plaque rupture is due to the high ESS at the throat or the low ESS immediately adjacent to the throat.
Fig. 3.
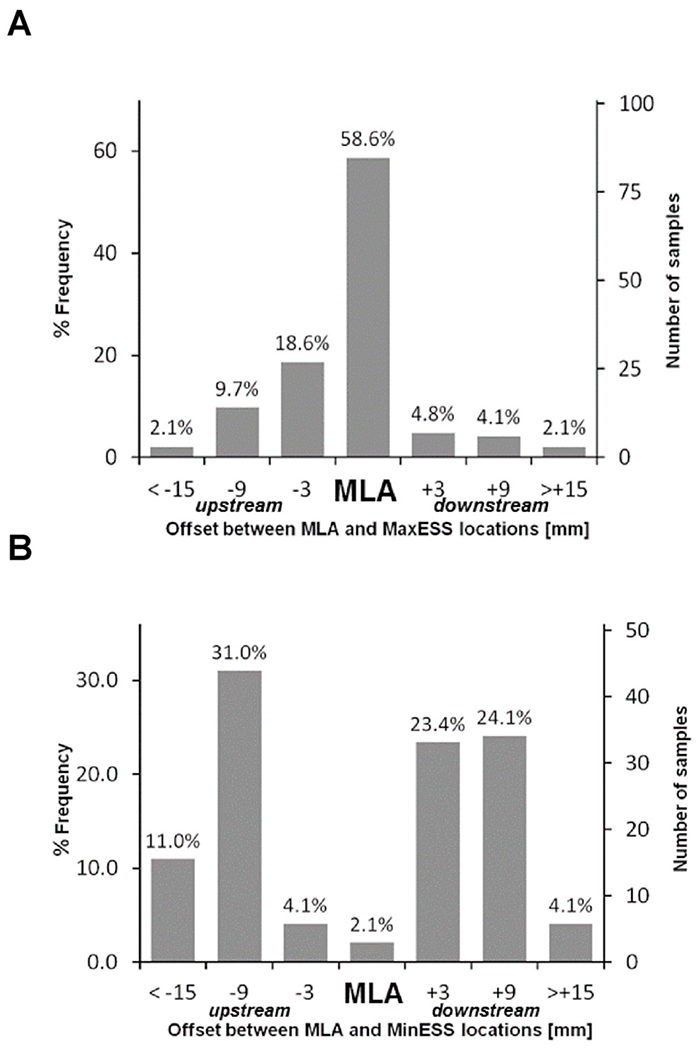
Relationship between lesion location site of minimal luminal area (MLA) and (A) highest ESS and (B) lowest ESS. The highest ESS was most frequently found at the site of MLA, while the lowest ESS was most commonly proximal or distal to the MLA, but rarely at the site of MLA (modified from Stone PH et al. JACC: Cardiovasc Imaging 2018).
5. Coronary wall shear stress evaluation in humans
5.1. Lessons learned from intravascular assessment of wall shear stress
The first prospective studies in human coronary arteries using fusion of intravascular ultrasound (IVUS) and angiography demonstrated that coronary segments with mild coronary plaque and low WSS were associated with plaque progression.25 The much larger multicenter PREDICTION study demonstrated that coronary segments with larger plaque burden and low WSS were associated with progression requiring coronary revascularization.4 The observation that segments with low WSS were associated with plaque progression was confirmed by another prospective IVUS study in patients with non-obstructive atherosclerosis15 (Fig. 4). Subsequently, these investigators demonstrated that low WSS had incremental value over plaque burden in predicting plaque progression.26 These observations were confirmed by a larger study demonstrating that regional low WSS provided incremental risk stratification of untreated coronary lesions in high risk patient beyond measures of plaque burden, luminal area and plaque morphology8
Fig. 4.
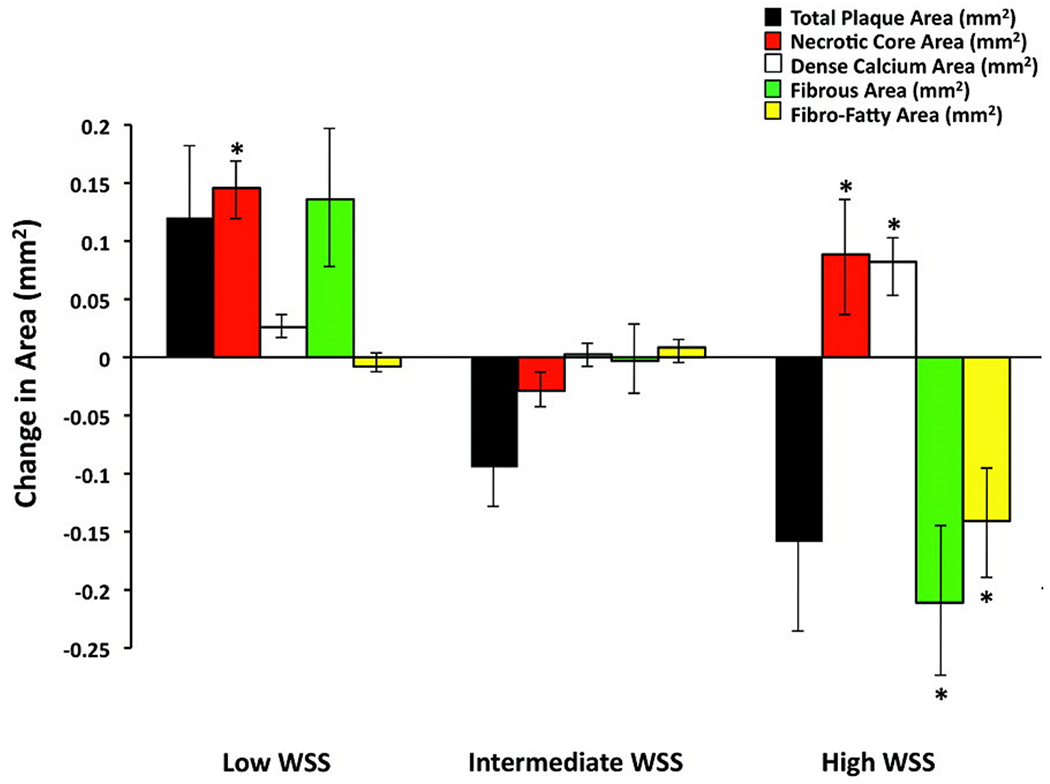
Change in virtual histology intravascular ultrasound–derived plaque composition in low-, intermediate-, and high-WSS segments over 6 months. Error bars are 95% confidence intervals. *p < 0.001 for comparison with intermediate-WSS segments. All other P values of low- and high-WSS segments vs intermediate-WSS segments are nonsignificant (modified from Samady H et al. Circ 2011).
A parallel observation was that coronary segments with high WSS demonstrated transformation to a more vulnerable phenotype over time15 (Fig. 4) and that high WSS also had incremental value over plaque burden and phenotype in predicting changes suggestive of plaque vulnerability over time.26 A recent study using angiography-derived WSS demonstrated that high mean WSS proximal to the throat of a stenosis was predictive of subsequent myocardial infarction (MI) and had incremental value for predicting MI over FFR alone,6 (Fig. 5). An example of WSS determined from intravascular imaging is shown in Fig. 6.
Fig. 5.
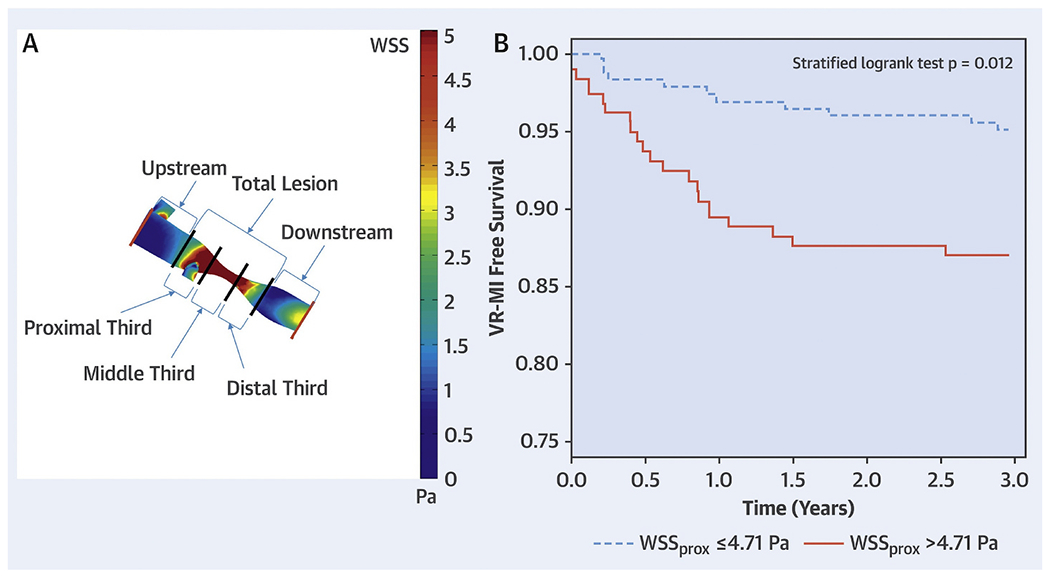
(A) Atherosclerotic lesion segmentation for wall shear stress calculation. Angiograms were used to create 3-dimensional geometric reconstructions of each patient’s target coronary vessel lumen. After performing computational fluid dynamics with patient-specific boundary conditions and identifying the lesion start points and endpoints, segment-specific wall shear stress values were generated by dividing the lesion into 5 segments: proximal, middle and distal thirds of the lesion; and 5-mm segments upstream and downstream to the lesion. The lesion wall shear stress values are displayed as a color-coded map. (B) Kaplan-Meier curves of vessel-related study population (n = 58) separated on the basis of wall shear stress measured in proximal segments of lesions to predict vessel-related myocardial infarction. Lesions with wall shear stress measured in proximal segments of lesions > 4.71 Pa had higher rates of vessel-related myocardial infarction than lesions with wall shear stress measured in proximal segments of lesions ≥4.71 Pa (p = 0.012). Pa = Pascal; WSSprox = WSS measured in the proximal segments of lesions; WSS = wall shear stress. (modified from Kumar A et al. JACC 2018)
Fig. 6.
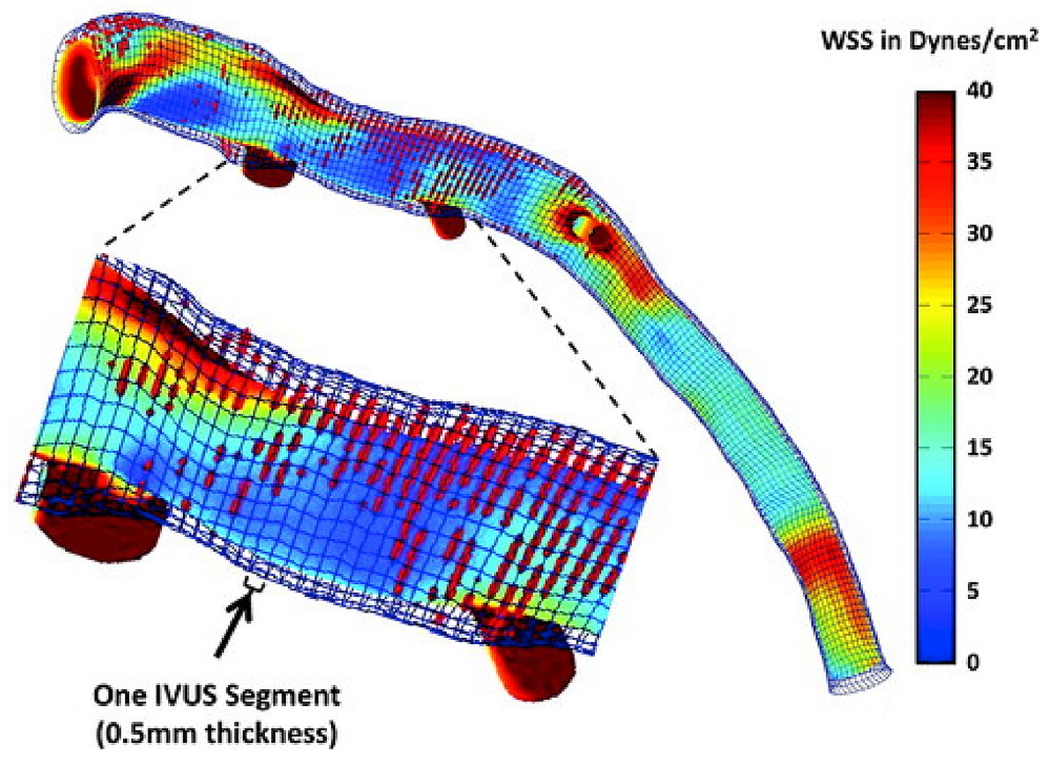
Example of a wall shear stress (WSS) profile of the left anterior descending coronary artery from a patient demonstrating lumen and external elastic membrane boundaries, superimposed virtual histology intravascular ultrasound (IVUS)–derived necrotic core data (red dots), and areas of variable WSS. The magnified segment of the vessel demonstrates the high-resolution spatial location of the IVUS images (thickness = 0.5 mm) superimposed on the WSS profile. Time-averaged WSS values were circumferentially averaged for each IVUS segment to provide quantitative hemodynamic data to correlate with plaque progression data.
5.2. CCTA derived wall shear stress
A large body of evidence for the role of WSS in plaque initiation and destabilization has been produced by intravascular studies. However, limitations on the use of intravascular imaging for WSS profiling include its invasive nature (with a finite complication rate) and its restriction to examining a single vessel at a time. CCTA overcomes these limitations due to its noninvasive nature and the ability to simultaneously compute WSS across the entire coronary tree.
Due to the historically limited resolution and occurrence of artifacts CCTA-derived WSS has been relatively uncommon compared to intravascular based methods. An early study demonstrated the feasibility of WSS calculations from CCTA in 5 patients.27 Further exploratory work found the inclusion of side-branches in the flow simulation to be critical for accurate WSS computation.28 In agreement with previous intravascular based WSS studies, plaque was found to be most prevalent in low and high WSS segments computed using CCTA.29 Park et al. investigated the distribution of hyperemic WSS with respect to CT defined adverse plaque characteristics (APC) in a larger population of 86 patients. Plaques exposed to the highest tertile of WSS were found to form a significantly greater proportion of high-risk plaques and WSS was found to have an incremental value over luminal narrowing for the discrimination of APC.30 In the largest CT biomechanical study to date, high WSS was associated with APCs independent of stenosis severity.31 The EMERALD study investigated the potential utility of CCTA and CFD derived hemodynamic parameters for the identification of high-risk plaques that cause acute coronary syndrome.7 Seventy-two patients (66 culprit and 150 non-culprit lesions) with ACS underwent assessment of WSS and APCs. The uniqueness of this study is that ACS was ascertained in all patients whose coronary lesions had been previously identified at coronary CTA. The study focused on evaluating non-invasive FFRCT, ΔFFRCT, WSS, and axial plaque stress as derived from the CCTA. The results showed that this non-invasive hemodynamic assessment enhanced the identification of high-risk plaques that subsequently caused ACS as compared to ‘anatomic’ adverse plaque characteristics. Culprit lesions were found to have significantly higher mean WSS, ΔFFRCT, and axial plaque stress and a lower FFRCT, than non-culprit lesions. While these parameters interact (e.g. WSS and axial plaque stress vary with FFRCT and with ΔFFRCT) but the way they influence the fate of atherosclerotic plaque is probably different. EMERALD II (NCT03591328) exploring the mechanism of coronary plaque rupture in ACS will validate the findings of the EMERALD study in a larger population.
5.3. Intravascular vs non-invasive imaging for WSS evaluation
Over the past two decades, vascular profiling of human atherosclerosis has established disturbed WSS as predictor of plaque progression, plaque vulnerability and even subsequent target vessel revascularization and myocardial infarction. Most of the literature and lessons learned thus far are derived from intravascular biomechanical profiling. However, CCTA imaging may be particularly well suited for the burgeoning field of computational vascular diagnostics.
Although intravascular imaging has superior spatial resolution, CCTA is non-invasive and safe, and is thus uniquely suitable for both broad screening and even serial assessment of plaque at multiple time points, a potentially critical advantage given the non-linear progression of atherosclerosis. CCTA also allows for assessment of the whole epicardial coronary tree which is neither practical nor often feasible using intravascular imaging. Intense interest in iterating CT technology to improve spatial and temporal resolution and simultaneously reduce radiation exposure will continue to increase adoption and acceptance of CCTA as the primary imaging modality for non-invasive risk stratification of CAD. While these developments help tip the scales towards increased use of CT for WSS computation, an increased trend towards lower dose CT may counteract this. Strong contrast opacification is crucial for correctly delineating the lumen border and hence accurate WSS measurement.
For WSS derived from CCTA to emerge as an important investigative and potentially clinical tool, the relationship between IVUS/angiography-derived WSS and CCTA-derived WSS needs to be better understood. To explore this, Bulant et al. performed a comparison of hemodynamic parameters between the gold standard fused angiography IVUS reconstructions and CCTA reconstructions.32 Hyperemic WSS was found to be higher in CCTA reconstructed coronary arteries due to the presence of a smaller lumen on CT. This was attributed to lower CT resolution, presence of calcifications and reduced pixel intensity in distal regions. Given the differences in WSS between IVUS and CCTA, caution should be applied when reporting absolute CCTA WSS values until prospectively validated. An interesting approach has been proposed to overcome the presence of artifacts in CCTA by fusing IVUS images with CT images instead of, as is traditionally done, angiographic images.33 This allows for high resolution representation of the lumen while still integrating accurate side-branch topology for the remaining coronary tree. Although, an intriguing investigational approach, fusing IVUS with CCTA will likely not allow for larger or prospective studies. Ultimately, larger serial and outcomes CCTA based studies of the natural history of coronary atherosclerosis with computational or machine learning based biomechanics will be warranted to fulfill the investigative and clinical potential of vascular diagnostics.
6. Conceptual framework for link between coronary pressure and flow and clinical outcomes towards integration of CT-derived WSS and pressure for predicting clinical outcomes
6.1. Pressure-based lesion assessment
Unquestionably, coronary pressure assessment has emerged as an indispensable tool to evaluate epicardial lesion severity and guide revascularization. FFR is an invasive index of myocardial perfusion. It is defined as the ratio of hyperemic flow in the presence of a stenosis to hyperemic flow in the hypothetical absence of the stenosis. This flow ratio can be easily derived from the ratio of distal coronary pressure to systemic pressure under condition of maximal hyperemia.34,35 In its most simple format, the FFR equation can be written as:
where Pd is distal coronary pressure and Pa is aortic pressure. FFR values above 0.75–0.80 have been associated with negative non-invasive stress tests and conversely, FFR values below 0.75 correlate well with abnormal non-invasive stress test to detect ischemia.36 It is clear that the lower the FFR the larger the transstenotic pressure gradient. Therefore, FFR incorporates the aggregate hemodynamic effect of an epicardial lesion on the flow to a given amount of myocardium so that FFR can be considered a surrogate metric of myocardial ischemia. Several randomized trials and large registries have demonstrated that when a stable lesion, including non-culprit stenoses in patients with acute coronary syndromes, is associated with an FFR value > 0.80, the patient will not benefit from revascularization of that lesion and the fate of these lesions will be very favorable under medical therapy alone. In contrast, when the lesion is associated with an FFR value ≤ 0.80, PCI with second or third generation drug-eluting stents improves overall clinical outcome.37–39 More recently, instantaneous wave free ratio (iFR), a non-hyperemic pressure index has been shown to be non-inferior to FFR with respect to predicting MACE.40,41 While these invasive physiological indices have transformed the evaluation and management of CAD in the catheterization laboratory, the opportunity to complement non-invasive anatomic assessment with such physiological evaluation has opened the field of computational vascular diagnostics.
6.2. FFR values derived from CCTA: FFRCT
CFD applied to routinely acquired CCTA images has been shown to reliably assess FFR values. In contrast to wire-based, FFRCT is non-invasive, does not need pharmacological vasodilation, and can easily be obtained in the 3 epicardial arteries. The scientific principles and clinical data have been recently reviewed and are beyond the scope of this review.42 Several prospective studies have demonstrated high diagnostic accuracy of this approach.43–45 From the clinician point of view, the most important aspect of FFRCT as compared to ‘regular’ CCTA is a higher specificity of FFRCT (with preserved sensitivity). A recent study demonstrated that FFRCT is significantly more accurate than SPECT, CCTA, and PET in predicting an abnormal invasive FFR.46 FFRCT is the first non-invasive test that allows simultaneous assessment of anatomy and physiology (Fig. 7). It is therefore to be expected that FFRCT, possibly in concert with CT myocardial perfusion, will become the first line non-invasive diagnostic test in patients with suspected CAD.
Fig. 7.
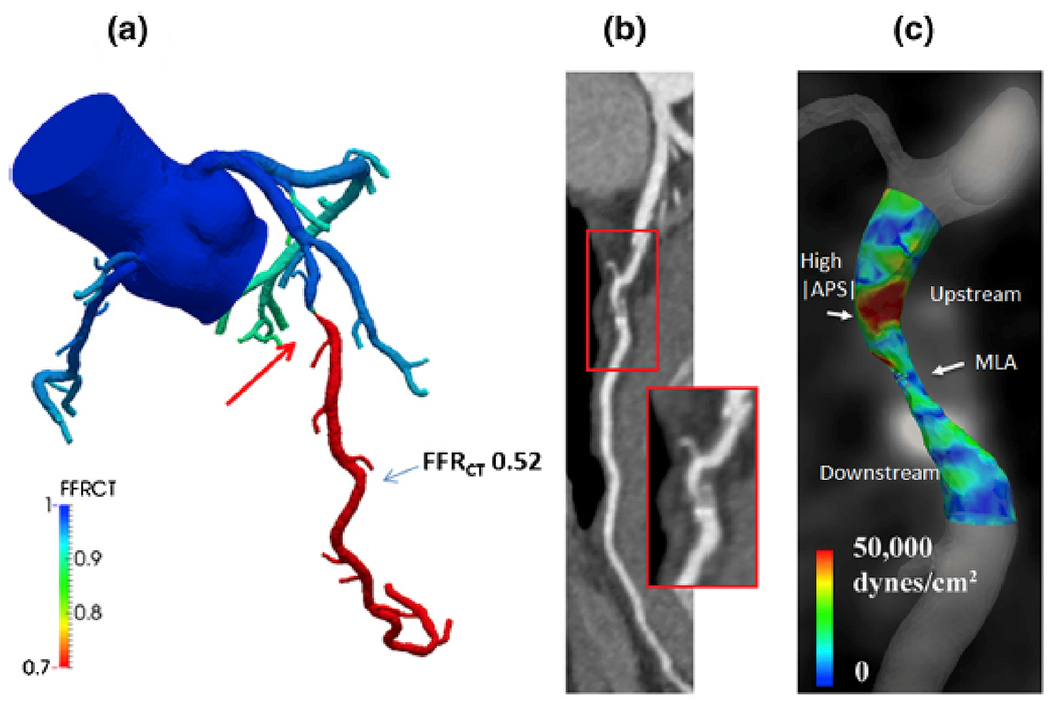
FFRCT and APS analysis computed under simulated hyperemic conditions. a, FFRCT indicates a functionally significant stenosis in the mid-LAD. b, coronary CT images reveal a mixed non-calcified and calcified plaque. c, APS values are elevated in the upstream segment of the lesion (modified from Nørgaard BL et al. Curr Cardiovasc Imaging Rep 2016 [47])
6.3. Mechanistic link between hemodynamics and clinical outcome
There are several biomechanical forces that impact the coronary vessel. While plaque structural stress and coronary pressure are of much greater magnitude than ESS or WSS, the effect of the latter is significantly amplified through the activation of mechanobiologic pathways. WSS is tangential to the lumen wall while pressure (the determinant of FFR) is perpendicular to the lumen wall, meaning these two forces are linearly independent. This independence suggests that WSS and FFR can be complementary to each other for risk stratification of lesions as recently demonstrated in their prognostic value for future myocardial infarction.6 Clinical observations have shown that WSS had no correlation with FFR in patients with FFR ≤ 0.806. Further, in a CT-based study WSS was found not to predict ischemia (FFR ≤ 0.8)31. If FFR is low, the pressure gradient will be large, even at rest, and the plaque stress, and the endothelial shear stress will tend to be high. On the contrary, in case of high FFR, there will be a small or negligible gradient, especially at rest, and all these destabilizing physical forces will be minimal or absent. This leads to a potential mechanistic hypothesis for coronary plaque evolution. Lesions will initially grow in regions of low WSS where LDL particles infiltrate the intima. Inflammation of the lesion creates morphological changes than can result in increased PSS. The lesion continues to grow and eventually encroaches on the lumen which often (though not always) causes ischemia. These more advanced lesions have greater WSS at the throat of the obstruction, leading to weakening of the fibrous cap and combined with high PSS may result in plaque rupture. Further studies are required to investigate the incremental benefit of measuring PSS, WSS and FFRCT on predicting MACE. Going forward CT may be the preferred modality for these studies due to its non-invasive nature and ability to visualize both the lumen and artery wall.
6.4. Future directions and application of non-invasive CCTA imaging and shear stress computations
It is very important to validate WSS derived from CCTA imaging against the more established gold standard of WSS derived from invasive coronary imaging. It also is critical to optimize the lumen border detection by CCTA to enable accurate representation of the naturally irregular and eccentric plaque borders, currently readily identified by invasive IVUS or OCT imaging, so that areas of adjacent low and high WSS can be routinely identified by the CCTA. Without detailed and accurate lumen borders, only mean WSS values have been used to gauge the pathobiologic role of local blood flow on the endothelium, and the potential pathobiologic role of low WSS in plaque natural history has not been investigated.
One can envision a future application strategy whereby CCTA will be utilized for widespread screening and risk-assessment of individuals with known CAD, or at risk of CAD, to determine whether a high-risk plaque is present. Such screening may even be performed serially over time since the natural history of individual coronary plaques is so heterogeneous. If a high-risk plaque is identified, then invasive investigation may proceed in the catheterization laboratory, with likely more detailed prognostic characterization of both the plaque and biomechanical forces, to inform a highly personalized preemptive treatment strategy for that individual coronary plaque. Accomplishment of such methods and strategies are expected to provide enormously valuable benefits to patients with CAD and to society at large.
Disclosures
HS: Medical Advisory Board, Philips; Institutional Research Grants from Medtronics, Abbott Vascular. Co-Founder, holding equity Covanos Inc. DSM: none. AUC: none. SASV: none. BDB: The Cardiovascular Center Aalst receives grant support from Abbott, Boston Scientific, Biotronik AG, and St Jude Medical and receives consulting fees on behalf of Dr De Bruyne from St. Jude Medical, Opsens, and Boston Scientific outside of the submitted work. Dr. De Bruyne is a shareholder for Siemens, GE, Bayer, Philips, HeartFlow, Edwards Life Sciences, and Ceyliad. PHS: Research support from Infraredx, AstraZeneca.
Footnotes
Appendix A.: Supplementary data
Supplementary data to this article can be found online at https://doi.org/10.1016/j.jcct.2019.11.012.
References
- 1.Calvert PA, Obaid DR, O’Sullivan M, et al. Association between IVUS findings and adverse outcomes in patients with coronary artery disease: the VIVA (VH-IVUS in Vulnerable Atherosclerosis) Study. JACC Cardiovasc Imaging. 2011;4:894–901. [DOI] [PubMed] [Google Scholar]
- 2.Cheng JM, Garcia-Garcia HM, de Boer SP, et al. In vivo detection of high-risk coronary plaques by radiofrequency intravascular ultrasound and cardiovascular outcome: results of the ATHEROREMO-IVUS study. Eur Heart J. 2014;35:639–647. [DOI] [PubMed] [Google Scholar]
- 3.Stone GW, Maehara A, Lansky AJ, et al. A prospective natural-history study of coronary atherosclerosis. N Engl J Med. 2011;364:226–235. [DOI] [PubMed] [Google Scholar]
- 4.Stone PH, Saito S, Takahashi S, et al. Prediction of progression of coronary artery disease and clinical outcomes using vascular profiling of endothelial shear stress and arterial plaque characteristics: the PREDICTION Study. Circulation. 2012;126:172–181. [DOI] [PubMed] [Google Scholar]
- 5.Costopoulos C, Huang Y, Brown AJ, et al. Plaque rupture in coronary atherosclerosis is associated with increased plaque structural stress. JACC Cardiovasc Imaging. 2017;10:1472–1483. [DOI] [PMC free article] [PubMed] [Google Scholar]
- 6.Kumar A, Thompson EW, Lefieux A, et al. High coronary shear stress in patients with coronary artery disease predicts myocardial infarction. J Am Coll Cardiol 2018;72:1926–1935. [DOI] [PubMed] [Google Scholar]
- 7.Lee JM, Choi G, Koo BK, et al. Identification of high-risk plaques destined to cause acute coronary syndrome using coronary computed tomographic angiography and computational fluid dynamics. JACC Cardiovasc Imaging. 2019;12:1032–1043. [DOI] [PubMed] [Google Scholar]
- 8.Stone PH, Maehara A, Coskun AU, et al. Role of low endothelial shear stress and plaque characteristics in the prediction of nonculprit major adverse cardiac events: the PROSPECT study. JACC Cardiovasc Imaging. 2018;11:462–471. [DOI] [PubMed] [Google Scholar]
- 9.Brown AJ, Teng Z, Evans PC, Gillard JH, Samady H, Bennett MR. Role of biomechanical forces in the natural history of coronary atherosclerosis. Nat Rev Cardiol 2016;13:210–220. [DOI] [PubMed] [Google Scholar]
- 10.Slager CJ, Wentzel JJ, Gijsen FJ, et al. The role of shear stress in the generation of rupture-prone vulnerable plaques. Nat Clin Pract Cardiovasc Med. 2005;2:401–407. [DOI] [PubMed] [Google Scholar]
- 11.Chatzizisis YS, Coskun AU, Jonas M, Edelman ER, Feldman CL, Stone PH. Role of endothelial shear stress in the natural history of coronary atherosclerosis and vascular remodeling: molecular, cellular, and vascular behavior. J Am Coll Cardiol 2007;49:2379–2393. [DOI] [PubMed] [Google Scholar]
- 12.Eshtehardi P, Brown AJ, Bhargava A, et al. High wall shear stress and high-risk plaque: an emerging concept. Int J Cardiovasc Imaging. 2017;33:1089–1099. [DOI] [PMC free article] [PubMed] [Google Scholar]
- 13.Koskinas KC, Sukhova GK, Baker AB, et al. Thin-capped atheromata with reduced collagen content in pigs develop in coronary arterial regions exposed to persistently low endothelial shear stress. Arterioscler Thromb Vasc Biol 2013;33:1494–1504. [DOI] [PMC free article] [PubMed] [Google Scholar]
- 14.Malek AM, Alper SL, Izumo S. Hemodynamic shear stress and its role in atherosclerosis. J Am Med Assoc. 1999;282:2035–2042. [DOI] [PubMed] [Google Scholar]
- 15.Samady H, Eshtehardi P, McDaniel MC, et al. Coronary artery wall shear stress is associated with progression and transformation of atherosclerotic plaque and arterial remodeling in patients with coronary artery disease. Circulation. 2011;124:779–788. [DOI] [PubMed] [Google Scholar]
- 16.Chatzizisis YS, Jonas M, Coskun AU, et al. Prediction of the localization of high-risk coronary atherosclerotic plaques on the basis of low endothelial shear stress: an intravascular ultrasound and histopathology natural history study. Circulation. 2008;117:993–1002. [DOI] [PubMed] [Google Scholar]
- 17.Slager CJ, Wentzel JJ, Gijsen FJ, et al. The role of shear stress in the destabilization of vulnerable plaques and related therapeutic implications. Nat Clin Pract Cardiovasc Med. 2005;2:456–464. [DOI] [PubMed] [Google Scholar]
- 18.Davies PF. Flow-mediated endothelial mechanotransduction. Physiol Rev. 1995;75:519–560. [DOI] [PMC free article] [PubMed] [Google Scholar]
- 19.White SJ, Hayes EM, Lehoux S, Jeremy JY, Horrevoets AJ, Newby AC. Characterization of the differential response of endothelial cells exposed to normal and elevated laminar shear stress. J Cell Physiol 2011;226:2841–2848. [DOI] [PMC free article] [PubMed] [Google Scholar]
- 20.Gijsen F, van der Giessen A, van der Steen A, Wentzel J. Shear stress and advanced atherosclerosis in human coronary arteries. J Biomech. 2013;46:240–247. [DOI] [PubMed] [Google Scholar]
- 21.Chen Z, Mondal NK, Zheng S, et al. High shear induces platelet dysfunction leading to enhanced thrombotic propensity and diminished hemostatic capacity. Platelets. 2017:1–8. [DOI] [PMC free article] [PubMed] [Google Scholar]
- 22.Giannopoulos AA, Zhao S, Chatzizisis YS. Rupture of a stenotic thin-cap fibroatheroma in an area of low endothelial shear stress: implication for mechanism of acute coronary syndromes. Eur Heart J Cardiovasc Imaging. 2018;19:950–951. [DOI] [PubMed] [Google Scholar]
- 23.Fukumoto Y, Hiro T, Fujii T, et al. Localized elevation of shear stress is related to coronary plaque rupture: a 3-dimensional intravascular ultrasound study with in-vivo color mapping of shear stress distribution. J Am Coll Cardiol 2008;51:645–650. [DOI] [PubMed] [Google Scholar]
- 24.Torii R, Stettler R, Raber L, et al. Implications of the local hemodynamic forces on the formation and destabilization of neoatherosclerotic lesions. Int J Cardiol 2018;272:7–12. [DOI] [PubMed] [Google Scholar]
- 25.Stone PH, Coskun AU, Kinlay S, et al. Effect of endothelial shear stress on the progression of coronary artery disease, vascular remodeling, and in-stent restenosis in humans: in vivo 6-month follow-up study. Circulation. 2003;108:438–444. [DOI] [PubMed] [Google Scholar]
- 26.Corban MT, Eshtehardi P, Suo J, et al. Combination of plaque burden, wall shear stress, and plaque phenotype has incremental value for prediction of coronary atherosclerotic plaque progression and vulnerability. Atherosclerosis. 2014;232:271–276. [DOI] [PubMed] [Google Scholar]
- 27.Frauenfelder T, Boutsianis E, Schertler T, et al. In-vivo flow simulation in coronary arteries based on computed tomography datasets: feasibility and initial results. Eur Radiol 2007;17:1291–1300. [DOI] [PubMed] [Google Scholar]
- 28.Wellnhofer E, Osman J, Kertzscher U, Affeld K, Fleck E, Goubergrits L. Flow simulation studies in coronary arteries–impact of side-branches. Atherosclerosis. 2010;213:475–481. [DOI] [PubMed] [Google Scholar]
- 29.Hetterich H, Jaber A, Gehring M, et al. Coronary computed tomography angiography based assessment of endothelial shear stress and its association with atherosclerotic plaque distribution in-vivo. PLoS One. 2015;10:e0115408. [DOI] [PMC free article] [PubMed] [Google Scholar]
- 30.Park JB, Choi G, Chun EJ, et al. Computational fluid dynamic measures of wall shear stress are related to coronary lesion characteristics. Heart 2016;102:1655–1661. [DOI] [PubMed] [Google Scholar]
- 31.Han D, Starikov A, OH B, et al. Relationship between endothelial wall shear stress and high-risk atherosclerotic plaque characteristics for identification of coronary lesions that cause ischemia: a direct comparison with fractional flow reserve. J Am Heart Assoc. 2016;5. [DOI] [PMC free article] [PubMed] [Google Scholar]
- 32.Bulant CA, Blanco PJ, Maso Talou GD, Bezerra CG, Lemos PA, Feijoo RA. A head-to-head comparison between CT- and IVUS-derived coronary blood flow models. J Biomech. 2017;51:65–76. [DOI] [PubMed] [Google Scholar]
- 33.van der Giessen AG, Schaap M, Gijsen FJ, et al. 3D fusion of intravascular ultrasound and coronary computed tomography for in-vivo wall shear stress analysis: a feasibility study. Int J Cardiovasc Imaging. 2010;26:781–796. [DOI] [PubMed] [Google Scholar]
- 34.De Bruyne B, Baudhuin T, Melin JA, et al. Coronary flow reserve calculated from pressure measurements in humans. Validation with positron emission tomography. Circulation. 1994;89:1013–1022. [DOI] [PubMed] [Google Scholar]
- 35.Pijls NH, van Son JA, Kirkeeide RL, De Bruyne B, Gould KL. Experimental basis of determining maximum coronary, myocardial, and collateral blood flow by pressure measurements for assessing functional stenosis severity before and after percutaneous transluminal coronary angioplasty. Circulation. 1993;87:1354–1367. [DOI] [PubMed] [Google Scholar]
- 36.Pijls NH, De Bruyne B, Peels K, et al. Measurement of fractional flow reserve to assess the functional severity of coronary-artery stenoses. N Engl J Med. 1996;334:1703–1708. [DOI] [PubMed] [Google Scholar]
- 37.De Bruyne B, Pijls NH, Kalesan B, et al. Fractional flow reserve-guided PCI versus medical therapy in stable coronary disease. N Engl J Med. 2012;367:991–1001. [DOI] [PubMed] [Google Scholar]
- 38.Pijls NH, Fearon WF, Tonino PA, et al. Fractional flow reserve versus angiography for guiding percutaneous coronary intervention in patients with multivessel coronary artery disease: 2-year follow-up of the FAME (Fractional Flow Reserve versus Angiography for Multivessel Evaluation) study. J Am Coll Cardiol 2010;56:177–184. [DOI] [PubMed] [Google Scholar]
- 39.Pijls NH, van Schaardenburgh P, Manoharan G, et al. Percutaneous coronary intervention of functionally nonsignificant stenosis: 5-year follow-up of the DEFER Study. J Am Coll Cardiol 2007;49:2105–2111. [DOI] [PubMed] [Google Scholar]
- 40.Davies JE, Sen S, Dehbi HM, et al. Use of the instantaneous wave-free ratio or fractional flow reserve in PCI. N Engl J Med. 2017;376:1824–1834. [DOI] [PubMed] [Google Scholar]
- 41.Gotberg M, Christiansen EH, Gudmundsdottir IJ, et al. Instantaneous wave-free ratio versus fractional flow reserve to guide PCI. N Engl J Med. 2017;376:1813–1823. [DOI] [PubMed] [Google Scholar]
- 42.Min JK, Taylor CA, Achenbach S, et al. Noninvasive fractional flow reserve derived from coronary CT angiography: clinical data and scientific principles. JACC Cardiovasc Imaging. 2015;8:1209–1222. [DOI] [PubMed] [Google Scholar]
- 43.Koo BK, Erglis A, Doh JH, et al. Diagnosis of ischemia-causing coronary stenoses by noninvasive fractional flow reserve computed from coronary computed tomographic angiograms. Results from the prospective multicenter DISCOVER-FLOW (Diagnosis of Ischemia-Causing Stenoses Obtained via Noninvasive Fractional Flow Reserve) study. J Am Coll Cardiol 2011;58:1989–1997. [DOI] [PubMed] [Google Scholar]
- 44.Min JK, Leipsic J, Pencina MJ, et al. Diagnostic accuracy of fractional flow reserve from anatomic CT angiography. J Am Med Assoc. 2012;308:1237–1245. [DOI] [PMC free article] [PubMed] [Google Scholar]
- 45.Nørgaard BL, Leipsic J, Gaur S, et al. Diagnostic performance of noninvasive fractional flow reserve derived from coronary computed tomography angiography in suspected coronary artery disease: the NXT trial (Analysis of Coronary Blood Flow Using CT Angiography: next Steps). J Am Coll Cardiol 2014;63:1145–1155. [DOI] [PubMed] [Google Scholar]
- 46.Driessen RS, Danad I, Stuijfzand WJ, et al. Comparison of coronary computed tomography angiography, fractional flow reserve, and perfusion imaging for ischemia diagnosis. J Am Coll Cardiol 2019;73:161–173. [DOI] [PubMed] [Google Scholar]
- 47.Nørgaard BL, Leipsic J, Koo BK, et al. Coronary computed tomography derived fractional flow reserve and plaque stress. Curr Cardiovasc Imaging Rep. 2016;9(2) 10.1007/s12410-015-9366-5. [DOI] [PMC free article] [PubMed] [Google Scholar]


