

Abstract
Background
Although conventional colonoscopy is the most accurate test available for the investigation of the colorectum for polyps, data exist that raise concerns about its sensitivity. Chromoscopy (spraying dye onto the surface of the colon to make polyps more visible) may be one way of enhancing the ability of colonoscopy to detect polyps, particularly diminutive flat lesions, which otherwise may be difficult to detect.
Objectives
To determine whether the use of chromoscopy enhances the detection of polyps and neoplasia during endoscopic examination of the colon and rectum.
Search methods
We searched the following databases: Cochrane Colorectal Cancer Group Specialised Register (October 2015), Cochrane Central Register of Controlled Trials (CENTRAL) (Cochrane Library; Issue 10, 2015), MEDLINE (January 1950 to October 2015), EMBASE (January 1974 to October 2015), and ClinicalTrials.gov and World Health Organization International Clinical Trials Registry Platform (both November 2015). We also handsearched abstracts from relevant meetings from 1980 to 2015. Search terms included 'randomised trials' containing combinations of the following: 'chromoscopy' 'colonoscopy' 'dye‐spray' 'chromo‐endoscopy' 'indigo‐carmine' 'magnifying endoscopy'.
Selection criteria
We included all prospective randomised trials comparing chromoscopic with conventional endoscopic examination of the whole of the colon and rectum. We excluded studies of people with inflammatory bowel disease or polyposis syndromes and any studies that combined chromoscopy with additional interventions (cap assistance, water‐perfused, etc.).
Data collection and analysis
Two review authors independently assessed the methodological quality of potentially eligible trials, and two review authors independently extracted data from the included trials. Outcome measures included the detection of polyps (neoplastic and non‐neoplastic), the detection of diminutive lesions, the number of participants with multiple neoplastic lesions, and the extubation time.
Main results
We included seven trials (2727 participants) in this update. Five trials were of sufficiently similar design to allow for pooled results. Two trials differed substantially in design and were included in a subgroup analysis. All the trials had some methodological drawbacks. However, combining the results showed a significant difference in favour of chromoscopy for all detection outcomes. In particular, chromoscopy was likely to yield significantly more people with at least one neoplastic lesion (odds ratio (OR) 1.53, 95% confidence interval (CI) 1.31 to 1.79; 7 trials; 2727 participants), and at least one diminutive neoplastic lesion (OR 1.51, 95% CI 1.19 to 1.92; 4 trials; 1757 participants). Significantly more people with three or more neoplastic lesions were also detected, but only when studies that used high‐definition colonoscopy in the control group were excluded (OR 4.63, 95% CI 1.99 to 10.80; 2 trials; 519 participants). None of the included studies reported any adverse events related to the use of the contrast dye.
Authors' conclusions
There is strong evidence that chromoscopy enhances the detection of neoplasia in the colon and rectum. People with neoplastic polyps, particularly those with multiple polyps, are at increased risk of developing colorectal cancer. Such lesions, which presumably would be missed with conventional colonoscopy, could contribute to the interval cancer numbers on any surveillance programme.
Plain language summary
Does chromoscopy (dye‐spraying) improve rates of polyp detection when compared to conventional colonoscopy?
Background
Colonoscopy is a diagnostic fibreoptic investigation that enables growths in the bowel (polyps) to be detected. Some of these polyps can develop into cancer. Although colonoscopy is the most accurate available test for the detection of these growths, some polyps, especially smaller ones, can be missed for a variety of reasons, including how well the polyp can be seen against the background of the normal lining of the large intestine (mucosa). It is important to identify even small polyps, which are often the precursors to cancer. Dye spraying (chromoscopy) is one of the simpler ways to make polyps stand out against the normal bowel mucosa, and hence be more easily seen.
Objectives
We aimed to evaluate whether or not chromoscopy improves polyp detection in people undergoing screening for colorectal cancer.
Study characteristics
Following a rigorous review of the literature, we included seven studies in our analysis with a total of 2727 participants. We included all studies that compared chromoscopy and conventional colonoscopy of the entire colon in people at risk of having polyps. The participants in the studies varied, however all were considered to be at low or average risk of developing polyps.
All the included studies randomised people to either conventional colonoscopy or chromoscopy. Two trials used a study design that differed from the others, by performing a conventional colonoscopy in all people first and removing any polyps observed, then randomising people to either conventional colonoscopy or chromoscopy. The goal of these studies was to determine the number of extra polyps identified with the two techniques, rather than the total number of polyps.
Key findings
The analysis showed that the rate of detection of small polyps was improved by chromoscopy by about 90%. Of even greater clinical importance, the analysis showed that the detection of small polyps that could potentially develop into cancer was increased by about 30% when chromoscopy was used. The detection rate was not different in people with large polyps or cancer, as these are easily enough seen at conventional colonoscopy. No adverse events were reported related to the use of the contrast dye.
Quality of the evidence
There were drawbacks to the quality of the evidence based on methodology. On a basic level, study designs of this type do not allow blinding of the examiner. More subtle variations in study design also introduced variation in the data that could impact the reliability of the results. For example, in some studies the time spent examining the colon was standardised in both people undergoing chromoscopy and those undergoing conventional colonoscopy, whereas in other studies it was not; as the time spent examining the bowel will influence the number of polyps detected, and this standardisation does not reflect clinical practice, this makes generalising results from these studies to clinical practice more difficult. Other potential causes of variation included the different points of randomisation of participants (that is before the single colonoscopy or before a second procedure, that latter which as highlighted earlier looks only at additional polyps identified) and the reasons for the people undergoing colonoscopy (for example people taking part in a general screening programme may have smaller and less easily detected polyps than those presenting with symptoms).
Summary of findings
Summary of findings for the main comparison. Chromoscopy compared to conventional colonoscopy for the detection of polyps.
| Chromoscopy compared to conventional colonoscopy for the detection of polyps | |||||
|
Patient or population: people undergoing colonoscopy for the detection of polyps Settings: those patients undergoing endoscopy for investigation of gastrointestinal symptoms, as part of a screening programme or surveillance for colorectal neoplasia due to a family history of colorectal cancer, previous polyp detection, or a previous colorectal cancer resection Intervention: pan‐chromoscopy Comparison: conventional colonoscopy | |||||
| Outcomes | Illustrative comparative risks* (95% CI) | Relative effect (95% CI) | No of Participants (studies) | Quality of the evidence (GRADE) | |
| Assumed risk | Corresponding risk | ||||
| Conventional colonoscopy | Pan‐chromoscopy | ||||
| Total polyps (neoplastic and non‐neoplastic) detected | The mean total polyps ranged across control groups from 0.4 to 2.1 | The mean total polyps in the intervention group was 1.91 (1.3 to 3.1) | MD 0.89 (0.74 to 1.04) | 2727 (7) | ⊕⊕⊝⊝ low |
| Total neoplastic lesions | The mean total neoplastic lesions ranged across control groups from 0.2 to 1.1 | The mean total neoplastic lesions in the intervention groups was 0.89 (0.6 to 1.3) | MD 0.33 (0.25 to 0.41) | 2727 (7) | ⊕⊕⊝⊝ low |
| Number of participants with at least 1 polyp (neoplastic or non‐neoplastic) | 529 per 1000 | 676 per 1000 (589 to 704) | OR 1.87 (1.51 to 2.30) | 1515 (4) | ⊕⊕⊝⊝ low |
| Total participants with at least 1 neoplastic lesion | 380 per 1000 | 481 per 1000 (331 to 648) | OR 1.53 (1.31 to 1.79) | 2727 (7) | ⊕⊕⊝⊝ low |
| Number of diminutive neoplastic lesions | The mean number of diminutive polyps ranged across control groups from 0.27 to 0.7 | The mean number of diminutive polyps in the intervention groups was 0.63 (0.4 to 0.8) | MD 0.21 (0.10 to 0.32) | 1409 (4) | ⊕⊕⊝⊝ low |
| Participants with diminutive neoplastic lesions | 170 per 1000 | 236 per 1000 (165 to 373) | OR 1.51 (1.19 to 1.92) | 1757 (4) | ⊕⊕⊝⊝ low |
| Number of participants with 3 or more adenomas (in studies with single intubation) | 26 per 1000 | 111 per 1000 (101 to 121) | OR 4.63 (1.99 to 10.80) | 519 (2) | ⊕⊕⊝⊝ low |
| Adverse events | Unestimable as no data supplied | Unestimable as no data supplied | ‐ | ‐ | ‐ |
| *The basis for the assumed risk (e.g. the median control group risk across studies) is provided in footnotes. The corresponding risk (and its 95% confidence interval) is based on the assumed risk in the comparison group and the relative effect of the intervention (and its 95% CI). CI: confidence interval; MD: mean difference; OR: odds ratio | |||||
| GRADE Working Group grades of evidence High quality: Further research is very unlikely to change our confidence in the estimate of effect. Moderate quality: Further research is likely to have an important impact on our confidence in the estimate of effect and may change the estimate. Low quality: Further research is very likely to have an important impact on our confidence in the estimate of effect and is likely to change the estimate. Very low quality: We are very uncertain about the estimate. | |||||
The nature of diminutive polyp detection means that it is likely that some of the included studies are underpowered. Furthermore, significant heterogeneity is introduced by the variability of the colonoscopes used in the studies as well as the differences in dye‐spraying technique. There are also subtle but clear differences in the study inclusion criteria that affect the quality of the pooled evidence.
Background
Description of the condition
A polyp is defined as a protuberant lesion in the mucosa of the bowel. It may be precancerous (neoplastic adenoma) or non‐precancerous (non‐neoplastic, including hyperplastic polyps). The malignant potential for adenomas has been recognised for over a century (Horfstad 2003), and strong evidence exists that suggests detection and removal of these adenomas will reduce colorectal cancer risk and mortality (Winawer 1993; Zauber 2012). Although conventional colonoscopy is the most accurate test available for the detection of all types of polyp, data exist that raise concerns about its sensitivity (ability to detect lesions when present). The National Polyp Study investigated a large cohort of 1418 people who had undergone colonoscopy and polypectomy for an adenoma (Winawer 1993). Long‐term follow‐up (8401 person‐years) showed a clear reduction in colorectal cancer when compared to three reference populations, emphasising the point that polyp detection and removal reduces bowel cancer risk. However, five people developed cancers in the period between the initial and a follow‐up colonoscopy. Although it is possible that these cancers arose in the short period between the colonoscopies, it is perhaps more likely that precursor lesions were missed. Further concerns about colonoscopic sensitivity come from studies of cohorts undergoing 'back‐to‐back' colonoscopy (one colonoscopy followed immediately by another) (Hixson 1990; Rex 1997; Heresbach 2008). These studies suggest that as many as a quarter of polyps may be missed. Although most of these missed polyps were small (less than 5 mm), some were greater than 1 cm and therefore of significant malignant potential (Muto 1975; Shinya 1979; Eide 1986; Hermanek 1987). Screening studies have also highlighted the importance of adenoma detection, reporting that people undergoing colonoscopy by endoscopists with a low adenoma detection rate (ADR) had a significantly higher risk of interval colorectal cancer (CRC) (Kaminski 2010).
A number of factors may contribute to missed lesions and variability in ADR. Perhaps the most important relate to endoscopic technique. Good colonoscopy withdrawal technique necessitates looking behind folds, with particular attention to flexures and other relative blind spots, aspirating or flushing away residue, and optimising distension (sometimes helped by position change and the use of antispasmodics). This clearly takes time, and many studies have shown that withdrawal time is an important determinant of ADR. Barclay 2008 found that endoscopists who spent more than eight minutes examining the bowel during colonoscopy withdrawal had a higher ADR compared to those who spent less than eight minutes.
Patient‐related factors may also influence mucosal visualisation. Poor bowel preparation may obscure polyps and diverticular disease and adhesions may limit the endoscopist's view. A technically difficult intubation may result in incomplete examinations and less adequate views on withdrawal due to time constraints and reduced concentration by the endoscopist.
Finally, the polyp features themselves may influence the miss rate. So‐called flat adenomas are small minimally raised (or even centrally depressed) lesions that are difficult to see using conventional endoscopy, often appearing as slight distortions of the mucosal colour or contour or disruptions of the vascular architecture.
There is controversy as to whether diminutive polyps are of clinical significance. Polyp size and the presence of high‐grade dysplasia or villous histology are associated with focal cancer within an individual adenoma (O'Brien 1990), whereas polyp number and size are the most consistent risk factors for metachronous adenomas and cancer. Diminutive polyps are rarely malignant, and the rapid development of invasive cancer from a small (less than 10 mm) neoplastic lesion is unlikely (Eide 1986). However, it seems that morphologically flat lesions may be an exception to this rule, with high‐grade dysplasia being related more to whether there is a depressed component to the polyp (Rembacken 2000; Tsuda 2002). In addition, there are a small number of descriptions of advanced cancer in lesions less than 10 mm in the literature (Ueta 2000; Hurlstone 2003).
Description of the intervention
Contrast dyes are the main dyes used in colonic chromoscopy (also known as chromocolonoscopy or chromo‐endoscopy). They are neither absorbed nor do they react with the mucosal cells; they merely outline the mucosal morphology. The main contrast dye used is indigo‐carmine. Concentrations vary widely, ranging from 0.2% to 2%. The reason for the variation is unclear and probably relates to endoscopist preference. Delivery is either 'targeted' at areas of mucosal irregularity that have been detected by white‐light endoscopy or 'pan‐colonic', aiming to dye‐spray the whole of the colonic mucosa. Targeted dye spraying involves drawing up a small volume of dye (3 to 5 ml) in a large syringe along with air. The syringe is then emptied through the biopsy channel of the colonoscope along with the air to create a spray effect on the colonic wall. Pan‐colonic dye spraying usually employs a catheter, often a diffusion catheter (a simple tube with a sprinkler device at the proximal end), which allows diffuse mucosal coverage of the whole colon, irrespective of its endoscopic appearance, using a larger volume of dilute dye. Contrast dyes are simple to use, safe, and cheap, but also can be labour‐intensive, time‐consuming, and messy.
How the intervention might work
Dye spraying, or chromoscopy techniques, were first described in the 1970s as a way of making fine mucosal surface detail more visible at endoscopy (Tada 1977). While frequently used in the upper gastrointestinal tract to detect early gastric neoplasia, in Lambert 2002, and premalignant tissue (dysplasia) in the oesophagus, in Fennerty 1999, chromoscopy in the colon is now advocated as a way of increasing the detection of colonic polyps (particularly flat lesions) by better definition of mucosal topography and highlighting of subtle mucosal abnormalities (ASGE 2007). High‐definition colonoscopy (essentially enhanced image resolution using advanced digital imaging systems) could be expected to improve polyp detection even further, especially if coupled with chromoscopy (Bruno 2003).
Why it is important to do this review
With the advent of screening programmes for polyps that involve colonoscopy in many countries, it is imperative to ensure optimal sensitivity. Several studies have examined the effect of pan‐colonic chromoscopy on enhancing polyp detection, but the data are inconsistent. The aim of this review was to examine the hypothesis that pan‐colonic chromoscopy can enhance polyp detection compared with conventional colonoscopy. As chromoscopy has implications in terms of extra time taken to perform the procedure properly, and potential increased morbidity, we have examined these aspects as secondary endpoints.
Before listing the objectives, it is important to define the outcome measures of each colonoscopy. The procedure can be classified as normal or abnormal, with various abnormalities described. Such abnormalities could be polyps, adenomas, lesions, or neoplasia in the literature. In order to standardise definitions and to allow for comparison, a polyp is defined as a protuberant lesion that could be neoplastic (adenoma or carcinoma) or non‐neoplastic (hyperplastic or inflammatory). A neoplastic polyp includes adenoma or carcinoma only.
Objectives
To determine whether the use of chromoscopy enhances detection of polyps and neoplasia during endoscopic examination of the colon and rectum.
Methods
Criteria for considering studies for this review
Types of studies
We considered studies in which participants have been prospectively randomised to either chromoscopic or conventional endoscopic examination of the lower gastrointestinal tract for this review.
We used the following inclusion and exclusion criteria:
Inclusion criteria
Randomised controlled trials (RCTs) and cluster RCTs;
Trials comparing chromoscopic with conventional endoscopy for the detection of polyps.
Exclusion criteria
Studies in which only part of the colorectum was examined;
Studies in which chromoscopy was combined with another technique such as cap assistance or water perfusion.
Types of participants
Inclusion criteria
We included adults undergoing conventional or chromoscopic endoscopy for investigation of gastrointestinal symptoms, as part of a screening programme, or surveillance for colorectal neoplasia due to a family history of colorectal cancer, previous polyp detection, or a previous colorectal cancer resection. The risk of polyps varies in these groups from average to high compared with the general population.
Exclusion criteria
People undergoing surveillance for inflammatory bowel disease (IBD);
People undergoing surveillance for known polyposis syndromes (familial adenomatous polyposis (FAP) or hereditary non‐polyposis colorectal cancer (HNPCC)).
The potential yield of neoplasia and the distribution in the colon may differ in people with IBD or polyposis syndrome compared to the general population. In addition, in the IBD group the characteristics of neoplasia (that is dysplasia‐associated lesion or mass (DALMs)) may not be typical of polyps detected in people without IBD. These groups may therefore not be representative in terms of the primary and some secondary outcomes.
Types of interventions
Comparison of chromoscopy with conventional endoscopy; the use of either standard or high‐resolution colonoscopy was eligible.
Types of outcome measures
Primary outcomes
Number of polyps detected per participant with each intervention (including neoplastic and non‐neoplastic lesions)
Number of neoplastic polyps (adenomas/carcinomas) detected per participant with each intervention
Number of participants with at least one polyp (neoplastic and non‐neoplastic) detected with each intervention
Number of participants with at least one neoplastic polyp (adenoma/carcinoma) detected with each intervention
Secondary outcomes
Number of diminutive neoplastic (adenoma/carcinoma) polyps (< 5 mm) detected per participant with each intervention
Number of participants with at least one diminutive neoplastic (adenoma/carcinoma) polyp (< 5 mm) detected with each intervention
Number of participants with more than three neoplastic (adenoma/carcinoma) polyps detected with each intervention
Extubation time
Site of the lesions found (proximal colon (caecum to splenic flexure) and distal colon/rectum (distal to splenic flexure))
Adverse events (complications related to the contrast dye)
Participant discomfort
Search methods for identification of studies
Electronic searches
We conducted a comprehensive literature search to identify all published and unpublished randomised controlled trials with no language restriction. We searched the following electronic databases to identify potential studies:
Cochrane Colorectal Cancer Group (CCCG) Specialised Register (October 2015);
Cochrane Central Register of Controlled Trials (CENTRAL) (the Cochrane Library; Issue 10, 2015) (Appendix 1);
MEDLINE Ovid (January 1950 to 26 October 2015) (Appendix 2);
EMBASE Ovid (January 1974 to 26 October 2015) (Appendix 3);
ClinicalTrials.gov (November 2015);
WHO ICTRP (November 2015).
Searching other resources
We screened proceedings and abstracts of relevant meetings for presentations not yet in print, from 1980‐2015. These included the annual meetings of the Association of Coloproctology of Great Britain and Ireland, European Association of Coloproctology, American Society of Colon and Rectal Surgeons, Royal Society of Medicine (coloproctology section), British Society of Gastroenterology, and American Gastroenterology Association.
We also searched the list of cited references in all included reports for additional comparative studies. We contacted authors of published reports, querying their awareness of ongoing studies.
Data collection and analysis
We conducted the review according to the recommendations of the Cochrane Handbook for Systematic Reviews of Interventions (Higgins 2011) and the CCCG.
Selection of studies
Four review authors (SRB, WB, SD, SR) examined all the citations and abstracts derived from the electronic searches. We retrieved full reports of potentially relevant trials. The review authors independently applied the selection criteria to trial reports. We included studies irrespective of whether measured outcome data were reported in a useable way. The review authors were not blind to the names of authors, institutions, or journals. We resolved any disagreements by discussion.
Data extraction and management
Two review authors (WB, SRB) independently undertook data extraction from the included trials. We processed the data as described in the Cochrane Handbook for Systematic Reviews of Interventions (Higgins 2011), resolving any differences of opinion by discussion. Data extraction included authors, title of study, and year of publication. We also extracted data on the following.
Study design (including participant type and demographics)
Study size
Type of control
Number of polyps detected (neoplastic and non‐neoplastic) per group and per participant
Site of polyps
Length of procedure
Adverse events
Participant discomfort
Experience of endoscopists
Assessment of risk of bias in included studies
Two review authors independently assessed the methodological quality of identified trials, taking into account the quality of random allocation concealment and the description of dropouts and withdrawals, as well as blinding of the participants and personnel to the intervention (Figure 1; Figure 2). Other potential bias investigated included detection bias related to different study design and selective reporting. The review authors performed the 'Risk of bias' assessment following the instructions and using the items given in in Chapter 8 of the Cochrane Handbook for Systematic Reviews of Interventions: "The Cochrane Collaboration’s tool for assessing risk of bias" (see Appendix 4) (Higgins 2011), resolving any disagreements by discussion. For overall 'Risk of bias' considerations of included trials, see Appendix 5. We have summarised the excluded studies and the reasons for their exclusion in Characteristics of excluded studies.
1.

Methodological quality graph: review authors' judgements about each methodological quality item presented as percentages across all included studies.
2.

Methodological quality summary: review authors' judgements about each methodological quality item for each included study.
Measures of treatment effect
We carried out statistical analysis of the data using the Review Manager software (Version 5.3) (Review Manager 2014).
We calculated odds ratios and 95% confidence intervals (CIs) for dichotomous outcomes and weighted mean differences (WMD) and 95% CI for continuous outcomes, processing continuous variables using the mean and standard deviation values. When only means and ranges were available, we estimated the standard deviation using the following assumption: In an overview of the results of included studies, almost all participants had either no polyps or one polyp. We therefore assumed that over 95% of participants would have none, one, or two polyps and that a standard deviation of 2.00 for polyps of all types and 1.00 for neoplastic polyps would give conservative uncertainty values.
Unit of analysis issues
The unit of analysis was the individual participant as we identified no cluster RCTs; there were no unit of analysis concerns.
Dealing with missing data
We attempted to obtain all missing information from the trial authors. Where the raw data and a standard deviation were unavailable, we estimated the standard deviation as detailed in the Measures of treatment effect section. Where a complete data set was missing, we excluded the study from the particular analysis.
Assessment of heterogeneity
We examined statistically significant heterogeneity by both the I² statistic and the Chi² test. The I² statistic describes the percentage of total variation across studies due to heterogeneity rather than to chance (Higgins 2003). A value of 0% indicates no detected heterogeneity, and larger values show increasing heterogeneity; substantial heterogeneity is considered to exist when I² is larger than 50% although it is accepted that, when there are few studies, I² becomes less accurate. For the Chi² test, we used a P value of less than 0.10 to indicate the presence of statistically significant heterogeneity.
Assessment of reporting biases
As there were only seven included RCTs, we did not attempt to assess publication bias using funnel plots. However, we found no additional study protocols in the literature to indicate publication bias.
Data synthesis
We summarised data statistically if they were available for analysis, sufficiently comparable, of a similar and appropriate study design, and of good quality, using the Mantel‐Haenszel fixed‐effect model. We performed statistical analyses according to the statistical guidelines referenced in the Cochrane Handbook for Systematic Reviews of Interventions (Higgins 2011). The result of the meta‐analysis for each outcome is presented graphically as a forest plot.
Subgroup analysis and investigation of heterogeneity
We carried out subgroup analysis in the following circumstances.
Studies that used a conventional colonoscopy and polyp removal in all participants prior to randomisation, as this could increase detection bias and measures a different detection rate (that is the rate of additional polyps detected, rather than a comparison of the overall rate of detection).
Where details were given about location of polyps (proximal or distal colon).
High‐definition versus conventional colonoscopy.
Sensitivity analysis
We planned to carry out sensitivity analyses when there were instances of statistical heterogeneity, which included the following.
Removal of studies that used inexperienced colonoscopists, as this could lead to poor colonoscopist performance, and therefore poorer detection rates.
Removal of outliers if we could identify a methodological or clinical difference in the outlying study that could explain the heterogeneity.
Summary of findings
We assessed the quality of evidence using the Grading of Recommendations Assessment, Development and Evaluation (GRADE) approach, which we presented in a 'Summary of findings' table.
The GRADE system classifies the quality of evidence in one of four grades:
High: Further research is very unlikely to change our confidence in the estimate of effect;
Moderate: Further research is likely to have an impact on our confidence in the estimate of effect and may change the estimate;
Low: Further research is very likely to have an important impact on our confidence on the estimate of effect and is likely to change the estimate;
Very low: Any estimate of effect is very uncertain.
The quality of evidence can be downgraded by one level (serious concern) or two levels (very serious concern) for the following reasons: risk of bias, inconsistency (unexplained heterogeneity, inconsistency of results), indirectness (indirect population, intervention, control, outcomes), and imprecision (wide confidence intervals, single trial). The quality can also be upgraded by one level due to a large summary effect.
Results
Description of studies
Results of the search
The search strategy identified 583 hits (CENTRAL 133 hits, MEDLINE 155 hits, EMBASE 295 hits). Review of these citations and abstracts yielded seven trials that met the inclusion criteria. Searching ClinicalTrials.gov and WHO ICTRP did not reveal any trials for consideration in this review update. The PRISMA flow chart is presented in Figure 3. All trials included data that were subsequently published as a paper in a peer‐reviewed journal. These trials included a total of 2727 participants.
3.

Study flow diagram.
Included studies
Setting
Two trials were from the UK and carried out by one of four, in Brooker 2002, or one of two, in Hurlstone 2004, experienced endoscopists. Two trials were from multiple centres in France with endoscopies carried out by one of six experienced endoscopists, in Lapalus 2006, or one of 12 experienced or limited‐experience endoscopists, in Le Rhun 2006. One trial was from two centres in Germany with colonoscopies carried out by five experienced endoscopists (Pohl 2011). One trial was from four centres in the USA with endoscopies carried out by one of five experienced gastroenterologists using a standardised technique (Kahi 2010). One trial was from multiple centres in the USA, Canada, Lebanon, and Israel with endoscopies carried out by one of eight endoscopists trained in chromo‐endoscopy technique (Stoffel 2008).
Participants
All the included trials examined the effect of chromoscopy on polyp detection. Participants varied from consecutive patients undergoing routine colonoscopy, in Brooker 2002, Hurlstone 2004, and Pohl 2011, people described as at average risk undergoing a first screening colonoscopy, in Kahi 2010, people with a personal history of carcinoma or adenomas or both, in Stoffel 2008, and/or a family history of colorectal cancer, in Lapalus 2006, and/or alarm symptoms after the age of 60, in Le Rhun 2006.
The participants varied between different studies. Some studies included both average‐risk and high‐risk patients (prior history of polyps and/or colorectal cancer and/or high‐risk symptoms) (Brooker 2002; Hurlstone 2004; Pohl 2011). Others only included people with a higher‐than‐average risk of cancer (Lapalus 2006; Le Rhun 2006; Stoffel 2008). One study included only people at average risk of colorectal cancer (Kahi 2010).
Study design
Three studies had a study design that differed from the other four: each participant underwent the equivalent of two consecutive colonoscopies at the same session. In two studies (Lapalus 2006; Stoffel 2008), conventional colonoscopy was carried out initially in both study groups, with the second pass being either repeat conventional colonoscopy or chromoscopy. The outcomes of these studies were likely to be different than those in the other trials; these trials were essentially measuring the number of extra polyps detected with each intervention rather than the total number of polyps. As such, where data were available, these trials formed part of a subgroup analysis (studies with double intubation). In Le Rhun 2006, the control group underwent conventional colonoscopy with the first pass of each colon segment with maximal insufflation and the second with minimal insufflation. The intervention group underwent high‐resolution examination followed by chromoscopic examination of each colon segment. This could reflect standard practice where the trial was performed. We felt that this trial was more comparable to the other trials and was therefore included in the main group analyses (studies with single intubation).
Interventions
Two studies did not specifically detail dye‐spraying techniques (Lapalus 2006; Le Rhun 2006). In the other studies the technique was via a dye‐spray catheter, with three studies controlling for the effect of spraying on the visualisation of the mucosa and the extubation time (Hurlstone 2004; Kahi 2010; Pohl 2011). Investigation was with conventional colonoscopy in all studies except for Lapalus 2006 and Le Rhun 2006, where chromoscopy was combined with high‐resolution colonoscopy, and Kahi 2010, where chromoscopy was compared with high‐resolution colonoscopy.
Excluded studies
We excluded single‐gate diagnostic accuracy studies (those that conducted a conventional colonoscopy followed by chromoscopy in all participants, with no randomisation of participants), as these assess the impact of dye spray versus no dye spray rather than the benefit of adding dye to a colonoscopy in one step, as would be used in most clinical practice. We also excluded studies that examined only part of the colon/rectum (Painter 1999; Park 2008; Hashimoto 2010).
Risk of bias in included studies
We assessed the quality of the trials for adequate randomisation procedure and concealment, blinding, details of incomplete outcome data, and selective reporting, as well as other sources of bias related to study design. We described all of these parameters as low risk, high risk, or unclear risk. We have presented the results of the validity assessment in Figure 1 and Figure 2. We graded the overall risk of bias for all studies as unclear (see Appendix 5).
Allocation
Details of the process of randomisation were unavailable in one of the studies (Lapalus 2006), and only available in unpublished form in another (Hurlstone 2004). In those studies where details were available, this was done by "stratified randomisation" (Brooker 2002), computer‐generated random numbers from a central point with sealed envelopes (Hurlstone 2004; Le Rhun 2006; Kahi 2010), a "standard randomisation list" (Pohl 2011), or in one study by "randomisation envelope" (Stoffel 2008). In this multicentre study, (Stoffel 2008), randomisation was performed in block sizes of two, stratified by study site. Details about allocation concealment were available for six studies; allocation was concealed until immediately before the procedure, in Le Rhun 2006, or after caecal intubation (Brooker 2002; Hurlstone 2004; Stoffel 2008; Kahi 2010; Pohl 2011).
Blinding
Blinding of the examiner to the technique was impossible, and blinding of the participant was irrelevant with regard to the outcome data. The lack of examiner blinding is an inherent drawback to trials with these study designs. On a basic level, the increased time taken to dye spray could result in higher polyp detection. There were some efforts to make the two procedures more comparable in three studies; one study, Hurlstone 2004, sprayed the colon of the control group with saline, so increasing the withdrawal time; two others tried to control for the increased time needed for dye spraying by allowing for a slower, more detailed examination in the control group by specifying a minimum withdrawal time for all examinations (Kahi 2010; Pohl 2011). Le Rhun 2006 increased examination time in both groups by examining sections of the colorectum twice with maximal and minimal inflation in the control group and high‐definition colonoscopy and chromoscopy in the intervention arm. Despite these efforts to reduce performance bias, this inability to blind the investigator is a significant factor in interpreting the results of all the trials, and overall risk of bias should be considered as unclear (see Appendix 5 for justification).
A potential increase in detection bias may be seen with the trials that did a preliminary procedure to remove polyps before randomisation (see Included studies above).
The variation in polyp risk (see Description of studies section) is also a potential source of bias.
Incomplete outcome data
Although all studies except one, Stoffel 2008, gave details of withdrawals (due to poor bowel preparation, pathology (cancer or colitis), melanosis coli, equipment failure), only two studies provided information about dropouts after randomisation (Lapalus 2006; Pohl 2011). Apart from Lapalus 2006, which randomised before intubation of the caecum, the other trial designs randomised at intubation of the caecum, meaning that the potential for dropouts after randomisation was low. However, the possibility remains (inadequate documentation, missed histology, lost polyps, etc.). Details of dropouts after randomisation are only given in Pohl 2011.
Selective reporting
All papers reported the number of polyps detected, but some did not differentiate between neoplastic (clinically relevant) and non‐neoplastic polyps. No studies commented on adverse events. Allergic reactions have never been reported and are unlikely to have occurred, but participant discomfort and potential complications related to a prolonged procedure might occur.
Other potential sources of bias
A power calculation was carried out in all studies except one (Stoffel 2008). Three trials based the calculation on estimates carried out by Brooker 2002, who in turn based the expected neoplastic polyp detection rate on historical data. Two trials did their own calculation based upon assumptions from historical data (Kahi 2010; Pohl 2011). Le Rhun 2006 obtained their own data based on a preliminary analysis. The number of participants needed in each group to achieve the necessary power varied from 117 to 396. The variation in numbers deserves comment. Brooker 2002 calculated the smallest number based on an estimate of mean incidence of adenomas in the control group of 0.36 (standard deviation 0.3) and assumed a 30% increase in adenoma detection rate (α level 0.05, power 80%). At the other end of the estimate, Kahi 2010 assumed a prevalence of adenomas in the control group of 35% and a minimum clinically significant increase in adenoma detection of 10% (two‐sided α 0.05, 80% power). Only one trial failed to recruit the target numbers (Kahi 2010).
Effects of interventions
See: Table 1
When considering the entire colon, there was a significant difference in favour of chromoscopy for almost all detection outcomes.
The mean number of polyps (neoplastic and non‐neoplastic) detected was greater for all studies. It was also greater, to a high level of statistical significance, when the studies were combined (mean difference (MD) 0.89 lesions, 95% confidence interval (CI) 0.74 to 1.04; 7 studies; 2727 participants) (Analysis 1.1, Figure 4). We considered the evidence to be of low quality. The increased yield of polyps was seen in both the proximal and distal segments of the large bowel. When a subgroup analysis of different study designs is carried out, the increased yield is still significant for both study designs.
1.1. Analysis.

Comparison 1 Total number polyps (neoplastic and non‐neoplastic) detected, Outcome 1 Total polyps (neoplastic and non‐neoplastic) detected.
4.

Forest plot of comparison: 1 Total number polyps (neoplastic and non‐neoplastic) detected, outcome: 1.1 Total polyps (neoplastic and non‐neoplastic) detected.
From a clinical viewpoint, the most important lesions are the neoplastic lesions, as these could be precancerous. This enhanced yield was maintained even if only neoplastic lesions were considered (MD 0.33 lesions, 95% CI 0.25 to 0.41; 7 studies; 2727 participants) (Analysis 2.1, Figure 5). We considered the evidence to be of low quality. However, tests for heterogeneity were significant in this analysis (I² = 72%). There are several potential sources of this heterogeneity:
2.1. Analysis.
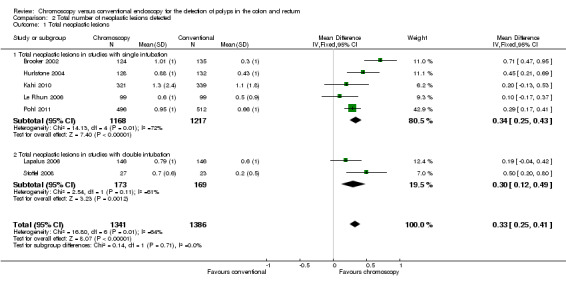
Comparison 2 Total number of neoplastic lesions detected, Outcome 1 Total neoplastic lesions.
5.

Forest plot of comparison: 2 Total number of neoplastic lesions detected, outcome: 2.1 Total neoplastic lesions.
Firstly, the study design. Two studies randomised at the point of a second investigation (Lapalus 2006; Stoffel 2008). Essentially these trials were looking at a different outcome, as described earlier. A subgroup analysis considering these trials alone reduces the heterogeneity whilst still showing a similar increased polyp detection with chromoscopy. However, the heterogeneity remains in the 'single intubation' trials
Secondly, the experience of the endoscopist. The Le Rhun 2006 group found substantially fewer polyps than the other studies in their chromoscopy group than the other studies. The authors of this study admit that some of the endoscopists had "limited experience".
Thirdly, the type of colonoscope varied. In one study (Kahi 2010), high‐definition colonoscopes were used, and the adenoma detection rate in the control group was higher than in any other study and higher than the chromoscopy cohort in all of the included trials. Others have shown that high‐definition imaging improves adenoma detection rate (Rex 2007).
However, removing these trials from the analysis reduces the power of I² such that it cannot be relied upon.
If the Brooker 2002 trial is removed, the heterogeneity in the 'single intubation' group reduces dramatically. The Brooker 2002 trial was the only trial not to control for extubation time in the control arm. Some of their withdrawal times in this arm were very fast indeed, which may explain why the polyp yield in this arm was so different than that seen in their intervention arm.
Data on standard deviation were only available for two of the studies (despite all authors being contacted). For the remainder, the we estimated the standard deviation according to the assumption detailed in the Methods section. This conservative method may have contributed to heterogeneity.
As it is possible for some people to have multiple polyps (neoplastic and non‐neoplastic) and to thereby influence the polyp yield with each intervention, it is perhaps relevant to consider the number of participants with at least one polyp. Again, the analysis revealed a significant difference in favour of the chromoscopy group (odds ratio (OR) 1.87, 95% CI 1.51 to 2.30; 4 studies; 1515 participants) (Analysis 3.1, Figure 6), which was maintained when restricted to different study designs. We considered the evidence to be of low quality. If neoplastic lesions only are considered, the significant difference in favour of chromoscopy is again maintained (OR 1.53, 95% CI 1.31 to 1.79; 7 studies; 2727 participants) (Analysis 4.1, Figure 7), although not if the studies using a tandem intubation design are considered separately. Only two studies gave data on the position of the polyps (Brooker 2002; Lapalus 2006), but with different study design the data may not be reliable (Analysis 3.2, Analysis 3.3, Analysis 4.2, Analysis 4.3).
3.1. Analysis.

Comparison 3 Total number of participants with at least one polyp (neoplastic or non‐neoplastic) detected, Outcome 1 Number of participants with at least one polyp (neoplastic or non‐neoplastic) detected.
6.

Forest plot of comparison: 3 Total number of participants with at least one polyp (neoplastic or non‐neoplastic) detected, outcome: 3.1 Number of participants with at least one polyp (neoplastic or non‐neoplastic) detected.
4.1. Analysis.

Comparison 4 Total number of participants with at least one neoplastic lesion detected, Outcome 1 Total participants with at least one neoplastic lesion.
7.
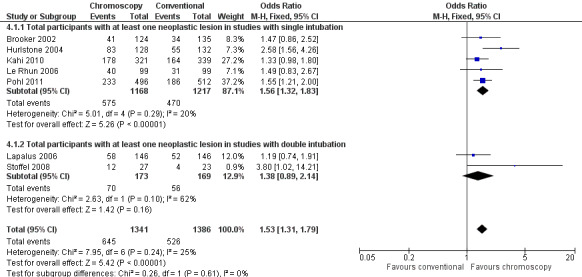
Forest plot of comparison: 4 Total number of participants with at least one neoplastic lesion detected, outcome: 4.1 Total participants with at least one neoplastic lesion.
3.2. Analysis.

Comparison 3 Total number of participants with at least one polyp (neoplastic or non‐neoplastic) detected, Outcome 2 Participants with at least one polyp (neoplastic or non‐neoplastic) in the proximal colon in single intubation trials.
3.3. Analysis.

Comparison 3 Total number of participants with at least one polyp (neoplastic or non‐neoplastic) detected, Outcome 3 Participants with at least one polyp (neoplastic or non‐neoplastic) in the distal colon in single intubation trials.
4.2. Analysis.

Comparison 4 Total number of participants with at least one neoplastic lesion detected, Outcome 2 Participants with at least one neoplastic lesion in proximal colon.
4.3. Analysis.

Comparison 4 Total number of participants with at least one neoplastic lesion detected, Outcome 3 Participants with at least one neoplastic lesion in the distal colon.
With regard to secondary outcomes, the total number of diminutive neoplastic lesions and the number of participants with at least one diminutive neoplastic lesion were all increased in favour of chromoscopy (mean difference 0.21, 95% CI 0.10 to 0.32; 4 studies; 1409 participants) (Analysis 5.1) and (OR 1.51, 95% CI 1.19 to 1.92; 4 studies; 1757 participants) (Analysis 6.1), respectively. We considered the evidence to be of low quality. Again, only Brooker 2002 and Lapalus 2006 gave data on the position of the polyps (of different study designs), and therefore the data may not be reliable (Analysis 5.2, Analysis 5.3, Analysis 6.2, Analysis 6.3).
5.1. Analysis.

Comparison 5 Number of diminutive neoplastic lesions detected with each intervention, Outcome 1 Number of diminutive neoplastic lesions.
6.1. Analysis.

Comparison 6 Number of participants with at least one diminutive neoplastic lesion detected with each intervention, Outcome 1 Participants with diminutive neoplastic lesions.
5.2. Analysis.

Comparison 5 Number of diminutive neoplastic lesions detected with each intervention, Outcome 2 Number of diminutive neoplastic lesions in the proximal colon.
5.3. Analysis.

Comparison 5 Number of diminutive neoplastic lesions detected with each intervention, Outcome 3 Number of diminutive neoplastic lesions in the distal colon.
6.2. Analysis.

Comparison 6 Number of participants with at least one diminutive neoplastic lesion detected with each intervention, Outcome 2 Participants with diminutive neoplastic lesions in the proximal colon.
6.3. Analysis.

Comparison 6 Number of participants with at least one diminutive neoplastic lesion detected with each intervention, Outcome 3 Participants with diminutive neoplastic lesions in the distal colon.
For the group as a whole, the number of participants with three or more neoplastic lesions was not statistically significantly different (OR 1.34, 95% CI 0.96 to 1.87; 5 studies; 1669 participants) (Analysis 7.1). However, we again considered the evidence to be of low quality, and there was heterogeneity that is not explained by different study design. An alternative explanation for the heterogeneity may relate to the Kahi 2010 and Le Rhun 2006 studies, which both used high‐definition colonoscopy in the control arm. A very high detection rate in the control group was seen, particularly in the Kahi 2010 study. Indeed, more participants with more than three polyps were seen in the control group in this trial, suggesting that high‐definition colonoscopes may be as good as chromoscopy. If only those studies using conventional chromoscopy and having a similar single‐intubation study design are considered, participants with multiple polyps are more than four times as likely to be detected.
7.1. Analysis.

Comparison 7 Number of participants with three or more neoplastic lesions detected with each intervention, Outcome 1 Number of participants with 3 or more adenomas.
Only one study gave details of the number of biopsies of normal tissue taken with each intervention. Unfortunately these data were not in an analysable form. However, the authors state that the proportion of biopsies that were normal tissue were similar in all comparison groups (Stoffel 2008).
With regard to withdrawal time, there was marked heterogeneity of study design and incomplete data, meaning that it was difficult to combine results. For instance, the study by Lapalus 2006 only gave data for the whole test (insertion and completion), whereas the other studies included only the extubation time. The study by Le Rhun 2006 examined each colonic segment with maximal and then minimal insufflation. Another study tried to standardise the extubation time by spraying saline in the control arm, making extubation time in the controls comparable to those of the chromoscopy group (Hurlstone 2004). Two studies stipulated minimum times for extubation (Kahi 2010; Pohl 2011). Another study stipulated that the endoscopist spent at least 20 minutes visualising the colonic mucosa (Stoffel 2008). Nevertheless, in all the studies (including the trials that tried to control for extubation time) the chromoscopy procedure took longer. The difference in the mean time for extubation varied from 0.3 minutes to 9.6 minutes.
None of the included studies reported any adverse events related to the use of the contrast dye.
Discussion
Summary of main results
There appears to be consistent evidence that chromoscopy enhances the detection of premalignant polyps in the colon and rectum. The number of participants with at least one neoplastic lesion increased by approximately 50%. In addition, the number of participants with three or more lesions increased more than four fold in the studies that used a single conventional colonoscopy or chromoscopy. However, there was no apparent increase in the detection of larger lesions or advanced pathology. Given the methodological limitations of the studies, we classified all evidence as low quality.
It could be argued that chromoscopy results in more biopsies that subsequently turn out to be normal tissue. Data for the number of normal biopsies that were taken with each comparison are minimal. Nevertheless, as still more neoplastic lesions were detected, the overall accuracy of colonoscopy is improved with chromoscopy. This would agree with the study where some data exist for the number of normal biopsies (Stoffel 2008); these authors suggest that although more normal biopsies were taken in the chromoscopy group, more adenomas were also found, and the proportion of normal biopsies to adenomas remained the same.
It appears that chromoscopy takes longer. How much longer is impossible to calculate with the data available, but mean extra time may be as high as nine minutes. Although not assessed in any study (but mentioned as a confounding factor in one, Le Rhun 2006), the chromoscopy technique also requires some training. Both factors would have a significant bearing on the logistics, procedural time and costs of colonoscopy.
Unfortunately, the potential for increased patient discomfort, complications with increased operating time, and adverse events were not examined in any of the available trials. Likewise, we were unable to examine the outcome 'site of the lesions found' (proximal colon (caecum to splenic flexure) and distal colon/rectum (distal to splenic flexure)).
Considering withdrawal times, there is evidence to suggest that the detection of polyps is enhanced the more time is taken to examine the mucosa carefully during extubation (Barclay 2006). It is possible that the increased time taken on extubation with the dye‐spray technique resulted in the enhanced polyp detection, although this was controlled for robustly in one study, Hurlstone 2004, and arguably in others where there was a set minimum extubation time (Stoffel 2008; Kahi 2010; Pohl 2011).
It should be recognised that other developments in colonoscopy to enhance polyp detection may negate the enhanced sensitivity with chromoscopy and may certainly reduce the time taken to complete the procedure. For example, the use of a standard patient position protocol during extubation has been shown to improve mucosal visualisation and polyp detection (East 2007; East 2011). Chiu 2006 has also demonstrated in a prospective endoscopist‐blinded randomised trial that colonic preparation on the day of colonoscopy had a beneficial effect regarding neoplasia detection. Furthermore, Sanaka 2006 has shown that afternoon scheduling of colonoscopy is an independent predictor of an incomplete procedure and hence predictive of 'miss rates'. With regard to extubation technique, Harrison 2004 suggested sustained "retroflexion" extubation of the right colon for identification of significant lesions behind folds and in positions where conventional forward‐viewing localisation was not possible. Deenadayalu 2004 suggested the use of a 170‐degree wide‐angle colonoscope for enhanced visualisation but failed to show a convincing benefit when comparing it to conventional‐viewing colonoscopy. Water‐infusion techniques (combining or replacing air insufflation with water infusion) were initially designed to facilitate caecal intubation and to improve patient comfort. Some studies have examined the adenoma detection rate using the combination of water perfusion with chromo‐endoscopy (Leung 2012; Hafner 2015), with a suggestion of improved adenoma detection. Cap‐assisted colonoscopy is another technique that appears to improve caecal intubation time, but may have limited or no benefit on polyp detection (Ng 2012).
The effect of high‐definition technology on adenoma detection is somewhat controversial. While some believe it does not improve polyp detection (East 2008), others have suggested benefit, and pooled data from a meta‐analysis of five studies suggest a marginal increase in polyp detection (Subramanian 2011). Two trials within this Cochrane review incorporated high‐definition colonoscopes (Le Rhun 2006; Kahi 2010), and the adenoma detection rate in the control group was high in both studies. Indeed, in Kahi 2010 the detection rate in the control group was higher than the chromoscopy arm of many of the other studies. High‐definition scopes also appear to have the additional advantage of a shorter learning curve and ease of use.
Other technological interventions include combining the wide‐angled lens with high‐definition monitoring (Rex 2007). The use of the Third Eye Retroscope allows detection of polyps hidden around folds (Triadafilopoulos 2008), and results from a multicentre trial suggest an improved adenoma detection rate (Siersema 2012). However, procedural times are increased due to the need for removal of the 'third eye' in order to carry out suctioning or to allow an accessory device such as biopsy forceps or snare. A future development is full‐spectrum endoscopy (FUSE), which allows for a high‐resolution, 330‐degree view of the lumen whilst maintaining the standard features and capabilities of a conventional colonoscope (Gralnek 2013). This technique appears particularly promising and has recently been shown to reduce adenoma miss rate (Gralnek 2014).
One technological advance that has created significant scientific interest for almost 10 years is virtual chromo‐endoscopy (Kuznetsov 2006; Su 2006; Chiu 2007). This technique uses a narrow spectrum of wavelengths with a decreased penetration depth to enhance mucosal visualisation. Techniques include narrow band imaging (NBI), Fuji intelligent color enhancement (FICE), and autofluorescence imaging (AFI). System activation is instantaneous on depression of the endoscopic 'head' actuation switch. Trimodal imaging combines high‐definition endoscopy with autofluorescence and narrow band imaging to enhance detection and polyp differentiation (Van den Broek 2009).
Several studies have compared virtual chromo‐endoscopy with both conventional chromo‐endoscopy and other technologies (Pohl 2007; Matsuda 2008; Adler 2009; Paggi 2009; Pohl 2009; Chung 2010; Ramsoekh 2010; Boparai 2011; Gross 2011; Kuiper 2011; Adler 2012; Moriichi 2012), and are the focus of various reviews, including one Cochrane review (Nagorni 2012). These reviews have concluded that the effect of pan‐colonic virtual chromo‐endoscopy on polyp detection rates appears to be limited.
Despite the ongoing equipment advances and increase in available data, there is still a need to carefully address the clinical utility of these technologies for the detection and characterisation of colorectal neoplastic lesions. For the time being, the current analysis would suggest that chromoscopy remains one of the most sensitive methods of enhancing polyp detection.
Overall completeness and applicability of evidence
Despite the heterogeneity in the recruitment and methodology of the included studies, the overall question being addressed remained essentially the same. No included studies were aiming to answer any question other than the utility of chromoscopy in colonoscopy.
Quality of the evidence
There were differences in study design and difficulties with extracting data. For instance, most studies compared chromoscopy with conventional colonoscopy, but two studies used a more complex double‐intubation design. We had to estimate standard deviation in five studies. Our conservative assumptions may have led to potential bias. Participants were all adults, but some studies recruited only older participants (older than 45 or 50 years). Participants also differed in their risk of developing polyps, but studies did not present data to allow subgroup analyses to investigate this. Two studies increased the intervention variables by incorporating high‐definition colonoscopy in various trial arms.
Although participants being at variable risk of polyp formation as a potential source of bias was highlighted in the Results section, these differences did not appear to significantly influence the total number of polyps detected. The study that only included average‐risk patients detected the highest number of polyps per person (Kahi 2010). Endoscopist experience, the use of high‐definition colonoscopes (in Le Rhun 2006 and Kahi 2010), and the higher number of diminutive adenomas detected in these participants may account for this.
Potential biases in the review process
Even with a detailed literature search, there still remains the possibility of publication bias in this review. We searched the 'grey' literature for more data (conference abstracts, etc.), hence minimising this risk. As discussed above, not all relevant data were available.
Agreements and disagreements with other studies or reviews
The results of our study are concordant with a non‐randomised comparative study that attempted to confirm the advantage of chromoscopy in polyp detection (Togashi 2009).
Authors' conclusions
Implications for practice.
Essentially, our conclusions have changed little since the publication of the original review. The quality of any colonoscopic examination remains dependent on complete intubation of the colon, but perhaps more importantly on a careful and complete visualisation of the mucosa during withdrawal. Training of endoscopists should still focus on this key aspect of technique, and the importance of allowing sufficient time to carry out a thorough examination is increasingly being recognised.
There have been significant technological innovations aimed at enhancing mucosal visualisation and polyp detection, but so far all have proved less convincing than chromoscopy. Pan‐colonic chromoscopy is the one technique that to date has undergone rigorous assessment and that based on the results should theoretically be recommended for routine practice. However, the lack of data with respect to advanced adenoma detection and interval cancer rates and the time constraints involved in incorporating routine pan‐chromoscopy suggest that at present selective use may be the only feasible practical application.
Chromoscopy may therefore be one way of enhancing polyp detection, the treatment of which may theoretically reduce the interval cancer rate on any screening programme.
Implications for research.
The ever‐evolving technological advancements seen in colonoscopy equipment and practice require careful assessment in the form of well‐designed trials. The results from narrow‐band imaging and water infusion have been analysed in separate Cochrane reviews, but other advances also need to be investigated to learn if any are more effective than chromoscopy. Attention should also be given to the implications of routine use of chromoscopy. One might ask: Does the extra yield of polyps make any difference? Diminutive polyps may be of limited significance, and there are risks, albeit minimal, associated with their removal. Furthermore, it should be noted that previous surveillance intervals were determined on the basis of standard colonoscopy examinations. Enhanced detection will clearly increase surveillance frequency for some, but are such individuals at greater risk for developing adenomas? Studies focused on the detection of advanced adenomas and interval cancer rates would help answer some of these questions.
Withdrawal times are important not only for practical purposes (a procedure that improves sensitivity but takes a long time is impractical), but also because longer withdrawal results in increased sensitivity in detecting polyps (Barclay 2006). Dye spraying takes longer to perform, and it may be this that enhances the sensitivity, allowing for a longer time to visualise the colon. It is reassuring to see this aspect of study design being incorporated in the more recent trials. Future studies should also attempt to control for this factor.
It is difficult to completely reduce bias in trials of chromoscopy, as it is impossible to blind the assessors. However, in order to improve the quality of future research, it is essential that all trials should control for withdrawal time and assess for intention to treat.
What's new
| Date | Event | Description |
|---|---|---|
| 21 November 2015 | New citation required but conclusions have not changed | Further editors' comments acknowledged and major text modifications |
History
Protocol first published: Issue 2, 2007 Review first published: Issue 4, 2007
| Date | Event | Description |
|---|---|---|
| 31 March 2015 | Amended | Editors' comments acknowledged and text/figures modified accordingly |
| 14 July 2014 | New search has been performed | New citations added. Discussion expanded. Conclusions the same. New author contributions |
| 30 July 2010 | New citation required but conclusions have not changed | Data and text amendments |
| 9 April 2010 | Amended | Recent literature search with text and result update |
| 23 July 2008 | Amended | Converted to new review format |
| 12 August 2007 | New citation required and conclusions have changed | Substantive amendment |
Acknowledgements
Thanks to Dr D Paul Hurlstone, who helped conceive the review and participated in preparing the original review. Thanks to the Cochrane Colorectal Cancer Group (Henning Andersen for invaluable support and Marija Barbateskovic for performing the searches). And thanks to the Cochrane Copy Edit Support (Lisa Winer) for a thorough and careful copy editing of this manuscript.
Appendices
Appendix 1. Cochrane Central Register of Controlled Trials search strategy
Cochrane Central Register of Controlled Trials (CENTRAL) (the Cochrane Library), issue 10 2015.
#1 MeSH descriptor: [Colon] explode all trees #2 MeSH descriptor: [Rectum] explode all trees #3 MeSH descriptor: [Anal Canal] explode all trees #4 MeSH descriptor: [Colorectal Neoplasms] explode all trees #5 MeSH descriptor: [Colonic Polyps] explode all trees #6 ((colorect* or colon* or large bowel or rect* or anal or anus or gastric*) and (polyp* or neoplas* or tumour* or tumor or adenom* or lesion* or carcinom* adenocarcinom* or cancer*)):ti,ab,kw #7 (#1 or #2 or #3 or #4 or #5 or #6) #8 MeSH descriptor: [Endoscopy, Gastrointestinal] explode all trees #9 (endoscop* or colonoscop* or proctoscop* or gastroscop*):ti,ab,kw #10 (#8 or #9) #11 MeSH descriptor: [Indigo Carmine] explode all trees #12 MeSH descriptor: [Coloring Agents] explode all trees #13 (chromoscop* or chromo‐endoscop* or chromoendoscop* or magnifying endoscop* or high resolution endoscop* or high resolution colonoscop* or dye spray* or dye‐spray* or indigo* or indigo‐carmine or acetic acid):ti,ab,kw #14 #11 or #12 or #13) #15 (#7 and #10 and #14)
Appendix 2. MEDLINE search strategy
MEDLINE (Ovid) 1950 to 26.10.2015 1. exp Colon/ 2. exp Rectum/ 3. exp Anal Canal/ 4. exp Colorectal Neoplasms/ 5. exp Colonic Polyps/ 6. ((colorect* or colon* or large bowel or rect* or anal or anus or gastric*) and (polyp* or neoplas* or tumour* or tumor or adenom* or lesion* or carcinom* adenocarcinom* or cancer*)).mp. 7. 1 or 2 or 3 or 4 or 5 or 6 8. exp Endoscopy, Gastrointestinal/ 9. (endoscop* or colonoscop* or proctoscop* or gastroscop*).mp. 10. 8 or 9 11. exp Indigo Carmine/ 12. exp Coloring Agents/ 13. (chromoscop* or chromo‐endoscop* or chromoendoscop* or magnifying endoscop* or high resolution endoscop* or high resolution colonoscop* or dye spray* or dye‐spray* or indigo* or indigo‐carmine or acetic acid).mp. 14. 11 or 12 or 13 15. 7 and 10 and 14 16. randomized controlled trial.pt. 17. controlled clinical trial.pt. 18. randomized.ab. 19. placebo.ab. 20. clinical trial.sh. 21. randomly.ab. 22. trial.ti. 23. 16 or 17 or 18 or 19 or 20 or 21 or 22 24. humans.sh. 25. 23 and 24 26. 15 and 25
Appendix 3. EMBASE search strategy
EMBASE (Ovid) 1974 to 26.10.2015 1. exp colon/ 2. exp rectum/ 3. exp colon tumor/ 4. exp rectum tumor/ 5. exp intestine polyp/ 6. ((colorect* or colon* or large bowel or rect* or anal or anus) and (polyp* or neoplas* or tumour* or tumor or adenom* or lesion* or carcinom* adenocarcinom* or cancer*)).m_titl. 7. 1 or 2 or 3 or 4 or 5 or 6 8. exp gastrointestinal endoscopy/ 9. exp gastroscope/ 10. exp proctoscope/ 11. exp colonoscope/ 12. (endoscop* or colonoscop* or proctoscop* or gastroscop*).mp. 13. 8 or 9 or 10 or 11 or 12 14. exp coloring agent/ 15. exp chromo‐endoscopy/ 16. exp dye/ 17. exp high resolution endoscopy/ 18. exp magnifying endoscopy/ 19. (chromoscop* or chromo‐endoscop* or chromoendoscop* or magnifying endoscop* or high resolution endoscop* or high resolution colonoscop* or dye spray* or dye‐spray* or indigo* or indigo‐carmine or acetic acid).mp. 20. 14 or 15 or 16 or 17 or 18 or 19 21. 7 and 13 and 20 22. CROSSOVER PROCEDURE.sh. 23. DOUBLE‐BLIND PROCEDURE.sh. 24. SINGLE‐BLIND PROCEDURE.sh. 25. (crossover* or cross over*).ti,ab. 26. placebo*.ti,ab. 27. (doubl* adj blind*).ti,ab. 28. allocat*.ti,ab. 29. trial.ti. 30. RANDOMIZED CONTROLLED TRIAL.sh. 31. random*.ti,ab. 32. 22 or 23 or 24 or 25 or 26 or 27 or 28 or 29 or 30 or 31 33. (exp animal/ or exp invertebrate/ or animal.hw. or nonhuman/) not (exp human/ or human cell/ or (human or humans or man or men or woman).ti.) 34. 32 not 33 35. 21 and 34
Appendix 4. Criteria for judging risk of bias in the 'Risk of bias' assessment tool
|
RANDOM SEQUENCE GENERATION Selection bias (biased allocation to interventions) due to inadequate generation of a randomised sequence | |
| Criteria for a judgement of ‘Low risk’ of bias | The investigators describe a random component in the sequence generation process such as:
*Minimisation may be implemented without a random element, and this is considered to be equivalent to being random |
| Criteria for a judgement of ‘High risk’ of bias | The investigators describe a non‐random component in the sequence generation process. Usually, the description would involve some systematic, non‐random approach, for example:
|
| Criteria for a judgement of ‘Unclear risk’ of bias | Insufficient information about the sequence generation process to permit judgement of ‘Low risk’ or ‘High risk’ |
|
ALLOCATION CONCEALMENT Selection bias (biased allocation to interventions) due to inadequate concealment of allocations prior to assignment | |
| Criteria for a judgement of ‘Low risk’ of bias | Participants and investigators enrolling participants could not foresee assignment because one of the following, or an equivalent method, was used to conceal allocation:
|
| Criteria for a judgement of ‘High risk’ of bias | Participants or investigators enrolling participants could possibly foresee assignments and thus introduce selection bias, such as allocation based on:
|
| Criteria for a judgement of ‘Unclear risk’ of bias | Insufficient information to permit judgement of ‘Low risk’ or ‘High risk’. This is usually the case if the method of concealment is not described or not described in sufficient detail to allow a definite judgement – for example if the use of assignment envelopes is described, but it remains unclear whether envelopes were sequentially numbered, opaque, and sealed |
|
BLINDING OF PARTICIPANTS AND PERSONNEL Performance bias due to knowledge of the allocated interventions by participants and personnel during the study | |
| Criteria for a judgement of ‘Low risk’ of bias | Any one of the following:
|
| Criteria for a judgement of ‘High risk’ of bias | Any one of the following:
|
| Criteria for a judgement of ‘Unclear risk’ of bias | Any one of the following:
|
|
BLINDING OF OUTCOME ASSESSMENT Detection bias due to knowledge of the allocated interventions by outcome assessors | |
| Criteria for a judgement of ‘Low risk’ of bias | Any one of the following:
|
| Criteria for a judgement of ‘High risk’ of bias | Any one of the following:
|
| Criteria for a judgement of ‘Unclear risk’ of bias | Any one of the following:
|
|
INCOMPLETE OUTCOME DATA Attrition bias due to amount, nature, or handling of incomplete outcome data | |
| Criteria for a judgement of ‘Low risk’ of bias | Any one of the following:
|
| Criteria for a judgement of ‘High risk’ of bias | Any one of the following:
|
| Criteria for a judgement of ‘Unclear risk’ of bias | Any one of the following:
|
|
SELECTIVE REPORTING Reporting bias due to selective outcome reporting | |
| Criteria for a judgement of ‘Low risk’ of bias | Any of the following:
|
| Criteria for a judgement of ‘High risk’ of bias | Any one of the following:
|
| Criteria for a judgement of ‘Unclear risk’ of bias | Insufficient information to permit judgement of ‘Low risk’ or ‘High risk’. It is likely that the majority of studies will fall into this category. |
|
OTHER BIAS Bias due to problems not covered elsewhere in the table | |
| Criteria for a judgement of ‘Low risk’ of bias | The study appears to be free of other sources of bias. |
| Criteria for a judgement of ‘High risk’ of bias | There is at least one important risk of bias. For example, the study:
|
| Criteria for a judgement of ‘Unclear risk’ of bias | There may be a risk of bias, but there is either:
|
Appendix 5. Overall risk of bias
The design of chromoscopy studies has one inherent and unavoidable risk of bias, which is that the participant and investigator cannot be blinded because it is not possible to be unaware that you are using chromoscopy. In some trials one aspect of blinding, that of an increased time taken to carry out the procedure, is controlled for, so that although the risk of bias due to blinding is universal, it has been reduced. Blinding aside, three generic markers of internal validity (random sequence generation, allocation concealment, and selective reporting) are generally good in almost all trials. One generic marker essentially related to intention to treat is unclear from the trial reports of six studies and remains unclear after attempts to contact the authors. Although the lack of blinding is known to influence the overall results, we would suggest that given the general low risk or unclear risk of bias in the other domains, the overall risk of bias is neither high nor low, which justifies our overall grading as unclear.
Data and analyses
Comparison 1. Total number polyps (neoplastic and non‐neoplastic) detected.
| Outcome or subgroup title | No. of studies | No. of participants | Statistical method | Effect size |
|---|---|---|---|---|
| 1 Total polyps (neoplastic and non‐neoplastic) detected | 7 | 2727 | Mean Difference (IV, Fixed, 95% CI) | 0.89 [0.74, 1.04] |
| 1.1 Total polyps in studies with single intubation | 5 | 2385 | Mean Difference (IV, Fixed, 95% CI) | 0.95 [0.77, 1.12] |
| 1.2 Total polyps in studies with double intubation | 2 | 342 | Mean Difference (IV, Fixed, 95% CI) | 0.73 [0.43, 1.03] |
| 2 Total polyps (neoplastic and non‐neoplastic) in proximal colon | 5 | 1521 | Mean Difference (IV, Fixed, 95% CI) | 0.34 [0.24, 0.44] |
| 2.1 Total polyps in proximal colon in studies with single intubation | 3 | 1179 | Mean Difference (IV, Fixed, 95% CI) | 0.31 [0.20, 0.43] |
| 2.2 Total polyps in proximal colon in studies with double intubation | 2 | 342 | Mean Difference (IV, Fixed, 95% CI) | 0.40 [0.22, 0.59] |
| 3 Total polyps (neoplastic and non‐neoplastic) in distal colon | 5 | 1521 | Mean Difference (IV, Fixed, 95% CI) | 0.51 [0.41, 0.60] |
| 3.1 Total polyps in distal colon in studies with single intubation | 3 | 1179 | Mean Difference (IV, Fixed, 95% CI) | 0.62 [0.50, 0.73] |
| 3.2 Total polyps in distal colon in studies with double intubation | 2 | 342 | Mean Difference (IV, Fixed, 95% CI) | 0.29 [0.13, 0.45] |
1.2. Analysis.

Comparison 1 Total number polyps (neoplastic and non‐neoplastic) detected, Outcome 2 Total polyps (neoplastic and non‐neoplastic) in proximal colon.
1.3. Analysis.

Comparison 1 Total number polyps (neoplastic and non‐neoplastic) detected, Outcome 3 Total polyps (neoplastic and non‐neoplastic) in distal colon.
Comparison 2. Total number of neoplastic lesions detected.
| Outcome or subgroup title | No. of studies | No. of participants | Statistical method | Effect size |
|---|---|---|---|---|
| 1 Total neoplastic lesions | 7 | 2727 | Mean Difference (IV, Fixed, 95% CI) | 0.33 [0.25, 0.41] |
| 1.1 Total neoplastic lesions in studies with single intubation | 5 | 2385 | Mean Difference (IV, Fixed, 95% CI) | 0.34 [0.25, 0.43] |
| 1.2 Total neoplastic lesions in studies with double intubation | 2 | 342 | Mean Difference (IV, Fixed, 95% CI) | 0.30 [0.12, 0.49] |
| 2 Total neoplastic lesions in proximal colon | 6 | 2529 | Mean Difference (IV, Fixed, 95% CI) | 0.27 [0.19, 0.35] |
| 2.1 Total neoplastic lesions in proximal colon in studies with single intubation | 4 | 2187 | Mean Difference (IV, Fixed, 95% CI) | 0.24 [0.15, 0.33] |
| 2.2 Total neoplastic lesions in proximal colon in studies with double intubation | 2 | 342 | Mean Difference (IV, Fixed, 95% CI) | 0.35 [0.20, 0.50] |
| 3 Total neoplastic lesions in distal colon | 5 | 1869 | Mean Difference (IV, Fixed, 95% CI) | 0.08 [‐0.00, 0.17] |
| 3.1 Total neoplastic lesions in distal colon in studies with single intubation | 3 | 1527 | Mean Difference (IV, Fixed, 95% CI) | 0.11 [0.01, 0.21] |
| 3.2 Total neoplastic lesions in distal colon in studies with single intubation | 2 | 342 | Mean Difference (IV, Fixed, 95% CI) | 0.02 [‐0.14, 0.18] |
| 4 Total neoplastic lesions in studies with single intubation and controlled extubation | 4 | 2126 | Mean Difference (IV, Fixed, 95% CI) | 0.28 [0.18, 0.38] |
2.2. Analysis.

Comparison 2 Total number of neoplastic lesions detected, Outcome 2 Total neoplastic lesions in proximal colon.
2.3. Analysis.

Comparison 2 Total number of neoplastic lesions detected, Outcome 3 Total neoplastic lesions in distal colon.
2.4. Analysis.

Comparison 2 Total number of neoplastic lesions detected, Outcome 4 Total neoplastic lesions in studies with single intubation and controlled extubation.
Comparison 3. Total number of participants with at least one polyp (neoplastic or non‐neoplastic) detected.
| Outcome or subgroup title | No. of studies | No. of participants | Statistical method | Effect size |
|---|---|---|---|---|
| 1 Number of participants with at least one polyp (neoplastic or non‐neoplastic) detected | 4 | 1515 | Odds Ratio (M‐H, Fixed, 95% CI) | 1.87 [1.51, 2.30] |
| 1.1 Number of participants with at least one polyp (neoplastic and non‐neoplastic detected in studies with single intubation | 3 | 1465 | Odds Ratio (M‐H, Fixed, 95% CI) | 1.83 [1.48, 2.27] |
| 1.2 Number of participants with at least one polyp (neoplastic and non‐neoplastic) detected in studies with double intubation | 1 | 50 | Odds Ratio (M‐H, Fixed, 95% CI) | 3.19 [1.00, 10.17] |
| 2 Participants with at least one polyp (neoplastic or non‐neoplastic) in the proximal colon in single intubation trials | 1 | 259 | Odds Ratio (M‐H, Fixed, 95% CI) | 1.87 [1.10, 3.16] |
| 3 Participants with at least one polyp (neoplastic or non‐neoplastic) in the distal colon in single intubation trials | 1 | 259 | Odds Ratio (M‐H, Fixed, 95% CI) | 1.92 [1.14, 3.24] |
Comparison 4. Total number of participants with at least one neoplastic lesion detected.
| Outcome or subgroup title | No. of studies | No. of participants | Statistical method | Effect size |
|---|---|---|---|---|
| 1 Total participants with at least one neoplastic lesion | 7 | 2727 | Odds Ratio (M‐H, Fixed, 95% CI) | 1.53 [1.31, 1.79] |
| 1.1 Total participants with at least one neoplastic lesion in studies with single intubation | 5 | 2385 | Odds Ratio (M‐H, Fixed, 95% CI) | 1.56 [1.32, 1.83] |
| 1.2 Total participants with at least one neoplastic lesion in studies with double intubation | 2 | 342 | Odds Ratio (M‐H, Fixed, 95% CI) | 1.38 [0.89, 2.14] |
| 2 Participants with at least one neoplastic lesion in proximal colon | 2 | 551 | Odds Ratio (M‐H, Fixed, 95% CI) | 1.55 [1.04, 2.30] |
| 2.1 Participants with at least one neoplastic lesion in the proximal colon in studies with single intubation | 1 | 259 | Odds Ratio (M‐H, Fixed, 95% CI) | 1.53 [0.85, 2.77] |
| 2.2 Participants with at least one neoplastic lesion in the proximal colon in studies with double intubation | 1 | 292 | Odds Ratio (M‐H, Fixed, 95% CI) | 1.56 [0.91, 2.67] |
| 3 Participants with at least one neoplastic lesion in the distal colon | 2 | 551 | Odds Ratio (M‐H, Fixed, 95% CI) | 1.24 [0.79, 1.94] |
| 3.1 Participants with at least one neoplastic lesion in the distal colon in studies with single intubation | 1 | 259 | Odds Ratio (M‐H, Fixed, 95% CI) | 1.37 [0.65, 2.92] |
| 3.2 Participants with at least one neoplastic lesion in the distal colon in studies with double intubation | 1 | 292 | Odds Ratio (M‐H, Fixed, 95% CI) | 1.17 [0.67, 2.05] |
Comparison 5. Number of diminutive neoplastic lesions detected with each intervention.
| Outcome or subgroup title | No. of studies | No. of participants | Statistical method | Effect size |
|---|---|---|---|---|
| 1 Number of diminutive neoplastic lesions | 4 | 1409 | Mean Difference (IV, Fixed, 95% CI) | 0.21 [0.10, 0.32] |
| 1.1 Number of diminutive neoplastic lesions in studies with single intubation | 3 | 1117 | Mean Difference (IV, Fixed, 95% CI) | 0.19 [0.07, 0.31] |
| 1.2 Number of diminutive neoplastic lesions in studies with double intubation | 1 | 292 | Mean Difference (IV, Fixed, 95% CI) | 0.29 [0.06, 0.52] |
| 2 Number of diminutive neoplastic lesions in the proximal colon | 2 | 551 | Mean Difference (IV, Fixed, 95% CI) | 0.27 [0.10, 0.44] |
| 2.1 Number of diminutive neoplastic lesions in the proximal colon in studies with single intubation | 1 | 259 | Mean Difference (IV, Fixed, 95% CI) | 0.37 [0.13, 0.61] |
| 2.2 Number of diminutive neoplastic lesions in the proximal colon in studies with double intubation | 1 | 292 | Mean Difference (IV, Fixed, 95% CI) | 0.18 [‐0.05, 0.41] |
| 3 Number of diminutive neoplastic lesions in the distal colon | 2 | 551 | Mean Difference (IV, Fixed, 95% CI) | 0.10 [‐0.07, 0.26] |
| 3.1 Number of diminutive neoplastic lesions in the proximal colon in studies with single intubation | 1 | 259 | Mean Difference (IV, Fixed, 95% CI) | 0.08 [‐0.16, 0.32] |
| 3.2 Number of diminutive neoplastic lesions in the proximal colon in studies with double intubation | 1 | 292 | Mean Difference (IV, Fixed, 95% CI) | 0.11 [‐0.12, 0.34] |
Comparison 6. Number of participants with at least one diminutive neoplastic lesion detected with each intervention.
| Outcome or subgroup title | No. of studies | No. of participants | Statistical method | Effect size |
|---|---|---|---|---|
| 1 Participants with diminutive neoplastic lesions | 4 | 1757 | Odds Ratio (M‐H, Fixed, 95% CI) | 1.51 [1.19, 1.92] |
| 1.1 Participants with diminutive neoplastic lesions in studies with single intubation | 3 | 1465 | Odds Ratio (M‐H, Fixed, 95% CI) | 1.46 [1.12, 1.91] |
| 1.2 Participants with diminutive neoplastic lesions in studies with double intubation | 1 | 292 | Odds Ratio (M‐H, Fixed, 95% CI) | 1.73 [1.03, 2.90] |
| 2 Participants with diminutive neoplastic lesions in the proximal colon | 2 | 551 | Odds Ratio (M‐H, Fixed, 95% CI) | 2.01 [1.29, 3.15] |
| 2.1 Participants with diminutive neoplastic lesions in the proximal colon in studies with single intubation | 1 | 259 | Odds Ratio (M‐H, Fixed, 95% CI) | 1.95 [1.03, 3.68] |
| 2.2 Participants with diminutive neoplastic lesions in the proximal colon in studies with double intubation | 1 | 292 | Odds Ratio (M‐H, Fixed, 95% CI) | 2.08 [1.11, 3.89] |
| 3 Participants with diminutive neoplastic lesions in the distal colon | 2 | 551 | Odds Ratio (M‐H, Fixed, 95% CI) | 1.37 [0.81, 2.30] |
| 3.1 Participants with diminutive neoplastic lesions in the distal colon in studies with single intubation | 1 | 259 | Odds Ratio (M‐H, Fixed, 95% CI) | 1.34 [0.56, 3.22] |
| 3.2 Participants with diminutive neoplastic lesions in the distal colon in studies with double intubation | 1 | 292 | Odds Ratio (M‐H, Fixed, 95% CI) | 1.38 [0.72, 2.64] |
Comparison 7. Number of participants with three or more neoplastic lesions detected with each intervention.
| Outcome or subgroup title | No. of studies | No. of participants | Statistical method | Effect size |
|---|---|---|---|---|
| 1 Number of participants with 3 or more adenomas | 5 | 1669 | Odds Ratio (M‐H, Fixed, 95% CI) | 1.34 [0.96, 1.87] |
| 1.1 Number of participants with 3 or more adenomas in studies with single intubation | 2 | 519 | Odds Ratio (M‐H, Fixed, 95% CI) | 4.63 [1.99, 10.80] |
| 1.2 Number of participants with 3 or more adenomas in studies with double intubation | 1 | 292 | Odds Ratio (M‐H, Fixed, 95% CI) | 1.78 [0.68, 4.65] |
| 1.3 Studies that used high definition colonoscopy in the control group | 2 | 858 | Odds Ratio (M‐H, Fixed, 95% CI) | 0.86 [0.57, 1.31] |
Characteristics of studies
Characteristics of included studies [ordered by study ID]
Brooker 2002.
| Methods | Randomisation on caecal intubation to either normal colonoscopy or dye‐spray Dye‐spray application using catheter Selective chromoscopy in control arm Setting: Single‐centre UK 4 participating experienced endoscopists |
|
| Participants | People enrolled at consultation prior to the colonoscopy who had an indication for colonoscopy and who were at high risk for colorectal cancer (personal history of adenoma, ± first‐degree family history) Exclusion criteria: People with polyposis, IBD, colorectal cancer, or poor bowel preparation Control arm: n = 135; median age 53 (23 to 91); male 49% Dye‐spray arm: n = 124; median age 53 (18 to 91); male 55% |
|
| Interventions | Standard colonoscopy versus chromo‐endoscopy | |
| Outcomes | Pts with > 1 polyp (neoplastic and non‐neoplastic) Pts with > 1 neoplastic lesion Pts with > 1 neoplastic lesion < 5 mm Pts with > 3 neoplastic lesions No of polyps (neoplastic and non‐neoplastic) per participant No of neoplastic lesions/pt No of neoplastic lesions < 5 mm/pt Anatomical position of polyps Extubation time | |
| Notes | ||
| Risk of bias | ||
| Bias | Authors' judgement | Support for judgement |
| Random sequence generation (selection bias) | Low risk | Stratified randomisation (stratified for each endoscopist and indication) |
| Allocation concealment (selection bias) | Low risk | Concealed allocation (the randomisation was revealed to the endoscopist on intubation of the caecum) |
| Blinding (performance bias and detection bias) All outcomes | High risk | Not possible with this particular comparison (impossible to blind the use of dye spray) |
| Incomplete outcome data (attrition bias) All outcomes | Unclear risk | No details given about dropouts (missing data or missing histology) |
| Selective reporting (reporting bias) | Low risk | Clinically relevant and reasonably expected outcomes were reported |
| Other bias | High risk | Risk of increased time spent on intervention arm |
Hurlstone 2004.
| Methods | Randomisation on caecal intubation to either targeted chromo‐endoscopy or pan‐colonic chromoscopy with examination of colon in segments Dye‐spray application using catheter Controlled minimum extubation time Setting: Single‐centre in UK. 2 experienced colonoscopists |
|
| Participants | Consecutive patients referred to one hospital trust for colonoscopy Exclusion criteria: Patients with polyposis, IBD, colorectal cancer, or poor bowel preparation Control arm: n = 132; median age 53 (23 to 89); male 46% Dye‐spray arm: n = 128; median age 58 (22 to 92); male 45% |
|
| Interventions | Standard colonoscopy (with saline spray) versus chromo‐endoscopy | |
| Outcomes | Pts with > 1 polyp (neoplastic and non‐neoplastic) Pts with > 1 neoplastic lesion Ps with > 3 neoplastic lesions No of polyps (neoplastic and non‐neoplastic)/pt No of neoplastic lesions/pt Anatomical position of polyps (neoplastic and non‐neoplastic) Extubation time | |
| Notes | A minimum diagnostic time from the caecum to the anus was set at 8 minutes | |
| Risk of bias | ||
| Bias | Authors' judgement | Support for judgement |
| Random sequence generation (selection bias) | Low risk | Computer‐generated random allocation (unpublished data) |
| Allocation concealment (selection bias) | Low risk | Sealed envelopes drawn at time of caecal intubation |
| Blinding (performance bias and detection bias) All outcomes | High risk | Not possible with this particular comparison (impossible to blind the use of dye spray) |
| Incomplete outcome data (attrition bias) All outcomes | Unclear risk | No details given about dropouts (missing data or missing histology) |
| Selective reporting (reporting bias) | Low risk | Clinically relevant and reasonably expected outcomes were reported |
| Other bias | Low risk | Risk of increased time spent on intervention arm controlled for by minimum diagnostic time and water spray in control arm |
Kahi 2010.
| Methods | Randomisation on caecal intubation to segmental chromoscopy or white‐light high‐definition colonoscopy Dye‐spray application using catheter Controlled minimum extubation time Setting: 4 hospitals in the USA; 5 experienced gastroenterologists |
|
| Participants | Average‐risk patients aged > 50 years undergoing first‐time screening Exclusion criteria: any indication other than average risk screening (including evaluation of symptoms, occult bleeding, postpolypectomy surveillance, and post‐cancer resection surveillance) or previous colonoscopy. Those undergoing flexible sigmoidoscopy were not excluded provided they had not undergone polypectomy and did not require follow‐up colonoscopy. Additional exclusion criteria:
Control arm: n = 339; mean age 58 (±7); male 63% Dye‐spray arm: n = 321; mean age 59 (±7); male 60% |
|
| Interventions | Randomisation to either chromo‐colonoscopy or white‐light colonoscopy using a high‐definition colonoscope | |
| Outcomes | Pts with > 1 polyp (neoplastic and non‐neoplastic) Pts with > 1 neoplastic lesion Pts with > 1 neoplastic lesion > 10 mm Pts with > 3 neoplastic lesions No of polyps (neoplastic and non‐neoplastic)/pt No of neoplastic lesions/pt No of neoplastic lesions < 5 mm/pt Anatomical position of polyps Extubation time | |
| Notes | Examination time was standardised to be at least 6 minutes. The study was terminated before the target sample size was reached due to slow enrolment at 1 site | |
| Risk of bias | ||
| Bias | Authors' judgement | Support for judgement |
| Random sequence generation (selection bias) | Low risk | Sequence generated at a central site using randomised computer‐generated numbers |
| Allocation concealment (selection bias) | Low risk | Allocation concealed in sealed, opaque envelopes opened by the research assistant with the endoscopist being informed on reaching the caecum |
| Blinding (performance bias and detection bias) All outcomes | High risk | Not possible with this particular comparison (impossible to blind the use of dye spray) |
| Incomplete outcome data (attrition bias) All outcomes | Unclear risk | No details given about dropouts (missing data or missing histology) |
| Selective reporting (reporting bias) | Low risk | Clinically relevant and reasonably expected outcomes were reported |
| Other bias | Unclear risk | Risk of increased time spent on intervention arm controlled for by minimum diagnostic time. Inadequate target enrolment Withdrawals: 31 refused consent, 90 were excluded before randomisation (person was found ineligible after enrolment, endoscopy unit scheduling constraints, procedure required changing to a non‐study colonoscope (n = 27), poor colon prep (n = 63)) |
Lapalus 2006.
| Methods | 'Tandem' colonoscopy: Initial conventional colonoscopy in all participants, followed by randomisation to either chromo‐endoscopy with structure enhancement or conventional colonoscopy on second colonoscopy Blinding: none Personnel: 6 experienced endoscopists Setting: 5 centres in France |
|
| Participants | People enrolled at consultation prior to the colonoscopy who had an indication for colonoscopy and who were at high risk for colorectal cancer (personal history of adenoma, ± first‐degree family history) Exclusion criteria: known FAP, IBD previous surgical resection Control arm: n = 146; median age 59.5 (42 to 82); male 54.8% Chromo‐endoscopy arm: n = 146; median age 59.1 (42 to 83); male 45.9% |
|
| Interventions | Standard colonoscopy first pass plus chromo‐endoscopy second pass versus tandem standard colonoscopy | |
| Outcomes | Pts with > 1 polyp (neoplastic and non‐neoplastic) Pts with > 1 neoplastic lesion Pts with > 1 neoplastic lesion < 5 mm Pts with > 3 neoplastic lesions No of polyps (neoplastic and non‐neoplastic)/pt No of neoplastic lesions/pt No of neoplastic lesions < 5 mm/pt Anatomical position of polyps (neoplastic and non‐neoplastic) Extubation time | |
| Notes | ||
| Risk of bias | ||
| Bias | Authors' judgement | Support for judgement |
| Random sequence generation (selection bias) | Unclear risk | Not clarified in paper |
| Allocation concealment (selection bias) | Unclear risk | Not clarified in paper |
| Blinding (performance bias and detection bias) All outcomes | High risk | Not possible with this particular comparison (impossible to blind the use of dye spray) |
| Incomplete outcome data (attrition bias) All outcomes | Unclear risk | No details given about dropouts (missing data or missing histology) |
| Selective reporting (reporting bias) | Low risk | Clinically relevant and reasonably expected outcomes were reported |
| Other bias | High risk | Risk of increased time spent on intervention arm Dye‐spraying technique not described Extubation time not controlled |
Le Rhun 2006.
| Methods | Randomisation to either routine colonoscopic withdrawal with maximal insufflation on the first pass of each colon segment and minimal insufflation on the second, or withdrawal with high‐resolution colonoscope followed by chromoscopic examination of each colon segment Blinding: none Setting: 4 centres in France; 12 endoscopists of varying experience | |
| Participants | People referred to 4 centres over 18‐month period with:
Exclusion criteria: < 60 years of age; multiple symptoms, such as digestive bleeding, obstructive symptoms, known IBD, severe weight loss/ongoing organic disease; pregnancy/breastfeeding, recent inclusion in another RCT, refusal of consent Control arm: n = 100; median age 59 (30 to 78); 53% male Intervention arm: n = 103; median age 59 (31 to 80); 48% male |
|
| Interventions | High‐resolution pan‐chromoscopic colonoscopy (segmental examination before and after chromoscopy) versus standard colonoscopy | |
| Outcomes | No of polyps (neoplastic and non‐neoplastic)/pt No of neoplastic lesions/pt Pts with > 1 polyp (neoplastic and non‐neoplastic) Pts with > 1 neoplastic lesion No of neoplastic lesions < 5 mm/pt Pts with > 3 neoplastic lesions Extubation time | |
| Notes | Participants randomised to the control group had the choice of undergoing chromoscopy after (36% did). A further 5 neoplastic lesions in 5 participants were found | |
| Risk of bias | ||
| Bias | Authors' judgement | Support for judgement |
| Random sequence generation (selection bias) | Low risk | Central computer‐generated random allocation sequence in blocks |
| Allocation concealment (selection bias) | Low risk | Allocation just before intubation (no method was detailed) |
| Blinding (performance bias and detection bias) All outcomes | High risk | Not possible with this particular comparison (impossible to blind the use of dye spray) |
| Incomplete outcome data (attrition bias) All outcomes | Unclear risk | No details given about dropouts (missing data or missing histology) |
| Selective reporting (reporting bias) | Low risk | Clinically relevant and reasonably expected outcomes were reported |
| Other bias | High risk | Risk of increased time spent on intervention arm; high‐resolution colonoscopy as well as chromo‐endoscopy used in intervention arm |
Pohl 2011.
| Methods | Randomisation to either pan‐colonic dye‐spraying or conventional colonoscopy on extubation Low‐volume dye application on single pass Blinding: none Setting: 2 centres in Germany; 5 experienced colonoscopists |
|
| Participants | Consecutive patients over 45 years of age attending for primary screening or diagnostic colonoscopy for surveillance, bleeding/anaemia, pain, or diarrhoea Exclusion criteria: under 45 years old, known IBD, overt bleeding, polyposis syndromes, previous surgical resection, or previous anticoagulation treatment Control arm: n = 512; mean age 63.4 (±9.94); 51.4% male Intervention arm: n = 496; mean age 63.9 (±10.28); 55.8% male |
|
| Interventions | Conventional colonoscopy or withdrawal using indigo‐carmine with a low‐volume spraying technique | |
| Outcomes | No of neoplastic lesions/pt No of cancerous lesions, flat lesions, serrated lesions, high‐grade dysplastic lesions/pt Pts with > 1 neoplastic lesion and types of neoplastic lesion (serrated, adenoma, advanced neoplasia, lesions > 10 mm, and carcinomas) Anatomical position of polyps Extubation time |
|
| Notes | A minimum extubation time from the caecum to the anus was set at 8 minutes. Both serrated lesions and hyperplastic lesions were grouped together as serrated lesions |
|
| Risk of bias | ||
| Bias | Authors' judgement | Support for judgement |
| Random sequence generation (selection bias) | Low risk | Standard randomisation lists |
| Allocation concealment (selection bias) | Low risk | Lists were not accessible to the endoscopists |
| Blinding (performance bias and detection bias) All outcomes | High risk | Not possible with this particular comparison (impossible to blind the use of dye spray) |
| Incomplete outcome data (attrition bias) All outcomes | Low risk | Randomisation occurred on caecal intubation. There were 16 dropouts: chromoscopy group, n = 10 (incomplete documentation 3; missing lesion for histology 7); control group, n = 6 (incomplete documentation 1; missing lesion for histology 5). 158 participants excluded due to poor bowel preparation |
| Selective reporting (reporting bias) | Low risk | Clinically relevant and reasonably expected outcomes were reported |
| Other bias | Unclear risk | Risk of increased time spent on intervention arm controlled for by minimum diagnostic time |
Stoffel 2008.
| Methods | Initial conventional colonoscopy in all participants, with participants randomised to chromo‐endoscopy or intensive colonoscopy when caecum reached at second colonoscopy Segmental inspection of colon after dye application with spraying catheter Setting: multicentre, USA, Canada, Lebanon, and Israel; 8 endoscopists trained in chromoscopy | |
| Participants | Participants were recruited from among those scheduled to undergo surveillance colonoscopy who had a prior history of 3 or more polyps or colorectal cancer Exclusion criteria: under 18 years old with poor performance, receiving active treatment for cancer, or using anticoagulant medications Control arm: n = 23; mean age 59.3; 70% male Intervention arm: n = 27; mean age 57.6; 48% male |
|
| Interventions | Standard colonoscopy first pass plus chromo‐endoscopy second pass versus a second 'intensive' colonoscopy (lasting more than 20 minutes) | |
| Outcomes | No of polyps (neoplastic and non‐neoplastic)/pt No of neoplastic lesions/pt Pts with > 1 polyp (neoplastic and non‐neoplastic) Pts with > 1 neoplastic lesion Extubation time | |
| Notes | ||
| Risk of bias | ||
| Bias | Authors' judgement | Support for judgement |
| Random sequence generation (selection bias) | Low risk | Sealed envelopes drawn at the time of caecal intubation. Block sizes of 2 stratified by study site |
| Allocation concealment (selection bias) | Low risk | Sealed envelopes drawn at the time of caecal intubation |
| Blinding (performance bias and detection bias) All outcomes | High risk | Not possible with this particular comparison (impossible to blind the use of dye spray) |
| Incomplete outcome data (attrition bias) All outcomes | Unclear risk | No details given about dropouts (missing data or missing histology) |
| Selective reporting (reporting bias) | Low risk | Clinically relevant and reasonably expected outcomes were reported |
| Other bias | High risk | Risk of increased time spent on intervention arm |
FAP: familial adenomatous polyposis HNPCC: hereditary non‐polyposis colorectal cancer IBD: inflammatory bowel disease RCT: randomised controlled trial
Characteristics of excluded studies [ordered by study ID]
| Study | Reason for exclusion |
|---|---|
| Hashimoto 2010 | Randomisation design limited to colorectum distal to splenic flexure |
| Painter 1999 | Primary reason for exclusion relates to this being a flexible sigmoidoscopy trial only. No control of distance inserted and data on polyp detection likely to be different from the colonoscopy trials. Secondary indications for exclusion include abstract only, so data are limited. Author did not respond to contact attempts |
| Park 2008 | Despite suitable study design, looked at chromoscopy in the caecum and ascending colon only |
| Togashi 2009 | The study did not clearly randomise participants; instead, consecutive unselected people presenting for colonoscopy were enrolled in the study and allocated sequentially into 2 groups by administrative staff. Recruitment ceased when 200 participants had been recruited into both groups |
Differences between protocol and review
None known.
Contributions of authors
SRB and WB carried out the search and independently reviewed papers for relevance and quality. SRB wrote the text. WB checked the text and data. Dr Paul Hurlstone added comments in the first published version of this review, in particular to the Discussion.
For the update, WB and SRB carried out the search and independently reviewed papers for relevance and quality. SRB wrote the text. WB checked the text and data.
For the second update, WB, SRB, SR, and SD independently reviewed papers for relevance and quality. SRB, SR, and SD wrote the text. WB checked the text and data.
SRB is the lead author and guarantor for the review.
Sources of support
Internal sources
There were no sources of support, Other.
External sources
There were no sources of support, Other.
Declarations of interest
SRB, WB, SD, and SR have no interests to declare.
Edited (no change to conclusions)
References
References to studies included in this review
Brooker 2002 {published data only}
- Brooker JC, Saunders BP, Shah SG, Thapar CJ, Thomas HJ, et al. Total colonic dye‐spray increases the detection of diminutive adenomas during routine colonoscopy: a randomized controlled trial. Gastrointestinal Endoscopy 2002;56(3):333‐8. [PUBMED: 12196768] [DOI] [PubMed] [Google Scholar]
Hurlstone 2004 {published data only}
- Hurlstone DP, Cross SS, Slater R, Sanders DS, Brown SR. Detecting diminutive colorectal lesions at colonoscopy: a randomised controlled trial of pan‐colonic versus targeted chromoscopy. Gut 2004;53(3):376‐80. [PUBMED: 14960519] [DOI] [PMC free article] [PubMed] [Google Scholar]
Kahi 2010 {published data only}
- Kahi CJ, Anderson JC, Waxman I, Kessler WR, Imperiale TF, Xiaochun L, et al. High definition chromocolonoscopy vs. high definition white light colonoscopy for average risk colorectal cancer screening. American Journal of Gastroenterology 2010;105(6):1301‐7. [DOI] [PubMed] [Google Scholar]
Lapalus 2006 {published data only}
- Lapalus MG, Helbert T, Napoleon B, Rey JF, Houcke P, Ponchon T, Société Francaise d'Endoscopie Digestive. Does chromoendoscopy with structure enhancement improve the colonoscopic adenoma detection rate?. Endoscopy 2006;38(5):444‐8. [PUBMED: 16767577] [DOI] [PubMed] [Google Scholar]
Le Rhun 2006 {published data only}
- Rhun M, Coron E, Parlier D, Nguyen JM, Canard JM, Alamdari A, et al. High resolution colonoscopy with chromoscopy versus standard colonoscopy for the detection of colonic neoplasia: a randomized study. Clinical Gastroenterology and Hepatology 2006;4(3):349‐54. [PUBMED: 16527699] [DOI] [PubMed] [Google Scholar]
Pohl 2011 {published data only}
- Pohl J, Schneider A, Vogell H, Mayer G, Kaiser G, Ell C. Pancolonic chromoendoscopy with indigo carmine versus standard colonoscopy for detection of neoplastic lesions: a randomised two‐centre trial. Gut 2011;60(4):485‐90. [DOI] [PubMed] [Google Scholar]
Stoffel 2008 {published data only}
- Stoffel EM, Turgeon DK, Stockwell DH, Normolle DP, Tuck MK, Marcon NE, et al. Chromoendoscopy detects more adenomas than colonoscopy using intensive inspection without dye spraying. Cancer Prevention Research 2008;1(7):507‐13. [PUBMED: 19139000] [DOI] [PMC free article] [PubMed] [Google Scholar]
References to studies excluded from this review
Hashimoto 2010 {published data only}
- Hashimoto K, Higaki S, Nishiaki M, Fujiwara K, Gondo T, Sakaida I. Does chromoendoscopy improve the colonoscopic adenoma detection rate?. Hepato‐Gastroenterology 2010;57(104):1399‐404. [PubMed] [Google Scholar]
Painter 1999 {published data only}
- Painter JE, O'Dwyer ST, Watson AJ, Edwards R, Atkin WA. The routine use of chromoscopy is of no benefit in flexible sigmoidoscopy screening for colorectal cancer. Gut 1999;44:A99. [Google Scholar]
Park 2008 {published data only}
- Park SY, Lee KS, Kim BC, Han J, Kim JK, Cheon JH, et al. Efficacy of chromoendoscopy with indigocarmine for the detection of ascending colon and cecum lesions. Scandinavian Journal of Gastroenterology 2008;43(7):878‐85. [DOI] [PubMed] [Google Scholar]
Togashi 2009 {published data only}
- Togashi K, Hewett DG, Radford‐Smith GL, Francis L, Leggett BA, Appleyard MN. The use of indigocarmine spray increases the colonoscopic detection rate of adenomas. Journal of Gastroenterology 2009;44(8):826‐33. [DOI] [PubMed] [Google Scholar]
Additional references
Adler 2009
- Adler A, Aschenbeck J, Yenerim T, Mayr M, Aminalai A, Drossel R, et al. Narrow band versus white light high definition television endoscopic imaging for screening colonoscopy: a prospective randomised trial. Gastroenterology 2009;136(2):410‐6. [DOI] [PubMed] [Google Scholar]
Adler 2012
- Adler A, Aminalai A, Aschenbeck J, Drossel R, Mayr M, Scheel M, et al. Latest generation, wide‐angled, high definition colonoscopes increase adenoma detection rates. Clinical Gastroenterology and Hepatology 2012;10(2):155‐9. [DOI] [PubMed] [Google Scholar]
ASGE 2007
- ASGE Technology Committee, Wong Kee Song LM, Adler DG, Chand B, Conway JD, Croffie JM, Disario JA, et al. Chromoendoscopy. Gastrointestinal Endoscopy 2007;66(4):639‐49. [DOI] [PubMed] [Google Scholar]
Barclay 2006
- Barclay RL, Vicari JJ, Doughty AS, Johanson JF, Greenlaw RL. Colonoscopic withdrawal times and adenoma detection during screening colonoscopy. The New England Journal of Medicine 2006;355(24):2533‐41. [DOI] [PubMed] [Google Scholar]
Barclay 2008
- Barclay RL, Vicari JJ, Greenlaw RL. Effect of a time‐dependent colonoscopic withdrawal protocol on adenoma detection during screening colonoscopy. Clinical Gastroenterology and Hepatology 2008;6(10):1091‐8. [DOI] [PubMed] [Google Scholar]
Boparai 2011
- Boparai KS, Broek FJ, Eaden S, Fockens P, Dekker E. Increased polyp detection using narrow band imaging compared with high resolution endoscopy in patients with hyperplastic polyposis syndrome. Endoscopy 2011;43(8):676‐82. [DOI] [PubMed] [Google Scholar]
Bruno 2003
- Bruno MJ. Magnification endoscopy, high resolution endoscopy, and chromoscopy; towards a better optical diagnosis. Gut 2003;52 Suppl 4:iv7‐11. [DOI] [PMC free article] [PubMed] [Google Scholar]
Chiu 2006
- Chiu HM, Lin JT, Wang HP, Lee YC, Wu MS. The impact of colon preparation timing on colonoscopic detection of colorectal neoplasms ‐ a prospective endoscopist‐blinded randomized trial. American Journal of Gastroenterology 2006;101(12):2719‐25. [DOI] [PubMed] [Google Scholar]
Chiu 2007
- Chiu HM, Chang CY, Chen CC, Lee YC, Wu MS, Lin JT, et al. A prospective comparative study of narrow‐band imaging, chromoendoscopy, and conventional colonoscopy in the diagnosis of colorectal neoplasia. Gut 2007;56(3):373‐9. [DOI] [PMC free article] [PubMed] [Google Scholar]
Chung 2010
- Chung SJ, Kim D, Song JH, Park MJ, Kim YS, Kim JS, et al. Efficacy of computed virtual chromoendoscopy on colorectal cancer screening: a prospective, randomized back‐to‐back trial of Fuji Intelligent Color Enhancement versus conventional colonoscopy to compare adenoma miss rates. Gastrointestinal Endoscopy 2010;72(1):136‐42. [DOI] [PubMed] [Google Scholar]
Deenadayalu 2004
- Deenadayalu VP, Chadalawada V, Rex DK. 170 degrees wide‐angle colonoscope: effect on efficiency and miss rates. American Journal of Gastroenterology 2004;99(11):2138‐42. [DOI] [PubMed] [Google Scholar]
East 2007
- East JE, Suzuki N, Arebi N, Bassett P, Saunders BP. Position changes improve visibility during colonoscope withdrawal: a randomized, blinded, crossover trial. Gastrointestinal Endoscopy 2007;65(2):263‐9. [DOI] [PubMed] [Google Scholar]
East 2008
- East JE, Stavrindis M, Thomas‐Gibson S, Guenther T, Tekkis PP, Saunders BP. A comparative study of standard vs. high definition colonoscopy for adenoma and hyperplastic polyp detection with optimised withdrawal technique. Alimentary Pharmacology and Therapeutics 2008;28(6):768‐76. [DOI] [PubMed] [Google Scholar]
East 2011
- East JE, Bassett P, Arebi N, Thomas‐Gibson S, Guenther T, Saunders BP. Dynamic patient position changes during patient withdrawal increase adenoma detection; a randomised crossover trial. Gastrointestinal Endoscopy 2011;73(3):456‐63. [DOI] [PubMed] [Google Scholar]
Eide 1986
- Eide T. Risk of colorectal cancer in adenoma‐ bearing individuals within a defined population. International Journal of Cancer 1986;38(2):173‐6. [DOI] [PubMed] [Google Scholar]
Fennerty 1999
- Fennerty MB. Tissue staining (chromoscopy) of the gastrointestinal tract. Canadian Journal of Gastroenterology 1999;13(5):423‐9. [DOI] [PubMed] [Google Scholar]
Gralnek 2013
- Gralnek IM, Carr‐Locke DL, Segol O, Halpern Z, Siersema PD, Sloyer A, et al. Comparison of standard forward‐viewing mode versus ultrawide‐viewing mode of a novel colonoscopy platform: a prospective, multicenter study in the detection of simulated polyps in an in vitro colon model (with video). Gastrointestinal Endoscopy 2013;77(3):472‐9. [DOI] [PubMed] [Google Scholar]
Gralnek 2014
- Gralnek IM, Siersema PD, Halpern Z, Segol O, Melhem A, Suissa A, et al. Standard forward‐viewing colonoscopy versus full‐spectrum endoscopy; an international, multicentre, randomised, tandem colonoscopy trial. The Lancet Oncology 2014;15(3):353‐60. [DOI] [PMC free article] [PubMed] [Google Scholar]
Gross 2011
- Gross SA, Buchner AM, Crook JE, Cangemi JR, Picco MF, Wolfsen HC, et al. A comparison of high definition‐image enhanced colonoscopy and standard white‐light colonoscopy for colorectal polyp detection. Endoscopy 2011;43(12):1045‐51. [DOI] [PubMed] [Google Scholar]
Hafner 2015
- Hafner S, Zolk K, Radaelli F, Otte J, Rabenstein T, Zolk O. Water infusion versus air insufflation for colonoscopy. Cochrane Database of Systematic Reviews 2015, Issue 5. [DOI: 10.1002/14651858.CD009863.pub2] [DOI] [PMC free article] [PubMed] [Google Scholar]
Harrison 2004
- Harrison M, Singh N, Rex DK. Impact of proximal colon retroflexion on adenoma miss rates. American Journal of Gastroenterology 2004;99(3):519‐22. [DOI] [PubMed] [Google Scholar]
Heresbach 2008
- Heresbach D, Barrioz T, Lapalus MG, Coumaros D, Bauret P, Potier P, et al. Miss rate for colorectal neoplstic polyps: A prospective multicenter study of back‐to‐back video colonoscopies. Endoscopy 2008;40(4):284‐90. [DOI] [PubMed] [Google Scholar]
Hermanek 1987
- Hermanek P. Dysplasia‐carcinoma sequence, types of adenomas and early colorectal carcinoma. European Journal of Surgical Oncology 1987;13(2):141‐3. [PubMed] [Google Scholar]
Higgins 2003
- Higgins JPT, Thompson SG, Deeks JJ, Altman DG. Measuring inconsistency in meta‐analyses. BMJ 2003;327(7414):557‐60. [DOI] [PMC free article] [PubMed] [Google Scholar]
Higgins 2011
- Higgins JPT, Green S (editors). Cochrane Handbook for Systematic Reviews of Interventions version 5.1.0 (updated March 2011). The Cochrane Collaboration, 2011. Available from www.cochrane‐handbook.org.
Hixson 1990
- Hixson LJ, Fennerty MB, Sampliner RE, McGee D, Garewal H. Prospective study of the frequency and size distribution of polyps missed by colonoscopy. Journal of the National Cancer Institute 1990;82(22):1769‐72. [DOI] [PubMed] [Google Scholar]
Horfstad 2003
- Horfstad B. Chapter 17. In: Waye JD, Rex DK, Williams CB editor(s). Colonoscopy Principles and Practice. 1st Edition. Oxford: Blackwell, 2003:358‐76. [Google Scholar]
Hurlstone 2003
- Hurlstone DP, Cross SS, Lobo AJ. A 1 mm depressed type IIC minute colorectal cancer: first reported case and discussion of clinical relevance, with special reference to endoscopic diagnosis. Journal of Gastroenterology and Hepatology 2003;18(7):880‐1. [DOI] [PubMed] [Google Scholar]
Kaminski 2010
- Kaminski MF, Regula J, Kraszewska E, Polkowski M, Wojciechowska U, Didkowska J, et al. Quality indicators for colonoscopy and the risk of interval cancer. The New England Medical Journal 2010;362(19):1795‐803. [DOI] [PubMed] [Google Scholar]
Kuiper 2011
- Kuiper T, Broek FJ, Naber AH, Soest EJ, Scholten P, Mallant‐Hent RC, et al. Endoscopic trimodal imaging detects colonic neoplasia as well as standard video endoscopy. Gastroenterology 2011;140(7):1887‐94. [DOI] [PubMed] [Google Scholar]
Kuznetsov 2006
- Kuznetsov K, Lambert R, Rey JF. Narrow‐band imaging: potential and limitations. Endoscopy 2006;38(1):76‐81. [DOI] [PubMed] [Google Scholar]
Lambert 2002
- Lambert R. Diagnosis of esophagogastric tumors. Endoscopy 2002;34(2):129‐38. [DOI] [PubMed] [Google Scholar]
Leung 2012
- Leung J, Mann S, Siao‐Salera R, Ngo C, McCreery R, Canete W, et al. Indigocarmine added to the water exchange method enhances adenoma detection ‐ a RCT. Journal of Interventional Gastroenterology 2012;2(3):106‐11. [DOI] [PMC free article] [PubMed] [Google Scholar]
Matsuda 2008
- Matsuda T, Saito Y, Fu KI, Uraoka T, Kobayashi N, Nakajima T, et al. Does autofluorescence imaging videoendoscopy system improve the colonoscopic polyp detection rate? ‐ a pilot study. American Journal of Gastroenterology 2008;103(8):1926‐32. [DOI] [PubMed] [Google Scholar]
Moriichi 2012
- Moriichi K, Fujiya M, Sato R. Back‐to‐back comparison of auto‐fluorescence imaging (AFI) versus high resolution white light colonoscopy for adenoma detection. BioMed Central Gastroenterology 2012;12:75. [DOI] [PMC free article] [PubMed] [Google Scholar]
Muto 1975
- Muto T, Bussey HJ, Morson BC. The evolution of cancer of the colon and rectum. Cancer 1975;36(6):2251‐70. [DOI] [PubMed] [Google Scholar]
Nagorni 2012
- Nagorni A, Bjelakovic G, Petrovic B. Narrow band imaging versus conventional white light colonoscopy for the detection of colorectal polyps. Cochrane Database of Systematic Reviews 2012, Issue 1. [DOI: 10.1002/14651858.CD008361.pub2] [DOI] [PMC free article] [PubMed] [Google Scholar]
Ng 2012
- Ng SC, Tsoi KK, Hirai HW, Lee YT, Wu JC, Sung JJ, et al. The efficacy of cap assisted colonoscopy in polyp detection and cecal intubation: a meta‐analysis of randomized controlled trials. American Journal of Gastroenterology 2012;107(8):1165‐73. [DOI] [PubMed] [Google Scholar]
O'Brien 1990
- O'Brien MJ, Winawer SJ, Zauber AG, Gottlieb LS, Sternberg SS, Diaz B, et al. The national polyp study. Patient and polyp characteristics associated with high grade dysplasia in colorectal adenomas. Gastroenterology 1990;98(2):371‐9. [PubMed] [Google Scholar]
Paggi 2009
- Paggi S, Radaelli F, Amato A, Meucci G, Mandelli G, Imperiali G, et al. The impact of narrow band imaging in screening colonoscopy: a randomized controlled trial. Clinical Gastroenterology and Hepatology 2009;7(10):1049‐54. [DOI] [PubMed] [Google Scholar]
Pohl 2007
- Pohl J, May A, Rabenstein T, Pech O, Ell C. Computed virtual chromoendoscopy: a new tool for enhancing tissue surface structures. Endoscopy 2007;39(1):80‐3. [DOI] [PubMed] [Google Scholar]
Pohl 2009
- Pohl J, Lotterer E, Balzer C, Sackmann M, Schmidt KD, Gossner L, et al. Computed virtual chromoendoscopy versus standard colonoscopy with targeted indigocarmine chromoscopy: a randomised multicentre trial. Gut 2009;58(1):73‐8. [DOI] [PubMed] [Google Scholar]
Ramsoekh 2010
- Ramsoekh D, Haringsma J, Poley JW, Putten P, Dekken H, Steyerberg EW, et al. A back‐to‐back comparison of white light colonoscopy with autofluorescence endoscopy for adenoma detection in high‐risk subjects. Gut 2010;59(6):785‐93. [DOI] [PubMed] [Google Scholar]
Rembacken 2000
- Rembacken BJ, Fujii T, Clairns A, Dixon MF, Yoshida S, Chalmers DM, et al. Flat and depressed colonic neoplasms: a prospective study of 1000 colonoscopies in the UK. The Lancet 2000;355(9211):1211‐4. [DOI] [PubMed] [Google Scholar]
Review Manager 2014 [Computer program]
- The Nordic Cochrane Centre. Review Manager (RevMan). Version 5.3. Copenhagen: The Nordic Cochrane Centre, 2014.
Rex 1997
- Rex DK, Cutler CS, Lemmel GT, Rahmani EY, Clark DW, Helper DJ, et al. Colonoscopic miss rates of adenomas determined by back‐to‐back colonoscopies. Gastroenterology 1997;112(1):24‐8. [DOI] [PubMed] [Google Scholar]
Rex 2007
- Rex DK, Helbig CC. High yields of small and flat adenomas with high definition colonoscopes using either white light or narrow band imaging. Gastroenterology 2007;133(1):42‐7. [DOI] [PubMed] [Google Scholar]
Sanaka 2006
- Sanaka MR, Shah N, Mullen KD, Ferguson DR, Thomas C, McCullough AJ. Afternoon colonoscopies have higher failure rates than morning colonoscopies. American Journal of Gastroenterology 2006;101(12):2726‐30. [DOI] [PubMed] [Google Scholar]
Shinya 1979
- Shinya H, Wolff WI. Morphology, anatomic distribution and cancer potential of colonic polyps. Annals of Surgery 1979;190(6):679‐83. [DOI] [PMC free article] [PubMed] [Google Scholar]
Siersema 2012
- Siersema PD, Rastogi A, Leufkens AM, Akerman PA, Azzouzi K, Rothstein RI, et al. Retrograde‐viewing device improves adenoma detection rate in colonoscopies for surveillance and diagnostic workup. World Journal of Gastroenterology 2012;18(26):3400‐8. [DOI] [PMC free article] [PubMed] [Google Scholar]
Su 2006
- Su MY, Hsu CM, Ho YP, Chen PC, Lin CJ, Chiu CT. Comparative study of conventional colonoscopy, chromoendoscopy, and narrow‐band imaging systems in differential diagnosis of neoplastic and nonneoplastic colonic polyps. American Journal of Gastroenterology 2006;101(12):2711‐6. [DOI] [PubMed] [Google Scholar]
Subramanian 2011
- Subramanian V, Mannath J, Hawkey CJ, Ragunath K. High definition colonoscopy vs. standard video endoscopy for the detection of colonic polyps: a meta‐analysis. Endoscopy 2011;43(6):499‐505. [DOI] [PubMed] [Google Scholar]
Tada 1977
- Tada M, Katoh S, Kohli Y, Kawai K. On the dye spraying method in colonofibreoscopy. Endoscopy 1977;8(2):70‐4. [DOI] [PubMed] [Google Scholar]
Triadafilopoulos 2008
- Triadafilopoulos G, Li J. A pilot study to assess the safety and efficacy of the third eye retrograde auxillary imaging system during colonoscopy. Endoscopy 2008;40(6):478‐82. [DOI] [PubMed] [Google Scholar]
Tsuda 2002
- Tsuda S, Veress B, Tóth E, Fork FT. Flat and depressed colorectal tumours in a southern Swedish population: a prospective chromoendoscopic and histopathological study. Gut 2002;51(4):550‐5. [DOI] [PMC free article] [PubMed] [Google Scholar]
Ueta 2000
- Ueta H, Tamura S, Ohkawauchi K, Tadokoro T, Yokoyama Y, Matsuura Y, et al. Depressed type minute subserosal invasive colon cancer: report of a case. Gastrointestinal Endoscopy 2000;52(6):778‐80. [DOI] [PubMed] [Google Scholar]
Van den Broek 2009
- Broek FJ, Fockens P, Eeden S, Kara MA, Hardwick JC, Reitsma JB, et al. Clinical evaluation of endoscopic trimodal imaging for the detection and differentiation of colonic polyps. Clinical Gastroenterology and Hepatology 2009;7(3):288‐95. [DOI] [PubMed] [Google Scholar]
Winawer 1993
- Winawer SJ, Zauber AG, Ho MN, O'Brien MJ, Gottlieb LS, Sternberg SS, et al. Prevention of colorectal cancer by endoscopic polypectomy. The New England Journal of Medicine 1993;329(27):1977‐81. [DOI] [PubMed] [Google Scholar]
Zauber 2012
- Zauber AG, Winawer SJ, O'Brien MJ, Lansdorp‐Vogelaar I, Ballegooijen M, Hankey BF, et al. Colonoscopic polypectomy and long‐term risks of colorectal‐cancer deaths. The New England Journal of Medicine 2012;366(8):687‐96. [DOI] [PMC free article] [PubMed] [Google Scholar]