Figure 1.
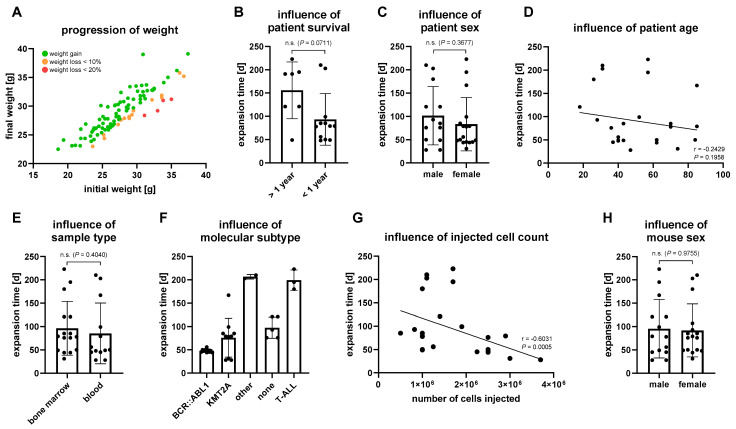
Engraftment-influencing parameters. Every dot represents a separate animal. (A) Comparison of the initial weight and weight at experiment termination of all 101 mice used for tumor cell expansion. Weight gain is indicated by green dots, while weight loss up to 10% and 20% is displayed in yellow and red, respectively. (B–H) Influence of clinical–pathological parameters on tumor cell engraftment and proliferation in the first PDX passage. (B) Only patients with confirmed date of death or a recent checkup no older than twelve months were included in the analysis to investigate the influence of patient survival. Samples of unknown status or when the last contact was longer than one year ago were excluded. n = 19 mice, mean ± standard deviation, Mann–Whitney test. (C) Influence of patient sex on engraftment velocity. n = 30 mice, mean ± standard deviation, Mann–Whitney test. (D) Correlation of patient age at sample collection with engraftment kinetics. n = 30 mice (Spearman’s correlation coefficient r). (E) Influence of sample origin (bone marrow or peripheral blood) on engraftment velocity. n = 29 mice, mean ± standard deviation, Mann–Whitney test. (F) Influence of the molecular subtype of the primary tumor on engraftment speed. Patients with BCR::ABL1 or KMT2A translocations and additional aberrations were only considered for the BCR::ABL1 and KMT2A cohorts, respectively. n = 30 mice, mean ± standard deviation, no statistical evaluation due to limited sample numbers in subgroups. (G) Correlation of the number of cells injected and the engraftment velocity. n = 30 mice (Spearman’s correlation coefficient r). (H) Influence of mouse sex on engraftment speed. n = 30 mice, mean ± standard deviation, Mann–Whitney test.

