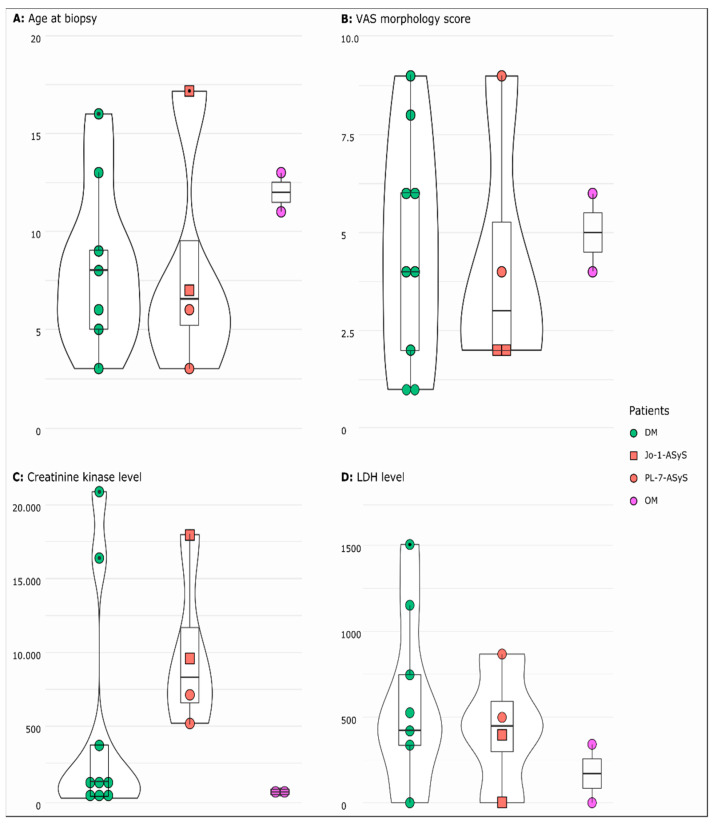
Figure 1.
Distribution as violin plot (rotated kermel density curve and boxplot) of age at biopsy (A) VAS morphology score (B), serum creatine kinase (C), and LDH (D) levels in jIIM subgroups DM, ASyS (Jo-1, PL-7), and OM. Wide sections represent a higher probability that the patients take the value and small sections represent a lower probability. The box represents the interquartile range, the whiskers minimum (Q1 − 1.5 × IQR) and maximum (Q3 + 1.5 × IQR), and the points show the outliers. For all parameters, the p-value did not reach statistical significance. (DM = dermatomyositis; ASyS = antisynthetase syndrome; OM = overlap myositis).

