Abstract
Purpose:
The purpose of the study was to compare a single two-dimensional image processing system (IMAGE) to underwater weighing (UWW) for measuring body volume (BV) and subsequently estimating body fat percentage (%Fat), fat mass (FM), and fat-free mass (FFM) via a 3-compartment (3C) model.
Methods:
A sample of participants age 18–39 yr was recruited for this study (n = 67, 47.8% female). BV was measured with UWW and predicted via the IMAGE software. The BV estimates from UWW (3CUWW) and IMAGE (3CIMAGE) were separately combined with constant total body water and body mass values for 3C model calculation of %Fat, FM, and FFM.
Results:
BV obtained from the IMAGE was 67.76 ± 12.19 and 67.72 ± 12.04 L from UWW, which was not significantly different (P = 0.578) and very largely correlated (r = 0.99, P < 0.001). When converted to %Fat (3CUWW = 21.01% ± 7.30%, 3CIMAGE = 21.08% ± 7.04%, P = 0.775), FM (3CUWW = 14.68 ± 5.15 kg, 3CIMAGE = 14.78 ± 5.08 kg, P = 0.578), and FFM (3CUWW = 57.00 ± 13.20 kg, 3CIMAGE = 56.90 ± 12.84 kg, P = 0.578) with the 3C model, no significant mean differences and very large correlations (r values ranged from 0.96 to 0.99) were observed. In addition, the standard error of estimate, total error, and 95% limits of agreement for all three metrics were small and considered acceptable.
Conclusions:
An IMAGE system provides valid estimates of BV that accurately estimates body composition in a 3C model.
Keywords: FAT MASS, FAT-FREE MASS, BODY FAT PERCENTAGE, UNDERWATER WEIGHING, SMARTPHONE APPLICATION
Accurate body composition assessment is important when assessing health-related outcomes, as higher levels of body fat percentage (%Fat) and fat mass (FM) have historically been associated with elevated risk of cardiovascular diseases, diabetes, certain types of cancers, and a number of other unfavorable health outcomes (1,2). On the other hand, lower FM and %Fat elevate the risk of osteoporosis, menstrual dysfunction, and body image disorders (3). In addition, fat-free mass (FFM) is often related to athletic performance, as well as longevity and physical function in older adults (4,5). Therefore, accurate and portable assessment methods of body composition have important implications within allied-health and sports performance settings.
Hydrostatic densitometry, known more simply as underwater weighing (UWW), has been considered the traditional criterion standard for body composition assessment (6). However, UWW is based on a two-compartment model that assumes a constant hydration of FFM at 73%, which serves as its greatest source of error (6,7). Instead, multicompartment models that account for total body water (TBW) are considered to be more accurate (8). Specifically, the Siri three-compartment (3C) model is a regression equation that combines measures of body mass (BM), body volume (BV), and TBW (6). Rather than calculating the metrics of body composition from the two-compartment approach with UWW, the method is used to acquire BV and combined with a TBW assessment from either isotope dilution or bioelectrical impedance (6,9).
Unfortunately, the 3C method is not practically feasible because of the associated expense of equipment and requirement of specialized technical skill. In addition, the time associated with assessment is burdensome for large-scale data collection. Recently, a 3C model with BV measures derived from skinfolds (SF) demonstrated very large agreement to a laboratory-based 3C model with BV assessed via UWW (10,11). Although the novel method is promising for the practical assessment of body composition, the technical skill required for competent SF assessment produces a potential source of error due to poor interrater and intrarater reliability (12–14).
A two-dimensional (2D) image analysis technique was recently developed to estimate BV from a single digital image based on a series of linear diameter measurements (15). The novel technology may be a promising body composition method without the time and cost limitations of traditional techniques. The BV estimate derived from the 2D imaging system could be useful when combined with a measure of TBW for a 3C model. Such an innovative approach would provide a fully portable, simple, and inexpensive method that can be used by virtually anyone, with a smartphone or tablet. However, no available research has validated the method. As such, the purpose of the study was to compare a 2D image processing system to the criterion UWW method for measuring BV and subsequently estimating %Fat, FM, and FFM via a 3C body composition model, when TBW and BM measures were held constant. It was hypothesized that this novel approach would provide acceptable agreement to UWW for deriving the aforementioned metrics.
METHODS
Participants
Participants (n = 67, 47.8% female, 79.1% White/Caucasian) were recruited for this study. Descriptive characteristics of the study sample are presented in Table 1. Written informed consent was obtained from each participant before data collection. The institutional review board at the University of Alabama approved the study protocol and data collection procedures (Protocol 19-07-2516). Before arriving at the laboratory for their testing visit, participants were instructed to abstain from exercise, food, and drink, except water, for a minimum of 12 h. Adherence to the pretest study protocol was self-reported and confirmed for each participant before data collection.
TABLE 1.
Descriptive characteristics of study participants (n = 67).
| Age, yr | 22.1 ± 4.57 |
| Height, cm | 172.68 ±9.16 |
| Weight, kg | 71.68 ±13.12 |
| Body mass index, kg-m−2 | 23.85 ± 2.79 |
| TBW, L | 40.89 ± 9.68 |
Values presented as mean ± SD.
Procedures
To ensure euhydration before data collection, all participants provided a urine specific gravity value, as assessed by using a refractometer (Atago SUR-NE; Atago Corp Ltd., Tokyo, Japan), of <1.030 (16). After confirming adequate hydration, standing height was measured without shoes to the nearest 0.1 cm with a manual stadiometer (SECA 213; Seca Ltd., Hamburg, Germany). BM was measured to the nearest 0.1 kg using a digital scale (Tanita BWB-800; Tanita Corporation, Tokyo, Japan).
Digital Image Analysis
Participants remained fully clothed while the images were obtained, wearing snug fitting athletic clothing that allowed the automated program to identify the anatomical points of interest. Participants stood with their feet flat in front of a white photography background facing away from the digital camera, with weight evenly distributed on both feet. The heels were placed together with the feet pointed slightly outward at a 60° angle. Participants were required to remain motionless with arms abducted at a 45° angle away from the torso and aligned within the coronal plane, with palms facing away from the camera. Once correctly positioned, participants were asked to stand without altering the position of the heels or hands. A single digital image that included the head, feet, and arms of the individual was obtained from the rear/posterior view using a 12.9-inch, 64-g iPad Pro. The images were analyzed using a commercially available application (version 0.30; MADE Health and Fitness LLC, Tuscaloosa, AL; www.mymadeapp.com). A series of anatomical dimensions were identified in the form of linear measurements using an automated and undisclosed pro-prietary algorithm that estimated BV (BVIMAGE). The built-in regression equation was originally validated using UWW as the criterion BV measure in a completely different sample than the current study (15). An example image of how a participant should be positioned within the image is shown in Figure 1. For the current study, the institutional review board required that all total body images be obtained from the posterior view so that no personally identifiable facial features could be seen in the image. The application calculates linear diameter measurements at various landmarks on the participant, so the images can be obtained from either the anterior or posterior view with no effect on the accuracy of the body composition estimates. An anterior camera view is recommended for users when performing a measurement outside of a research setting to ensure the camera is properly aligned and the user is entirely within the frame.
FIGURE 1—
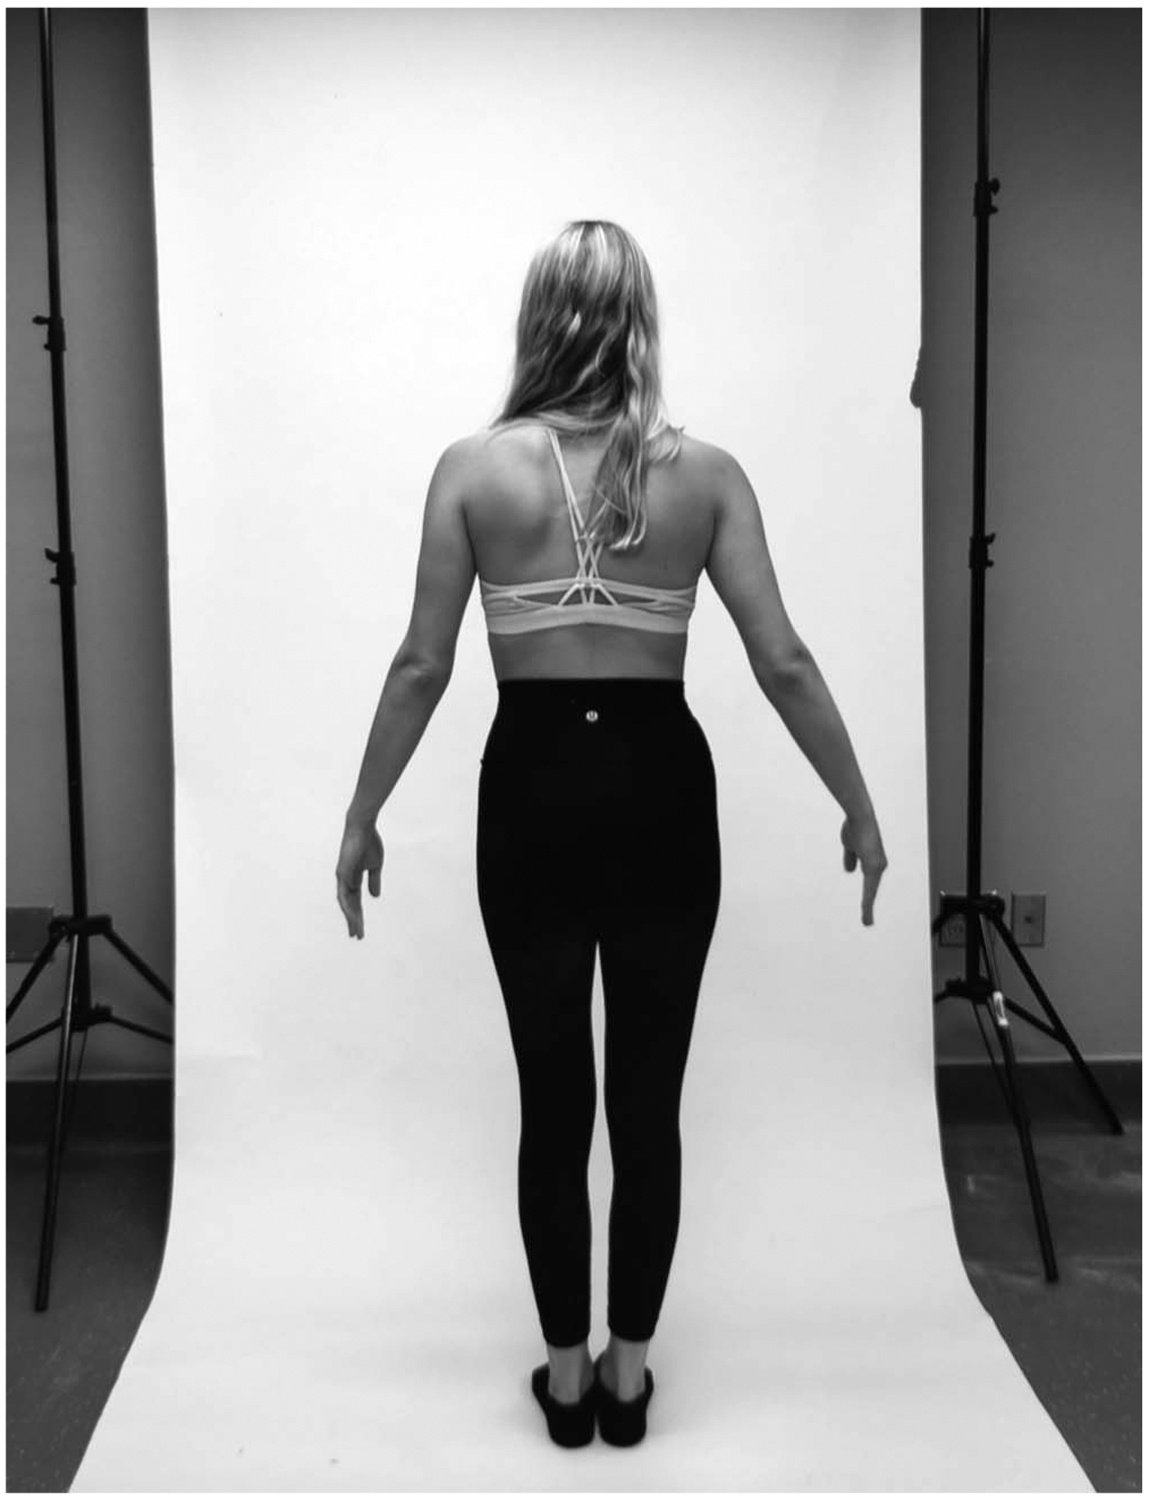
An example to show a participant’s position for the calculation of BV with the mobile 2D image processing system.
Underwater Weighing
Residual lung volume was determined using the oxygen dilution technique via nitrogen analysis (ParvoMedics True Max 2400; ParvoMedics, Sandy, UT) while in a seated position before entering the water tank. Participants were instructed to sit on a sling seat during testing and performed a maximum expiration while submerged completely underwater. The average of the three highest values (5–10 trials) was used as the representative of underwater weight and used to derive criterion BV (BVUWW).
Bioimpedance Spectroscopy
Hand-to-foot bioimpedance spectroscopy (BIS; Imp™ SFB7; ImpediMed Limited, Queensland, Australia) was used to determine TBW for inclusion in the 3C models. This technique uses a range of 256 frequencies that allow for the electrical current to pass through and around cells. TBW values derived from BIS have been previously shown to provide a valid estimate of TBW when compared with deuterium oxide (9). Electrodes were placed on the right hand and right foot with participants in a supine position with the arms ≥30° away from the body with legs separated, according to the manufacturer’s instructions. Before electrode placement, sites were cleaned with alcohol pads and any excess hair was removed with a razor. The measurement commenced after the necessary descriptive characteristics (height, weight, age, and sex) were entered into the BIS device. The device’s built-in algorithms were used for calculating TBW.
Three-compartment model calculations.
The BV estimates from UWW (3CUWW) and the 2D image system (3CIMAGE) were separately combined with TBW and BM for 3C model calculation as described by Siri (6). The equations for %Fat, FM, and FFM used in the current analysis are provided hereinafter:
Statistical Analyses
Statistical analyses were performed using SPSS for Windows (SPSS 23.0, Chicago, IL) and Microsoft Excel 2010 (Microsoft Corporation, Redmond, WA). The BV estimates between the 2D image and UWW were compared using paired-sample t-tests and Pearson product moment correlation coefficients (r). Paired-samples t-tests were also used to compare the mean values of %Fat, FM, and FFM via the 3CIMAGE versus 3CUWW. Cohen’s d statistic determined the effect sizes (ES) of the mean comparisons and was qualitatively described as follows: 0–0.2, small; 0.2–0.5, medium; 0.5–0.8, large; and >0.8, very large (17,18). Linear regression procedures were used to determine the Pearson r and standard error of the estimate (SEE) for each body composition metric via the 3CIMAGE (x-axis) compared the 3CUWW (y-axis). For all correlation procedures, the strength of each r value was qualitatively described as follows: 0–0.30, small; 0.30–0.50, medium; 0.50–0.70, large; and 0.70–1.00, very large (18). Furthermore, standards outlined by Lohman et al. (14) and Heyward (19) were used to qualitatively describe the level of agreement and accuracy observed from each SEE as follows: 2.0 as ideal, 2.5 as excellent, 3.0 as very good, 3.5 as good, 4.0 as fairly good, 4.5 as fair, and 5.0 as poor. Total error (TE), which accounts for both SEE and constant error (CE) (11), was calculated with the following equation:
whereas the body composition metric from the 3CIMAGE served as the predicted value and from the 3CUWW as the criterion value. The Bland–Altman method was used to determine the agreement between the 3CIMAGE and 3CUWW body composition estimates by plotting their difference (y-axis) against their mean value (x-axis) (20). This method identifies the CE (CE = predicted − criterion) and 95% confidence interval for the individual differences (CE ± 1.96 SD). Proportional bias was assessed by determining the r values (i.e., trends) between the differences and mean values of each Bland–Altman plot. Equivalence testing was used to determine if 3CIMAGE measures could be considered equal to the criterion 3CUWW measures, even in the presence or absence of statistical differences, based on a ±5% equivalence region and 90% confidence limits for the individual comparisons (21). All data were expressed as mean ± SD, unless otherwise indicated. Statistical significance for all procedures was determined as P < 0.05.
RESULTS
BVIMAGE (67.76 ± 12.19 L) was not different from BVUWW (67.71 ± 12.04 L; P = 0.578), with an ES < 0.001, which was considered small. In addition, the correlation between the two BV measures was very large (r = 0.99, SEE = 0.68 L; Fig. 2). The ±5% equivalence region for BVUWW required that the confidence interval for the difference between the BVIMAGE and BVUWW measures fell between −3.37 and 3.37 L. The standard error of the difference was 0.08 L, and corresponding 90% confidence interval for the difference was −0.09 to 0.18, which was considered to be completely inside the equivalence region.
FIGURE 2—
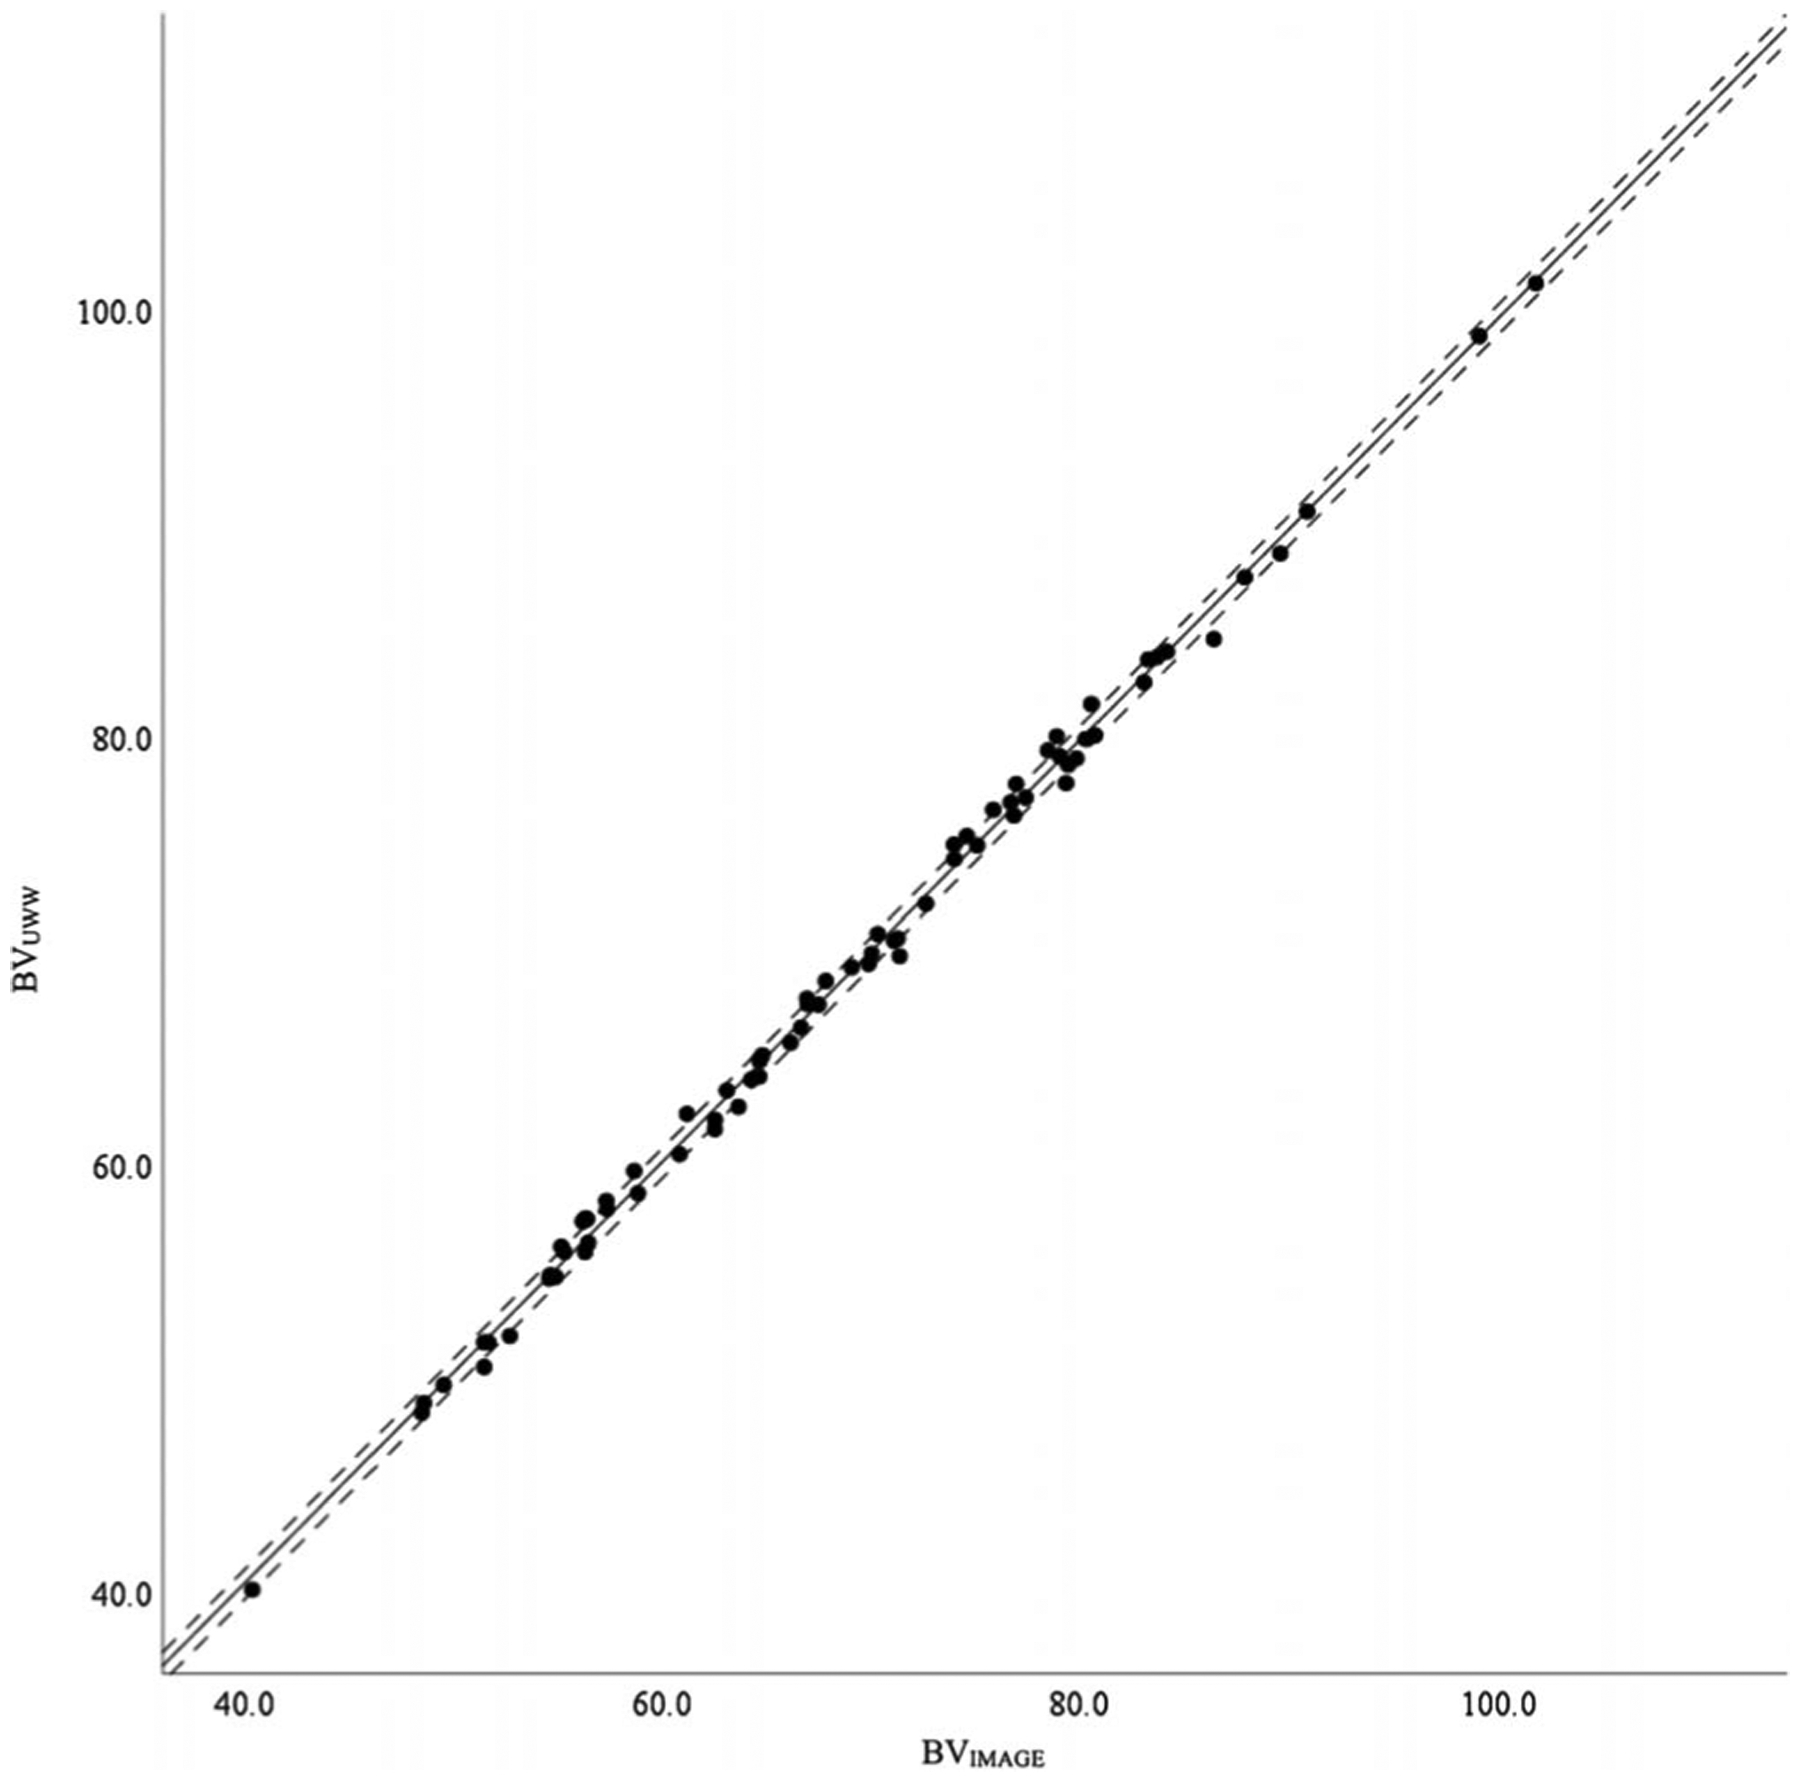
Scatterplot representing the correlation between the BV estimates of UWW and the 2D image processing system (IMAGE). The solid middle line represents the regression line, whereas the two outside dashed lines represent the SEE.
The body composition comparisons between the 3CIMAGE and 3CUWW are shown in Table 2. There were no statistically significant mean differences for %Fat, FM, and FFM (P values ranged from 0.578 to 0.775), and the ES values ranged from 0.01 to 0.02, which was considered small. Furthermore, very large correlations were observed between both methods for all three body composition metrics, with r values ranging from 0.96 to 0.99 (P < 0.001 for all). The SEE values and TE values were considered ideal for all three metrics. The Bland–Altman plots comparing the agreement of all three body composition metrics between the 3CIMAGE and 3CUWW are shown in Figures 3–5, with the specific values shown in Table 2. The 95% limits of agreement ranged between 4.13% and −3.98% for %Fat, between 2.96 and −2.76 kg for FM, and between 2.76 and −2.96 kg for FFM. The trend between the x- and y-axes of each plot was not statistically significant (all, P > 0.05), with the strength of the r values qualified as small.
TABLE 2.
Agreement between 3C body composition models using BV derived from UWW (3CUWW) or two-dimensional image-analysis (3CIMAGE) in healthy adults.
| Mean ± SD | P | ES | r | SEE | TE | Limits of Agreement | ||||
|---|---|---|---|---|---|---|---|---|---|---|
| CE ± 1.96 SD | Upper | Lower | Trend | |||||||
| 3CUWW %Fat | 21.01 ± 7.30 | — | — | — | — | — | — | — | — | — |
| 3CIMAGE %Fat | 21.08 ± 7.04 | 0.775 | 0.01 | 0.96* | 2.01 | 2.04 | 0.07 ± 4.05 | 4.13 | −3.98 | −0.13 |
| 3CUWW FM | 14.68 ± 5.15 | — | — | — | — | — | — | — | — | — |
| 3CIMAGE FM | 14.78 ± 5.08 | 0.578 | 0.02 | 0.96* | 1.47 | 1.45 | 0.09 ± 2.86 | 2.96 | −2.76 | −0.05 |
| 3CUWW FFM | 57.00 ± 13.20 | — | — | — | — | — | — | — | — | — |
| 3CIMAGE FFM | 56.90 ± 12.84 | 0.578 | −0.01 | 0.99* | 1.45 | 1.45 | −0.09 ± 2.86 | 2.76 | −2.96 | −0.24 |
Statistically significant at P < 0.05.
FIGURE 3—
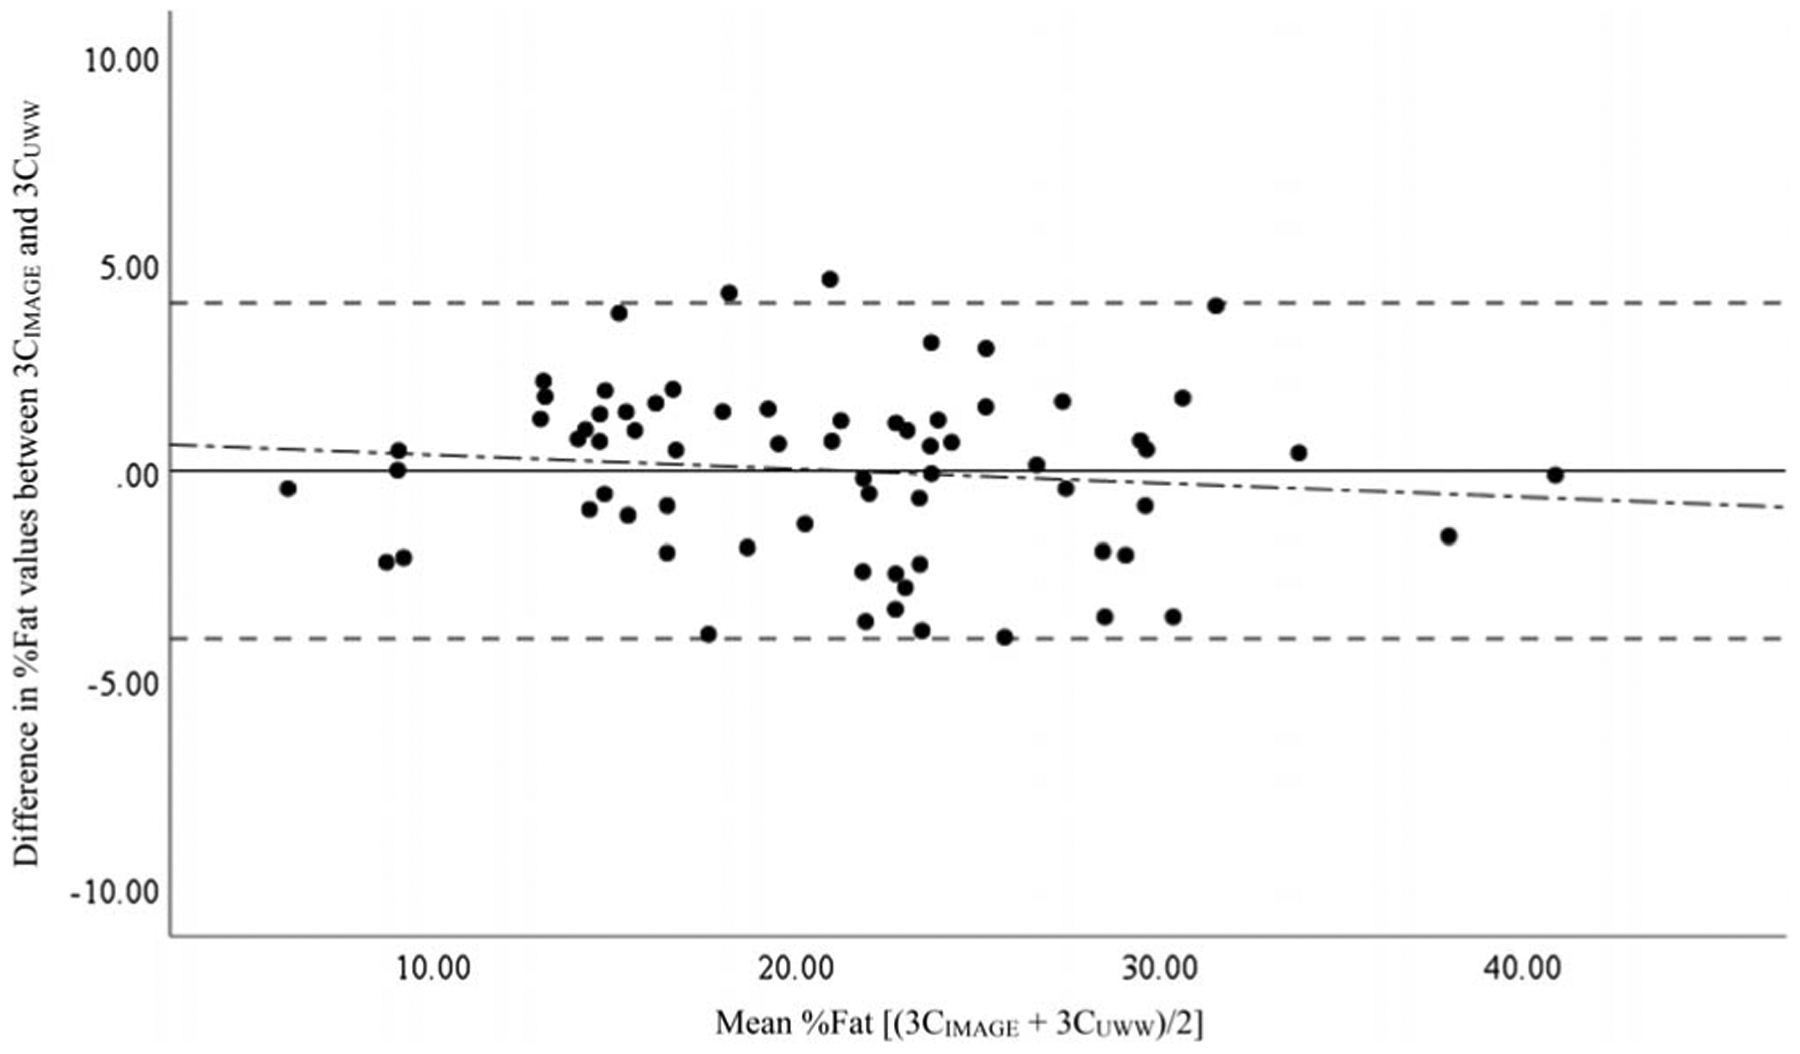
Bland–Altman plots showing the agreement between the 3C measures of %Fat. The solid middle line indicates the CE. The two outside dashed lines represent the upper and lower limits of agreement. The dashed-dotted line represents the trend between the x- and y-axes. 3CIMAGE, 3C model from the 2D image technique; 3CUWW, criterion 3C from UWW.
FIGURE 5—
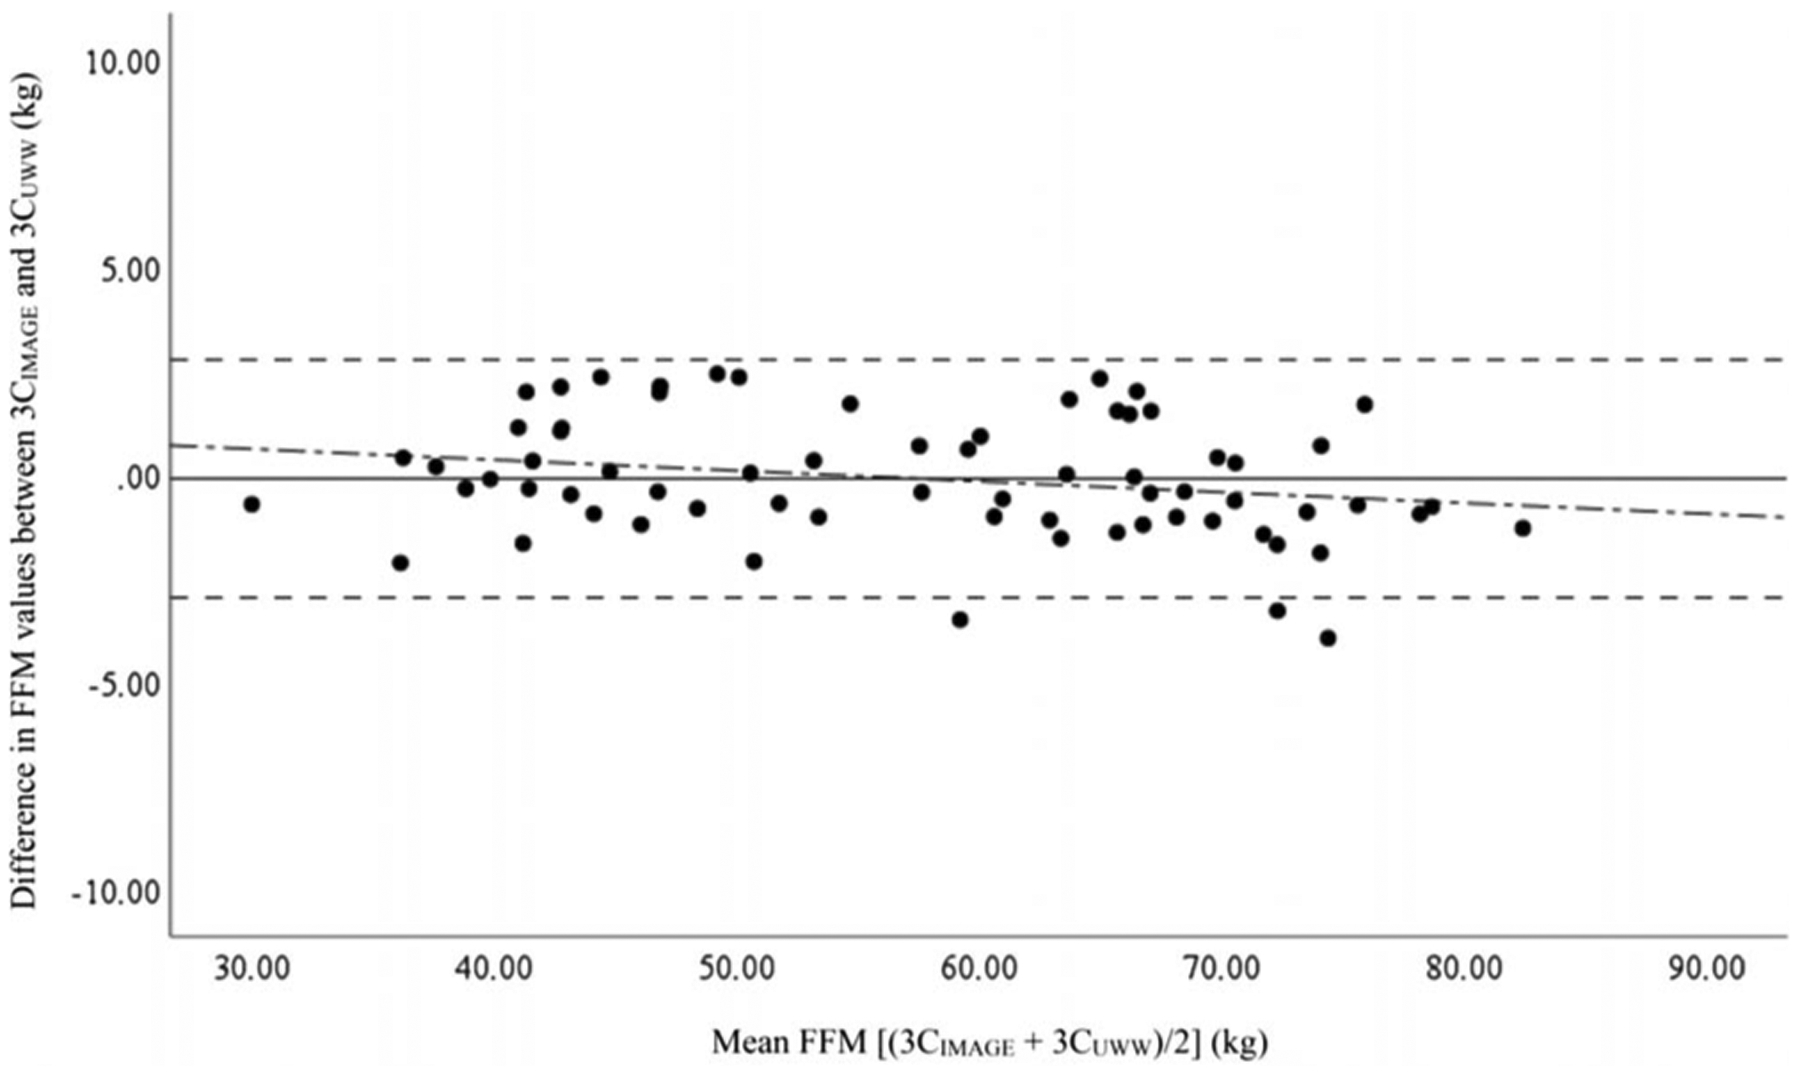
Bland–Altman plots showing the agreement between the 3C measures of FFM. The solid middle line indicates the CE. The two outside dashed lines represent the upper and lower limits of agreement. The dashed-dotted line represents the trend between the x- and y-axes. 3CIMAGE, 3C model from the 2D image technique; 3CUWW, criterion 3C from UWW.
The ±5% equivalence region required that the confidence intervals for the differences between the 3CIMAGE and 3CUWW fell between −1.05% and 1.05% for %Fat, between −0.73 and 0.73 kg for FM, and between −2.85 and 2.85 kg for FFM. Consequentially, the standard errors of the differences were 0.25% for %Fat, 0.18 kg for FM, and 0.18 kg for FFM. The corresponding 90% confidence intervals for the differences were −0.49% to 0.34%, −0.39 to 0.19 kg, and −0.39 to 0.19 kg, respectively, which were completely inside each of the aforementioned equivalence regions, indicating that the 3CIMAGE and 3CUWW were equal when measuring %Fat, FM, and FFM.
DISCUSSION
The results of the current study indicate that BV can be accurately estimated with a 2D image processing system. Furthermore, the estimates of %Fat, FM, and FFM when 2D image-derived BV is combined with the measure of TBW within a 3C model are comparable to the criterion method of assessing the former with UWW and considered equivalent. According to the standards set by Heyward (19), the 3CIMAGE method also yielded ideal accuracy when compared with the 3CUWW, with very large correlations, low SEE and TE values, and narrow limits of agreement found for each of the three body composition metrics. The trend between the x- and y-axes was not statistically significant within the Bland–Altman plots, and the r values were qualified as small (all less than −0.30), indicating no evidence of proportional bias. In addition, the results of the equivalence testing indicate that the 3CIMAGE and 3CUWW may be considered “equal” for assessing %Fat, FM, and FFM. Therefore, the hypothesis that the 2D image system would provide acceptable agreement to UWW for deriving BV and then estimating %Fat, FM, and FFM within a 3C model was accepted.
Traditional two-compartment measures of body composition, such as UWW, assume that water composition of FFM is constant at 73% (22,23). Body water has the lowest density of all other composition compartments, yet the largest overall volume. Therefore, the reported wide variation of FFM hydration between individuals poses the greatest source of error for two-compartment models that do not account for TBW (6,7). To correct for this, Siri (6) developed the 3C body composition model, which equates %BF, FM, and FFM from a regression equation that uses the variables of BV and TBW. Although the standard for the latter metric requires an isotopic method, such as deuterium oxide, the simple technique of bioimpedance has been shown to provide an accurate alternative (9). As such, the BIS method utilized herein is common for the assessment of TBW when determining body composition via a criterion multicompartment model (10,11).
Although UWW is traditionally considered a standard for BV assessment (24), many subjects, especially those that are hydrophobic, may consider the method too cumbersome. As a result, the UWW technique often requires a lengthy time for individual assessment. Because of this, dual-energy x-ray absorptiometry (DXA) and air-displacement plethysmography are common alternatives within multicompartment body composition models among many laboratories (25). Because of the findings of “very large” agreement in the current study, it is reasonable to consider the 2D image processing system as an acceptable method of BV assessment for multicompartment body composition testing within research studies. Although further research is needed to substantiate this postulation, one study exists to lend support. Moon et al. (26) compared a different mobile 2D imaging system with air-displacement plethysmography for BV assessment in 22 men and women before and after a weight loss intervention. The results showed very large r values of 0.99, SEE of less than 1.94 L, and TE of less than 2.55 L (26). However, the 2D image system of Moon et al. (26) predicts BV from the number of pixels that comprise a person’s body within an image. This process is different from the 2D imaging system of the current study, which estimates BV by the width of various anatomical dimensions within the image of a person and was developed with UWW as the criterion BV measure. In addition, the previous study did not include a measure of TBW for 3C modeling.
The current results are also in line with previous research validating other field methods of BV assessment, such as the SF technique, for 3C body composition models. For instance, Forslund et al. (27) compared a 3C model that utilized SF-derived BV with a four-compartment method that included BV assessed from UWW, bone mineral content from DXA, and TBW from bioimpedance. The results were similar to the current comparisons, with small mean differences and very large correlations (27). Two additional studies demonstrated comparable findings of 3C models with BV evaluated via SF versus laboratory 3C (11) and 4C (10) models.
Because of the aforementioned results, the SF technique is emerging as an attractive method for BV assessment for field-based multicompartment modeling. However, technical skill for SF assessment can vary among practitioners. As such, the method has been shown to provide very large 95% confidence intervals of intraclass correlations when comparing measures between two technicians (12–14). Therefore, relevant to field assessment, the SF technique poses a similar limitation to UWW. The time period before performing the technique in a competent manner may be relatively long, and such a learning curve could vary between technicians. However, the 2D image technique requires only the ability to take a picture from a smartphone. The BV estimate is automatically calculated from the built-in processing system. The simplicity of assessment is an advantage of this method, and hence, technical skill is not a major requirement. Therefore, it is reasonable to assume that the mobile 2D imaging system is more reliable within and between technicians as compared with traditional BV methods. It should also be noted, however, that the SF method was not included in this study. Therefore, comparing the validity and reliability of a 3C model with BV assessed via the 2D imaging system versus SF should be a focus for future research.
When interpreting the results of this study, a few limitations should be considered. First, more complex multiple-compartment models exist that add a total bone mineral component via DXA. However, the use of DXA is limited outside of clinical or research settings because of the expense and often requires additional oversight and approval because of radiation control regulations that may vary by region, state, and country. Consequentially, the focus of the study was for 3C modeling, which is more widely accessible to practitioners. Furthermore, the 3C model has been demonstrated to provide valid estimates of body composition when compared with models that include additional compartments (28). Thus, the 3C model has been considered a viable criterion measure for research (6,29). In addition, the 3CUWW and 3CIMAGE body composition calculations utilized the same technique to measure TBW. The specific BIS device is primarily found in research laboratories, whereas the less sophisticated bioelectrical impedance analysis (BIA) is more common within mainstream fitness settings. Similar to previous research (11), future investigation should validate a field-based 3C model that uses BV estimates from 2D imaging system and TBW measures via BIA. However, because of the very large correlations between BIA and BIS for TBW found in previous research (11), the combined methods for accurate 3C assessment seem feasible.
In conclusion, the current study demonstrated that a 2D image processing system was accurate for the assessment of BV. Furthermore, when the measure was combined with TBW for 3C body composition modeling, the %Fat, FM, and FFM metrics showed acceptable agreement to the laboratory method that used UWW for BV, when TBW was held constant. Because of the findings of the study, as well as the simplicity of the mobile 2D imaging technique, the method may be a viable alternative to UWW for estimating body composition via 3C models within practical settings. Future research is needed to determine the feasibility of using this approach for BV assessment as a criterion method of body composition testing for research purposes. However, the novel findings of the study suggest the 2D image processing system is a promising BV assessment method for use within practical, clinical, and laboratory settings.
FIGURE 4—
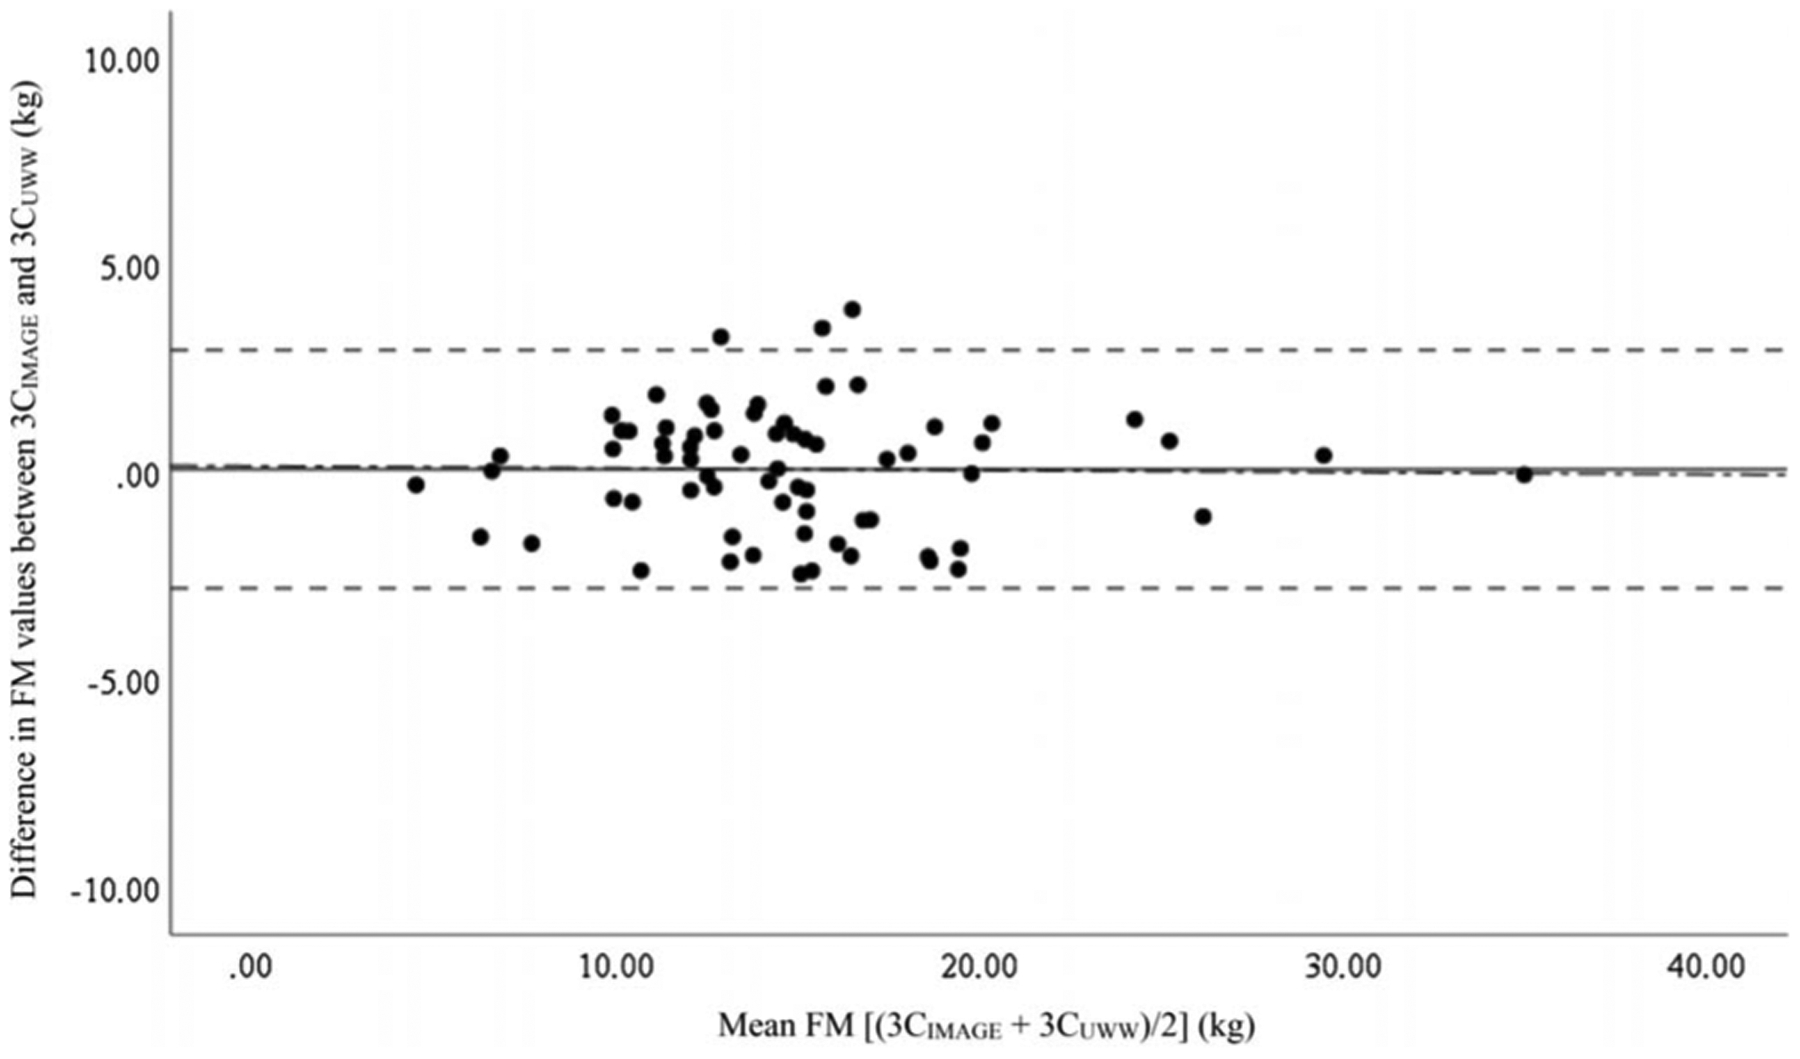
Bland–Altman plots showing the agreement between the 3C measures of FM. The solid middle line indicates the CE. The two outside dashed lines represent the upper and lower limits of agreement. The dashed-dotted line represents the trend between the x- and y-axes. 3CIMAGE, 3C model from the 2D image technique; 3CUWW, criterion 3C from UWW.
Acknowledgments
The authors would like to thank all of the individuals who participated in the study. No funding was received for this study.
Two of the authors (M. R. E., M. V. F.) are coinventors of the 2D image analysis program and co-owners of the commercially available application (mymadeapp.com). The results of the present study do not constitute endorsement by the American College of Sports Medicine. The results of the study are presented clearly, honestly, and without fabrication, falsification, or inappropriate data manipulation.
REFERENCES
- 1.Pi-Sunyer FX, Xavier DM, Becker C, et al. Clinical guidelines on the identification, evaluation, and treatment of overweight and obesity in adults. Am J Clin Nutr. 1998;68:889–917. [DOI] [PubMed] [Google Scholar]
- 2.World Health Organization. Preventing and managing the global epidemic. Report of a WHO consultation on obesity. World Health Organ Tech Rep Ser. 1998;2:894. [PubMed] [Google Scholar]
- 3.Chu SM, Gustafson KE, Leiszler M. Female athlete triad: clinical evaluation and treatment. Am J Lifestyle Med. 2013;7(6):387–94. [Google Scholar]
- 4.Wilmore JH. Body composition in sport and exercise: directions for future research. Med Sci Sports Exerc. 1983;15(1):21–31. [PubMed] [Google Scholar]
- 5.Barajas-Galindo DE, González Arnáiz E, Ferrero Vicente P, Ballesteros-Pomar MD. Effects of physical exercise in sarcopenia. A systematic review. Endocrinol Diabetes Nutr. 2020;24:S2530–0164. [DOI] [PubMed] [Google Scholar]
- 6.Siri WE. Body composition from fluid spaces and density: analysis of methods. In: Brozek J, Henschel A, editors. Techniques for Measuring Body Composition. Brozek J, Henschel A, eds. Washington (DC): National Academy of Sciences; 1961. p. 223–44. [Google Scholar]
- 7.Moon JR. Body composition in athletes and sports nutrition: an examination of the bioimpedance analysis technique. Eur J Clin Nutr. 2013;67(1 Suppl):S54–9. [DOI] [PubMed] [Google Scholar]
- 8.Moon JR, Eckerson JM, Tobkin SE, et al. Estimating body fat in NCAA Division I female athletes: a five-compartment model validation of laboratory methods. Eur J Appl Physiol. 2009;105(1):119–30. [DOI] [PubMed] [Google Scholar]
- 9.Moon JR, Tobkin SE, Roberts MD, et al. Total body water estimations in healthy men and women using bioimpedance spectroscopy: a deuterium oxide comparison. Nutr Metab (Lond). 2008;5(1):7. [DOI] [PMC free article] [PubMed] [Google Scholar]
- 10.Nickerson BS, Tinsley GM, Esco MR. Validity of field and laboratory three-compartment models in healthy adults. Med Sci Sports Exerc. 2019;51(5):1032–9. [DOI] [PubMed] [Google Scholar]
- 11.Esco MR, Nickerson BS, Fedewa MV, Moon JR, Snarr RL. A novel method of utilizing skinfolds and bioimpedance for determining body fat percentage via a field-based three-compartment model. Eur J Clin Nutr. 2018;72(10):1431–8. [DOI] [PubMed] [Google Scholar]
- 12.Wagner DR, Cain DL, Clark NW. Validity and reliability of A-mode ultrasound for body composition assessment of NCAA Division I athletes. PLoS One. 2016;11(4):e0153146. [DOI] [PMC free article] [PubMed] [Google Scholar]
- 13.Kispert CP, Merrifield HH. Interrater reliability of skinfold fat measurements. Phys Ther. 1987;67(6):917–20. [DOI] [PubMed] [Google Scholar]
- 14.Lohman T, Pollock M, Slaughter M, Brandon LJ, Boileau R. Methodological factors and the prediction of body fat in female athletes. Med Sci Sports Exerc. 1984;16(1):92–6. [PubMed] [Google Scholar]
- 15.Fedewa MV, Esco MR. Body composition assessment using two-dimensional digital image analysis. United States Provisional Patent 16/841,944. Filed April 8, 2020. [Google Scholar]
- 16.Armstrong LE. Hydration assessment techniques. Nutr Rev. 2005;63: S40–54. [DOI] [PubMed] [Google Scholar]
- 17.Hedges LV, Olkin I. Statistical Methods for Meta-analysis. Orlando (FL): Academic Press; 2014. [Google Scholar]
- 18.Rosenthal R, Rosnow RL. Essentials of Behavioral Research: Methods and Data Analysis. New York: McGraw-Hill; 1984. 364 p. [Google Scholar]
- 19.Heyward V ASEP methods recommendation: body composition assessment. J Exerc Physiol Online. 2001;4(4). [Google Scholar]
- 20.Bland JM, Altman D. Statistical methods for assessing agreement between two methods of clinical measurement. Lancet. 1986;1(8476): 307–10. [PubMed] [Google Scholar]
- 21.Dixon PM, Saint-Maurice PF, Kim Y, Hibbing P, Bai Y, Welk GJ. A primer on the use of equivalence testing for evaluating measurement agreement. Med Sci Sports Exerc. 2018;50(4):837–45. [DOI] [PMC free article] [PubMed] [Google Scholar]
- 22.Borga M, West J, Bell JD, et al. Advanced body composition assessment: from body mass index to body composition profiling. J Investig Med. 2018;66(5):1–9. [DOI] [PMC free article] [PubMed] [Google Scholar]
- 23.Ackland TR, Lohman TG, Sundgot-Borgen J, et al. Current status of body composition assessment in sport. Sports Med. 2012;42(3): 227–49. [DOI] [PubMed] [Google Scholar]
- 24.Nickerson BS, Esco MR, Bishop PA, et al. Impact of measured vs. predicted residual lung volume on body fat percentage using underwater weighing and 4-compartment model. J Strength Cond Res. 2017;31(9):2519–27. [DOI] [PubMed] [Google Scholar]
- 25.Nickerson BS, Esco MR, Bishop PA, Kliszczewicz BM, Park KS, Williford HN. Validity of four-compartment model body fat in physically active men and women when using DXA for body volume. Int J Sport Nutr Exerc Metab. 2017;27(6):520–7. [DOI] [PubMed] [Google Scholar]
- 26.Moon JR, Tobkin SE, Walter AA, et al. A new simplified method for tracking body volume changes using digital image plethysmography (DiP) [abstract]. Presented at: the 8th International Symposium on In Vivo Body Composition Studies 2008. [Google Scholar]
- 27.Forslund AH, Johansson AG, Sjödin A, Bryding G, Ljunghall S, Hambraeus L. Evaluation of modified multicompartment models to calculate body composition in healthy males. Am J Clin Nutr. 1996; 63(6):856–62. [DOI] [PubMed] [Google Scholar]
- 28.Withers RT, LaForgia J, Pillans RK, et al. Comparisons of two-, three-, and four-compartment models of body composition analysis in men and women. J Appl Physiol. 1998;85(1):238–45. [DOI] [PubMed] [Google Scholar]
- 29.Moon JR, Tobkin SE, Smith AE, et al. Percent body fat estimations in college men using field and laboratory methods: a three-compartment model approach. Dyn Med. 2008;7(1):7. [DOI] [PMC free article] [PubMed] [Google Scholar]


