

Abstract
Cytochrome P450s are diverse and powerful catalysts that can activate molecular oxygen to oxidize a wide variety of substrates. Catalysis relies on effective uptake of two electrons and two protons. For cytochrome P450cam, an archetypal member of the superfamily, the second electron must be supplied by the redox partner putidaredoxin (Pdx). Pdx also plays an effector role beyond electron transfer, but after decades the mechanism remains under investigation. We applied infrared spectroscopy to heme-ligated CN− to examine the influence of Pdx binding. The results indicate that Pdx induces the population of a conformation wherein the CN− ligand forms a strong hydrogen bond to a solvent water molecule, experimentally corroborating the formation of a proposed proton delivery network. Further, characterization of T252A P450cam implicates the side chain of Thr252 in regulating the population equilibrium of hydrogen-bonded states within the P450cam/Pdx complex, which could underlie its role in directing activated oxygen toward product formation and preventing reaction uncoupling through peroxide release.
Graphical Abstract

The ability to bind and activate molecular oxygen (O2) for oxygen insertion into inactivated carbon centers is harnessed by the (mono)oxidases cytochrome P450s (P450s), one of the largest and most widespread superfamilies of heme enzymes, for the metabolism and biosynthesis of a diversity of compounds.1–4 While the catalytic cycle of P450s is generally established and known to involve uptake of two electrons and protons (Figure 1), many intermediates are unstable and short-lived, so aspects of oxygen activation and insertion have remained under investigation after decades of attention. For example, a long-standing question has persisted regarding oxygen activation within the archetypical member of the superfamily, cytochrome P450cam (P450cam) from Pseudomonas putida. Unlike most P450s, progression through the catalytic cycle beyond O2 binding requires interaction with its specific redox partner, putidaredoxin (Pdx).5,6 Pdx not only provides electrons for reduction but also induces structural changes in P450cam required for catalysis.
Figure 1.
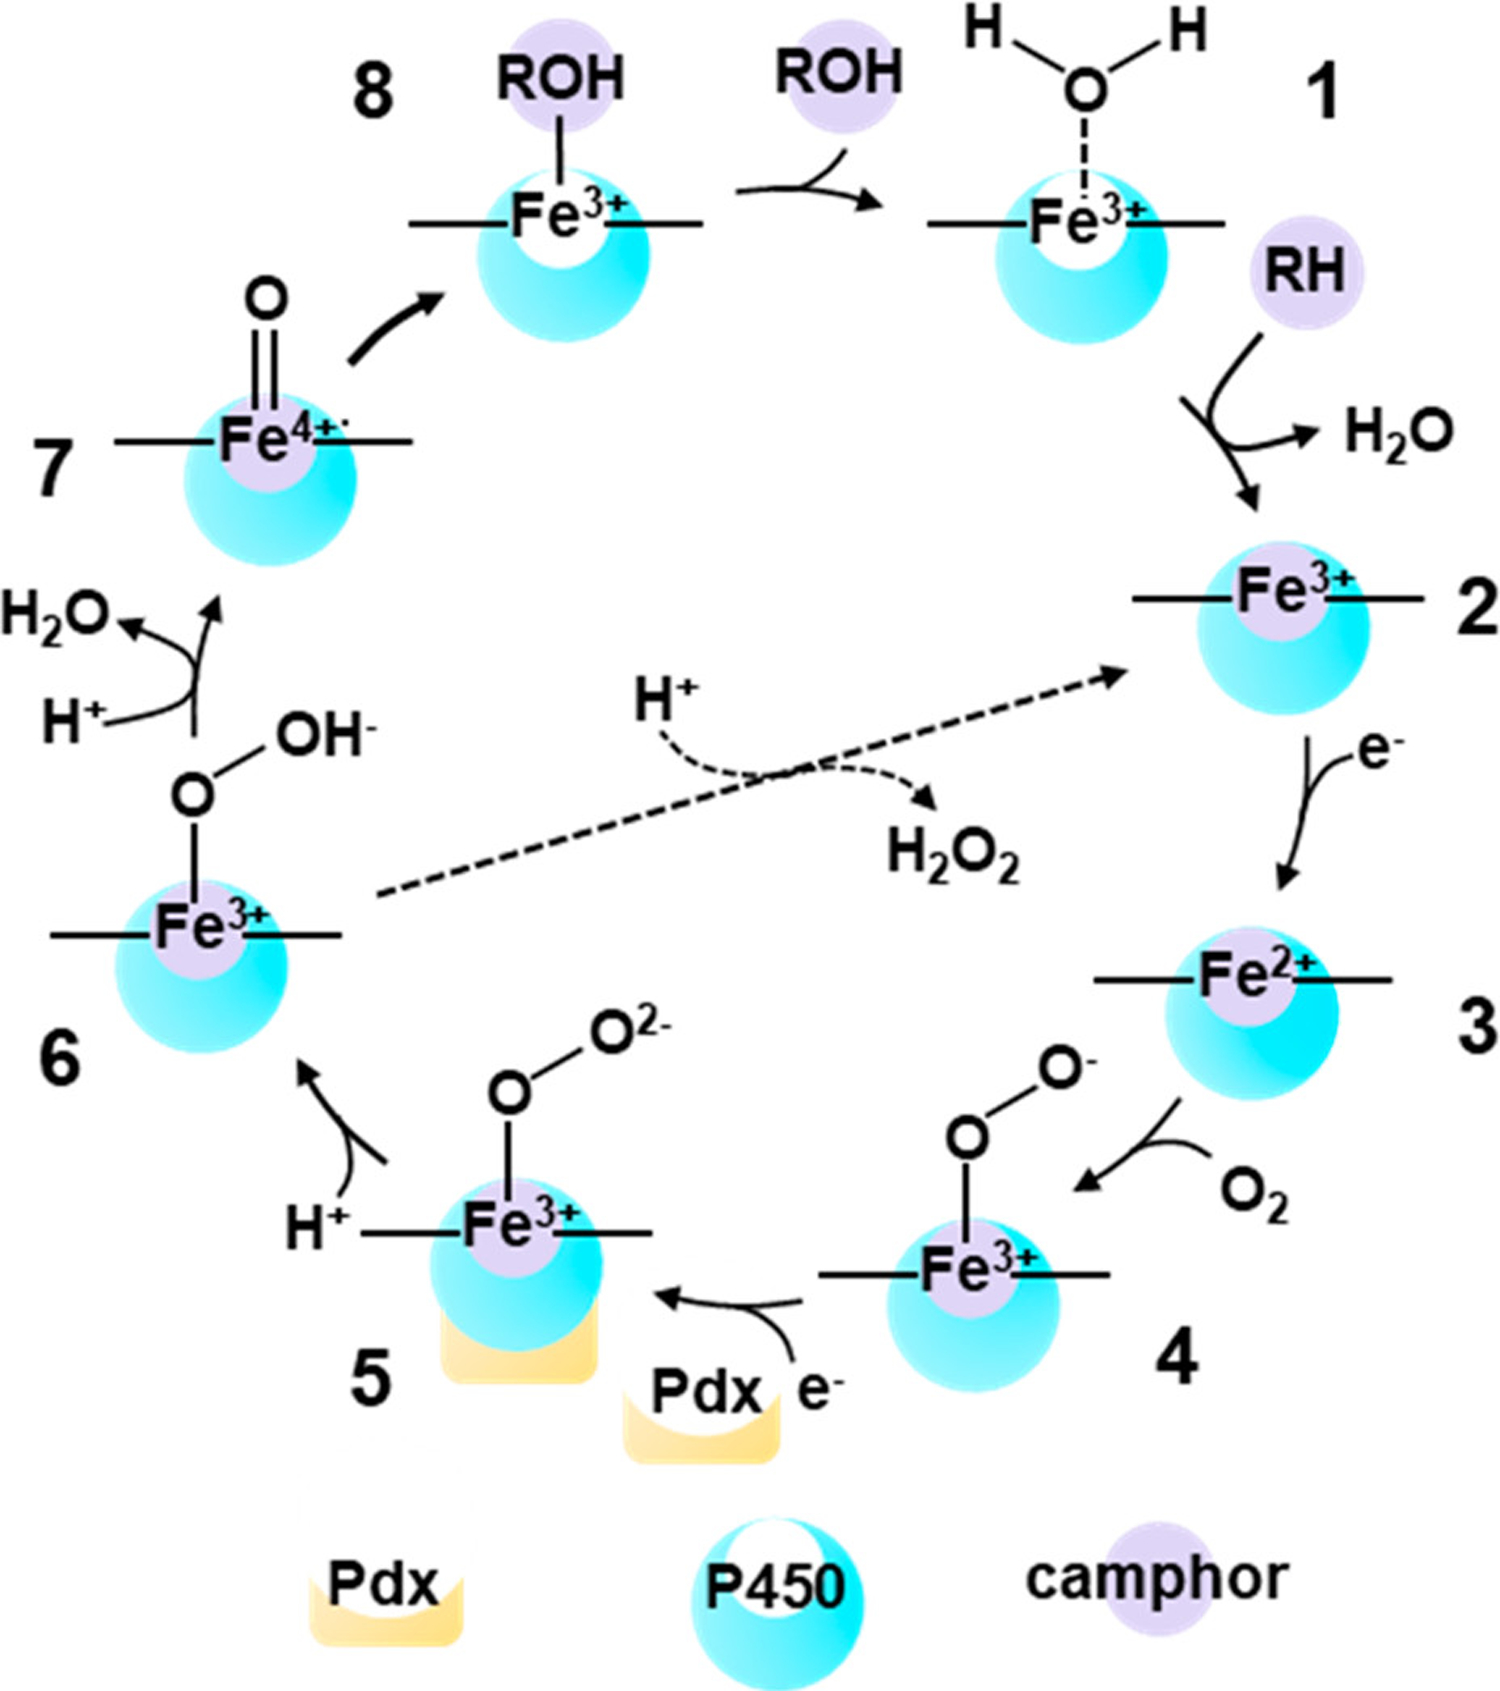
Schematic of the catalytic cycle of P450cam, illustrating camphor (purple) binding to P450cam (blue). Effector Pdx is shown in yellow.20
Interest in Pdx’s effector role has been reinvigorated in recent years, driven in part by acquisition of crystal structures of complexes of P450cam and Pdx.7–9 Crystallographic, spectroscopic, and computational studies have established that complexation with Pdx induces substantial conformational changes throughout P450cam.10–15 Early crystallographic evidence indicated that Pdx binding causes a conformational change from the “closed” state of camphor-bound enzyme toward the “open” state found in the absence of substrate.7 More recently, the crystal structure of the CN−-ligated complex with Pdx, double electron–electron resonance spectroscopy of spin labels, and molecular dynamics (MD) simulations point to P450cam adopting an intermediate state between the closed state and open states.9,13–15 A key aspect of the proposed intermediate state is the establishment of a water network for proton delivery from the protein surface to the O2 ligand (Figure 2).16,17 This network might involve two “catalytic” waters captured in the crystal structures of the O2 and cyanide (CN−)-ligated P450cam in the absence of Pdx.18,19 Establishment of such a proton delivery network in concert with reduction by Pdx would enable immediate protonation of the ferric-peroxo intermediate (5) to generate hydroperoxy intermediate (6), followed by protonation, oxygen cleavage, and release of water to generate intermediate (7), known as compound I (Figure 1). Efficient proton transfer minimizes uncoupling through shunt pathways, promoting hydroxylation of the substrate to the product.20 Although Pdx binding now has been well linked to conformational changes in P450cam, and simulations support the resulting formation of a proton delivery network,14,17 details about the mechanism of Pdx’s effector role are still being uncovered.
Figure 2.
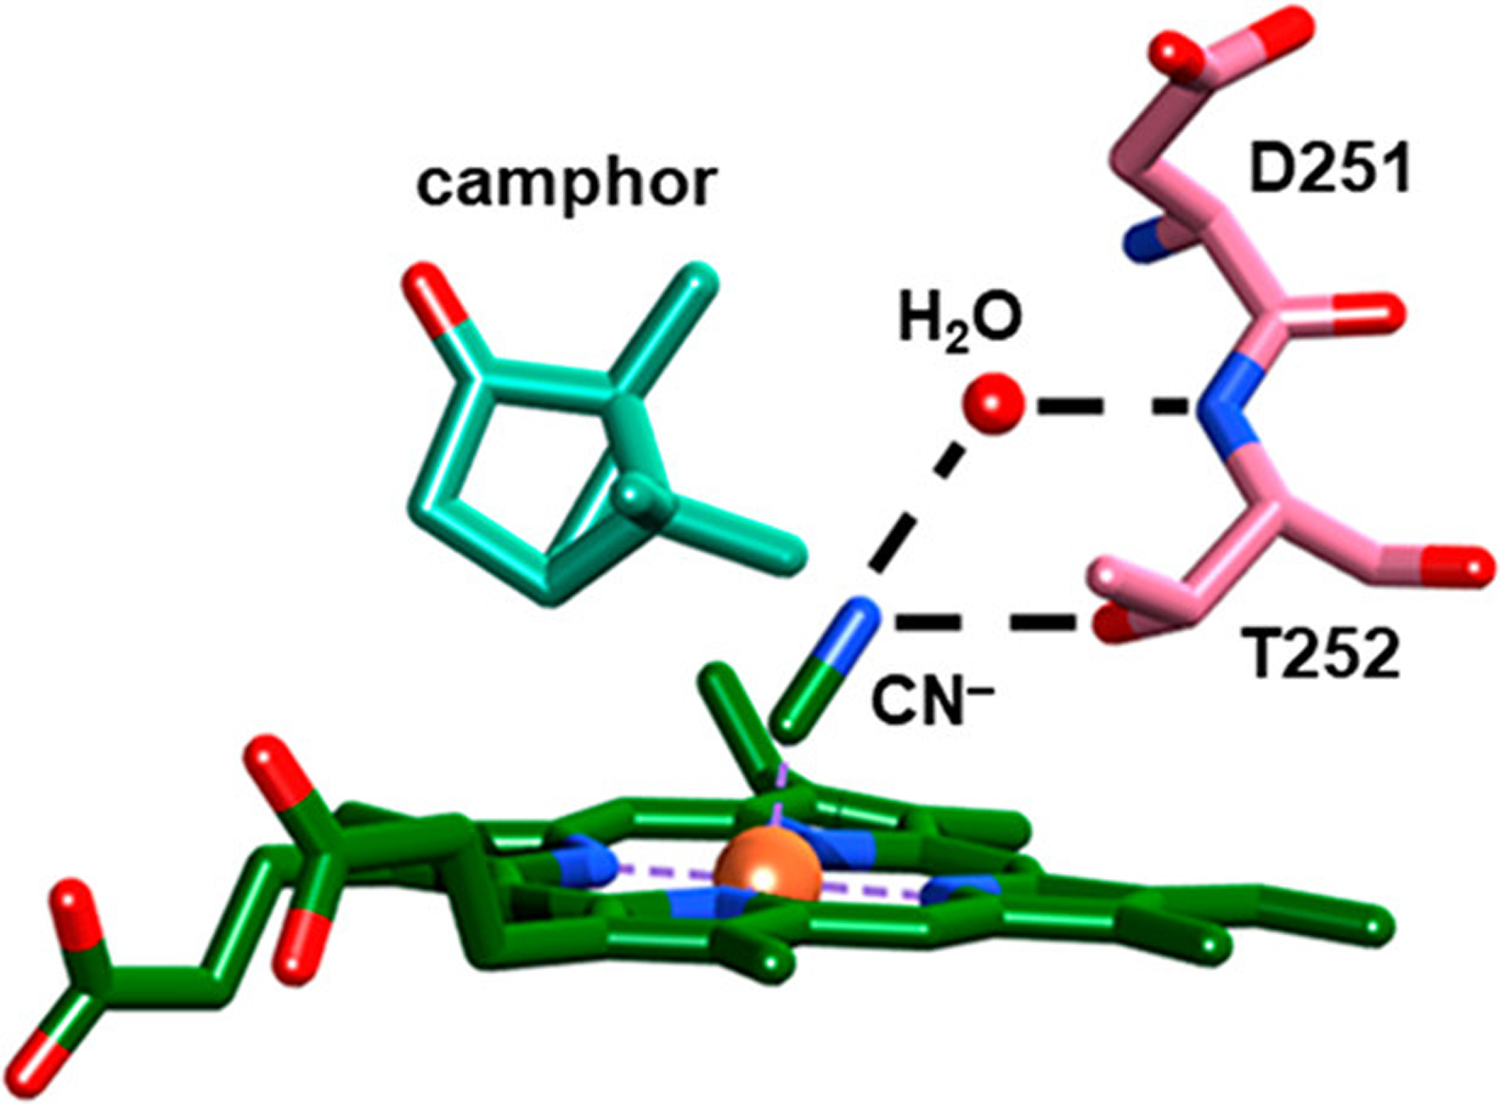
Structural model of CN−-ligated P450cam showing a hydrogen-bonding network of a solvent water molecule (red), Thr252 (pink), and the heme-ligated CN− (green); also shown are camphor (aqua) and Asp251 (pink) (PDB: 1O76).18
Toward elucidating why catalysis by P450cam requires Pdx, we applied IR spectroscopy to CN−-ligated P450cam and characterized the enzyme in the absence and presence of Pdx. As the O2-ligated complex is unstable, CN−-ligated P450cam provides an informative model for the ferric-peroxo species attributed to the ferrous O2-ligated heme of the P450cam intermediate (4) reduced by Pdx.9,18,21 The electronic structure, with the negatively charged nitrogen, and the bent geometry of CN− heme ligation model well the properties of the peroxo ligand. The CN− stretch vibration absorbs in a transparent window of protein IR spectra, enabling selective characterization of the ligand absorption to probe its interactions within the P450cam active site in each state.22–24
In addition to the wild type enzyme, we characterized P450cam mutated at Thr252 (T252A), a residue implicated in the proton delivery network.16,25–27 The hydroxyl side chain of Thr252 is located within hydrogen-bonding distance of the O2 or CN− ligand in crystal structures of the individual enzyme (Figure 2).18,19 Thr252 appears to mediate a water network to Asp251, the presumed proton source. Introduction of the mutation T252A results in uncoupling of NADH consumption from product formation due to superoxide/peroxide release in shunt pathways (Figure 1).25 However, in the absence of Thr252, the crystal structure and MD simulations of the O2 complex of T252A indicate that water molecules maintain the water network between the ligand and Asp251; thus, Thr252 does not appear critical to establishing the network.14,19
IR spectroscopy of CN−-ligated P450cam provides evidence that complexation with Pdx induces a new population of the enzyme. To help uncover the nature of the induced population, we also evaluated the effect of osmotic stress, H2O/D2O exchange, and another mutation of the enzyme, L358P, intended to perturb the proximal thiolate heme ligation. Altogether, the data support that Pdx binding leads to a population in which the CN− ligand participates in a strong hydrogen-bonding interaction to an active site water molecule. This observation experimentally corroborates the establishment of a proposed proton delivery channel as part of the mechanism underlying Pdx’s effector role. The function of the side chain of Thr252 appears to be to control the equilibrium of hydrogen-bonded populations, which could contribute to ensuring efficient coupling of electron equivalents to hydroxylation products.
MATERIALS AND METHODS
P450cam (UniProtKB - P00183) and Pdx (UniProtKB - P00259) were expressed as described previously28 using plasmids pDNC334A and pKM36, respectively (Supporting Information). Both plasmids, along with the cell line NCM533, were generously provided by Thomas Pochapsky (Brandeis University).29,30 The enzyme contains the mutation, C334A, which reduces aggregation but does not affect activity and is referred to as “wild type” (wt).31 The T252A and L358P mutations were introduced by site-directed mutagenesis (Agilent, Santa Clara, CA), which was confirmed by sequencing. Both T252A and L358P were expressed and purified via the same protocol as wt P450cam. Further experimental details about preparation and characterization are provided in Supporting Information.
Purified protein (P450cam wt: A390/A280 ≥ 1.3, P450cam T252A: A390/A280 ≥ 1.0, P450cam L358P: ≥ 1.0, Pdx: A325/A278 ≥ 0.65) was concentrated to 1.6–2.0 mM for FTIR spectroscopy in 50 mM potassium phosphate, pH 7.0, 100 mM KCl, 5 mM camphor-d, 20% glycerol. Pdx was added to ensure 95% P450cam was bound in the complex; samples contained 2.0–2.4 mM Pdx, adjusted based on P450cam concentration and KD of 24 μM.32,33 Both P450cam and Pdx were in their oxidized states. CN− was bound to P450cam by the addition from 500 mM KCN stock to a final concentration of 30 mM, of which approximately 15 mM is available in solution as CN− based on the pKa of 9.21.22 Samples were loaded between 2-mm-thick CaF2 windows separated by a 76.1 μm Teflon spacer. Spectra were collected at room temperature as described in Supporting Information.
Absorption spectra of each sample were generated using reference transmission spectra taken of the corresponding sample in the absence of added CN−. Slow baseline variation was removed from the FTIR absorbance spectra by fitting and subtracting a polynomial from the spectral regions excluding the CN− absorption bands. High frequency noise was removed from the absorbance spectra using a FT filter. Bands present at 2093 and 2079 cm−1 were assigned to free HCN and CN−, respectively, and were not included in further analysis. The corrected spectra for each sample were fit to either one or a sum of two or three Gaussian functions, and the fits were evaluated by use of second derivative spectra. Additional metrics for the evaluation of fit models (first moments, F-tests, residuals) and alternate fits are provided in Supporting Information (Table S1, Figures S3–S10). The center frequency and line width of the lower frequency band for the wt and T252A samples in D2O solvent or with added Pdx were constrained to match the absorptions of the corresponding samples with camphor in H2O solvent as noted in Table 1.
Table 1.
Parameters from Gaussian Fits to IR Spectra of CN−-Ligated P450cam
| ν (cm−1) | fwhma (cm−1) | rel. areab (%) | |
|---|---|---|---|
| wt | |||
| free | 2112.0 (0.3) | 7.4 (0.7) | 57 (7) |
| 2120.7 (0.1) | 6.7 (0.6) | 43 (7) | |
| free/sucrose | 2106.8 (0.7) | 5.3 (0.6) | 19 (4) |
| 2112.0 (0.7) | 8.4 (0.2) | 69 (5) | |
| 2120.1 (0.3) | 5.0 (0.2) | 13 (3) | |
| camphor | 2111.2 (0.3) | 6.5 (0.2) | 100 |
| cam/D2Oc | 2111.2 | 10.0 (0.5) | 86 (3) |
| 2120.0 (0.4) | 7.0 (1) | 14 (3) | |
| cam/Pdxd | 2111.2 | 6.5 | 65 (9) |
| 2114.5 (0.9) | 6.0 (1.0) | 35 (9) | |
| cam/Pdx/D2Od | 2111.2 | 6.5 | 73 (2) |
| 2115.7 (0.4) | 6.6 (0.1) | 27 (2) | |
| T252A | |||
| free | 2112.7 (0.2) | 7.4 (0.2) | 48 (5) |
| 2120.1 (0.8) | 6.7 (0.6) | 52 (5) | |
| camphor | 2110.6 (0.2) | 6.1 (0.3) | 100 |
| cam/D2Od | 2110.6 | 6.1 | 56 (6) |
| 2115.6 (0.3) | 8.0 (0.1) | 44 (6) | |
| cam/Pdxd | 2110.6 | 6.1 | 27 (5) |
| 2113.8 (0.3) | 7.4 (0.1) | 73 (5) | |
| cam/Pdx/D2Od | 2110.6 | 6.1 | 11 (9) |
| 2114.3 (0.2) | 8.0 (0.2) | 89 (9) | |
| L358P | |||
| camphor | 2112.0 (0.1) | 6.4 (0.1) | 86 (1) |
| 2123.8 (0.1) | 3.3 (0.1) | 4 (1) | |
| 2127.0 (0.3) | 4.6 (0.1) | 10 (1) | |
| cam/D2O | 2111.8 (0.1) | 7.1 (0.3) | 92 (1) |
| 2123.6 (0.2) | 2.6 (0.1) | 2 (1) | |
| 2126.0 (0.4) | 3.7 (0.4) | 6 (1) | |
Full-width-at-half-maximum.
Relative band area.
Frequency or
frequency and fwhm of low frequency component fixed to camphor-bound enzyme. Standard deviations from triplicate analyses provided in parentheses.
RESULTS
The FTIR spectra of all CN−-ligated P450cam samples show absorptions around 2110–2120 cm−1 (Figures 3, 4, and 5). The CN− frequency increases from 2079/2093 cm−1 of CN−/HCN upon binding ferric heme proteins as a result of donation of electron density from the σCN* orbital to the heme Fe(III).34 As expected, the frequency of CN− is higher upon ligation of P450cam, although it is comparably lower than ~2120–2130 cm−1 observed for CN− ligated to other ferric heme proteins.23,24,34 The heme proteins under investigation in these prior studies have histidine imidazole proximal ligands, as opposed to the thiolate cysteine ligand of P450cam. The greater basicity of the thiolate than imidazole is expected to reduce electron donation to the Fe(III) by the CN− ligand, consistent with the lower frequency when ligated to P450cam.
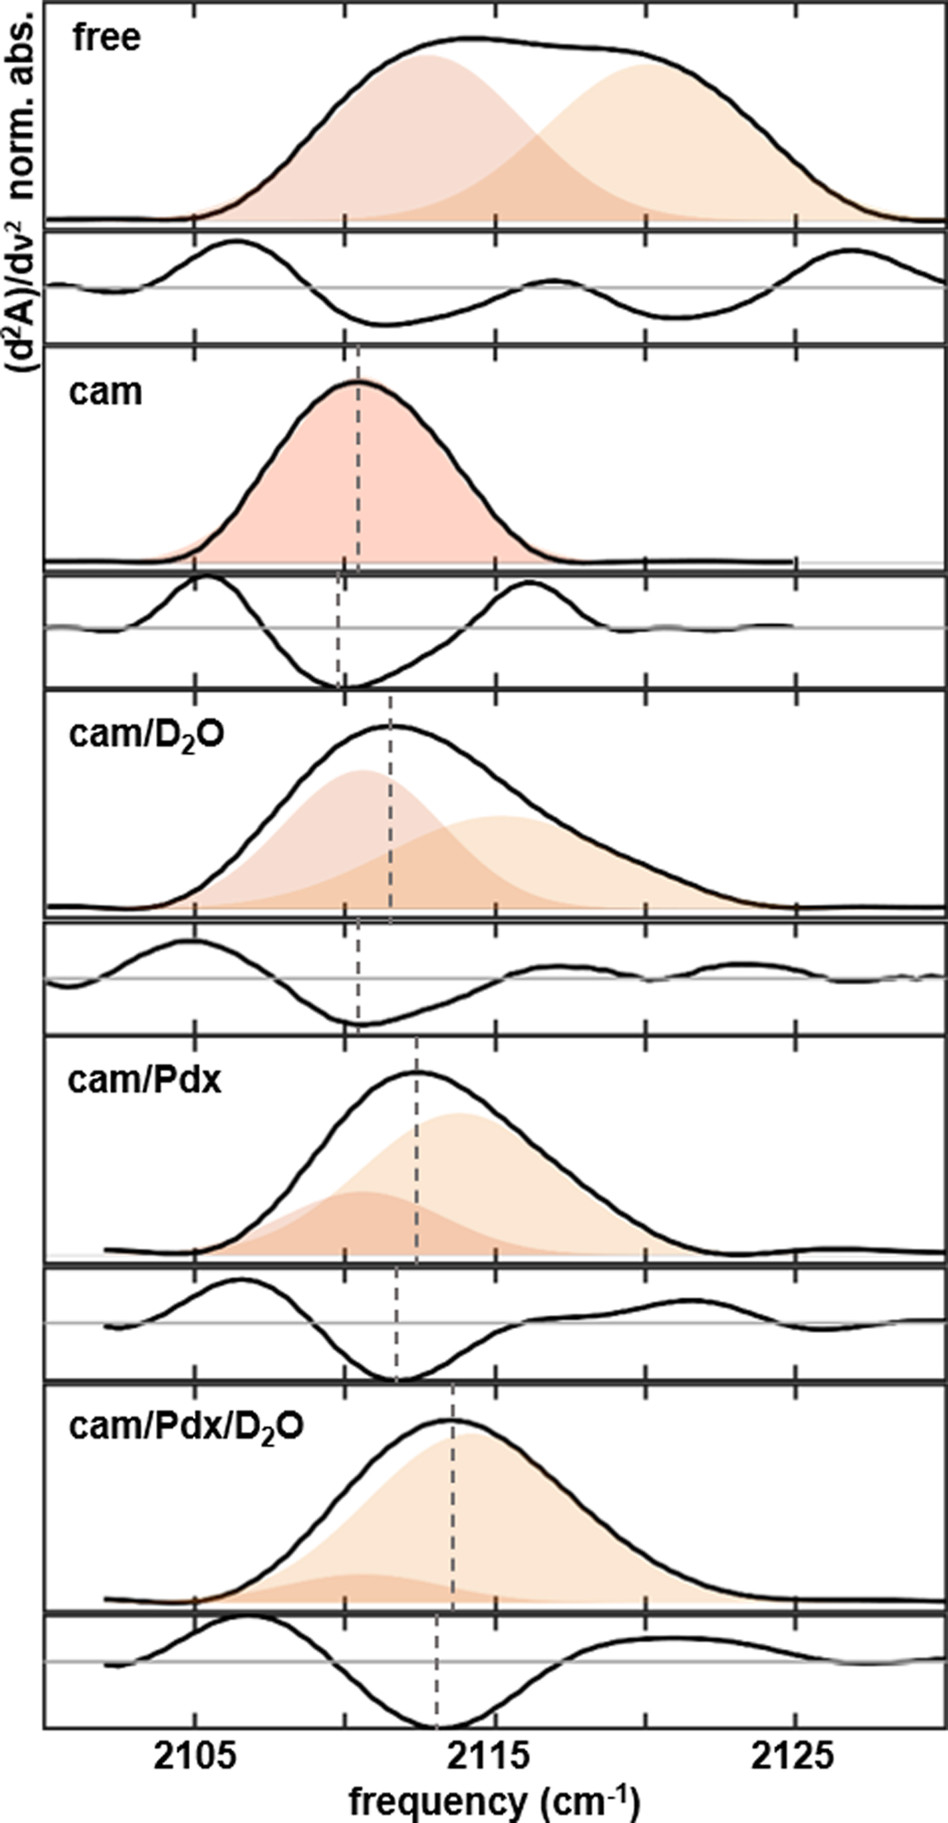
Figure 3.
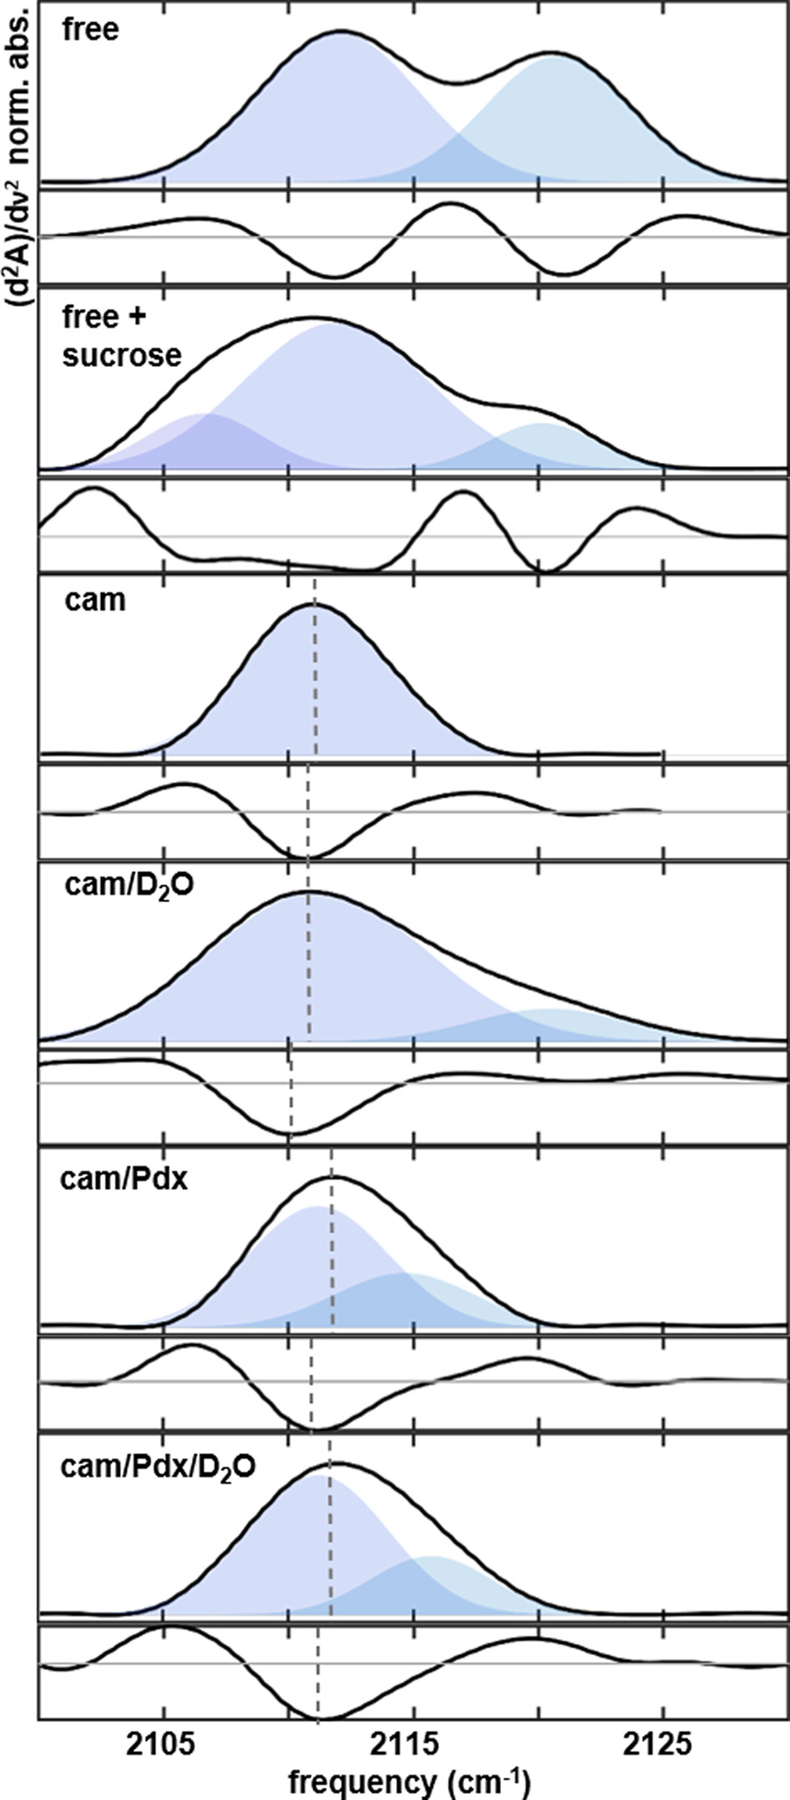
FTIR spectra (corresponding second derivative spectra shown below) of heme-ligated CN− for wt P450cam: (A) substrate-free, (B) substrate-free with sucrose, (C) camphor complex, (D) camphor complex in D2O solvent, (E) complex with camphor and Pdx, (F) complex with camphor and Pdx in D2O solvent. Vertical lines mark the maximum of each absorption or minimum of each second derivative spectrum.
Figure 4.
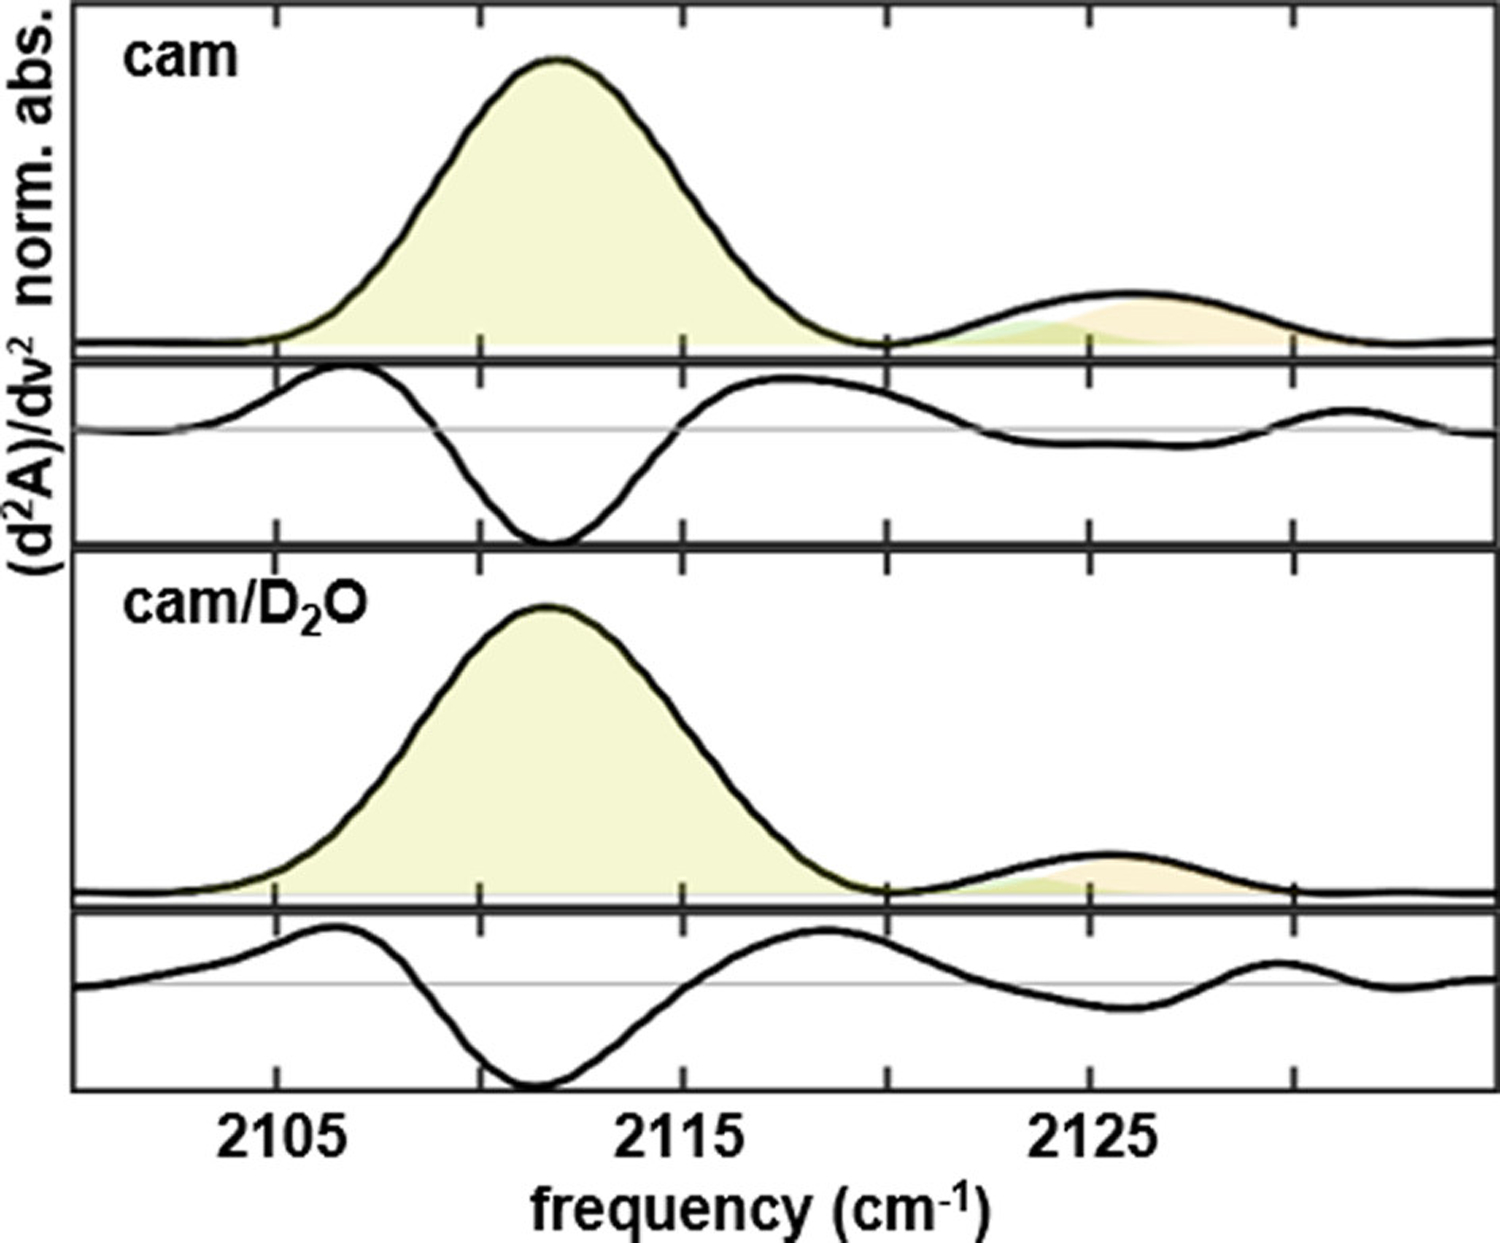
FTIR spectra (corresponding second derivative spectra shown below) of heme-ligated CN− for L358P P450cam camphor complex in (A) H2O and (B) D2O solvent.
Figure 5.
FTIR spectra (corresponding second derivative spectra shown below) of heme-ligated CN− for T252A P450cam: (A) substrate-free, (B) camphor complex, (C) camphor complex in D2O solvent, (D) complex with camphor and Pdx, (E) complex with camphor and Pdx in D2O solvent. Vertical lines mark the maximum of each absorption or minimum of each second derivative spectrum.
Comparison of Substrate-free and Camphor Complex.
We first compared the vibration of CN− ligated to P450cam in the absence of Pdx in well-studied states: substrate-free P450cam and P450cam in complex with its native substrate, camphor. The spectrum of substrate-free shows two bands of approximately equal area centered at 2112.0 and 2120.7 cm−1 (Figure 3A, Table 1). The presence of multiple bands indicates two populations. In contrast, the spectrum of the camphor complex shows a single Gaussian band at 2111.2 cm−1 (Figure 3C, Table 1), indicating stabilization to a single state upon substrate binding. The similar frequency of the band at lower frequency for substrate-free and that of the camphor complex suggests the CN− experiences similar environments in the corresponding states. The higher frequency of the second band appearing for substrate-free could arise from either a Stark effect from electrostatic interactions with the surroundings or bonding interactions with either the heme Fe(III) or a hydrogen (H)-bond donor. A stronger interaction with Fe(III) or a hydrogen-bonding donor would promote electron withdrawal from the σCN* orbital and increase the vibrational frequency. Another possible interpretation for the two bands are bent and linear geometries of the CN− ligation, as assigned for two vibrational bands observed previously by resonance Raman spectroscopy.21 However, two Raman bands were observed for the camphor complex as well as the substrate-free. In contrast to the Raman spectra, a single IR band is observed for the camphor complex, so we conclude that bands corresponding to bent or linear coordination are not resolved in the IR spectrum.
To assess the contribution of the proximal ligation of the heme Fe(III) to differentiating the CN− absorptions, we characterized the CN− ligated camphor complex of L358P P450cam (L358P). The backbone amide of L358 is directed to stabilize the negative charge on the cysteine thiolate ligand of the heme. Disruption of this electron-withdrawing interaction by L358P is expected to enhance electron donation from the sulfur to Fe(III) and concomitantly disfavor electron donation from the σCN* orbital. Thus, electronic structure considerations predict a lower CN− frequency for L358P. In contrast to this prediction, the spectrum of CN−-ligated L358P shows a major band with the same center frequency and line width as the wt enzyme and additional absorbance with ~15% relative area at higher frequency. The additional absorbance fits to a superposition of bands at 2123.8 and 2127.0 cm−1 (Figure 4A, Table 1). The minimal perturbation of L358P and the appearance of new bands, as opposed to an overall band shift, indicates that the spectral changes do not primarily reflect the change in thiolate ligation, but rather L358P stabilizes new populations of the enzyme. Consistent with this conclusion, the crystal structure of carbon monoxide-ligated L358P P450cam shows electron density for two conformational states differentiated by occupancy of two water molecules in the distal heme pocket and the conformations of the side chains of Thr252 and Asp251.35,36 L358P enables catalysis of camphor hydroxylation with small molecule reductants, supporting that the structural changes are relevant to Pdx’s effector role.36–38
Since the CN− frequency variation does not primarily reflect the thiolate ligation, the higher frequency of the bands observed for L358P and analogously for wt substrate-free likely arise from interactions of CN− within the distal pocket. An alternate origin of the band at higher frequency (2120.7 cm−1) that agrees with the picture generated from a number of crystallographic and spectroscopic studies is hydrogen bonding to water molecules in the active site.9,13,39,40 Binding camphor induces a conformational change of P450cam from a population of an “open” to a “closed” conformational state in which a helix–loop–helix motif (F/G helices) clamps down over the active site, dispelling solvent.6,39,41,42 Disruption of hydrogen bonding to water would account for the disappearance of the band at a higher frequency for the camphor complex. Whether the band found at lower frequency that is common to substrate-free and the camphor complex reflects a weakly or non-hydrogen-bonded state is less apparent. Although substantial evidence indicates that the active site is desolvated in the camphor complex of the wt enzyme,6,39–41 water molecules are found within the active site in the crystal structure of CN−-ligated P450cam.18 In either case, the higher frequency of the band at 2120.7 cm−1 is consistent with an enzyme population in which the CN− participates in a relatively strong hydrogen bond.
We further assessed this interpretation by subjecting the CN−-ligated substrate-free enzyme to osmotic stress. Addition of sucrose and other small molecule osmolytes to solutions of P450cam leads to perturbation of the spin-state equilibrium of the heme, attributed to dehydration of the active site.43 We thus characterized substrate-free P450cam in a solution of 33% by weight sucrose, a condition under which the enzyme is expected to be partially dehydrated. The spectrum obtained in the sucrose solution shows a complex absorption envelope that is well modeled by a superposition of three bands (Figure 3B). Two of the bands have the same frequency (~2112 and 2120 cm−1) as found in the absence of the osmolyte. A third band appears at a lower frequency (~2107 cm−1) in the presence of sucrose. The key observation is that the relative area of the band at the highest frequency of ~2120 cm−1 decreases, while the band at the lowest frequency appears upon dehydrating P450cam. These observations motivate the assignment of the bands to populations of the CN− ligand participating in varying hydrogen-bond interactions with active site water molecules. We assign the band at the highest frequency to a population in which the CN− ligand is strongly hydrogen bonded or hydrogen bonded with two donors, the band at intermediate frequency to a population weakly hydrogen bonded, and the band at the lowest frequency to a noninteracting population.
Mutation of Thr252.
To investigate the contribution of Thr252 in the mechanism of Pdx’s effector role, we prepared T252A P450cam and characterized the CN−-ligated enzyme by FTIR spectroscopy. We first compared the substrate-free enzyme and the complex with camphor (Figure 5A,B, Table 1). In comparison to the CN− vibrations for the wt enzyme, mutation results in little change to the spectrum of either the substrate-free enzyme or the camphor complex. The CN− ligand of substrate-free T252A, similarly as wt, clearly shows two absorption bands (Figure 5A). The center frequencies of 2112.7 or 2120.1 cm−1 are nearly the same as observed for wt (Table 1). Analogously, we assign the bands at a lower and higher frequency, respectively, to weakly hydrogen-bonded and strongly hydrogen-bonded states of the CN−. The relative band areas for the wt and T252A are the same within error, indicating no difference in the relative populations. The presence of the upshifted band (~2120 cm−1) for substrate-free T252A argues that the band for wild type likewise does not correspond to the CN− directly forming a hydrogen bond with Thr252 but rather points to interaction with a water molecule.
For the camphor complex of T252A, the spectrum shows a single Gaussian band centered at 2110.6 cm−1, only slightly downshifted (0.6 cm−1) from wt (Figure 5B). In agreement, Raman spectroscopy finds no change to the Fe–S vibration due to the mutation, suggesting the heme ligation is unaffected.44 The insensitivity of the CN− vibration to removal of the hydroxyl side chain of Thr252 argues that the residue does not form a direct hydrogen bond to the CN− in the camphor complex as in the substrate-free. However, it is possible that a hydrogen bond is present between CN− and T252 in the wt enzyme, but a water molecule replaces the interaction in the mutated enzyme, resulting in little apparent change to the spectrum from T252A. The crystal structures of O2-ligated wt and T252A P450cam show that two water molecules occupy the active site.19 T252A does not appear to perturb the water structure.
Impact of D2O Exchange.
To further evaluate our assignment of the bands, we analyzed the camphor complexes of individual P450cam in D2O solvent. D2O forms stronger hydrogen bonds than H2O, so sensitivity of an absorption band to H2O/D2O exchange provides support that the band reflects a hydrogen bonded state.45 The spectra for both wt and T252A in D2O solvent show absorptions with shoulders at a higher frequency and fit best to a superposition of two Gaussian bands (Figures 3D, 5C, Figure S6). The second derivative spectra support modeling with two components. Second derivative spectra highlight inversion of curvature in a spectrum and, for a single Gaussian component, should have an amplitude minimum at the frequency of maximum absorption flanked symmetrically in frequency by two maxima of equal amplitude (e.g., as found for the camphor complexes in H2O, lower panels Figures 3C and 5B). Contrary to these expectations, the second derivative spectra for samples in D2O show minima slightly downshifted from the maxima of the absorbance spectra, diminished relative amplitude of the maximum at higher frequency, and a second small minimum at higher frequency (lower panels, Figures 3D and 5C). The presence of two bands is further supported by deviation between the frequencies of the absorbance maximum and the spectral first moments (Table S1). In addition, both spectra are well modeled when the component bands at lower frequency are fixed in frequency to those of the corresponding bands in H2O. However, when the line width is fixed, the fit for the spectrum of wt is not satisfactory (Figure S10).
The appearance of the bands at a higher frequency for both wt and T252A upon exchange to D2O solvent, which is expected to form stronger hydrogen bonds, further supports the assignment of bands at such higher frequencies to population of strongly hydrogen-bonded CN−.45 For wt, the line width of the band at a lower frequency associated with weak hydrogen bonding is broader for the sample in D2O, suggesting greater heterogeneity of interactions between the CN− and environment from disorder present in the active site. This might indicate D2O exchange slightly perturbs P450cam structural rigidity. Notably, exchange to D2O solvent has been shown to cause some decoupling in the P450cam proton relay, reducing the efficiency of substrate hydroxylation.46 For T252A, the band induced by H2O/D2O exchange is lower in frequency but greater in area than found for wt. Thus, removal of the side chain of Thr252 promotes the population of the species corresponding to the higher frequency band. This further supports the interpretation of this band to a population of CN− that forms a relatively strong hydrogen bond with a molecule of H2O/D2O.
Characterization of Individual Pdx.
Prior to analysis of the complex between Pdx and P450cam, Pdx was individually characterized in the presence of 15 mM CN−. Unexpectedly, an absorption band was observed at 2039 cm−1 (Figure S11). This band is well resolved from those of CN− ligated to ferric P450cam. However, the band overlaps with that expected for ferrous P450cam, preventing comparison of the two redox states. The visible spectrum of the CN−-ligated P450cam/Pdx complex was examined to confirm that P450cam and Pdx were both in the oxidized state (Figure S2). In our attempt to characterize the Pdx-CN− complex, spectrophotometric titrations of CN− and Pdx were conducted to determine the binding constant (KD). The KD was found to be ~2.2 mM (Figure S12), nearly identical to the KD of 2 mM for CN− and P450cam,47 negating the possibility for selective ligation of CN− to P450cam.
While the observation of a band at 2039 cm−1 for Pdx in the presence of CN− was unexpected, the binding of CN− to ferredoxins is not unprecedented.48,49 As reported by prior studies of spinach ferredoxin and Clostridium acidiurici sulfur ferredoxin, we observe bleaching of the Pdx visible spectrum upon titration with CN− (Figure S11).48,49 However, a number of previous studies by crystallography, NMR, and EPR spectroscopy have been reported for the complex of Pdx and CN−-ligated P450cam,9,13,50 which is currently considered the best model for the physiological ferric-peroxo intermediate. Evidence for CN− binding to Pdx has not been previously noted. The implications of CN− binding to Pdx are not fully known and could affect interaction with P450cam or the efficacy of the effector role; however, the samples of CN−-ligated P450cam analyzed here by FTIR spectroscopy and in prior investigations are comparable.
Complex of P450cam and Pdx.
In the presence of Pdx, the spectrum of CN−-ligated P450cam shows an absorbance maximum at ~2113 cm−1 (Figure 3E), upshifted several cm−1 relative to the individual enzyme (Figure 3C). The absorbance systematically deviates from a symmetrical Gaussian profile for replicate spectra of samples, suggesting multiple overlapping bands (Figure S9). The second derivative spectrum adds support for a two-component model. The minimum of the second derivative spectrum is downshifted from the maximum of the absorbance spectrum, the maximum in the second derivative spectrum at higher frequency is upshifted relative to the individual enzyme, and a slight depression suggesting a second minimum appears at a higher frequency (~2116 cm−1). The frequency of the absorbance maximum also deviates from the spectral first moments (Table S1). The spectrum is well modeled by a superposition of a band with the same frequency and line width as found for the individual enzyme, indicating a population of a similar state, and a second band at a higher frequency. The relative areas of the two bands suggest the new state in the presence of Pdx makes up ~35% of the ensemble population. We note however that direct comparison of band areas to estimate relative population relies on the assumption that the CN− probe has an equal transition dipole strength in each state, which we cannot empirically determine by these methods.
On the basis of our characterization of individual P450cam, we assign the new band at a higher frequency to a strongly hydrogen-bonded population of CN−. We assessed this assignment by characterization of the P450cam-Pdx complex in D2O solvent. Analysis of the spectrum in D2O, like H2O, supports two overlapping bands. The relative areas of the bands show no change, indicating that the population of the states, or relative free energies, are unaffected by solvent exchange. However, a small increase in frequency is found for the band at a higher frequency. This is consistent with formation of a stronger hydrogen-bond interaction with a deuterated donor.
Complex of T252A P450cam and Pdx.
To investigate the involvement of Thr252 in the changes induced by Pdx binding, we characterized the CN− ligand of the camphor complex of T252A P450cam in the presence of Pdx (Figure 5D). Analysis of the IR spectra for the T252A complex yields a band at a lower frequency equivalent to that of the individual enzyme (2110.6 cm−1) and a second band at a higher frequency (2113.8 cm−1) (Table 1), similarly as found for the wt complex with Pdx. The frequency of the induced band is the same within error for the complexes with T252A and wt P450cam, suggesting the band similarly corresponds to a strongly hydrogen-bonded species. However, the relative area of ~73% is much larger for T252A than wt. Thus, elimination of Thr252 promotes population of the strongly hydrogen-bonded state of CN−. The growth rather than disappearance of the band at a higher frequency upon removal of the side chain of Thr252 suggests that the strongly hydrogen-bonded state does not directly involve the hydroxyl group of Thr252, implicating a water molecule as the hydrogen-bond donor. Moreover, removal of the bulky side chain of Thr252 in T252A should create space for occupancy of water molecules, and active site water is found in the crystal structure of T252A P450cam.19 We note, however, that our IR analysis of the CN− ligand in the solution state of P450cam finds that T252A promotes the strongly hydrogen-bonded species only for the Pdx complex, not the individual enzyme. This observation is consistent with the proposed opening of the active site upon association with Pdx.7,9,10,13
The assignment of the bands for the T252A complex with Pdx was further assessed via H2O/D2O exchange. Consistent with other samples of the Pdx complex, the IR spectra are well modeled by two bands, with the component at low frequency fixed in frequency and line width to the band for the individual enzyme (Figure 5E, Table 1). The frequency is slightly greater in D2O, consistent with stronger hydrogen-bonding. For T252A, unlike wt, the band at a higher frequency also increases in relative area in D2O, showing the greatest intensity of all characterized samples. The hydrogen-bonded state is stabilized in D2O to comprise nearly 90% of the total ensemble population.
DISCUSSION
We applied FT IR spectroscopy toward understanding the effector role of Pdx in the catalytic cycle of P450cam. We analyzed the CN− vibration of CN−-ligated P450cam, considered the best stable model for the ferric-peroxo state proposed for the O2 complex of P450cam prior to the second reduction by Pdx. Altogether, the data indicate that association of Pdx with P450cam leads to ~35% population of a new state in which the CN− ligand is strongly hydrogen-bonded to an active site water molecule.
IR spectroscopy provides insight into the ensemble of solution populations of P450cam in complex with Pdx to augment the developing model for the mechanism underlying Pdx’s effector role. A prevailing model from a number of experimental and computational studies suggests association with Pdx induces a conformational state of P450cam intermediate between the closed and open states.7,9,10,15,17,51–54 The F/G loop that covers the active site transitions toward the open state.15 This conformational change is coupled to weakening or disruption of a salt bridge involving residue Asp251, which would free the side chain to participate in the proton delivery network (Figure 2).32 Supporting this model is a recently reported crystal structure of the complex of CN−-ligated P450cam and Pdx that indicates population of a rotamer of Asp251 where the side chain is positioned to relay protons between two water molecules, one in a hydrogen bond to the CN− ligand.9 The establishment of such an intraprotein proton relay network would enable proton-coupled electron transfer to efficiently couple the electrons into product formation.17 Consistent with this model, the IR spectroscopy indicates that Pdx binding to P450cam induces ~35% population strongly hydrogen bonded to an active site water molecule. This interaction is likely to contribute to the establishment of the proton delivery network that underlies the mechanism of Pdx’s effector role.
The similarity of the spectra for samples of individual wt and T252A suggests the strong hydrogen bonding of the CN− ligand involves a water molecule, rather than directly with the hydroxyl side chain of Thr252. However, we found that in the complex with Pdx the mutation T252A promotes the population of strongly hydrogen-bonded CN−, likely due to the removal of the bulky side chain to open up space for a water molecule or of the competing hydroxyl hydrogen-bond partner. Crystal structures of O2-ligated P450cam show evidence for occupancy of two water molecules within the active sites of both wt and T252A,32 indicating that Thr252 is not required to establish the water structure. The IR analysis in this study is in agreement with this conclusion. However, the observed changes to the relative band areas in the spectrum for the P450cam/Pdx complex upon introduction of T252A argue that the side chain plays a role in controlling the ensemble populations weakly versus strongly hydrogen-bonded to water molecule(s). This function could contribute to the reason that T252A leads to uncoupling of the catalytic cycle via promotion of a shunt pathway that outputs peroxide (Figure 1). The side chain could serve to limit access to or direct orientation of water molecules with the heme ligand, ensuring an efficient but precise proton delivery network to the surface.
The coappearance of two bands in the P450cam/Pdx complex indicates an ensemble with only partial population of the strongly hydrogen-bonded CN−. The induced state is in equilibrium with a weakly bonded state similar to that found in closed P450cam; thus, the states have similar free energies and are separated by a barrier kinetically surmountable at room temperature. One possibility is that the weakly and strongly hydrogen-bonded states reflect copopulation of a loosely associated encounter and tightly associated specific complex of P450cam and Pdx, as are commonly formed by complexes of electron transfer proteins.55 Prior NMR spectroscopy of the complex found evidence for copopulation of a minor state in which Pdx samples an alternate region of P450cam that was attributed to an encounter complex.56 We also note that we found evidence for CN− binding by Pdx. CN− ligation of Pdx or P450cam could weaken the proteins’ affinity, leading to greater population of noncomplexed P450cam in the samples than the <5% calculated by the KD for the unligated proteins. However, T252A, despite being located within the enzyme core, promotes the strongly hydrogen-bonded state, arguing the states do not reflect the global binding equilibrium. Nonetheless, IR analysis uncovers the existence of the two states of the heme ligand of similar energy differentiated by CN− ligand hydrogen bonding. The study argues that regulation of the delicate equilibrium of these states underlies the mechanism of Pdx’s effector function, as well as the functional role of Thr252 in minimizing reaction uncoupling.
CONCLUSION
IR spectroscopy of CN−-ligated P450cam, a model of the ferric-peroxo intermediate prior to the second reduction, shows that association with Pdx induces a new population of the CN−. The impacts from increased osmotic pressure, H2O/D2O exchange, and mutations L358P and T252A argue assignment of the Pdx-induced state to a population of CN− participating in a strong hydrogen bond with a water molecule. Thus, the IR data provide evidence for the induction of CN−–water hydrogen bonding in the intermediate conformation of P450cam proposed adopted in the complex with Pdx. The hydrogen bond between the CN− ligand and water molecule is expected to contribute to establishing an intraprotein proton relay network that would support proton-coupled electron transfer. In addition to buttressing this model, the IR analysis further develops the description of P450cam in complex with Pdx as an equilibrium ensemble of two states. Thr252 plays a role in controlling the equilibrium, possibly preventing reaction decoupling to shunt pathways. In summary, this study indicates that Pdx’s effector role arises from inducing a shift in the ensemble to establish the intraprotein proton network involving a water molecule directed in a strong hydrogen bond to the O2 heme ligand, setting up efficient and faithful proton transfer in concert with the second reduction to minimize uncoupling and promote catalysis toward product formation.
Supplementary Material
ACKNOWLEDGMENTS
The authors are grateful to Thomas C. Pochapsky for providing expression plasmids, cell lines, and helpful advice for protein purification. Molecular graphics were produced with the UCSF Chimera package. Chimera is developed by the Resource for Biocomputing, Visualization, and Informatics at the University of California, San Francisco (supported by NIGMS P41-GM103311).
Funding
This work was supported by NIH Grant R01-GM114500 to M.C.T. C.C.M. was supported in part by the Department of Energy (DE-FOA-0000751), and S.R. acknowledges the Indiana University Quantitative Chemical Biology training grant (T32 GM109825) for support.
ABBREVIATIONS
- P450cam
cytochrome P450cam
- Pdx
putidaredoxin
- CN−
cyanide
- T252A
cytochrome P450cam T252A
- FTIR
Fourier transform infrared spectroscopy
- L358P
cytochrome P450cam L358P
- wt
wild-type cytochrome P450cam
Footnotes
The authors declare no competing financial interest.
ASSOCIATED CONTENT
Supporting Information
The Supporting Information is available free of charge at https://pubs.acs.org/doi/10.1021/acs.biochem.1c00075.
Additional information on protein expression and purification, FTIR analysis and justification of Gaussian fits, and spectra of Pdx-CN (PDF)
Contributor Information
Claire C. Mammoser, Department of Chemistry, Indiana University, Bloomington, Indiana 47405, United States.
Sashary Ramos, Department of Chemistry, Indiana University, Bloomington, Indiana 47405, United States.
Megan C. Thielges, Department of Chemistry, Indiana University, Bloomington, Indiana 47405, United States.
REFERENCES
- (1).Denisov IG, Makris TM, Sligar SG, and Schlichting I (2005) Structure and Chemistry of Cytochrome P450. Chem. Rev. 105, 2253–2277. [DOI] [PubMed] [Google Scholar]
- (2).Shaik S, Cohen S, Wang Y, Chen H, Kumar D, and Thiel W (2010) P450 Enzymes: Their Structure, Reactivity, and Selectivity Modeled by QM/MM Calculations. Chem. Rev. 110, 949–1017. [DOI] [PubMed] [Google Scholar]
- (3).Poulos TL (2014) Heme Enzyme Structure and Function. Chem. Rev. 114, 3919–3962. [DOI] [PMC free article] [PubMed] [Google Scholar]
- (4).Ortiz de Montellano PR, Ed. (2015) Cytochrome P450: Structure, Mechanism, and Biochemistry, 4th ed., Springer International Publishing, New York. [Google Scholar]
- (5).Tyson CA, Lipscomb JD, and Gunsalus IC (1972) The Roles of Putidaredoxin and P450cam in Methylene Hydroxylation. J. Biol. Chem. 247, 5777–5784. [PubMed] [Google Scholar]
- (6).Poulos TL, and Johnson EF (2015) Structures of Cytochrome P450 Enzymes, in Cytochrome P450: Structure, Mechanism, and Biochemistry (Ortiz de Montellano PR, Ed.) 4th ed., pp 3–32, Springer International Publishing, New York. [Google Scholar]
- (7).Tripathi S, Li H, and Poulos TL (2013) Structural Basis for Effector Control and Redox Partner Recognition in Cytochrome P450. Science 340 (20), 1227–1230. [DOI] [PubMed] [Google Scholar]
- (8).Hiruma Y, Hass MA, Kikui Y, Liu WM, Olmez B, Skinner SP, Blok A, Kloosterman A, Koteishi H, Lohr F, Schwalbe H, Nojiri M, and Ubbink M (2013) The Structure of the Cytochrome P450cam-Putidaredoxin Complex Determined by Paramagnetic NMR Spectroscopy and Crystallography. J. Mol. Biol. 425, 4353–4365. [DOI] [PubMed] [Google Scholar]
- (9).Follmer AH, Tripathi S, and Poulos TL (2019) Ligand and Redox Partner Binding Generates a New Conformational State in Cytochrome P450cam (CYP101A1). J. Am. Chem. Soc. 141, 2678–2683. [DOI] [PMC free article] [PubMed] [Google Scholar]
- (10).Liou SH, Mahomed M, Lee YT, and Goodin DB (2016) Effector Roles of Putidaredoxin on Cytochrome P450cam Conformational States. J. Am. Chem. Soc. 138, 10163–10172. [DOI] [PubMed] [Google Scholar]
- (11).Liou SH, Myers WK, Oswald JD, Britt RD, and Goodin DB (2017) Putidaredoxin Binds to the Same Site on Cytochrome P450cam in the Open and Closed Conformation. Biochemistry 56, 4371–4378. [DOI] [PubMed] [Google Scholar]
- (12).Batabyal D, Richards LS, and Poulos TL (2017) Effect of Redox Partner Binding on Cytochrome P450 Conformational Dynamics. J. Am. Chem. Soc. 139, 13193–13199. [DOI] [PMC free article] [PubMed] [Google Scholar]
- (13).Chuo S-W, Wang L-P, Britt RD, and Goodin DB (2019) An Intermediate Conformational State of Cytochrome P450cam-CN in Complex with Putidaredoxin. Biochemistry 58, 2353–2361. [DOI] [PMC free article] [PubMed] [Google Scholar]
- (14).Ugur I, and Chandrasekhar P (2020) Proton Relay Network in P450cam Formed upon Docking of Putidaredoxin. Proteins: Struct., Funct., Genet. 88, 558–572. [DOI] [PubMed] [Google Scholar]
- (15).Liou S-H, Chuo S-W, Qiu Y, Wang L-P, and Goodin DB (2020) Linkage between Proximal and Distal Movements of P450cam Induced by Putidaredoxin. Biochemistry 59, 2012–2021. [DOI] [PMC free article] [PubMed] [Google Scholar]
- (16).Gerber NC, and Sligar SG (1992) Catalytic Mechanism of Cytochrome P-450: Evidence for a Distal Charge Relay. J. Am. Chem. Soc. 114, 8742–8743. [Google Scholar]
- (17).Amaya JA, Batabyal D, and Poulos TL (2020) Proton Relay Network in the Bacterial P450s: CYP101A1 and CYP101D1. Biochemistry 59, 2896–2902. [DOI] [PMC free article] [PubMed] [Google Scholar]
- (18).Fedorov R, Ghosh DK, and Schlichting I (2003) Crystal structures of cyanide complexes of P450cam and the oxygenase domain of inducible nitric oxide synthase—structural models of the short-lived oxygen complexes. Arch. Biochem. Biophys. 409, 25–31. [DOI] [PubMed] [Google Scholar]
- (19).Nagano S, and Poulos T (2005) Crystallographic Study on the Dioxygen Complex of Wild-Type and Mutant Cytochrome P450cam. Implications for the Dioxygen Activation Mechanism. J. Biol. Chem. 280, 31659–31663. [DOI] [PubMed] [Google Scholar]
- (20).Denisov IG, and Sligar SG (2015) Activation of Molecular Oxygen in Cytochromes P450, in Cytochrome P450: Structure, Mechanism, and Biochemistry (Ortiz de Montellano PR, Ed.) 4th ed., pp 69–109, Springer International Publishing, New York. [Google Scholar]
- (21).Simianu MC, and Kincaid JR (1995) Resonance Raman Spectroscopic Detection of Both Linear and Bent Fe-CN Fragments for the Cyanide Adducts of Cytochrome P-450 Camphor and Its Substrate-Bound Forms. Relevance to the “Charge Relay” Mechanism. J. Am. Chem. Soc. 117, 4628–4636. [Google Scholar]
- (22).Izatt RM, Christensen JJ, Pack RT, and Bench R (1962) Thermodynamics of Metal-Cyanide Coordination. I. pK, ΔH°, and ΔS° Values as a Function of Temperature for Hydrocyanic Acid Dissociation in Aqueous Solution. Inorg. Chem. 1, 828–831. [Google Scholar]
- (23).Yoshikawa S, O’Keeffe DH, and Caughey WS (1985) Investigations of Cyanide as an Infrared Probe of Hemeprotein Ligand Binding Sites. J. Biol. Chem. 260, 3518–3528. [PubMed] [Google Scholar]
- (24).Lopez-Garriga JJ, Oertling WA, Kean RT, Hoogland H, Wever R, and Babcock GT (1990) Metal-Ligand Vibrations of Cyanoferric Myeloperoxidase and Cyanoferric Horseradish Peroxidase: Evidence for a Constrained Heme Pocket in Myeloperoxidase. Biochemistry 29, 9387–9395. [DOI] [PubMed] [Google Scholar]
- (25).Martinis SA, Atkins WM, Stayton PS, and Sligar SG (1989) A Conserved Residue of Cytochrome P-450 Is Involved in Heme-Oxygen Stability and Activation. J. Am. Chem. Soc. 111, 9252–9253. [Google Scholar]
- (26).Gerber NC, and Sligar SG (1994) A Role for Asp-251 in Cytochrome P-450cam Oxygen Activation. J. Biol. Chem. 269, 4260–4266. [PubMed] [Google Scholar]
- (27).Imai M, Shimada H, Watanabe Y, Matsushima-Hibiya Y, Makino R, Koga H, Horiuchi T, and Ishimura Y (1989) Uncoupling of the Cytochrome P-450cam Monooxygenase Reaction by a Single Mutation, Threonine-252 to Alanine or Valine: Possible Role of the Hydroxy Amino Acid in Oxygen Activation. Proc. Natl. Acad. Sci. U. S. A. 86, 7823–7827. [DOI] [PMC free article] [PubMed] [Google Scholar]
- (28).Ramos S, Basom EJ, and Thielges MC (2018) Conformational Change Induced by Putidaredoxin Binding to Ferrous CO-Ligated Cytochrome P450cam Characterized by 2D IR Spectroscopy. Front. Mol. Biosci. 5, 94. [DOI] [PMC free article] [PubMed] [Google Scholar]
- (29).Lyons TA, Ratnaswamy G, and Pochapsky TC (1996) Redox-Dependent Dynamics of Putidaredoxin Characterized by Amide Proton Exchange. Protein Sci. 5, 627–639. [DOI] [PMC free article] [PubMed] [Google Scholar]
- (30).OuYang B, Pochapsky SS, Pagani GM, and Pochapsky TC (2006) Specific Effects of Potassium Ion Binding on Wild-Type and L358P Cytochrome P450cam. Biochemistry 45, 14379–14388. [DOI] [PMC free article] [PubMed] [Google Scholar]
- (31).Nickerson DP, and Wong LL (1997) The Dimerization of Pseudomonas Putida Cytochrome P450cam: Practical Consequences and engineering of a Monomeric Enzyme. Protein Eng., Des. Sel. 10, 1357–1361. [DOI] [PubMed] [Google Scholar]
- (32).Nagano S, Shimada H, Tarumi A, Hishiki T, Kimata-Ariga Y, Egawa T, Suematsu M, Park S, Adachi S, Shiro Y, and Ishimura Y (2003) Infrared Spectroscopic and Mutational Studies on Putidaredoxin-Induced Conformational Changes in Ferrous CO-P450cam Infrared Spectroscopic and Mutational Studies on Putidaredoxin-Induced Conformational Changes in Ferrous CO-P450cam. Biochemistry 42, 14507–14514. [DOI] [PubMed] [Google Scholar]
- (33).Pochapsky SS, Pochapsky TC, and Wei JW (2003) A Model for Effector Activity in a Highly Specific Biological Electron Transfer Complex: The Cytochrome P450cam-Putidaredoxin Couple. Biochemistry 42, 5649–5656. [DOI] [PubMed] [Google Scholar]
- (34).Reddy KS, Yonetani T, Tsuneshige A, Chance B, Kushkuley B, Stavrov SS, and Vanderkooi JM (1996) Infrared Spectroscopy of the Cyanide Complex of Iron(II) Myoglobin and Comparison with Complexes of Microperoxidase and Hemoglobin. Biochemistry 35, 5562–5570. [DOI] [PubMed] [Google Scholar]
- (35).Nagano S, Tosha T, Ishimori K, Morishima I, and Poulos T (2004) Crystal Structure of the Cytochrome P450cam Mutant That Exhibits the Same Spectral Perturbations Induced by Putidaredoxin Binding. J. Biol. Chem. 279, 42844–42849. [DOI] [PubMed] [Google Scholar]
- (36).Tosha T, Yoshioka S, Ishimori K, and Morishima I (2004) L358P Mutation on Cytochrome P450cam Simulates Structural Changes upon Putidaredoxin Binding: The Structural Changes Trigger Electron Transfer to Oxy-P450cam from Electron Donors. J. Biol. Chem. 279, 42836–42843. [DOI] [PubMed] [Google Scholar]
- (37).Yoshioka S, Takahashi S, Ishimori K, and Morishima I (2000) Roles of the Axial Push Effect in Cytochrome P450cam Studied with the Site-Directed Mutagenesis at the Heme Proximal Site. J. Inorg. Biochem. 81, 141–151. [DOI] [PubMed] [Google Scholar]
- (38).Yoshioka S, Tosha T, Takahashi S, Ishimori K, Hori H, and Morishima I (2002) Roles of the Proximal Hydrogen Bonding Network in Cytochrome P450cam-Catalyzed Oxygenation. J. Am. Chem. Soc. 124, 14571–14579. [DOI] [PubMed] [Google Scholar]
- (39).Lee YT, Wilson RF, Rupniewski I, and Goodin DB (2010) P450cam Visits an Open Conformation in the Absence of Substrate. Biochemistry 49, 3412–3419. [DOI] [PMC free article] [PubMed] [Google Scholar]
- (40).Asciutto EK, Young MJ, Madura J, Pochapsky SS, and Pochapsky TC (2012) Solution Structural Ensembles of Substrate-Free Cytochrome P450 Cam. Biochemistry 51, 3383–3393. [DOI] [PMC free article] [PubMed] [Google Scholar]
- (41).Poulos TL, Finzel BC, and Howard AJ (1987) High-Resolution Crystal Structure of Cytochrome P450cam. J. Mol. Biol. 195, 687–700. [DOI] [PubMed] [Google Scholar]
- (42).Lee Y-T, Glazer EC, Wilson RF, Stout CD, and Goodin DB (2011) Three Clusters of Conformational States in P450cam Reveal a Multistep Pathway for Closing of the Substrate Access Channel. Biochemistry 50, 693–703. [DOI] [PMC free article] [PubMed] [Google Scholar]
- (43).Di Primo C, Deprez E, Hoa GH, and Douzou P (1995) Antagonistic Effects of Hydrostatic Pressure and Osmotic Pressure on Cytochrome P-450cam Spin Transition. Biophys. J. 68, 2056–2061. [DOI] [PMC free article] [PubMed] [Google Scholar]
- (44).Unno M, Christian JF, Benson DE, Gerber NC, Sligar SG, and Champion PM (1997) Resonance Raman Investigations of Cytochrome P450cam Complexed with Putidaredoxin. J. Am. Chem. Soc. 119, 6614–6620. [Google Scholar]
- (45).Katz JJ (1960) Chemical and biochemical studies with deuterium. Am. Sci. 48, 544–580. [Google Scholar]
- (46).Makris TM, Von Koenig K, Schlichting I, and Sligar SG (2007) Alteration of P450 Distal Pocket Solvent Leads to Impaired Proton Delivery and Changes in Heme Geometry. Biochemistry 46, 14129–14140. [DOI] [PubMed] [Google Scholar]
- (47).Sono M, and Dawson JH (1982) Formation of Low Spin Complexes of Ferric Cytochrome P450cam with Anionic Ligand. J. Biol. Chem. 257, 5496–5502. [PubMed] [Google Scholar]
- (48).Petering D, Fee JA, and Palmer G (1971) The Oxygen Sensitivity of Spinach Ferredoxin and Other Iron-Sulfur Proteins The Formation of Protein-Bound Sulfur-Zero. J. Biol. Chem. 246, 643–653. [PubMed] [Google Scholar]
- (49).Wallace EF, and Rabinowitz JC (1971) The Reaction of Ciostridial Ferredoxin with Cyanide. Arch. Biochem. Biophys. 146, 400–409. [DOI] [PubMed] [Google Scholar]
- (50).Skinner SP, Liu W-M, Hiruma Y, Timmer M, Blok A, Hass MAS, and Ubbink M (2015) Delicate Conformational Balance of the Redox Enzyme Cytochrome P450cam. Proc. Natl. Acad. Sci. U. S. A. 112, 9022–9027. [DOI] [PMC free article] [PubMed] [Google Scholar]
- (51).Shi X, Chuo SW, Liou SH, and Goodin DB (2020) Double Electron-Electron Resonance Shows That the Substrate but Not the Inhibitors Causes Disorder in the F/G Loop of CYP119 in Solution. Biochemistry 59, 1823–1831. [DOI] [PubMed] [Google Scholar]
- (52).Asciutto EK, Madura JD, Pochapsky SS, Ouyang B, and Pochapsky T (2009) Structural and Dynamic Implications of an Effector-Induced Backbone Amide Cis-Trans Isomerization in Cytochrome P450cam. J. Mol. Biol. 388, 801–814. [DOI] [PMC free article] [PubMed] [Google Scholar]
- (53).Pochapsky TC, and Pochapsky SS (2019) What Your Crystal Structure Will Not Tell You about Enzyme Function. Acc. Chem. Res. 52, 1409–1418. [DOI] [PMC free article] [PubMed] [Google Scholar]
- (54).Pochapsky TC (2021) A Dynamic Understanding of Cytochrome P450 Structure and Function through Solution NMR. Curr. Opin. Biotechnol. 69 (51), 35–42. [DOI] [PMC free article] [PubMed] [Google Scholar]
- (55).Ubbink M (2012) Dynamics in Transient Complexes of Redox Proteins. Biochem. Soc. Trans. 40, 415–418. [DOI] [PubMed] [Google Scholar]
- (56).Rui L, Pochapsky SS, and Pochapsky TC (2006) Comparison of the Complexes Formed by Cytochrome P450cam with Cytochrome B5 and Putidaredoxin, Two Effectors of Camphor Hydroxylase Activity. Biochemistry 45, 3887–3897. [DOI] [PMC free article] [PubMed] [Google Scholar]
Associated Data
This section collects any data citations, data availability statements, or supplementary materials included in this article.