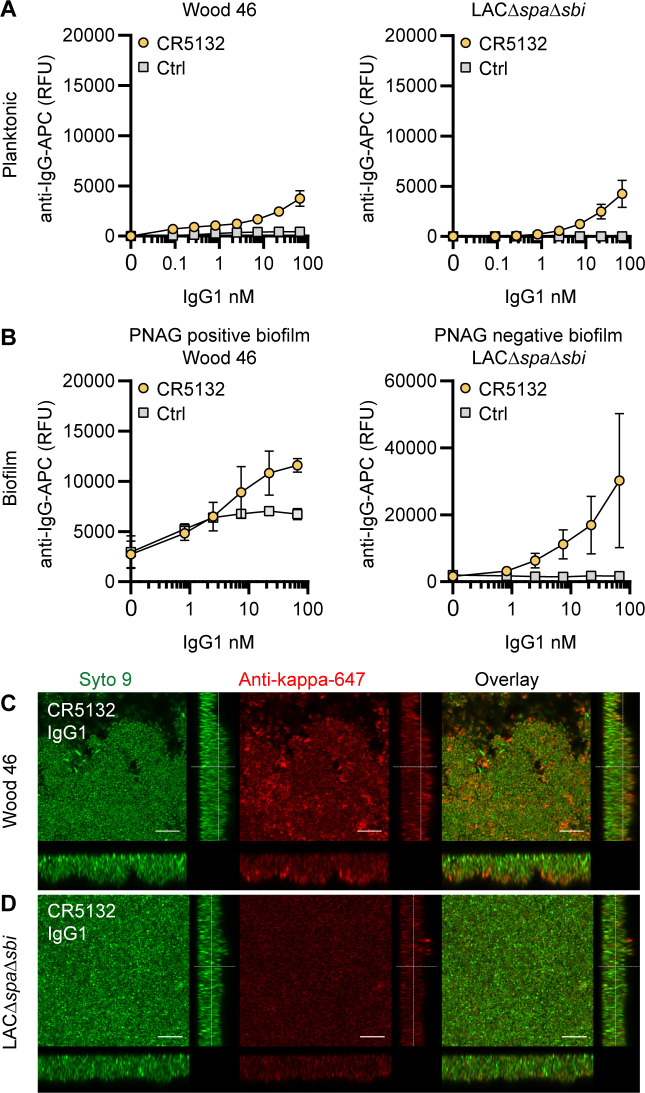
Figure 3. CR5132-IgG1 discriminates between planktonic bacteria and biofilm.
(A) Planktonic bacteria of Wood46 (left) and LAC∆spa∆sbi (right) were grown to exponential phase and incubated with a concentration range of CR5132-IgG1. Monoclonal antibody (mAb) binding was detected using APC-labeled anti-human IgG antibodies and flow cytometry and plotted as geoMFI of the bacterial population. (B) Biofilms of Wood46 (left) and LAC∆spa∆sbi (right) were grown for 24 hr and incubated with a concentration range of CR5132-IgG1. mAb binding was detected using APC-labeled anti-human IgG antibodies and a plate reader and plotted as fluorescence intensity per well. Data represent mean + SD of at least three independent experiments. (C, D) Biofilm was grown for 24hr and incubated with 66 nM IgG1 mAb. Bacteria were visualized by Syto9 (green), and mAb binding was detected by staining with Alexa Fluor 647-conjugated goat-anti-human-kappa F(ab′)2 antibody (red). Orthogonal views are representative for a total of three Z-stacks per condition and at least two independent experiments. Scale bars: 10 μm.


