. 2022 Jan 6;11:e67301. doi: 10.7554/eLife.67301

Figure 5. Comparative binding of IgG1 monoclonal antibodies (mAbs) to S. aureus biofilm.

Biofilms of Wood46 (A) and LAC∆spa∆sbi (B) were grown for 24 hr and incubated with a concentration range of IgG1 mAbs. mAb binding was detected using APC-labeled anti-human IgG antibodies and a plate reader. Data are expressed as area under the curve (AUC) of the binding curve (mean + SD) of three independent experiments. One-way ANOVA followed by Dunnett test was performed to test for differences in antibody binding versus control and displayed only when significant as *p≤0.05, **p≤0.01, ***p≤0.001, or ****p≤0.0001. Exact p-values are displayed in Supplementary file 2.

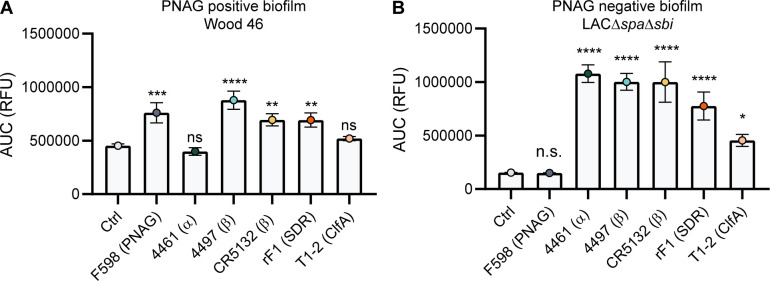
Figure 5.

Figure 5—figure supplement 1. Comparative binding of IgG1 monoclonal antibodies (mAbs) to planktonic bacteria.

Figure 5—figure supplement 1.

Planktonic bacteria of Wood46 (A) and LAC∆spa∆sbi (B) were grown to exponential phase and incubated with a concentration range of IgG1 mAbs. mAb binding was detected using APC-labeled anti-human IgG antibodies and flow cytometry. Data are expressed as area under the curve (AUC) of the binding curve (mean + SD) of three independent experiments. One-way ANOVA followed by Dunnett test was performed to test for differences in antibody binding versus control and displayed only when significant as *p≤0.05, **p≤0.01, ***p≤0.001, or ****p≤0.0001. Exact p-values are displayed in Supplementary file 2.
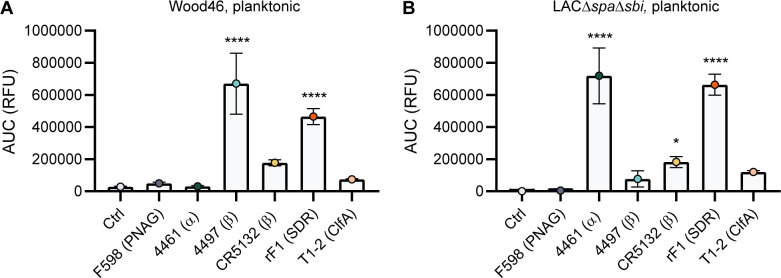
Figure 5—figure supplement 2. Mean total fluorescence per Z-stack corresponds to plate reader data.

Figure 5—figure supplement 2.

The total AF647 signal of obtained Z-stack profiles of biofilms Wood46 (A) and LAC∆spa∆sbi (B) was calculated using Leica LAS AF imaging software. Data are representative for two independent experiments.
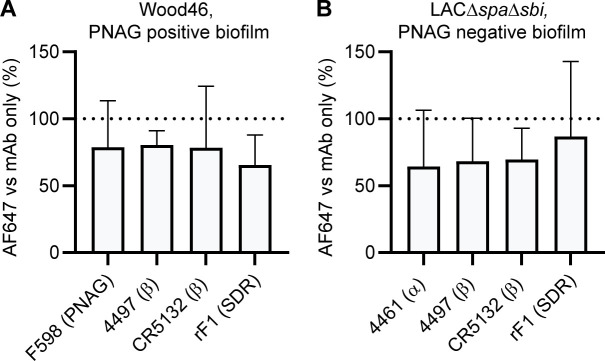
Figure 5—figure supplement 3. Binding in the presence of pooled serum IgG.

Figure 5—figure supplement 3.

Biofilm cultures of Wood46 (A) and LAC∆spa∆sbi (B) were incubated with 10 µg/mL AF647-conjugated IgG1 monoclonal antibodies (mAbs) in buffer or buffer containing 250 µg/mL pooled IgG. Data are expressed as % relative to mAb binding in buffer of three independent experiments performed in duplicate.
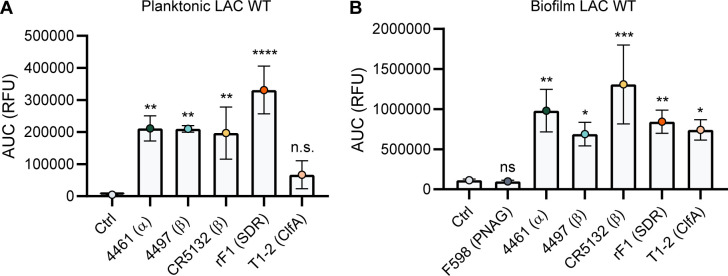
Figure 5—figure supplement 4. Binding of IgG3 monoclonal antibodies (mAbs) to planktonic and biofilm LAC wild type.

Figure 5—figure supplement 4.

(A) Planktonic bacteria of LAC WT (AH1263) were grown to exponential phase and incubated with a concentration range of IgG3 mAbs. mAb binding was detected using APC-labeled anti-human IgG antibodies and flow cytometry and plotted as geoMFI of the bacterial population. (B) LAC WT (AH1263) biofilm was grown for 24 hr and incubated with a concentration range of IgG3 mAbs. mAb binding was detected using APC-labeled anti-human IgG antibodies and a plate reader. Data represent mean + SD of three independent experiments. One-way ANOVA followed by Dunnett test was performed to test for differences in antibody binding versus control and displayed only when significant as *p≤0.05, **p≤0.01, ***p≤0.001, or ****p≤0.0001. Exact p-values are displayed in Supplementary file 2.