

SUMMARY
Non-small cell lung cancers (NSCLCs) harboring KEAP1 mutations are often resistant to immunotherapy. Here, we show that KEAP1 targets EMSY for ubiquitin-mediated degradation to regulate homologous recombination repair (HRR) and anti-tumor immunity. Loss of KEAP1 in NSCLC induces stabilization of EMSY producing a BRCAness phenotype; i.e., HRR defects and sensitivity to PARP inhibitors. Defective HRR contributes to high tumor mutational burden that, in turn, is expected to prompt an innate immune response. Notably, EMSY accumulation suppresses the type I interferon response and impairs innate immune signaling, fostering cancer immune evasion. Activation of the type I interferon response in the tumor microenvironment using a STING agonist results in the engagement of innate and adaptive immune signaling, and impairs the growth of KEAP1-mutant tumors. Our results suggest that targeting PARP and STING pathways, individually or in combination, represent a therapeutic strategy in NSCLC patients harboring alterations in KEAP1.
eTOC Blurb
CRL3KEAP1 targets EMSY for degradation to regulate genome stability and the type I interferon response, suggesting that PARP inhibitors and STING agonist hold therapeutic potential for the treatment of KEAP1-mutant lung cancers.
INTRODUCTION
Lung cancer is the leading cause of cancer-related death worldwide (Bar et al., 2008; Takahashi et al., 1989) with non-small cell lung cancer (NSCLC) being the most common type (~85%). NSCLCs are subdivided into lung adenocarcinomas (LUADs, ~50%), lung squamous cell carcinomas (LUSCs, ~30%), and others (~20%).
Among the emerging targeted therapies, immune checkpoint blockade (ICB) represents a promising approach eliciting durable antitumor immune responses in multiple tumor types, including lung cancer (Zappasodi et al., 2018). NSCLCs are characterized by a high tumor mutational burden (TMB) (Alexandrov et al., 2013; Berland et al., 2019; Buttner et al., 2019; Lawrence et al., 2013), which is a measurement of the number of mutations carried by tumor cells. High TMB is expected to induce an anti-tumor response and, in fact, it represents a biomarker predicting favorable responses to ICB (Berland et al., 2019; Cristescu et al., 2018; Heeke et al., 2019). However, despite the significant survival benefit of ICB for a substantial fraction of patients with advanced NSCLC, a large number of patients exhibiting primary resistance (Heeke et al., 2019; Heeke and Hofman, 2018; Ribas and Wolchok, 2018).
Among the major lung cancer drivers, the tumor suppressor KEAP1 is mutated in ~20% of NSCLC patients and is the third most frequently mutated gene in LUAD (The Cancer Genome Atlas (TCGA) Research, 2014). KEAP1 is a substrate receptor of a CUL3-RING ubiquitin ligase (CRL3) that constitutively targets NRF2 (encoded by NFE2L2) for degradation, ensuring redox homeostasis (Harris and DeNicola, 2020; Itoh et al., 2010; Jaramillo and Zhang, 2013; Rojo de la Vega et al., 2018; Romero et al., 2017). Since NRF2 is the most well-characterized substrate of KEAP1, it is commonly assumed that tumors harboring mutations in both KEAP1 or NRF2 display similar features. However, only NSCLCs with KEAP1 mutations, but not those with NRF2 mutations, exhibit a significant negative association with the clinical T-cell-inflamed GEP (gene expression profile) score (Chen et al., 2020; Cristescu et al., 2018). Moreover, mutations in KEAP1 specifically correlates with lower immune infiltration and immune evasion, and KEAP1 mutant NSCLCs display resistance to ICB (Bagaev et al., 2021; Chen et al., 2020; Cristescu et al., 2018; Martin et al., 2021; Papillon-Cavanagh et al., 2020; Tokheim et al., 2021). These observations suggest that KEAP1 inactivating mutations and NRF2 activating mutations do not produce identical phenotypes and suggest that KEAP1, but not NRF2, plays a role in regulating anti-tumor immunity.
Over the last decade, synthetic lethality approaches have been developed for the treatment of tumors defective in homologous recombination repair (HRR). One such approach involves pharmacological inhibition of PARP1, a key DNA repair enzyme (Lord and Ashworth, 2016). So far, PARP inhibitors (PARPis) have been approved only for treatment of ovarian and breast cancers with mutations in BRCA1 and BRCA2 genes, two major regulators of HRR (Byrum et al., 2019; Przybycinski et al., 2019). While the use of PARPis in the clinic has excluded BRCA-proficient cancers, several recent preclinical and clinical studies have begun to expand this narrow therapeutic scope. Strategies include identifying cancers with defects in HRR that produce a BRCAness phenotype in the absence of BRCA mutations, sensitizing these tumors to PARP inhibition (Byrum et al., 2019; Lord and Ashworth, 2016; Wiegmans et al., 2015).
Relatedly, EMSY is the product of a proto-oncogene whose locus is frequently amplified in ovarian and other human cancers (Dansonka-Mieszkowska et al., 2018; Haber, 2003; Hollis et al., 2019; Hughes-Davies et al., 2003; Maatta et al., 2017). EMSY physically interacts with and inhibits BRCA2’s activity, and its overexpression induces a BRCAness phenotype (Jelinic et al., 2017; Kondrashova and Scott, 2019; Livingston, 2004). Moreover, EMSY is part of several chromatin remodeling complexes and acts as a negative regulator of interferon-stimulated genes (ISGs) (Ezell et al., 2012; Ezell and Tsichlis, 2012; Varier et al., 2016; Vire et al., 2014b). Notably, anti-tumor immune responses are known to activate damage-associated molecular patterns (DAMPs), among which type I interferon (IFN) is a major factor bridging innate and adaptive immune response (Saleiro and Platanias, 2019; Snell et al., 2017).
We found that CRL3KEAP1 targets EMSY for degradation and that loss of KEAP1 inhibits both HRR and the IFN response in an EMSY-dependent manner. Moreover, EMSY accumulation in KEAP1 mutant NSCLCs sensitizes them to PARPis and STING agonist. The results of these studies are presented herein.
RESULTS
KEAP1 loss promotes an increase in the tumor mutational burden
NSCLCs are known to display high TMB; however, the contribution of specific driver mutations to TMB remains unclear. To this end, we evaluated the TMB distribution across the major drivers of NSCLC using patient data from the TCGA database stratified in non-smoker and smoker (Fig. S1A–B). KEAP1-mutant tumors displayed the highest and the third highest TMB within the non-smoker and the smoker group, respectively, suggesting that this specific genetic background is instrumental in establishing a high TMB (Fig. S1A–B). Mutations in KEAP1 correlated with an increase in the TMB both in LUADs and LUSCs (Fig. 1A). In contrast, NSCLCs with activating mutations in NRF2 did not show any increase in TMB (Fig.1B). Given that TP53, a major regulator of the DNA damage response, is mutated in >50% of NSCLCs (Cancer Genome Atlas Research, 2014), we stratified NSCLCs according to their TP53 status. Compared to tumors with wild-type KEAP1, KEAP1-mutated tumors displayed a high TMB independently of TP53 status (Fig. 1C). This was not observed for any other driver, except for FAT1 (Fig. S1C). Next, we employed a mouse model to assess TMB in the context of Keap1 deficiency. To this end, we utilized the KP (KrasLSL-G12D/+; Trp53flox/flox) GEMM-derived cell line system (Romero et al., 2017) to generate Keap1 knockout (KPK) clones (Fig. S1D) whose TMB was assessed using whole exome sequencing. Consistent with the TCGA data, KPK clones displayed a ~3-fold increase in TMB compared to KP cells (Fig. 1D), the latter representing KP parental cells (KP0) subjected to mock CRISPR/Cas9 transfection. KPK cells also showed an increase in TMB when the number of mutations in coding sequences were quantified using RNA-seq data (Fig. 1E). Furthermore, pathway enrichment analysis from the same RNA-seq datasets showed downregulation of gene sets for pathways involved in HRR and double-strand break (DSB) repair in Keap1−/− tumors (Fig. 1F). Finally, using patient data from TCGA (Thorsson et al., 2019), we observed that KEAP1-mutated NSCLCs displayed an increase in the HRD (homologous-recombination deficiency) score compared to KEAP1 wild type tumors (Fig. 1G).
Figure 1. Increased TMB in KEAP1-mutant NSCLCs.

(A) TMB in LUAD and LUSC according to their KEAP1 status.
(B) TMB in NSCLCs according to their KEAP1 or NFE2L2 status.
(C) TMB in KEAP1 wild type and mutant tumors according to their TP53 status.
(D) TMB in Keap1 wild type (KP) and knockout (KPK) clones using whole exome sequencing (WES). The TMB of each cell line was normalized to the TMB of KP parental cell line (KP0).
(E)Comparison of TMB between KP and KPK cells using RNA-seq data previously reported (Lignitto et al., 2019).
(F) GSEA of DSB repair and HRR of KPK (n=6) and KP (n=6) cells using RNA-seq data previously reported (Lignitto et al., 2019).
(G) HRD score in KEAP1 wild type and mutant tumors from TCGA (Thorsson et al., 2019).
Taken together, the above results show that KEAP1-mutant tumors display a high TMB and an impairment in the pathways involved in DNA repair pathways, particularly HRR.
KEAP1-mutant tumors display a BRCAness phenotype
We observed that KEAP1 depleted cells exhibited a significant decrease in HRR efficiency measured with a GFP-based reporter (Pierce et al., 1999) (Fig. 2A and Fig. S2A). Accordingly, in response to the DNA damaging agent neocarzinostatin (NCS), compared to KP cells, KPK cells showed an impairment in Rad51 foci formation, as well as Rad51 loading to the chromatin, but displayed efficient phosphorylation of H2ax at Ser139 (pH2ax) (Fig. 2B and Fig. S2B–C).
Figure 2. KEAP1-mutant tumors display a BRCAness phenotype.

(A) DR-GFP U2OS cells were transfected with either a non-targeting (NT) siRNA or the indicated siRNAs. Data are presented as fold change in frequency of repair of DR-GFP, relative to the samples transfected with NT siRNA. Each experiment was performed at least three times, each with triplicate measurements (±SEM).
(B) KP and KPK cells were treated with NCS for three hours, fixed, and stained with DAPI and an antibody to Rad51. UT, untreated cells. A minimum of 300 cells were counted for each condition in 3 independent experiments. Data are presented as mean ±SEM. Slides were co-stained with an anti-pH2ax antibody (see Fig. S2A).
(C) The indicated cell lines were treated with the indicated concentrations of talazoparib (PARPi) for 72 hours. Cell viability was measured using alamarBlue and was set as 100% for cells not treated with PARPi. Each experiment was performed at least three times, each with triplicate measurements (±SEM). Where indicated, the selective inhibitor of the KEAP1/NRF2 interaction KI696 was added 96 hours prior addition of PARPi.
(D) The indicated cell lines (5×10⁵ cells) were implanted subcutaneously into the flanks of 6- to 8-week-old C57BL/6J mice. Once tumors were measurable, the mice were divided into two groups, one treated with vehicle and the other with talazoparib (PARPi) for the indicated days. Tumor size was monitored twice a week. Mice were sacrificed by the end of the treatment. Data represent mean ±SEM; n = 10.
(E) Quantification of tumor weight from tumors described in (D).
(F) The indicated PDXs were treated either with vehicle (CTG-465 n=9; CTG-1194 n=9; CTG-743 n=8) or talazoparib (PARPi) (CTG-465 n=8; CTG-1194 n=7; CTG-743 n=10) for the indicated days. Individual groups and full experiments are represented in Fig. S2M. Data represent mean ±SEM.
(G) Quantification of tumor weight from tumors described in (F).
(H) Waterfall plot showing the percentage of tumor growth in C57BL/6J mice orthotopically implanted with KP and KPK lung tumors and treated 5 days post implantation with vehicle or talazoparib (PARPi). Tumor size was determined 8 days post-implantation (initial measurement) and 15 days of drug treatment (final measurement). Each column represents one tumor (KP vehicle n=11; KP PARPi n=15; KPK vehicle n=12; KPK PARPi n=11).
(I) Kaplan–Meier curve showing survival of mice bearing orthotopically implanted KPK lung tumors treated with vehicle or talazoparib (PARPi).
(J) The experiment was performed as described in (D), except that 2.5×10⁵ cells were implanted subcutaneously. Data represent mean ±SEM; n=10.
(K) Quantification of tumor weight from tumors described in (J).
In agreement with the synthetic lethality between HRR defects and PARPis, we found that, compared to KP cells, KPK cells showed a dose-dependent enhanced sensitivity to PARPi treatment (Fig. 2C and Fig. S2D–G). In contrast to Keap1 knockout, stable expression of a non-degradable Nrf2 mutant or pharmacological activation of Nrf2 did not increase the sensitivity of KP cells to PARPi (Fig. 2C and Fig. S2H–I). These results suggest that both the HRR defect and PARPi sensitivity observed in Keap1-null cells are not due to the upregulation of Nrf2. In line with our in vitro results, subcutaneously transplanted KPK tumors showed sensitivity to PARPi compared to KP tumors (Fig. 2D–E and Fig. S2J–K). Immunohistochemistry (IHC) analysis revealed that PARPi-treated KPK tumors displayed accumulation of pH2ax (Fig. S2L), in agreement with the defective HRR necessary to repair PARPi-induced DNA damage in KPK tumors. Using patient-derived xenografts (PDXs), we similarly found that tumors derived from a human LUAD harboring an inactivating mutation in KEAP1 were sensitive to PARPi, similar to tumors derived from a LUAD with an inactivating mutation in ATM, a well-established BRCAness gene (Fig. 2F–G and Fig. S2M).
Moreover, compared to orthotopically transplanted KP lung tumors, KPK tumors showed sensitivity to PARPi (Fig. 2H), concomitant with enhanced survival (Fig. 2I). Finally, reconstitution of Keap1 in KPK cells rescued the PARPi sensitivity in vivo (Fig. 2J–K) and the ability of these cells to form Rad51 foci upon DNA damage (Fig. S2N).
Taken together, these results suggest that KEAP1-mutated tumors display a BRCAness phenotype characterized by HRR defects and sensitivity to PARPi. The HRR defects observed in KEAP1 depleted cells may explain the increased TMB observed in KEAP1-mutant NSCLC patients.
CRL3KEAP1 targets EMSY for ubiquitin-mediated degradation
We sought to identify CRL3KEAP1 substrates whose accumulation could explain the Nrf2-independent BRCAness phenotypes observed in Keap1-null cells. We expressed FLAG-tagged KEAP1 in HEK293T cells and subjected the anti-FLAG immunoprecipitates to mass spectrometry analysis. Among the proteins identified in the KEAP1 complex (including known interactors), we found several peptides corresponding to EMSY (Fig. S3A), which attracted our attention because of its ability to inhibit BRCA2. Finally, upon immunoprecipitation of FLAG-tagged EMSY, we identified KEAP1 in addition to known interactors (Fig. S3B). We validated the interaction between KEAP1 and EMSY and found that cancer-associated KEAP1 mutants displayed an impairment in EMSY binding (Fig. 3A–D and Fig. S3C–D). EMSY levels increased in cells treated either with the proteasome inhibitor MG132 or the CRLs inhibitor MLN4924 (Fig. S3E–F). KEAP1 knockout U2OS cells displayed high levels of EMSY protein compared to KEAP1 wild-type controls (Fig. 3E). Accordingly, analyses of cell lysates from the previously analyzed PDXs (Fig. 2F–G) and from KPK cells confirmed increased EMSY/Emsy levels compared to controls (Fig. 3F–G and Fig. S1D). Importantly, re-expression of Keap1 was sufficient to decrease Emsy protein levels in KPK cells (Fig. 3H).
Figure 3. KEAP1 targets EMSY for ubiquitin- and proteasome-mediated degradation.
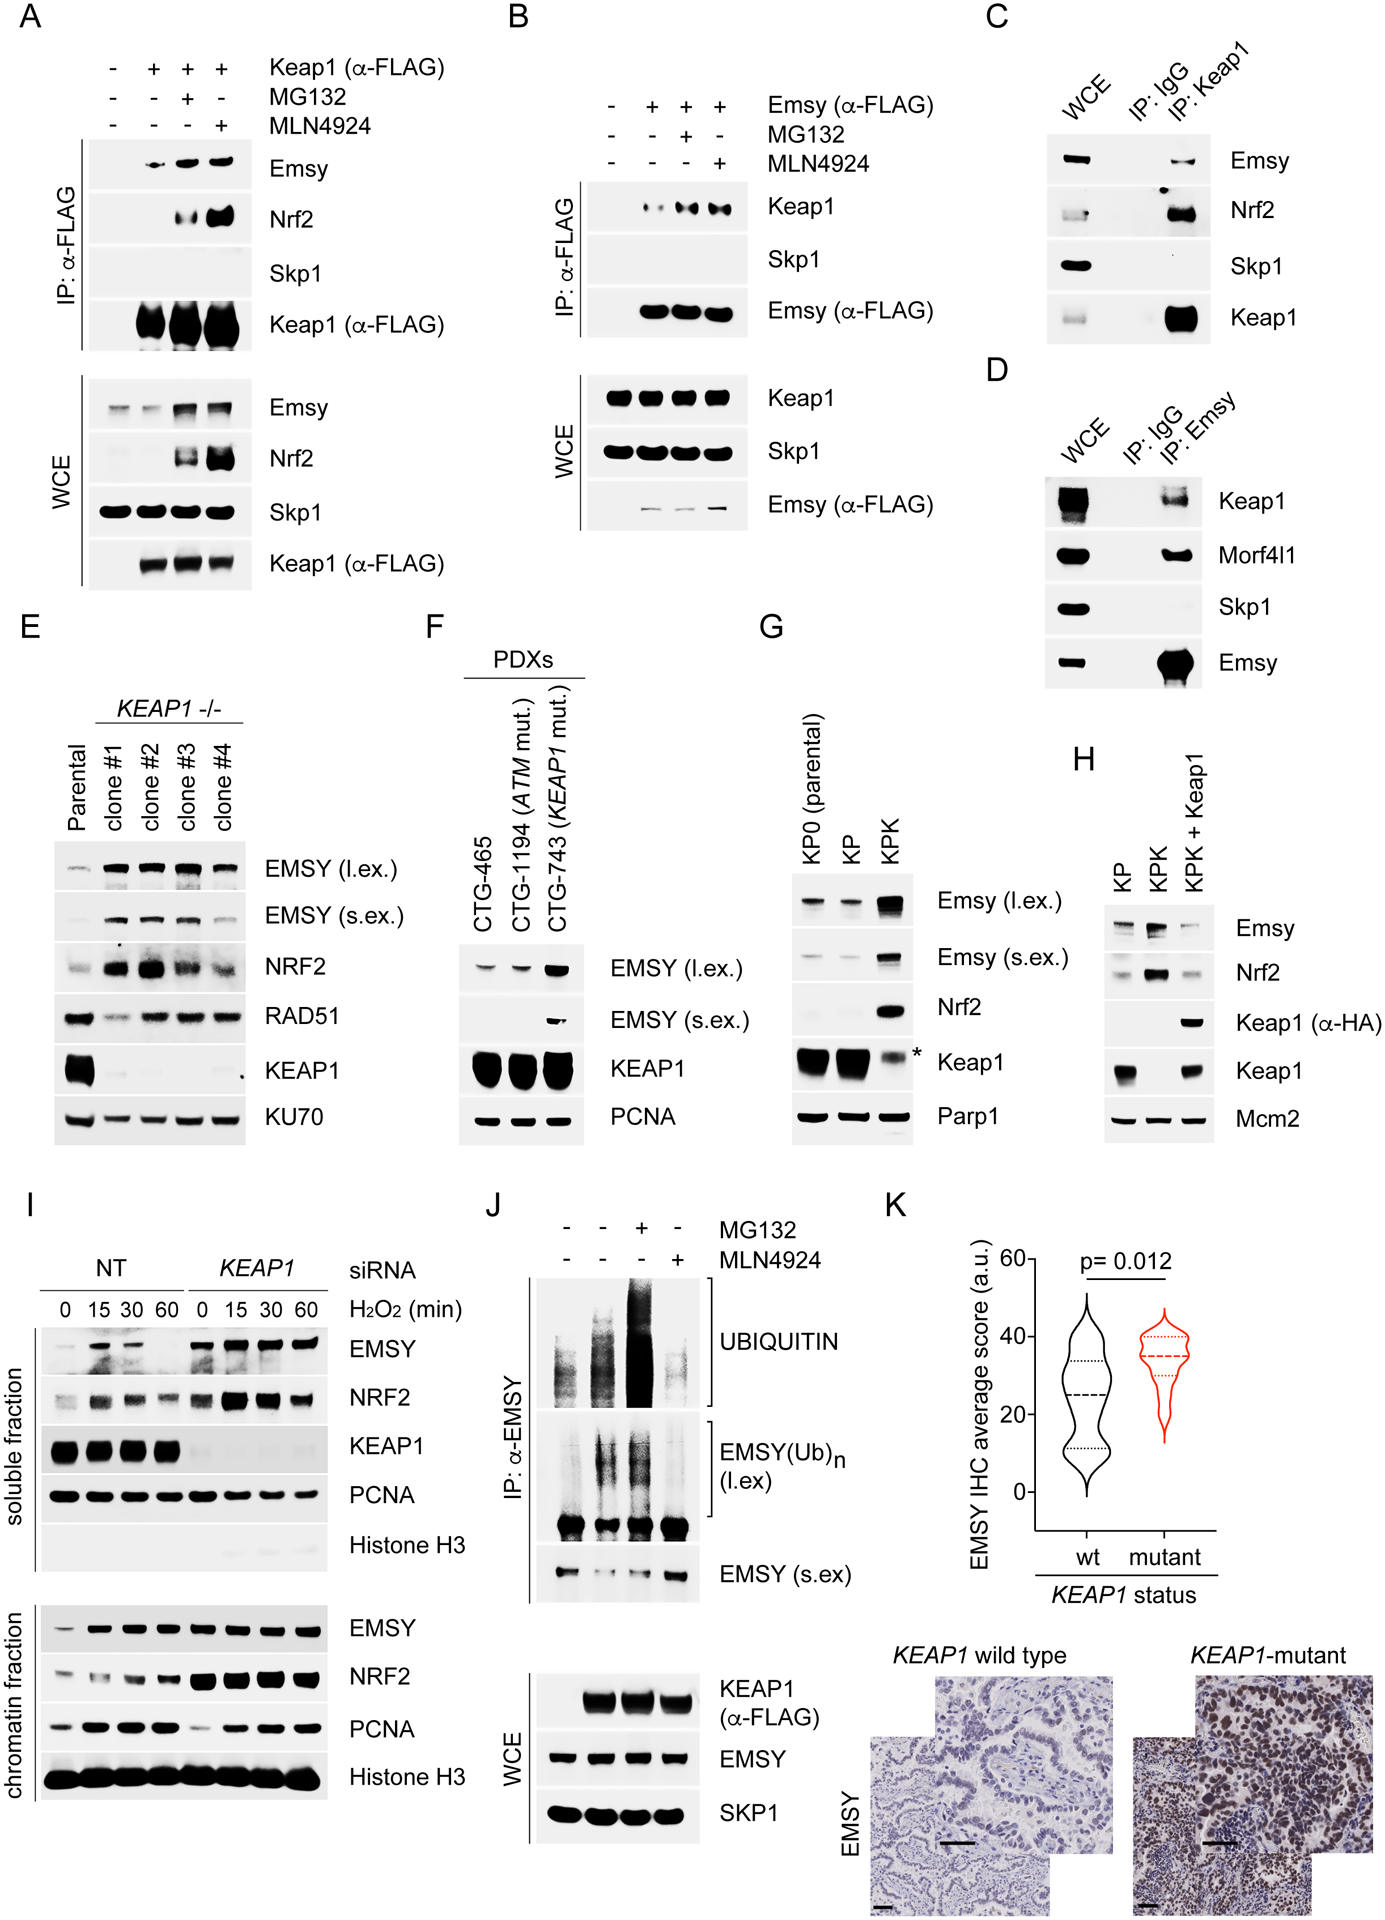
(A) KP cells were transfected for 24 hours with an empty vector (EV) or FLAG-tagged Keap1. Cells were treated with MG132 or MLN4924 for 3 hours and collected for immunoprecipitation (IP) and immunoblotting. WCE, whole-cell extract.
(B) KP cells were transfected with an EV or FLAG-tagged Emsy. The experiment was performed as described in (A).
(C) Lysates of KP cells were immunoprecipitated with an antibody against Keap1 or a rabbit IgG and immunoblotted.
(D) Lysates of KP cells were immunoprecipitated with an antibody against Emsy or a rabbit IgG and immunoblotted.
(E) The indicated U2OS clones were collected, lysed, and immunoblotted.
(F) WB analysis of cell lysates from the previously analyzed PDXs (Fig. 2F–G and Fig. S2M).
(G)-(H) The indicated cell lines were collected, lysed, and immunoblotted.
(I) U2OS cells were transfected for 48 hours with a non-targeting (NT) siRNA or an siRNA to KEAP1. Cells were treated with H2O2, collected at the indicated times, fractionated into soluble and chromatin fractions, and immunoblotted.
(J) HEK293T cells were transfected for 24 hours with an EV or FLAG-tagged KEAP1 wild-type. Cells were treated with MG132 or MLN4924 for 3 hours before collection for IP under denaturing condition with an anti-EMSY antibody followed by immunoblotting. The bracket indicates a ladder of bands with a relative molecular mass of >170,000 corresponding to polyubiquitylated EMSY.
(K) IHC analysis of EMSY protein levels in human NSCLCs either KEAP1-mutant (n=12) or wild type KEAP1 (n=20). KEAP1 status was confirmed in all tumor samples by targeted exome sequencing. Bottom panel, representative IHC images. Scale bars, 50 μM.
KEAP1 is a master regulator of the cellular redox state and contains cysteines that are oxidized in response to oxidative stress, leading to KEAP1 inactivation (Harris and DeNicola, 2020; Itoh et al., 2010; Jaramillo and Zhang, 2013; Rojo de la Vega et al., 2018; Romero et al., 2017). H2O2-treated cells displayed a rapid and transient accumulation of EMSY levels (Fig. 3I and Fig. S3G). In contrast, when KEAP1 was silenced, basal EMSY levels were higher and did not fluctuate upon oxidative stress induction (Fig. 3I and Fig. S3G). We also found that KEAP1 expression induced the appearance of ubiquitylated species of EMSY (Fig. S3H). Importantly, these ubiquitylated species were not present when KEAP1 mutants, unable to assemble an active CRL3 complex, were expressed. The increase in EMSY ubiquitylation upon KEAP1 transfection was inhibited by the addition of the CRLs inhibitor MLN4924 (Fig. 3J). Finally, in line with the hypothesis that EMSY is a CRL3KEAP1 substrate, we found that human NSCLCs with mutations in KEAP1 displayed higher levels of EMSY compared to wild type controls (Fig. 3K).
Altogether, the above results demonstrate that KEAP1 controls the ubiquitin-mediated degradation of EMSY.
EMSY accumulation is responsible for the BRCAness phenotype of KEAP1 deficient cells
To evaluate if the inhibition of the KEAP1-mediated degradation of EMSY affects PARPi sensitivity, rather than silencing KEAP1 (which would affect the stability of multiple substrates), we generated a stable Emsy mutant that does not bind Keap1 and is insensitive to its degradation. Thus, we mapped the Keap1 binding motif in Emsy. Emsy contains 5 motifs that display homology with Nrf2 degron (ETGE) (Fig. S4A). Alanine substitution of the four amino acids in these five motifs showed that EEGE in position 871–874 is necessary for the interaction with Keap1 (Fig. 4A and Fig. S4B). Accordingly, compared to its wild type counterpart, levels of Emsy(EEGE/AAAA) were markedly elevated and did not oscillate upon induction of oxidative stress (Fig. 4B).
Figure 4. EMSY is responsible for the BRCAness phenotype of KEAP1-mutant tumors.

(A) KP cells were transfected for 24 hours with an EV or the indicated FLAG-tagged constructs. Cells were collected for immunoprecipitation (IP) and immunoblotting. WCE, whole-cell extract.
(B) KP cells infected with lentiviruses expressing wild-type Emsy or Emsy(EEGE/AAAA) were treated with H2O2, collected at the indicated times, and immunoblotted.
(C) The experiment was performed as in (B), except that cells were treated with NCS for 3 hours, fixed, and stained with DAPI and an anti-Rad51 antibody. A minimum of 300 cells were counted for each condition in 3 independent experiments (each with 3 technical repeats). Data are presented as mean ±SEM.
(D) The experiment was performed as described in Fig. 2D. Data represent mean ±SEM; n=10.
(E) Quantification of tumor weight from tumors described in (D).
(F) The indicated cell lines (5 × 10⁵ cells) were implanted subcutaneously into the flanks of 6- to 8-week-old C57BL/6J mice. Once tumors were measurable, the mice were divided into two groups, one treated with vehicle (shCTRL n=10; shEmsy n=10) and the other with talazoparib (PARPi) (shCTRL n=6; shEmsy n=8) for the indicated days. Tumor size was monitored twice a week. Mice were sacrificed by the end of the treatment. Data represent mean ±SEM.
(G) Quantification of tumor weight from tumors described in (F).
(H) DR-GFP U2OS cells were transfected with a non-targeting (NT) siRNA or the indicated siRNAs. Data are presented as fold change in frequency of repair of DR-GFP relative to the samples transfected with a NT siRNA. Each experiment was performed at least three times, each with triplicate measurements (±SEM).
Following genotoxic stress, formation of Rad51 foci, but not of pH2ax foci was impaired in KP cells expressing Emsy(EEGE/AAAA) (Fig. 4C and Fig. S4C), suggesting an impairment in HRR. Subcutaneously transplanted KP tumors stably infected with Emsy(EEGE/AAAA) displayed an impairment in their growth upon treatment with PARPi (Fig. 4D–E), similar to what we observed in KPK tumors (Fig. 2D–E, Fig. 2H–K, and Fig. S2J–K), indicating that EMSY protein levels are critical determinants of PARPi sensitivity.
We also found that Emsy silencing significantly decreased the sensitivity of KPK cells to PARPi in cultured cells (Fig. S4D–E). Moreover, in vivo depletion of Emsy completely rescued the PARPi sensitivity of KPK tumors, while KP tumors remained insensitive (Fig. 4F–G and Fig. S4F–G). In line with this finding, IHC analysis revealed that downregulation of Emsy rescued the accumulation of pH2ax in PARPi-treated KPK tumors (Fig. S4H), without affecting Ki67 levels (Fig. S4I).
Overall, the above results indicate that the BRCAness phenotype observed in Keap1-deficient cells is due to the stabilization of Emsy. Accordingly, co-silencing of EMSY in KEAP1-depleted DR-GFP cells rescued the HRR defects due to KEAP1 depletion (Fig. 4H).
KEAP1-dependent degradation of EMSY promotes type I interferon signaling
We noticed that depletion of Emsy induced a significant reduction of tumor burden in KPK tumors but not in KP tumors (Fig. 4F–G and Fig. S4F–G). This result suggested that while Emsy accumulation promotes genomic instability by inhibiting HRR, it also sustains KPK tumor growth without altering cell proliferation, as assessed by detecting Ki67 levels (Fig. S4I). In line with our in vitro results, gene set enrichment analysis (GSEA) of an RNA-seq transcriptional profiling showed a downregulation of both DSB repair and HRR in KPK tumors compared to KP tumors (Fig. S5A). Moreover, GSEA revealed a downregulation of an IFN signature in KPK tumors (Fig. S5A). Interestingly, GSEA also uncovered a significant enrichment of the IFN and the innate immune gene signatures upon Emsy silencing in KPK tumors, but not in KP shEmsy tumors (Fig. 5A). We also found that genes containing interferon-stimulated response element (ISRE) and genes regulated by the interferon-regulatory factors (IRFs) were the top enriched gene sets in KPK shEmsy compared to KPK shCTRL (Fig. 5B–C). This trend was not detected in shEmsy-expressing KP v. shCTRL-expressing KP tumors (Fig. S5B). These results are in line with reports showing that EMSY is a transcriptional repressor of ISGs (Ezell et al., 2012; Ezell and Tsichlis, 2012; Varier et al., 2016; Vire et al., 2014a) and indicate that in KEAP1-null tumors, the accumulation of EMSY negatively regulates IFN signaling. Intriguingly, GSEA analysis using TCGA patient data revealed that KEAP1-mutant tumors display a significant downregulation of genes involved in the interferon alpha response, the inflammatory response, as well as genes regulated by IRFs (Fig. 5D).
Figure 5. The KEAP1-dependent degradation of EMSY promotes type I interferon signaling.

(A) Top 50 most significant biological process up-regulated or downregulated in KPK tumors stably infected with shEmsy vs. shCTRL.
(B) Top transcription factor targets gene sets up-regulated in KPK tumors stably infected with shEmsy vs. shCTRL.
(C) Volcano plot comparing the expression of ISGs between KPK shEmsy and KPK shCTRL cells. Plotted for each transcript are the negative log10 of the p-value and the log2 of the fold change of gene expression. The blue dots represent genes with an FDR threshold of 5%. The red dots represent ISGs.
(D) GSEA of the indicated gene signatures between KEAP1 wild type and mutant tumors using RNA-seq data from TCGA.
(E) KP and KPK cells were treated with either poly(ISD) or poly(G:C), collected at the indicated times and immunoblotted.
(F) KP cells were treated with poly(G:C) before collection for IP under denaturing condition with an anti-Emsy antibody followed by immunoblotting. The bracket indicates a ladder of bands with a relative molecular mass of >170,000 corresponding to polyubiquitylated Emsy. WCE, whole-cell extract.
(G) KP and KPK cells were co-transfected with ISRE-Firefly luciferase reporter and Renilla luciferase. Eight hours post-transfection cells were treated with poly(G:C) for 16 hours prior luciferase activity quantification. ISRE-Firefly luciferase signal is expressed as fold change relative to Renilla luciferase. Data represent mean ±SEM. n=3.
(H) Experiment was performed as in (G), except that cells were treated with interferon alpha for 16 hours prior luciferase activity quantification.
(I) The indicated cell lines were treated with poly(G:C) for 16 hours. Relative expression levels of Ifnα gene was determined by qRT-PCR. Data are presented as means ±SEM. n=3.
(J) Experiment was performed as in (I). Interferon alpha was measured by ELISA. Data are presented as means ±SEM. n=3.
Taken together, these results indicate that Keap1-null tumors are characterized by suppression of the IFN response resulting from the stabilization of Emsy.
To test the ability of KP and KPK cells to induce an IFN response, we stimulated them with poly(G:C), a synthetic double-stranded DNA composed of repeating GC units. Poly(G:C) mimics viral infection and activates cGAS/STING-mediated production of IFN. We observed a Keap1-dependent degradation of Emsy upon stimulation with poly(G:C) (Fig. 5E and Fig. S5C), which was confirmed using poly(ISD) (Fig. 5E and Fig. S5C). Moreover, poly(G:C) induced a time-dependent ubiquitylation of Emsy concomitant with an increased binding to Keap1 (Fig. 5F and Fig. S5D–F). Poly(G:C)-mediated ubiquitylation of Emsy was abolished in Keap1-null cells (Fig. S5F). These results indicates that KEAP1 induces the ubiquitin-mediated degradation of EMSY in response to cytoplasmic DNA.
Since IFN signaling requires the cGAS/STING-mediated phosphorylation and nuclear translocation of the interferon-regulatory factors 3 (IRF3), we used an Irf3-dependent ISRE luciferase reporter to measure IFN activation. We observed a dramatic reduction in both Ifnα- and poly(G:C)-induced ISRE activation in KPK cells, but not in KP cells (Fig. 5G–H). Upon binding to DNA, cGAS produces cGAMP, which acts as a second messenger that binds and activates STING, which in turn stimulates the TBK1 complex, resulting in the phosphorylation and activation of the transcription factor IRF3 (Cai et al., 2014; Chen et al., 2016). We observed that poly(G:C) induced an upregulation of cGas protein levels (Fig. 5E) concomitant with the production of cGAMP (Fig. S5G) and phosphorylation of Sting and Tbk1 in both KP and KPK cells (Fig. 5E). Interestingly, while KP cells display a proper phosphorylation of Irf3, we observed an impairment in the nuclear translocation and phosphorylation of Irf3 in KPK cells (Fig. 5E and Fig. S5H–I). Similar results were obtained with poly(ISD) and in human cells (Fig. 5E and Fig. S5C). Poly(G:C) time course in Keap1 null cells revealed a pronounced decrease in the expression of Ifnα, IFN-stimulated cytokines (i.e. Ccl5 and Cxcl10) and ISGs (i.e. Isg15, Isg54, and Isg56) (Fig. S6A). Importantly, re-expression of Keap1 rescued both the mRNA expression and secretion of Ifnα in KPK cells (Fig. 5I–J), showing that Keap1 regulates type I interferon signaling.
IFN acts in a paracrine or autocrine manner, binding cell surface receptors and triggering the tyrosine phosphorylation and activation of STAT1 by JAK. Upon activation by phosphorylation, STAT1 dimerizes and translocates to the nucleus, promoting transcription of specific ISGs. We transferred conditioned media from poly(G:C)-treated KP or KPK cells to cultures of untreated KP or KPK cells. We found that untreated KP and KPK recipient cells displayed an increase in the levels of phospho-Stat1 (Y701) only when they were treated with media collected from poly(G:C)-treated KP cells, but not with media collected from poly(G:C)-treated KPK cells (Fig. S6B). This result suggests that, although Keap1-null cells are partially able to respond to IFNs, they are defective in the production and secretion of soluble IFNs.
Expression of a non-degradable Nrf2 mutant did not affect IFN signaling, while inducing, as expected, Nqo1 expression (Fig. S6C–D). In contrast, poly(G:C)-treated KP cells stably expressing a non-degradable Emsy displayed an impairment in both the mRNA expression and secretion of Ifnα (Fig. 6A and Fig. S6E). Accordingly, silencing of Emsy in KPK cells rescued Ifnα expression upon stimulation with poly(G:C) (Fig. 6B).
Figure 6. Emsy stabilization in Keap1-mutant tumors promotes lung cancer immune evasion.

(A) KP cells infected with lentiviruses expressing an EV or Emsy(EEGE/AAAA) were treated with poly(G:C) for 16 hours. Relative expression of Ifnα gene was determined by qRT-PCR. Data are presented as means ±SEM. n= 3.
(B) KP and KPK cells were infected with lentiviruses expressing shCTRL or shEmsy under the control of a doxycycline-inducible promoter, and treated with 0.2 μg/μL doxycycline for 72 hours. Cells were then treated with poly(G:C) for 16 hours. Relative expression levels of Ifnα gene was determined by qRT-PCR. Data are presented as means ±SEM. n= 3.
(C) The indicated cell lines (5 × 10⁵ cells) were implanted subcutaneously into the flanks of 6- to 8-week-old Prkdcscid; Il2rgtm1Wjl mice (NSG mice). Once tumors were measurable, the mice were treated with doxycycline-containing food (KP shCTRL n=10; KP shEmsy n=8; KPK shCTRL n=10; KPK shEmsy n=10) to induce shCTRL or shEmsy for the indicated days. Tumor size was monitored twice a week. Mice were sacrificed by the end of the treatment. Data represent mean ±SEM.
(D) Quantification of tumor weight from tumors described in (C).
(E) The indicated cell lines (5 × 10⁵ cells) were implanted subcutaneously into the flanks of 6- to 8-week-old mice with the indicated genetic background. Once tumors were measurable, the mice were treated with doxycycline-containing food (n=9–10/group) to induce shCTRL or shEmsy for the indicated days. Tumor size was monitored twice a week. Mice were sacrificed by the end of the treatment. Data represent mean ±SEM.
(F) Quantification of tumor weight from tumors described in (E).
(G) Waterfall plot showing percentage of tumor growth in C57BL/6J mice orthotopically implanted with KP and KPK lung tumors and treated with doxycycline 5 days post implantation to induce shCTRL or shEmsy expression. Tumor size was determined 5 days post-implantation (initial measurement) and 15 days of doxycycline treatment (final measurement). Each column represents one tumor (KP shCTRL n=12; KP shEmsy n=15; KPK shCTRL n=12; KPK shEmsy n=12).
(H) FACS analysis of Cd206 levels within the Cd11b+, Gr1- cells (M2-like TAMs) among the total tumor infiltrating Cd45+ cells in the tumors described in (G).
(I) FACS analysis of Cd8+ (as fraction of Cd3+ T-cells) cells among the total tumor infiltrating Cd45+ cells in the tumors described in (G).
Taken together, these results suggest that the KEAP1-dependent degradation of EMSY is crucial for efficient activation of a type I interferon response.
Stabilization of Emsy in Keap1-mutant tumors promotes lung cancer immune evasion by suppressing type I interferon signaling
We reasoned that suppression of IFN signaling caused by EMSY accumulation could contribute to the immune evasion observed in KEAP1-null NSCLCs (Cristescu et al., 2018; Papillon-Cavanagh et al., 2020). Thus, we asked whether Emsy downregulation was able to impair the growth of KPK tumors in the absence of a functional immune system. We found that in immunodeficient mice (Prkdcscid; Il2rgtm1Wjl, NSG mice), shEmsy KP and KPK tumors display a growth comparable to that of shCTRL tumors (Fig. 6C–D). This is in contrast to what we observed in immunocompetent C57BL/6J mice (Fig. 4F–G). These findings suggest that the compromised growth of Keap1-null tumors following Emsy depletion is dependent on a functional immune system. Emsy knockdown did not affect the in vitro proliferation of KP and KPK cells (Fig. S6F). The lack of any effect on cell proliferation both in vitro and in NSG mice is in agreement with the hypothesis that Emsy deficiency impairs tumor growth in a non-cell autonomous manner.
Next, we employed type-I interferon-α/β receptor (Ifnar1) knockout mice, which display severely attenuated IFN/JAK-STAT signaling and defective innate immunity. In this model, type-I interferon receptor signaling can be intact in transplanted tumor cells, but it is deficient in the mouse tumor microenvironment (TME). While the growth defect due to Emsy depletion in KPK tumors was maintained in Ifnar1 wild type littermates, the growth of KPK tumors was not significantly affected by Emsy depletion in Ifnar1 null mice (Fig. 6E–F). These findings corroborate the hypothesis that the tumor suppressive effects of Emsy depletion on KPK tumors rely on a functional type I interferon response in the TME and further reinforce the mechanistic connection between EMSY-mediated immune evasion and IFN signaling.
Consistent with a role of Emsy in promoting lung cancer immune evasion, shEmsy KPK lung tumors displayed an impairment in their growth compared to shCTRL KPK tumors in an immunocompetent orthotopic model (Fig. 6G). Upon examination of the immune infiltrate, relative to KP controls, KPK tumors exhibited a significant increase in expression of Cd206+, a marker associated with M2-like pro-tumorigenic macrophages, and a significant decrease in tumor-infiltrating Cd8+ T cells and overall leukocytes (Fig. 6H–I and Fig. S6G), consistent with global immune-suppression reported in the TME of KPK tumors. Emsy knockdown in KPK tumors reversed the increase in Cd206+ M2-like macrophages and restored the Cd8+ T cell population, strongly suggesting that the immune-suppressive phenotype of KPK tumors is Emsy-dependent. Emsy knockdown in KPK tumors also resulted in overall increase in the expression of IFN signaling-activating markers (pTbk1 and pIrf3) in various myeloid populations (Fig. S6H–J).
Taken together, these results suggest that overexpression of Emsy in Keap1-mutant tumors promotes cancer immune evasion through the suppression of type I interferon signaling.
Reactivation of type I interferon response using a STING agonist negatively impacts Keap1-null tumor growth
Activation of the STING pathway with STING agonist (STINGa) not only promote type I IFN production in cancer cells, but also directly activate anti-tumor immune cells and stimulate the trafficking and infiltration of T cells to the TME (Zhu et al. (2019). Thus, we hypothesized that activating a type I interferon response in the TME through STING engagement could stimulate an innate and adaptive immune response. Thus, we evaluated the therapeutic potential of the STINGa DMXAA (Daei Farshchi Adli et al., 2018) in an orthotopic setting. We observed that KPK lung tumors, but not KP lung tumors, displayed sensitivity to STINGa (Fig. 7A). We then conducted 10x single-cell RNA-seq (scRNA-seq) of KP and KPK tumors to evaluate changes in the TME. A total of 7,586 live leukocytes (Cd45+, PI neg) were analyzed, including macrophages, neutrophils, monocytes, dendritic cells, Cd4+ T cells, Cd8+ T cells, NK cells, B cells, and other less abundant lineages. The distribution of cellular clusters was at first determined using the tSNE algorithm with each cluster identified by a distinct color (Fig. S7A and Table S1). Cell identities were determined using characteristic gene markers across all conditions (Fig. S7B and Table S2). However, using tSNE analysis alone, it was difficult to visualize a clear separation between certain lymphocytic and NK clusters. We therefore employed K-nearest-neighbor-based Network graph drawing Layout (KNetL) analysis to display a better separation of leukocytes (Fig. 7B). Relative fractional comparison revealed a significant expansion of pro-tumorigenic immune populations in untreated KPK tumors relative to untreated KP controls, such as M2-like macrophages (Cluster 6) and Neutrophils (Cluster 15), and a contraction of anti-tumor immune cells, such as memory T cells (Cluster 17) (Fig. 7C). STINGa treatment reversed the expansion of mediators of immune-suppression observed in KPK tumors (Fig. 7C). Furthermore, KPK tumors treated with STINGa displayed a significant increase in IFN-induced dendritic cells (Cluster 8), NK cells (Cluster 10), memory T cells and activated T cells (Clusters 17, 19) (Fig. 7C).
Figure 7. STING agonist, alone or in combination with PARPi, as a therapeutic strategy for KEAP1 mutant tumors.

(A) Waterfall plot showing the percentage of tumor growth in C57BL/6J mice orthotopically implanted with KP and KPK lung tumors and treated 5 days post implantation with vehicle or DMXAA (STINGa). Tumor size was determined 8 days post-implantation (initial measurement) and 15 days of drug treatment (final measurement). Each column represents one tumor (KP vehicle n=13; KP STINGa n=12; KPK vehicle n=15; KPK STINGa n=12).
(B) KNetL plot showing cluster separation of 21 live leukocyte subsets isolated from orthotopically implanted KP and KPK lung tumors treated with STINGa or vehicle, and analyzed by 10x single cell RNA sequencing (scRNA-seq) (n=3 mice/group).
(C) Relative proportional analysis of Clusters 6, 8, 10, 15, 17 and 19 as a fraction of total tumor immune infiltrate in each treatment group from the tumors described in (B) based on sc-RNA seq.
(D) FACS analysis of phospho-Tbk1 (pTbk1) levels within the Cd11b+, Gr1+ (MDSCs) cells among the total tumor infiltrating Cd45+ cells in the tumors described in (A).
(E) FACS analysis of Cd3+ (T-cells) cells among the total tumor infiltrating Cd45+ cells in the tumors described in (A).
(F) KPK cell lines (5 × 10⁵ cells) were implanted subcutaneously into the flanks of 6–8-week-old C57BL/6J mice. Once tumors were measurable, mice were randomized and treated with the indicated drugs. Tumor size was monitored twice a week. Mice were sacrificed by the end of the treatment. Data represent mean ±SEM. n=10.
(G) Quantification of tumor weight from tumors described in (F).
(H) Model of KEAP1-dependent regulation of EMSY levels in NSCLC.
We also performed FACS analysis on the lungs of KP and KPK tumor-bearing animals. We found that untreated KPK tumors exhibited a significant reduction in Cd3+ T cell infiltrate and IFN-signaling pTbk1 in myeloid cells compared to KP controls (Fig. 7D–E). STINGa administration increased the proportion of tumor infiltrating T cells and pTbk1 expression in myeloid cells in KPK tumors, but had no effect on these populations in KP tumors. STINGa treatment did not affect the in vitro viability of either KP or KPK cells (Fig. S7C), in agreement with the idea that STINGa acts through the immune cells and not directly on the cancer cells. Altogether, these data suggest that the activation of IFN signaling upon STINGa treatment could influence both the innate and adaptive immune responses, in agreement with the role of IFN in bridging these two responses (Snell et al., 2017).
Next, we investigated the efficacy of STINGa in combination with PARPi, aiming to exploit both vulnerabilities of Keap1-null tumors (i.e., the BRCAness phenotype and the impaired IFN signaling). In line with previous results, when administered as single agents, STINGa and PARPi elicited a reduction in the growth of KPK tumors (Fig. 7F–G), but not KP tumors (Fig. S7D–E). The combination treatment displayed a further reduction in the burden of KPK tumors, which coincided with an increase in apoptotic cell death (Fig. 7F–G and Fig. S7F).
Taken together, these results support the rationale for combining treatment with PARPi (which induces the death of cancer cells) and STING agonist (which activate the immune cells) in NSCLC tumors with inactivating mutations in KEAP1.
DISCUSSION
Our results reveal that loss of KEAP1 induces defects in HRR, which may explain, at least in part, the high TMB observed in KEAP1-mutated NSCLCs. Mechanistically, the inability of KEAP1 null cells to properly execute HRR is driven by the accumulation of EMSY, which is a pro-oncogenic chromatin remodeler that promotes a BRCAness phenotype (Jelinic et al., 2017; Kondrashova and Scott, 2019; Livingston, 2004). In line with the well-established synthetic lethality between HRR defects and PARPis, we demonstrate that KEAP1-null tumor cells are sensitive to PARPis both in vitro and in vivo.
Despite TMB being an important determinant of immunotherapy response, NSCLCs are often resistant to ICB, particularly the KEAP1-mutated subtype (Bagaev et al., 2021; Cristescu et al., 2018; Papillon-Cavanagh et al., 2020). We found that the accumulation of EMSY promotes the growth of KEAP1-mutated tumor cells in vivo, but not in vitro. Stabilization of EMSY in KEAP1-null cells compromises activation of the IFN response, thereby suppressing innate immunity and promoting cancer immune evasion. In agreement with our findings, it has been reported that EMSY is a transcriptional repressor of ISGs to control antiviral immunity (Ezell et al., 2012; Ezell and Tsichlis, 2012).
We reasoned that activation of the IFN response in the TME with STING agonists may counteract the pro-oncogenic activity of EMSY in the cancer cell and stimulate anti-tumor immunity. Indeed, we found that orthotopically implanted KPK lung tumors displayed sensitivity to the FDA approved STING agonist DMXAA due to an engagement of anti-tumor immune signaling in the TME. KP tumors do not have a defective IFN pathway; therefore, this does not appear to be a vulnerability in this tumor type.
We demonstrate that stabilization of EMSY, and not the accumulation of NRF2, is responsible for both the BRCAness phenotype and the suppression of IFN signaling observed in Keap1-null cells. Therefore, our findings implicate an unexpected, NRF2-independent role for KEAP1 in suppressing IFN-dependent immune responses.
In summary, we have identified a molecular mechanism by which mutations in KEAP1 promote lung cancer immune evasion. Specifically, loss of KEAP1 induces stabilization of EMSY, which in turn produces a BRCAness phenotype characterized by HRR defects (Fig. 7H) and sensitivity to PARPi. The defect in HRR contributes to an increased TMB, which is known to activate the innate immune pathways. However, we found that the accumulation of EMSY observed in KEAP1-null cells negatively regulates the IFN response, suppressing innate immunity and promoting immune evasion (Fig. 7H). Thus, the stabilization of EMSY in KEAP1-null cells results in two synergistic, pro-oncogenic phenotypes that drive tumor progression by promoting both genome instability and suppression of the innate immunity.
Limitations of the Study
We showed that loss of KEAP1 leads to EMSY accumulation with consequent inhibition of HRR, as well as the IFN response and innate immunity. EMSY is thought to regulates HRR by physically interacting with BRCA2. EMSY is also a transcriptional repressor that is part of several chromatin-bound complexes, in agreement with our observation that EMSY inhibits the IFN response at a transcriptional level. BRCA2 also plays a role in transcriptional regulation. So, it is possible that EMSY’s role in regulating DDR and innate immunity involves its ability to form distinct chromatin-bound complexes (including with BRCA2) with specific functions. The characterization of these complexes and the DNA regions they bind will require further work. We also observed an impairment in the nuclear translocation and phosphorylation of Irf3 in KPK cells. These defects may be due to Irf3’s inability to bind repressed target genes, which in turn promotes its de-phosphorylation. Additional investigations are necessary to evaluate this hypothesis.
STAR Methods
RESOURCE AVAILABILITY
Lead Contact
Further information and requests for reagents may be directed to and will be fulfilled by the lead contact Michele Pagano (michele.pagano@nyumc.org).
Materials availability
Further information and requests for reagents may be directed to, and will be fulfilled by Dr. Michele Pagano (michele.pagano@nyumc.org). A list of critical reagents (key resources) is included in the Key resources table. Relevant plasmids are available to the academic community. For additional materials, please email the lead contact for requests. Some material may require requests to collaborators and/or agreements with various entities.. Material that can be shared will be released via a Material Transfer Agreement.
Data and Code Availability
Single-cell RNA-seq and RNA-seq data have been deposited at GEO and are publicly available as of the date of publication. Accession numbers are listed in the key resources table. Original western blot images have been deposited at Mendeley and are publicly available as of the date of publication. The DOI is listed in the key resources table.
This paper does not report original code.
Any additional information required to reanalyze the data reported in this paper is available from the lead contact upon request.
EXPERIMENTAL MODEL AND SUBJECT DETAILS
Cell Culture Procedures
HEK293T (female), H2009 (female), KP0 (female), KP (female), and KPK (female) cell lines were propagated in DMEM; DR-GFP U2OS (female), and U2OS (female) cell lines were propagated in McCoy’s Media. All media were supplemented with 10% fetal bovine serum (FBS) (Corning Life Sciences) and 1% penicillin/streptomycin/L-glutamine (Corning Life Sciences). Talazoparib (Selleck) was used at the indicated concentrations. Hydrogen peroxide (H2O2) (Sigma-Aldrich) was used at 200 μM, Doxorubicin (Sigma-Aldrich) was used at 5 μM, Neocarzinostatin (Sigma-Aldrich) at 100 ng/mL, MLN4924 (Active Biochem) at 2 μM and MG132 (Peptides International) at 10 μM. 6× 10⁵ cells were transfected with 2 μg of poly(G:C) or poly(ISD). Cells were periodically screened for Mycoplasma contamination. No cell lines used in this study were found in the database of commonly misidentified cell lines that is maintained by ICLAC and NCBI Biosample. Specific details about cell lines used are provided in the Key Resource Table.
KEY RESOURCES TABLE
| REAGENT or RESOURCE | SOURCE | IDENTIFIER |
|---|---|---|
| Antibodies | ||
| Cleaved-CASPASE3 (1:1000) | Cell Signaling Technology | cat No. 9661S |
| Cleaved-PARP1 (1:1000) | Cell Signaling Technology | cat No. 5625S |
| EMSY (1:100) | Atlas Antibodies | cat No. HPA050777 |
| EMSY (1:1000) | Proteintech | cat No. 26212-1-AP |
| FLAG (1:2000) | Sigma-Aldrich | cat No. F7425 |
| HA (1:2000) | Bethyl | cat No. A190–108A |
| HO1 (1:1000) | Bethyl | cat. No. A303–662A |
| KDM5A (1:1000) | Bethyl | cat. No. A300–897A |
| KU70 (1:1000) | Santa Cruz Biotechnology | cat. No. sc-9033 |
| KEAP1 (1:1000) | Proteintech | cat. No. 11018-1-AP |
| Histone H3 (1:30000) | Abcam | cat. No. ab1791 |
| MCM2 (1:1000) | Santa Cruz Biotechnology | cat. No. sc-9839 |
| MYC (1:1000) | Bethyl | cat. No. A190–105A |
| NRF2 (1:1000) | Cell Signaling Technology | cat. No. 12721S |
| p21 (1:1000) | Cell Signaling Technology | cat. No. 2947S |
| PARP1 (1:1000) | Cell Signaling Technology | cat. No. 9542S |
| PCNA (1:1000) | Santa Cruz | cat. No. sc-9857 |
| PGAM5 (1:1000) | Novus Biologicals | cat. No. NBP1–92257 |
| pH2AX (S139) (1:1000) | Cell Signaling Technology | cat. No. 9718S |
| pSTAT1 (Y701) | Cell Signaling Technology | cat. No. 9167S |
| RAD51 (1:200) | GeneTex | cat. No. GTX70230 |
| RAD51 (IF 1:400, WB 1:1000) | Santa Cruz Biotechnology | cat. No. sc-8349 |
| RAD51C (1:1000) | Bethyl | cat. No. A302-645A-T |
| SKP1 (1:5000) | Michele Pagano Laboratory | Yenzyme |
| TBK1 (1:1000) | Cell Signaling Technology | cat. No. 38066S |
| VINCULIN (1:1000) | Bethyl | cat. No. A302–535A |
| Bacterial and Virus Strains | ||
| NEB5-alpha | Promega | cat. No. C2992H |
| Biological Samples | ||
| Patient-derived xenografts (PDX) | Champion’s Oncology https://www.championsoncology.com | (Gardner et al., 2017) |
| Chemicals, Peptides, and Recombinant Proteins | ||
| Doxorubicin (5 μM) | Sigma-Aldrich | cat. No. D1515 |
| Doxycycline | Sigma-Aldrich | cat. No. D9891 |
| Interferon alpha (mouse) | Sigma-Aldrich | cat. No. 8782 |
| Hydrogen peroxide (200μM) | Sigma-Aldrich | cat. No. H1009 |
| KI696 (1 μM) | Craig Thomas Laboratory | N/A |
| Lipofectamine 3000 | Invitrogen | cat. No. L3000150 |
| Lipofectamine RNAi Max | Invitrogen | cat No. 13778–500 |
| MG132 (10 μM) | Peptides International | cat. No. IZL-3175v |
| MLN4924 (2 μM) | Active Biochem | cat. No. A-1139 |
| Neocarzinostatin (100 ng/mL) | Sigma-Aldrich | cat. No. N9162 |
| Olaparib | Selleck Chemicals | cat. No. 50-864-1 |
| PJ34 | Tocris | cat. No. 3255 |
| Poly(ethylene glycol) 300 (PEG300) | Sigma-Aldrich | cat. No. 202371 |
| Poly(G:C) | Invivogen | cat. No. tlrl-pgcn |
| Poly(ISD) | Invivogen | cat. No. tlrl-isdn |
| Polybrene (8mg/mL) | Sigma-Aldrich | cat. No. TR-1003 |
| Puromycin | Sigma-Aldrich | cat. No. P9620 |
| Talazoparib | Selleck Chemicals | cat. No. S7048 |
| Triamcinolone acetonide (TCA, 0.2 μM) | Sigma-Aldrich | cat. No. T6501 |
| Vadimezan (DMXAA) | Selleck Chemicals | cat. No. S1537 |
| Veliparib | Selleck Chemicals | cat. No. S1004 |
| Critical Commercial Assays | ||
| Alamar blue | Biorad | cat. No. BUF012B |
| Mouse IFN-alpha ELISA Kit | R&D Systems | cat. No. 42120-1 |
| Deposited Data | ||
| Original images of western blot data | This study; Mendeley Data | DOI: 10.17632/8xs7xfjmrk.1 |
| Proteomic data | This study | N/A |
| RNA sequencing data | This study, GSE databse | GSE164872 |
| Single cells RNA sequencing data | This study, GSE databse | GSE178503 |
| Experimental Models: Cell Lines | ||
| KP cells (KrasG12D/+; Trp53−/−) (female) | Papagiannakopoulos Laboratory | N/A |
| KPK cells (KrasG12D/+; Trp53−/−; Keap1−/−) (female) | This study | N/A |
| H2009 (female) | ATCC | cat No. CRL-5911 |
| HEK293T (female) | ATCC | cat. No. CRL-3216 |
| U2OS (female) | ATCC | cat. No. HTB-96 |
| U2OS DRGFP (female) | ATCC | cat. No. CRL-3455 |
| Experimental Models: Organisms/Strains | ||
| B6(Cg)-Ifnar1tm1.2Ees/J | Jackson Laboratory | Stock No. 028288 |
| C57BL/6J | Jackson Laboratory | Stock No. 000664 |
| NOD.Cg-Prkdcscid Il2rgtm1Wjl/SzJ | Jackson Laboratory | Stock No. 005557 |
| Oligonucleotides | ||
| KEAP1 siRNA oligo #1: GGACAAACCGCCUUAAUUC | Dharmacon | cat No. J-012453-05 |
| KEAP1 siRNA oligo #2: CAGCAGAACUGUACCUGUU | Dharmacon | cat No. J-012453-06 |
| KEAP1 siRNA oligo #3: GGGAGUACAUCUACAUGCA | Dharmacon | cat No. J-012453-07 |
| KEAP1 siRNA oligo #4: CGAAUGAUCACAGCAAUGA | Dharmacon | cat No. J-012453-08 |
| Emsy shRNA lentiviral vector #1 | Dharmacon | cat No. V3SM11253-237523448 |
| Emsy shRNA lentiviral vector #2 | Dharmacon | cat No. V3SM11253-234606347 |
| Recombinant DNA | ||
| I-SceI-GR-RFP | Addgene | cat. No. 17654 |
| pGL4.45[luc2P/ISRE/Hygro] | Promega | cat. No. 9PIE414 |
| pRL Renilla Luciferase | Promega | cat. No. E2231 |
| pcDNA3.1 2xFLAG-2xSTREP-Emsy (mouse) | Michele Pagano Laboratory | N/A |
| pcDNA3.1 2xFLAG-2xSTREP-EMSY (human) | Michele Pagano Laboratory | N/A |
| pcDNA3.1 2xFLAG-2xSTREP-Keap1 (mouse) | Michele Pagano Laboratory | N/A |
| pcDNA3.1 2xFLAG-2xSTREP-KEAP1 (human) | Michele Pagano Laboratory | N/A |
| Software and Algorithms | ||
| Prism 7- GraphPad | GraphPad Software | https://www.graphpad.com/scientificsoftware/prism/ |
| Other | ||
In vivo tumorigenesis
Female C57BL/6J, NOD.Cg-Prkdcscid Il2rgtm1Wjl/SzJ and B6(Cg)-Ifnar1tm1.2Ees/J mice (Jackson Laboratories) were housed in pathogen-free rodent facilities at NYU Langone Health. All supplies (cages, chow, and sterile water) were autoclaved, and mice were housed in sterile conditions within high-efficiency particulate arrestance filtered micro-isolators and fed with irradiated food and acidified water. All experiments were conducted according to standard protocols outlined by the University Committee on the Use and Care of Animals. 5×10⁵ cells were implanted subcutaneously into 6- to 8-week-old female mice. After tumor establishment phase, approximately 7–10 days post implantation (tumors 100–150mm3), mice were randomized and assigned to groups: vehicle, PARPi, STING agonist (DMXAA) and combinational treatment. Animals were treated with 0.66 mg/kg Talazoparib (Selleck) or vehicle once a day administered through intraperitoneal injection. 8 mg/kg dose of DMXAA (Selleck) was administered every other day through intraperitoneal injection. Talazoparib, and vehicle containing 4% DMSO 30% polyethylene glycol (PEG) and 60% saline was formulated daily. Tumors were monitored biweekly and animals were euthanized by the end of treatment or when the tumors reached an average of 2000 mm3. The tumor volume data of all the subcutaneous experiments were obtained by caliper measured and it was calculated using the following equation: volume = 0.5 × (L × W × H), where L = length, W = width, and H = height. All mice that reached the endpoint of the experiment were euthanized and tumors excised, weighed and protein extracts prepared for immunoblotting. For the orthotopic experiments, 5×10⁴ luciferase-positive cells were implanted intratracheally into 8- to 12-week-old female mice (15/group). Five days post-implantation mice were randomized and assigned to treatments groups (see above). To calculate the initial tumor size, mice were monitored using an in vivo imaging system (IVIS) 5 or 8 days post-implantation as described in the Figure legends. Tumors were then monitored twice a week using IVIS, and animals were euthanized either at the end of treatment (i.e., 15 days of treatment; final measurement) or when animals displayed severe signs of distress. For each IVIS measurement, we used 60” acquisition time. Next, a region of interest (ROI) was manually selected over relevant regions to quantify luminescence signal intensity. The area of the ROI was kept constant within experiments and the intensity was recorded as total photon counts per second per cm2 within a ROI. Data were expressed as % tumor growth, calculated using the following equation: % tumor growth = [(Final measurement - Initial measurement)/Initial measurement] × 100. Mice that died before the last IVIS measurement were not included in the calculation of the % tumor growth. PDXs were revived and passaged once in NSG mice, and a live 2×2 mm piece of tumor was surgically transplanted subcutaneously into recipient NSG mice under anesthesia. After 4–6 weeks of engraftment, mice harboring measurable tumors (50–100 mm3) were randomized to receive either vehicle or PARPi. Details on the generation of PDXs have been previously described (Gardner et al., 2017). CTG-1194: KRASG12A;ATME2164K; CTG-743: KRASG12S;TP53S215R;KEAP1H311R.
METHOD DETAILS
Gene Silencing by siRNA and shRNA
Following siRNA (GE Healthcare) was used: ON-TARGETplus smart pool siRNA oligos targeting KEAP1. The siRNA oligos were transfected into different cell lines using RNAi Max (Invitrogen). Following shRNA (GE Healthcare) was used: SMARTvector Lentiviral shRNA targeting mouse Emsy. Specific details about both siRNA and shRNA oligos used are provided in Key Resource Table.
Homologous Recombination repair assay
I-SceI-based reporter assays were used to measure the efficiency of repair by HR, as described (Bennardo et al., 2008; Gunn and Stark, 2012; Pierce et al., 1999). DR-GFP-U2OS cells obtained from Maria Jasin and Jeremy Stark labs. Cells were plated and, after 24 hours, treated with indicated siRNA oligos using RNAi Max (Invitrogen) according to manufacturer specifications; cell culture media was changed after overnight incubation. Three hours later, cells were transfected with the I-SceI-GR-RFP plasmid (a gift from Tom Misteli, Addgene plasmid # 17654); cell culture media was changed after 5 hours. Three hours later, a second siRNA knockdown was applied to cells and left overnight. Cell culture media was again changed and 0.2 mM triamcinolone acetonide (TCA, Sigma-Aldrich) was applied. After 24 hours, flow cytometry analysis was performed using a BD LSR II HTS Analyzer, and samples were quantified for the percentage of RFP positive cells that were also GFP positive.
Immunohistochemistry
Mice were euthanized by carbon dioxide asphyxiation. Tumors were collected, fixed overnight, transferred to 70% ethanol, and subsequently embedded in paraffin. Sections were cut at a thickness of 3 μm and stained with H&E for pathological examination. Chromogenic IHC was performed on a Ventana Medical Systems DISCOVERY XT instrument with online deparaffinization using Ventana’s reagents and detection kits and antigen retrieved in Ventana Cell Conditioner 1 or 2. The following antibodies were used for IHC: anti-Ki67 (Clone D3B5, CST 9129S), anti-pH2AX (S139) (Clone 20E3, CST 9718S). HRP detection was used and antigen retrieval was performed in a Ventana Cell Conditioner 1 (TBE). Clinical lung cancer samples from NYU biospecimen core that were KEAP1 mutant or KEAP1 wild-type were probed with antibodies against EMSY (Atlas Antibodies, HPA050777). Analysis and scoring of mouse samples was performed by automated image analysis software ImmunoRatio (version 1.0c) (Institute of Biomedical Technology, University of Tampere, Tampere, Finland). Analysis and scoring of human samples was performed by visually determining the intensity of nuclear immunoreactivity for EMSY. Pictures were obtained using an Olympus BX51 fitted with DP27 camera.
Immunofluorescence microscopy
Cells were permeabilized with cold CSK buffer containing 0.5% Triton X-100, washed with PBS, and fixed with 4% paraformaldehyde (PFA, Electron Microscopy Sciences) prior to blocking. Cells were blocked with 3% BSA in PBS before incubation with indicated primary antibodies. Alexa-555 or Alexa-488-conjugated secondary antibodies (Life Technology Corporation) were added for 1 hour at 1:2000 dilution. Slides were mounted in ProLong™ Gold with DAPI (Invitrogen). Imaging was performed using a DeltaVision Elite inverted microscope system (Applied Precision), using a x100/1.4NA Oil PSF Objective from Olympus. The system was equipped with a CoolSNAP HQ2 camera and SoftWorx imaging software version 5.0. Serial optical sections obtained 0.2-μm apart along the z-axis were processed using the SoftWorx deconvolution algorithm and projected into one picture using SoftWorx software (Applied Precision).
Immunoprecipitation and immunoblotting
HEK293T cells were transiently transfected using polyethylenimine. Where indicated, 48 hours after transfection, HEK293T cells were incubated with MG132 for 4 hours before collection. Cell lysis was carried out with lysis buffer (50 mM Tris pH 8.0, 250 mM NaCl, 10% glycerol, 1 mM EDTA, 50 mM NaF, and 0.5% NP-40) supplemented with protease and phosphatase inhibitors. Lysates were then immunoprecipitated with anti-FLAG antibody conjugated to agarose. Elution of the immunoprecipitated for anti-FLAG agarose resin was carried out with FLAG peptide. Immunoblotting was performed as previously described (Marzio et al., 2019). Briefly, samples were resolved under denaturing and reducing conditions using 4–12% Bis-Tris gels (NuPAGE®) and transferred to a PVDF membrane (Immobilon-P, Millipore). Membranes were blocked with 5% nonfat dried milk, incubated with primary antibodies overnight at 4°C. After washing the membranes, secondary antibodies coupled with horseradish peroxidase were applied (Amersham-GE). Immunoreactive bands were visualized by enhanced chemiluminescence reagent (Thermo Fisher Scientific) and signal was acquired using ImageQuant LAS 400 (GE).
Lentivirus-Mediated gene transfer
HEK293T were transiently co-transfected with lentiviral (pLVX or pTRIPZ) vectors containing vesicular stomatitis virus G protein (VSV-G) and the gene of interest along with pCMV-Delta R8.2 using Lipofectamine 3000. Lentivirus-containing medium, 48 hours after transfection, was collected and supplemented with 8 mg /mL Polybrene (Sigma). KP or KPK cells were infected by replacing the cell culture medium with the viral supernatant for 6 hours. Selection of stable clones was carried out using puromycin.
Mass Spectrometry
Preparation of Affinity Purification Samples for Mass Spectrometry. Samples and empty vector control were resuspended in NuPAGE® LDS Sample Buffer (Novex). The samples were reduced with 2 μL of 0.2M dithiothreitol (Sigma) for one hour at 57°C at pH 8.0 and subsequently alkylated with 2 μL of 0.5M iodoacetamide (Sigma) for 45 minutes at room temperature in the dark. The samples were loaded immediately onto a NuPAGE® 4%–12% Bis-Tris Gel 1.0 mm (Life Technologies) and run at 200V. The gel was stained with GelCode Blue Stain Reagent (Thermo). The gel plugs were excised and de-stained in a 1:1 (v/v) solution of methanol and 100mM ammonium bicarbonate. The gel plugs were incubated with 250ng of sequencing grade modified trypsin (Promega) in 100mM ammonium bicarbonate. The gel plugs were digested overnight with gentle agitation. The digestion was halted by adding a slurry of R2 50 μm Poros beads (Applied Biosystems) in 5% formic acid and 0.2% trifluoroacetic acid (TFA) to each sample (Cristea et al., 2005). The samples were allowed to shake at 4°C for 2 hours. The beads were loaded onto C18 ziptips (Millipore), equilibrated with 0.1% TFA. The beads were washed with 0.5% acetic acid. Peptides were eluted with 40% acetonitrile in 0.5% acetic acid followed by 80% acetonitrile in 0.5% acetic acid. The organic solvent was removed using a SpeedVac concentrator and the sample reconstituted in 0.5% acetic acid.
Mass Spectrometry Analysis Affinity Purification. An aliquot of each sample was loaded onto an Acclaim PepMap trap column (75 μm ID × 2cm, 3 μm bead size, 100Å pore size) in line with an EASY-Spray PepMap analytical column (75 μm ID × 50cm C18, 2 μm bead size, 100Å pore size) using the auto sampler of an EASY-nLC 1000 HPLC (ThermoFisher) and solvent A (2% acetonitrile, 0.5% acetic acid). The peptides were eluted into a ThermoFisher Scientific Orbitrap Fusion Lumos Mass Spectrometer increasing from 5% to 35% solvent B (80% acetonitrile, 0.5% acetic acid) over 60 minutes, followed by an increase from 35% to 45% solvent B over 15 minutes followed by an increase of 45 to 100% solvent B in 10 minutes.
High resolution full MS spectra were obtained with a resolution of 120,000, an AGC target of 4e5, with a maximum ion time of 50ms, and a scan range from 400 to 1500 m/z. Following each full MS scan, low resolution MS/MS spectra were acquired for a 3s duty cycle. The MS/MS spectra were collected in the ion trap in rapid scan mode, with an AGC target of 1e5, maximum ion time of 30ms, one microscan, 2 m/z isolation window, Normalized Collision Energy (NCE) of 32 and a dynamic exclusion of 30 ms.
Data Analysis. All acquired MS2 spectra were searched against a UniProt human database using Sequest within Proteome Discoverer (Thermo Scientific). The search parameters were as follows: precursor mass tolerance ± 10 ppm, fragment mass tolerance ± 0.4 Da, digestion parameters allowing trypsin 2 missed cleavages, fixed modification of carbamidomethyl on cysteine, variable modification of oxidation on methionine, and variable modification of deamidation on glutamine and asparagine. Peptides were filtered to better than 1% FDR using a target-decoy database strategy and proteins require at least two unique peptides to be reported.
Sample preparation for multiplexed quantitation, 500 μg of each protein lysates (obtained using a buffer: 20 mM HEPES pH 8.0, 8 M urea) were reduced using dithiothreitol (5 μL of 0.2 M) for 1 hours at 55°C. The reduced cysteines were subsequently alkylated with iodoacetamide (5 μL of 0.5 M) for 45 minutes in the dark at room temperature. The samples were digested with LysC at a 200:1 (protein:enzyme) ratio for 2 hours at 37°C. Next, 100 mM ammonium bicarbonate (pH 8.0) was added to dilute the urea concentration to 2 M and the protein lysates were digested with trypsin (Promega) at a 100:1 (protein:enzyme) ratio overnight at room temperature. The digested protein lysates was acidified to pH < 3 using trifluoroacetic acid (TFA) and desalted using C18 solid-phase extraction (Sep-Pak, Waters). The desalted peptides were eluted using first 40% acetonitrile (ACN) in 0.5% acetic acid followed by 80% acetonitrile (ACN) in 0.5% acetic acid. The peptide eluate was concentrated using the SpeedVac and stored at −80°C.
Mouse Cellular Preparation, Flow Cytometry, and FACS
Mice were sacrificed and lungs were perfused using sterile PBS through heart perfusion. Whole lungs were harvested and minced with scissors to sub-millimeter pieces in cold 2% FACS (PBS with 2% FBS) with Collagenase D (1 mg/mL; Worthington Biochemical, Lakewood, NJ), and DNase I (2 U/mL; Promega, Madison, WI), as previously described (Deng et al., 2018). Tissues were then incubated at 37°C for 30 minutes with gentle shaking every 5 minutes. Specimens were passed through a 70μm mesh and centrifuged at 350g for 5 minutes and subsequently underwent red blood cell lysis with 1x RBC Solution (Biolegend) for 90 seconds, quenched with PBS and centrifuged again at 350 g for 5 minutes. Cell pellets were re-suspended and cell labeling was performed after blocking FcγRIII/II with an anti-CD16/CD32 mAb (eBiosciences, San Diego, CA) by incubating 1×10⁶ cells with 1 μg of fluorescently conjugated mAbs directed against mouse CD44 (IM7), CD206 (C068C2), PD-1 (29F.1A12), CD3 (17A2), CD4 (RM4–5), CD8 (53–6.7), CD45 (30-F11), CD11b (M1/70), Cd11c (N4118), Gr1 (RB6–8C5), MHC II (M5/114.15.2), NK1.1 (PK136), IL-10 (JES5–16E3), IFNγ (XMG1.2), TNFα (MP6-XT22), F4/80 (BM8), ICOS (15F9), CD62L (MEL-14), Ki67 (16A8), T-bet (4B10), Granzyme B (QA16A02), (all BioLegend, San Diego, CA), FoxP3 (FJK-16s; eBiosciences), pTBK1 (637Ig11.2) (BD, Biosciences), and pIRF3 (D6O1M) (Cell Signaling). Dead cells were excluded from analysis using zombie yellow (BioLegend). When appropriate, cells were stained with cell surface markers as indicated, underwent cell fixation and permeabilization using 1x dilution of eBioscience flow cytometry kit, and subsequent staining for intracellular markers. Flow cytometry was performed on the Attune NxT Flow Cytometer (ThermoFisher, Waltham, MA) using the gating strategy shown in Fig. S7G. Data were analyzed using FlowJo (Treestar, Ashland, OR).
Plasmids
EMSY, KEAP1, and NRF2 complementary cDNAs (both human and mouse) were inserted into a variety of vectors (modified pcDNA3.1 vectors containing N-terminal FLAG, Strep, and HA tags; pLVX-puro lentiviral vectors containing N-terminal FLAG and STREP tags or HA tag;) by sub-cloning or site-directed mutagenesis (KAPA Biosystems). Specific details will be provided on request.
Single Cell RNA-Sequencing
The cell concentration, singularity, and viability of single cell suspensions of live leukocytes isolated by FACS-SORT for Cd45+ PI Negative cells from KP and KPK lung tumors +/− STINGa treatment were confirmed before submission for scRNA-Seq (10x Genomics). scRNA-Seq was performed by the Genome Technology Center (GTC) and data processing and analysis was performed by the Applied Bioinformatics Laboratory (ABL). Sequencing results were demultiplexed and converted to FASTQ format using Illumina bcl2fastq software. The Cell Ranger Single-Cell Software Suite (https://support.10xgenomics.com/single-cell-gene-expression/software/pipelines/latest/what-is-cell-ranger) was used to perform sample demultiplexing and single-cell 3’ gene counting. The cDNA insert was aligned to the mm10/GRCm38 reference genome. Only confidently mapped non-PCR duplicates with valid UMIs were used to generate the gene-barcode matrix. Further analysis including the identification of highly variable genes, dimensionality reduction, standard unsupervised clustering algorithms, and the discovery of differentially expressed genes was performed using the The iCellR R package (v1.5.5) (https://CRAN.R-project.org/package=iCellR). To exclude low quality cells and cells that were extreme outliers in terms of library complexity, we calculated the distribution of genes detected per cell, UMIs, and the proportion of mitochondrial genes. Cells with more than 10% of the transcripts coming from mitochondrial genes or low number of covered genes (gene-count <200) were removed, and the matrix was normalized based on library sizes accordingly. Demultiplexing the samples based on hashtag oligos (HTOs) was based on the read coverage of each hashtag per cell. A hashtag would be assigned to a cell if it had the highest coverage compared to the coverage of all the other hashtags. If two hashtags were of about equal coverage, the cell id would be considered a doublet (two cells coming from two different samples). For detecting doublet cells of the same sample/hashtag we used the pythong package “Scrublet” (v. 0.2.3) (Wolock et al., 2019). The final dataset included 7,586 total cells (ht1,ht2,ht4,ht5(438,3214,3639,295)) with a median of 1,800 detected genes. For dimensionality reduction, T-distributed Stochastic Neighbor Embedding (t-SNE) and K-nearest-neighbor-based Network graph drawing Layout (KNetL) were then performed (zoom=300) (Fruchterman and Reingold, 1991). PhenoGraph (Levine et al., 2015) clustering was then performed and the clusters were displayed on both the t-SNE and KNetL map results. Then the marker genes were found for each cluster and visualized on heatmaps and scatter plots. Marker genes were then used to assign cell types based on Immgen expression patterns (Please see Supp Figure 7b and Supp. Table 1). Imputation was used for some data visualizations only and not for the analysis. For imputation we used KNN to average the expression of 10 neighboring cells per cell, using iCellR’s “run.impute” function on tSNE and KNetL data. We observed the presence of Cd8+/Cd4+ cells in both clusters 20 and 21, possibly due to a potential thymic contamination during samples collection. The presence of these cells does not affect the overall interpretation of the results.
TCGA data collection and analysis of tumor mutation burden
The TCGA Lung Adenocarcinoma (LUAD) and Lung squamous cell carcinoma (LUSC) mutation, transcriptomic and clinical data were directly downloaded using the TCGAbiolinks package (v2.12.6) in R. We subdivided these data with different groups based on their mutation genes or smoking history information. To calculate the tumor mutation burden per megabase, we used the total number of mutations (somatic, coding, base substitution and indel mutations) counted divided by the size of the region of the targeted territory.
Transcriptomic Analysis and Gene Set Enrichment Analysis
For RNA-seq analysis on the KPK and KP mouse samples shown in Fig.1, we used the raw read count tables from our previous paper (GSE122836). Normalization and differential expression analysis were performed with DEseq2 (v1.28.1) standard parameters (lfcshrink with apeglm estimation). To measure the association between biological pathways and the gene expression profiles of our KPK and KP samples, we used the gene set enrichment analysis (version 4.1) through the java GSEA Desktop Application with the GSEA-Preranked Tools using a ranked differential expressed genes (DEGs) list. The list was generated using the DEGs from the highest to lowest by a metric score calculated by using the inverse of the logarithm base 10 p value multiplied by the sign of the fold change. For the enrichment results, we performed 1000 permutations using the curated set 2 KEGG and REACTOME pathway lists (c2.cp.kegg.v7.2.symbols.gmt., c2.cp.reactome.v7.2.symbols.gmt.). Besides GSEA analysis on our own samples, we also performed GSEA analysis on the TCGA NSCLC (LUAD and LUSC) FPKM-normalized transcriptomic data matrix and separated the samples based on their mutation profiles with KEAP1 mutant or not. For the enrichment results, we performed 1000 permutations using the curated set Hallmark (h.all.v7.2.symbols.gmt).
For RNA-seq analysis on the KPK and KP mouse samples shown in Fig.5 and S5, RNAseq differential expression analysis was performed for two lanes of an SP100 paired-end 50 Illumina NovaSeq 6000 run. Per-read per-sample FASTQ files were generated using the bcl2fastq2 Conversion software (v2.20) to convert per-cycle BCL base call files outputted by the sequencing instrument (RTA v3.4.4) into the FASTQ format. The alignment program, STAR (v2.7.3a), was used for mapping reads of 24 samples to the mouse reference genome mm10 and the application Fastq Screen (v.0.13.0) was utilized to check for contaminants. The software, featureCounts (Subread package v1.6.3), was used to generate matrices of read counts for annotated genomic features. For differential gene statistical comparisons between groups of replicate samples contrasted by KPKshCTRL, KPKshEmsy, KPshCTRL, and KPshEmsy conditions, the DESeq2 package (R v3.6.1) in the R statistical programming environment was utilized.
Ultra-performance liquid chromatography electrospray ionization-tandem mass spectrometry (UPLC-MRM/MS)
For intracellular cGAMP measurement, standard solutions of 2′, 3′-cGAMP were prepared, in a concentration range of 0.00005 to 5 nmol/mL, in an internal standard solution of 13C5-GMP. Each cell pellet sample was added with 100 μL of water. Cells were lysed on a MM 400 mill mixer with the aid of two metal balls at 30 Hz for 1 min, twice. 150 μL of acetonitrile was then added to each tube and the samples were homogenized again for 1 min twice, followed by sonication for 1 min in an ice-water bath. The samples were placed at −20 °C for 30 min before centrifugal clarification at 21,000 g and 5 °C for 5 min. The clear supernatants were collected. The protein pellets were used for protein assay using the standard Bradford procedure. 20 μL of the clear supernatant of each cell sample was mixed with 180 μL of the internal standard solution. 10-μL aliquots of resultant sample solutions and standard solutions were injected into a C18 LC column (2.1*100 mm, 1.9 μm) to run UPLC-MRM/MS on a Waters Acquity UPLC system coupled to a Sciex QTRAP 6500 Plus mass spectrometer operated in the negative-ion ESI mode. The mobile phase was a 5-mM ammonium acetate buffer (A) and methanol (B) for binary gradient elution (0% to 15% B in 12 min), at 0.20 mL/min and 40 °C. Concentrations of cGAMP were calculated with internal-standard calibration by interpolating the constructed linear-regression curve with the analyte-to-internal standard peak area ratios measured from the sample solutions.
Viability assay
Cells (2500 cells/well) for each condition were plated in 96 well plates and treated with different PARPis. After 96 hours cells viability was measured using alamarBlue™ (Thermo Fisher Scientific) according to manufacturer specifications. In Fig. 2C, KP cells were plated and pre-treated with KI696 (1 mM) for one week.
Whole exome sequencing and RNA-seq variants analysis
For whole exome sequencing samples, the sequencing reads were mapped to the mouse genome (GRCm38/mm10) using the Burrows-Wheeler Aligner with the BWA-MEM algorithm. Low confidence mappings and duplicate reads were removed using Sambamba. Local indel realignment and base-quality score recalibration was performed using the Genome Analysis Toolkit (GATK).
For RNA-seq samples, we used the publicly available raw sequencing files (GSE122836) from our previous paper. The sequencing reads were mapped to the mouse genome (GRCm38/mm10) using the STAR aligner (v2.5.0c) and duplicate reads were removed using Sambamba. Reads were split into exon segments and hard-clip any sequences within the intronic regions using GATK, followed by local indel realignment and base-quality score recalibration.
Single-nucleotide and small indel somatic variants were called with Strelka. Variants with at least 5 supporting reads and VAF >5% were remained. ANNOVAR was used to annotate variants with genomic context.
QUANTIFICATION AND STATISTICAL ANALYSIS
All data were analyzed by Prism 9 (GraphPad). Unless otherwise noted in Fig. legends, data are representative of at least three biologically independent experiments. Two-group datasets were analyzed by Student’s unpaired t-test. Linear regression analysis was performed with the GraphPad Prism 7 software χ2 test.
Supplementary Material
Figure S1. TMB analysis across major drivers of NSCLC, related to Figure 1
(A) and (B) Distribution of TMB across the major drivers of NSCLC using patient data from TCGA database stratified in (A) non-smoker and (B) smoker.
(C) Distribution of TMB across the major drivers of NSCLC using patient data from TCGA database stratified according to their TP53 status.
(D) The indicated mouse lung cancer cells were collected, lysed, and immunoblotted as indicated.
Figure S2. BRCAness phenotype in KEAP1-depleted cells, related to Figure 2
(A) DR-GFP U2OS cells described in Fig.2A, were transfected with either a non-targeting (NT) siRNA or the indicated siRNAs. After 72 hours cells were collected, lysed, and immunoblotted as indicated.
(B) KP and KPK cells were treated with neocarzinostatin (NCS) for 3 hours, collected, fractionated into soluble and chromatin fractions, and immunoblotted as indicated.
(C) KP and KPK cells were treated with neocarzinostatin (NCS) for 3 hours, fixed, and stained with DAPI and antibody to pH2ax. A minimum of 300 cells were counted for each condition in 3 independent experiments. Data are presented as mean ± SEM. Slides were co-stained with an anti-Rad51 antibody (see Fig. 2B).
(D)-(G) KP and KPK cells were treated with the indicated concentrations of different PARP1 inhibitors (PARPis). Seventy-two hours after the addition of PARPis, cell viability was measured using alamarBlue. Cell viability was set as 100% for cells not treated with PARPi. Each experiment was performed at least three times, each with triplicate measurements (±SEM).
(H) KP cells infected with lentiviruses expressing either an EV or Nrf2(E79Q) were treated with the indicated concentrations of talazoparib (PARPi). Seventy-two hours after the addition of PARPi, cell viability was measured using alamarBlue. Cell viability was set as 100% for cells not treated with PARPi. Each experiment was performed at least three times, each with triplicate measurements (±SEM).
(I) KP cells infected with lentiviruses expressing either an EV or Nrf2(E79Q) were collected, lysed, and immunoblotted as indicated.
(J) The indicated cell lines (5 × 10⁵ cells) were implanted subcutaneously into the flanks of 6- to 8-week-old female syngeneic mice (C57BL/6J). Once tumors were measurable, mice were divided into two groups, one treated with vehicle control (KP clone #2: n=9; KPK clone #2: n=8) and the other with talazoparib (PARPi) (KP clone #2: n=9; KPK clone #2: n=10) for the indicated days. Tumor size was monitored biweekly. Mice were sacrificed by the end of the treatment. Data represent mean ± SEM.
(K) Quantification of tumor weight from tumors described in (J).
(L) IHC analysis of pH2ax (S139) in tumors from experiment in Fig. 2D–E. Data represent mean ± SEM relative to vehicle control.
(M) Quantification of relative tumor volume from PDXs described in Fig. 2F–G. Data represent mean ± SEM.
(N) The indicated mouse lung cancer cells were treated neocarzinostatin (NCS) for three hours, fixed, and stained with DAPI and an antibody to Rad51. A minimum of 300 cells were counted for each condition in 3 independent experiments. Data are presented as mean ± SEM.
Figure S3. EMSY is a substrate of CRL3KEAP1, related to Figure 3.
(A) FLAG-tagged human KEAP1 was immunoprecipitated from doxorubicin-treated HEK293T cells and subjected to mass spectrometry analysis. The table lists the number of unique peptides and the PSM (Peptide Spectral Match) score for each KEAP1 interacting protein.
(B) FLAG- tagged human EMSY was immunoprecipitated from doxorubicin-treated HEK293T cells and subjected to mass spectrometry analysis. The table lists the number of unique peptides and the PSM (Peptide Spectral Match) score for each EMSY interacting protein.
(C) HEK293T cells were transfected with either an EV or FLAG-tagged EMSY. 24 h post-transfection, cells were collected for immunoprecipitation (IP) and immunoblotting. WCE, whole-cell extract.
(D) HEK293T cells were transfected with either an EV or the indicated FLAG-tagged constructs. Twenty-four hours post-transfection, cells were collected for immunoprecipitation (IP) and immunoblotting. WCE, whole-cell extract.
(E) U2OS cells were treated with MG132 for the indicated times, collected, lysed, and immunoblotted as indicated.
(F) U2OS cells were treated with MLN4924 for the indicated times, collected, lysed, and immunoblotted as indicated.
(G) H2009 cells were transfected with either a non-targeting (NT) siRNA or an siRNA to KEAP1. Forty-eight hours post-transfection, cells were treated with hydrogen peroxide (H2O2), collected at the indicated times, lysed and immunoblotted as indicated.
(H) HEK293T cells were transfected with FLAG-tagged EMSY, either hemagglutinin (HA)-tagged KEAP1 wild-type or mutants, and MYC-tagged wild-type ubiquitin. Twenty-four hours post-transfection, cells were treated with MG132 for 3 hours before collection for IP under denaturing condition and immunoblotting. The bracket indicates a ladder of bands with a relative molecular mass of >170,000 corresponding to polyubiquitylated EMSY. WCE, whole-cell extract.
Figure S4. Mapping of the Keap1 degron in Emsy, related to Figure 4.
(A) Alignment of the Keap1 binding motif in murine Emsy. Critical amino acids required for Keap1 binding are highlighted in red.
(B) KP cells were transfected with either an EV or the indicated FLAG-tagged constructs. Twenty-four hours post-transfection, cells were collected for immunoprecipitation (IP) and immunoblotting. WCE, whole-cell extract.
(C) KP cells infected with lentiviruses expressing either wild-type Emsy or Emsy(EEGE/AAAA) were treated with NCS for 3 hours, fixed, and stained with DAPI and an anti-pH2ax antibody. A minimum of 300 cells were counted for each condition in 3 independent experiments (each with 3 technical repeats). Data are presented as mean ± SEM. Slides were co-stained with an anti-Rad51 antibody (see Fig. 4C).
(D) KP and KPK cells were infected with lentiviruses expressing either a non-targeting (shCTRL) shRNA or an shRNA to EMSY (shEmsy) under the control of a doxycycline-inducible promoter and treated with 0.2 μg/μL doxycycline for 72 hours. Cells were then treated with the indicated concentrations of talazoparib (PARPi). Seventy-two hours after the addition of PARPi, cell viability was measured using alamarBlue. Cell viability was set as 100% for cells not treated with PARPi. Each experiment was performed at least three times, each with triplicate measurements (±SEM).
(E) KP and KPK cells were infected with lentiviruses expressing either a non-targeting (shCTRL) shRNA or an shRNA to EMSY (shEmsy) under the control of a doxycycline-inducible promoter and treated with 0.2 μg/μL doxycycline. After 72 hours, cells were collected, lysed and immunoblotted as indicated.
(F) The indicated cell lines (5 × 10⁵ cells) were implanted subcutaneously into the flanks of 6- to 8-week-old female syngeneic mice (C57BL/6J). Once tumors were measurable, mice were divided into two groups, one treated with vehicle control (shCTRL: n=8; shEmsy: n=10) and the other with talazoparib (PARPi) (shCTRL: n=10; shEmsy: n=9) for the indicated days. Tumor size was monitored biweekly. Mice were sacrificed by the end of the treatment. Data represent mean ± SEM.
(G) Quantification of tumor weight from tumors described in (F).
(H) IHC analysis of pH2ax (S139) in tumors from experiment in Fig. 4F–G. Data represent mean ± SEM relative to vehicle control.
(I) IHC analysis of Ki67 in tumors from experiment in Fig. 4F–G. Data represent mean ± SEM relative to vehicle control.
Figure S5. Exogenous DNA promotes the Keap1-mediated degradation of Emsy, related to Figure 5
(A) Top 50 most significant biological processes down-regulated in KPK tumors compared to KP tumors both stably infected with a not-targeting shRNA (shCTRL).
(B) Volcano plot comparing the differential expression of genes in KP shEmsy and KP shCTRL cells. Plotted for each transcript are the negative log10 of the p-value and the log2 of the fold change of gene expression of KP shEmsy versus KP shCTRL cells. The blue dots represent genes with an FDR threshold of 5%.
(C) U2OS cells were transfected with either a non-targeting (NT) siRNA or an siRNA to KEAP1. Forty-eight hours post-transfection, cells were treated with either poly(ISD) or poly(G:C), collected at the indicated times and immunoblotted as indicated.
(D) KP cells were treated with either poly(G:C) for the indicated before collection for IP under denaturing condition with an anti-Emsy antibody followed by immunoblotting. The bracket indicates a ladder of bands with a relative molecular mass of >170,000 corresponding to polyubiquitylated Emsy. WCE, whole-cell extract.
(E) KP cells were treated with poly(G:C) for the indicated before collection for IP with an anti-Emsy antibody followed by immunoblotting. WCE, whole-cell extract.
(F) The indicated cell lines were treated with either poly(G:C) for the indicated before collection for IP under denaturing condition with an anti-Emsy antibody followed by immunoblotting. The bracket indicates a ladder of bands with a relative molecular mass of >170,000 corresponding to polyubiquitylated Emsy. WCE, whole-cell extract.
(G) KP and KPK cells treated with poly(G:C) at the indicated times prior collection. Intracellular cGAMP production was analyzed by UPLC-MRM/MS. Values are presented as means ± SEM. n=3.
(H) KP and KPK cells were incubated in the presence or absence of poly(G:C) for 8 hours, fixed, and stained with DAPI and an antibody to Irf3. A minimum of 300 cells were counted for each condition in 3 independent experiments. Data are presented as mean ± SEM.
(I) Representative immunofluorescence staining images of Irf3 from experiment described in (H).
Figure S6. Loss of Keap1 induces suppression of type I interferon signaling in an Nrf2-independent manner, related to Figure 6
(A) KP and KPK cells were treated with poly(G:C) and collected at the indicated time. Relative expression levels of indicated genes were determined by qRT-PCR. Values are presented as means ± SEM. n=3.
(B) KP and KPK cells were treated with poly(G:C) for 16 hours, collected and immunoblotted. Untreated KP and KPK cells were treated for 8 hours with conditioned media coming from poly(G:C)-treated KP or KPK cells, collected and immunoblotted as indicated.
(C) KP cells infected with lentiviruses expressing either an empty vector (EV) or Nrf2(E79Q) were treated with poly(G:C) for 16 hours. Relative expression levels of Ifnα gene were determined by qRT-PCR. Data are presented as means ± SEM.
(D) KP cells infected with lentiviruses expressing either an empty vector (EV) or Nrf2(E79Q) were collected for RNA extraction. Relative expression levels of Nqo1 gene were determined by qRT-PCR. Data are presented as means ± SEM.
(E) KP cells infected with lentiviruses expressing either an EV or Emsy(EEGE/AAAA) were treated with poly(G:C) for 16 hours. Interferon alpha was measured by ELISA. Data are presented as means ± SEM. n=3.
(F) KP and KPK cells were infected with lentiviruses expressing either a non-targeting (shCTRL) shRNA or an shRNA to Emsy (shEmsy) under the control of a doxycycline-inducible promoter and treated with 0.2 μg/μL doxycycline for the indicated days, collected, and counted. Proliferation was plotted as the number of cells (mean ± SEM; n = 3)
(G) FACS analysis of Cd45+ cells among the total tumor infiltrating live cells in tumors described in Fig.6G.
(H) FACS analysis of phospho-Tbk1 (pTbk1) levels within the Cd11b+, Gr1− (TAMs) among the total tumor infiltrating Cd45+ cells in in tumors described in Fig.6G.
(I) FACS analysis of phospho-Tbk1 (pTbk1) levels within the Cd11c+, MhcII high (DCs) cells among the total tumor infiltrating Cd45+ cells in in tumors described in Fig.6G.
(J) FACS analysis of phospho-Irf3 (pIrf3) levels within the Cd11b+ cells among the total tumor infiltrating Cd45+ cells in in tumors described in Fig.6G.
Figure S7. STINGa treatment activates type I interferon response in the TME of Keap1-null tumors, related to Figure 7
(A) tSNE plot demonstrating cluster separation for live leukocytes isolated from vehicle or STINGa treated orthotopic KP and KPK tumors analysed by 10x single cell RNA sequencing (sc-RNA seq).
(B) Heat map demonstrating transcriptomic signatures used to identify immune-cell population identities on sc-RNA seq data from tumors above. Gene identifiers are listed on right and cluster ID are listed on top.
(C) KP and KPK cells were treated with the indicated concentrations of the STING agonist DMXAA (STINGa). Seventy-two hours after the addition of STINGa, cell viability was measured using alamarBlue. Cell viability was set as 100% for cells not treated with STINGa. Each experiment was performed at least three times, each with triplicate measurements (±SEM).
(D) KP cell lines (5 × 10⁵ cells) were implanted subcutaneously into the flanks of 6–8-weekold female syngeneic mice (C57BL/6J). Once tumors were measurable, mice were randomized and treated with the indicated drugs. Tumor size was monitored biweekly. Mice were sacrificed by the end of the treatment. Data represent mean ± SEM. n=10.
(E) Quantification of tumor weight from tumors described in (D).
(F) KP and KPK tumors described in Fig 7F–G and KP tumors described in S7D–E were lysed and immunoblotted as indicated.
(G) Gating strategy used for FACS immune analysis.
Table S1. List of cellular clusters determined using the tSNE algorithm, related to Figure S7
Table S2. List of genes used for the heatmap shown in Figure S7B, related to Figure S7
Highlights.
KEAP1 mediates EMSY degradation, and EMSY is stabilized in KEAP1-mutant lung cancer
Loss of KEAP1 induces a BRCAness phenotype by stabilizing EMSY
EMSY stabilization suppresses the type I interferon response, promoting immune evasion
EMSY accumulation sensitizes lung cancer to PARP inhibitors and STING agonists
Acknowledgments
The authors thank L. Brambilla, A. Chui, and L. Lignitto for critically reading the manuscript, and F. Boccalatte, V. Gerbino, J. Pucella, F. Renda, G. Rona, D. Simoneschi, and J. Ye for advice. We thank the Genome Technology Center (GTC) for expert library preparation and sequencing, and the Applied Bioinformatics Laboratories (ABL) for providing bioinformatics support and helping with the analysis. GTC and ABL are partially supported by grant P30CA016087. This work has used computing resources at the NYU School of Medicine HPCF. We thank the NYU Center for Biospecimen Research and Development, the NYU Mass Spectrometric Facility and the NYU Preclinical Imaging Laboratory that are supported by grants 5P30CA016087 and P41EB017183. MP is grateful to T.M. Thor for continuous support. MP is an Investigator with the Howard Hughes Medical Institute. This work was funded by grants from the National Institutes of Health to MP, DBS, TP, and JMS (R01CA76584, R35GM136250, R35CA210263, R37CA222504, R01CA227649, and K00CA212460), a fellowship from NIH/F30CA243205 to EK, NHMRC/APP1106545 to JP, NIH/T32CA193111 to CAH, NIH/F30CA247020 to WLW, AIRC/Marie Curie and the NIH/T32CA009161 grant to AM and EK.
Footnotes
Publisher's Disclaimer: This is a PDF file of an unedited manuscript that has been accepted for publication. As a service to our customers we are providing this early version of the manuscript. The manuscript will undergo copyediting, typesetting, and review of the resulting proof before it is published in its final form. Please note that during the production process errors may be discovered which could affect the content, and all legal disclaimers that apply to the journal pertain.
Declaration of interests
T.P. has received Honoraria/Consulting fees from Calithera Biosciences and Vividion Therapeutics, and research support from Bristol Myers Squibb, Dracen Pharmaceuticals, and Agios Pharmaceuticals. M.P. is a cofounder of Coho Therapeutics. He is also a consultant for, a member of the scientific advisory board of, and has financial interests in Coho Therapeutics, CullGen, Kymera Therapeutics, Santi Therapeutics, and SEED Therapeutics. The other authors declare no competing interests.
Inclusion and diversity
One or more of the authors of this paper self-identifies as a member of the LGBTQ+ community.
REFERENCES
- Alexandrov LB, Nik-Zainal S, Wedge DC, Aparicio SA, Behjati S, Biankin AV, Bignell GR, Bolli N, Borg A, Borresen-Dale AL, et al. (2013). Signatures of mutational processes in human cancer. Nature 500, 415–421. [DOI] [PMC free article] [PubMed] [Google Scholar]
- Bagaev A, Kotlov N, Nomie K, Svekolkin V, Gafurov A, Isaeva O, Osokin N, Kozlov I, Frenkel F, Gancharova O, et al. (2021). Conserved pan-cancer microenvironment subtypes predict response to immunotherapy. Cancer Cell 39, 845–865 e847. [DOI] [PubMed] [Google Scholar]
- Bar J, Herbst RS, and Onn A (2008). Multitargeted inhibitors in lung cancer: new clinical data. Clin Lung Cancer 9 Suppl 3, S92–99. [DOI] [PubMed] [Google Scholar]
- Berland L, Heeke S, Humbert O, Macocco A, Long-Mira E, Lassalle S, Lespinet-Fabre V, Lalvee S, Bordone O, Cohen C, et al. (2019). Current views on tumor mutational burden in patients with non-small cell lung cancer treated by immune checkpoint inhibitors. J Thorac Dis 11, S71–S80. [DOI] [PMC free article] [PubMed] [Google Scholar]
- Buttner R, Longshore JW, Lopez-Rios F, Merkelbach-Bruse S, Normanno N, Rouleau E, and Penault-Llorca F (2019). Implementing TMB measurement in clinical practice: considerations on assay requirements. ESMO Open 4, e000442. [DOI] [PMC free article] [PubMed] [Google Scholar]
- Byrum AK, Vindigni A, and Mosammaparast N (2019). Defining and Modulating ‘BRCAness’. Trends Cell Biol 29, 740–751. [DOI] [PubMed] [Google Scholar]
- Cai X, Chiu YH, and Chen ZJ (2014). The cGAS-cGAMP-STING pathway of cytosolic DNA sensing and signaling. Mol Cell 54, 289–296. [DOI] [PubMed] [Google Scholar]
- Chen Q, Sun L, and Chen ZJ (2016). Regulation and function of the cGAS-STING pathway of cytosolic DNA sensing. Nat Immunol 17, 1142–1149. [DOI] [PubMed] [Google Scholar]
- Chen X, Su C, Ren S, Zhou C, and Jiang T (2020). Pan-cancer analysis of KEAP1 mutations as biomarkers for immunotherapy outcomes. Ann Transl Med 8, 141. [DOI] [PMC free article] [PubMed] [Google Scholar]
- Cristescu R, Mogg R, Ayers M, Albright A, Murphy E, Yearley J, Sher X, Liu XQ, Lu H, Nebozhyn M, et al. (2018). Pan-tumor genomic biomarkers for PD-1 checkpoint blockade-based immunotherapy. Science 362. [DOI] [PMC free article] [PubMed] [Google Scholar]
- Daei Farshchi Adli A, Jahanban-Esfahlan R, Seidi K, Samandari-Rad S, and Zarghami N (2018). An overview on Vadimezan (DMXAA): The vascular disrupting agent. Chem Biol Drug Des 91, 996–1006. [DOI] [PubMed] [Google Scholar]
- Dansonka-Mieszkowska A, Szafron LM, Moes-Sosnowska J, Kulinczak M, Balcerak A, Konopka B, Kulesza M, Budzilowska A, Lukasik M, Piekarska U, et al. (2018). Clinical importance of the EMSY gene expression and polymorphisms in ovarian cancer. Oncotarget 9, 17735–17755. [DOI] [PMC free article] [PubMed] [Google Scholar]
- Ezell SA, Polytarchou C, Hatziapostolou M, Guo A, Sanidas I, Bihani T, Comb MJ, Sourvinos G, and Tsichlis PN (2012). The protein kinase Akt1 regulates the interferon response through phosphorylation of the transcriptional repressor EMSY. Proc Natl Acad Sci U S A 109, E613–621. [DOI] [PMC free article] [PubMed] [Google Scholar]
- Ezell SA, and Tsichlis PN (2012). Akt1, EMSY, BRCA2 and type I IFN signaling: a novel arm of the IFN response. Transcription 3, 305–309. [DOI] [PMC free article] [PubMed] [Google Scholar]
- Haber DA (2003). The BRCA2-EMSY connection: implications for breast and ovarian tumorigenesis. Cell 115, 507–508. [DOI] [PubMed] [Google Scholar]
- Harris IS, and DeNicola GM (2020). The Complex Interplay between Antioxidants and ROS in Cancer. Trends Cell Biol 30, 440–451. [DOI] [PubMed] [Google Scholar]
- Heeke S, Benzaquen J, Long-Mira E, Audelan B, Lespinet V, Bordone O, Lalvee S, Zahaf K, Poudenx M, Humbert O, et al. (2019). In-house Implementation of Tumor Mutational Burden Testing to Predict Durable Clinical Benefit in Non-small Cell Lung Cancer and Melanoma Patients. Cancers (Basel) 11. [DOI] [PMC free article] [PubMed] [Google Scholar]
- Heeke S, and Hofman P (2018). Tumor mutational burden assessment as a predictive biomarker for immunotherapy in lung cancer patients: getting ready for prime-time or not? Transl Lung Cancer Res 7, 631–638. [DOI] [PMC free article] [PubMed] [Google Scholar]
- Hollis RL, Churchman M, Michie CO, Rye T, Knight L, McCavigan A, Perren T, Williams ARW, McCluggage WG, Kaplan RS, et al. (2019). High EMSY expression defines a BRCA-like subgroup of high-grade serous ovarian carcinoma with prolonged survival and hypersensitivity to platinum. Cancer 125, 2772–2781. [DOI] [PMC free article] [PubMed] [Google Scholar]
- Hughes-Davies L, Huntsman D, Ruas M, Fuks F, Bye J, Chin SF, Milner J, Brown LA, Hsu F, Gilks B, et al. (2003). EMSY links the BRCA2 pathway to sporadic breast and ovarian cancer. Cell 115, 523–535. [DOI] [PubMed] [Google Scholar]
- Itoh K, Mimura J, and Yamamoto M (2010). Discovery of the negative regulator of Nrf2, Keap1: a historical overview. Antioxid Redox Signal 13, 1665–1678. [DOI] [PubMed] [Google Scholar]
- Jaramillo MC, and Zhang DD (2013). The emerging role of the Nrf2-Keap1 signaling pathway in cancer. Genes Dev 27, 2179–2191. [DOI] [PMC free article] [PubMed] [Google Scholar]
- Jelinic P, Eccles LA, Tseng J, Cybulska P, Wielgos M, Powell SN, and Levine DA (2017). The EMSY threonine 207 phospho-site is required for EMSYdriven suppression of DNA damage repair. Oncotarget 8, 13792–13804. [DOI] [PMC free article] [PubMed] [Google Scholar]
- Kondrashova O, and Scott CL (2019). Clarifying the role of EMSY in DNA repair in ovarian cancer. Cancer 125, 2720–2724. [DOI] [PubMed] [Google Scholar]
- Lawrence MS, Stojanov P, Polak P, Kryukov GV, Cibulskis K, Sivachenko A, Carter SL, Stewart C, Mermel CH, Roberts SA, et al. (2013). Mutational heterogeneity in cancer and the search for new cancer-associated genes. Nature 499, 214–218. [DOI] [PMC free article] [PubMed] [Google Scholar]
- Livingston DM (2004). EMSY, a BRCA-2 partner in crime. Nat Med 10, 127–128. [DOI] [PubMed] [Google Scholar]
- Lord CJ, and Ashworth A (2016). BRCAness revisited. Nat Rev Cancer 16, 110–120. [DOI] [PubMed] [Google Scholar]
- Maatta KM, Nurminen R, Kankuri-Tammilehto M, Kallioniemi A, Laasanen SL, and Schleutker J (2017). Germline EMSY sequence alterations in hereditary breast cancer and ovarian cancer families. BMC Cancer 17, 496. [DOI] [PMC free article] [PubMed] [Google Scholar]
- Martin TD, Patel RS, Cook DR, Choi MY, Patil A, Liang AC, Li MZ, Haigis KM, and Elledge SJ (2021). The adaptive immune system is a major driver of selection for tumor suppressor gene inactivation. Science 373, 1327–1335. [DOI] [PubMed] [Google Scholar]
- Papillon-Cavanagh S, Doshi P, Dobrin R, Szustakowski J, and Walsh AM (2020). STK11 and KEAP1 mutations as prognostic biomarkers in an observational real-world lung adenocarcinoma cohort. ESMO Open 5. [DOI] [PMC free article] [PubMed] [Google Scholar]
- Przybycinski J, Nalewajska M, Marchelek-Mysliwiec M, Dziedziejko V, and Pawlik A (2019). Poly-ADP-ribose polymerases (PARPs) as a therapeutic target in the treatment of selected cancers. Expert Opin Ther Targets 23, 773–785. [DOI] [PubMed] [Google Scholar]
- Ribas A, and Wolchok JD (2018). Cancer immunotherapy using checkpoint blockade. Science 359, 1350–1355. [DOI] [PMC free article] [PubMed] [Google Scholar]
- Rojo de la Vega M, Chapman E, and Zhang DD (2018). NRF2 and the Hallmarks of Cancer. Cancer Cell 34, 21–43. [DOI] [PMC free article] [PubMed] [Google Scholar]
- Romero R, Sayin VI, Davidson SM, Bauer MR, Singh SX, LeBoeuf SE, Karakousi TR, Ellis DC, Bhutkar A, Sanchez-Rivera FJ, et al. (2017). Keap1 loss promotes Kras-driven lung cancer and results in dependence on glutaminolysis. Nat Med 23, 1362–1368. [DOI] [PMC free article] [PubMed] [Google Scholar]
- Saleiro D, and Platanias LC (2019). Interferon signaling in cancer. Non-canonical pathways and control of intracellular immune checkpoints. Semin Immunol 43, 101299. [DOI] [PMC free article] [PubMed] [Google Scholar]
- Snell LM, McGaha TL, and Brooks DG (2017). Type I Interferon in Chronic Virus Infection and Cancer. Trends Immunol 38, 542–557. [DOI] [PMC free article] [PubMed] [Google Scholar]
- Takahashi T, Nau MM, Chiba I, Birrer MJ, Rosenberg RK, Vinocour M, Levitt M, Pass H, Gazdar AF, and Minna JD (1989). p53: a frequent target for genetic abnormalities in lung cancer. Science 246, 491–494. [DOI] [PubMed] [Google Scholar]
- The Cancer Genome Atlas (TCGA) Research, N. (2014). Comprehensive molecular profiling of lung adenocarcinoma. Nature 511, 543–550. [DOI] [PMC free article] [PubMed] [Google Scholar]
- Thorsson V, Gibbs DL, Brown SD, Wolf D, Bortone DS, Ou Yang TH, Porta-Pardo E, Gao GF, Plaisier CL, Eddy JA, et al. (2019). The Immune Landscape of Cancer. Immunity 51, 411–412. [DOI] [PubMed] [Google Scholar]
- Tokheim C, Wang X, Timms RT, Zhang B, Mena EL, Wang B, Chen C, Ge J, Chu J, Zhang W, et al. (2021). Systematic characterization of mutations altering protein degradation in human cancers. Mol Cell 81, 1292–1308 e1211. [DOI] [PMC free article] [PubMed] [Google Scholar]
- Varier RA, Carrillo de Santa Pau E, van der Groep P, Lindeboom RG, Matarese F, Mensinga A, Smits AH, Edupuganti RR, Baltissen MP, Jansen PW, et al. (2016). Recruitment of the Mammalian Histone-modifying EMSY Complex to Target Genes Is Regulated by ZNF131. J Biol Chem 291, 7313–7324. [DOI] [PMC free article] [PubMed] [Google Scholar]
- Vire E, Curtis C, Davalos V, Git A, Robson S, Villanueva A, Vidal A, Barbieri I, Aparicio S, Esteller M, et al. (2014a). The Breast Cancer Oncogene EMSY Represses Transcription of Antimetastatic microRNA miR-31. Mol Cell 54, 203. [DOI] [PMC free article] [PubMed] [Google Scholar]
- Vire E, Curtis C, Davalos V, Git A, Robson S, Villanueva A, Vidal A, Barbieri I, Aparicio S, Esteller M, et al. (2014b). The breast cancer oncogene EMSY represses transcription of antimetastatic microRNA miR-31. Mol Cell 53, 806–818. [DOI] [PMC free article] [PubMed] [Google Scholar]
- Wiegmans AP, Yap PY, Ward A, Lim YC, and Khanna KK (2015). Differences in Expression of Key DNA Damage Repair Genes after Epigenetic-Induced BRCAness Dictate Synthetic Lethality with PARP1 Inhibition. Mol Cancer Ther 14, 2321–2331. [DOI] [PubMed] [Google Scholar]
- Zappasodi R, Merghoub T, and Wolchok JD (2018). Emerging Concepts for Immune Checkpoint Blockade-Based Combination Therapies. Cancer Cell 33, 581–598. [DOI] [PMC free article] [PubMed] [Google Scholar]
- Zhu Y, An X, Zhang X, Qiao Y, Zheng T, and Li X (2019). STING: a master regulator in the cancer-immunity cycle. Mol Cancer 18, 152. [DOI] [PMC free article] [PubMed] [Google Scholar]
Associated Data
This section collects any data citations, data availability statements, or supplementary materials included in this article.
Supplementary Materials
Figure S1. TMB analysis across major drivers of NSCLC, related to Figure 1
(A) and (B) Distribution of TMB across the major drivers of NSCLC using patient data from TCGA database stratified in (A) non-smoker and (B) smoker.
(C) Distribution of TMB across the major drivers of NSCLC using patient data from TCGA database stratified according to their TP53 status.
(D) The indicated mouse lung cancer cells were collected, lysed, and immunoblotted as indicated.
Figure S2. BRCAness phenotype in KEAP1-depleted cells, related to Figure 2
(A) DR-GFP U2OS cells described in Fig.2A, were transfected with either a non-targeting (NT) siRNA or the indicated siRNAs. After 72 hours cells were collected, lysed, and immunoblotted as indicated.
(B) KP and KPK cells were treated with neocarzinostatin (NCS) for 3 hours, collected, fractionated into soluble and chromatin fractions, and immunoblotted as indicated.
(C) KP and KPK cells were treated with neocarzinostatin (NCS) for 3 hours, fixed, and stained with DAPI and antibody to pH2ax. A minimum of 300 cells were counted for each condition in 3 independent experiments. Data are presented as mean ± SEM. Slides were co-stained with an anti-Rad51 antibody (see Fig. 2B).
(D)-(G) KP and KPK cells were treated with the indicated concentrations of different PARP1 inhibitors (PARPis). Seventy-two hours after the addition of PARPis, cell viability was measured using alamarBlue. Cell viability was set as 100% for cells not treated with PARPi. Each experiment was performed at least three times, each with triplicate measurements (±SEM).
(H) KP cells infected with lentiviruses expressing either an EV or Nrf2(E79Q) were treated with the indicated concentrations of talazoparib (PARPi). Seventy-two hours after the addition of PARPi, cell viability was measured using alamarBlue. Cell viability was set as 100% for cells not treated with PARPi. Each experiment was performed at least three times, each with triplicate measurements (±SEM).
(I) KP cells infected with lentiviruses expressing either an EV or Nrf2(E79Q) were collected, lysed, and immunoblotted as indicated.
(J) The indicated cell lines (5 × 10⁵ cells) were implanted subcutaneously into the flanks of 6- to 8-week-old female syngeneic mice (C57BL/6J). Once tumors were measurable, mice were divided into two groups, one treated with vehicle control (KP clone #2: n=9; KPK clone #2: n=8) and the other with talazoparib (PARPi) (KP clone #2: n=9; KPK clone #2: n=10) for the indicated days. Tumor size was monitored biweekly. Mice were sacrificed by the end of the treatment. Data represent mean ± SEM.
(K) Quantification of tumor weight from tumors described in (J).
(L) IHC analysis of pH2ax (S139) in tumors from experiment in Fig. 2D–E. Data represent mean ± SEM relative to vehicle control.
(M) Quantification of relative tumor volume from PDXs described in Fig. 2F–G. Data represent mean ± SEM.
(N) The indicated mouse lung cancer cells were treated neocarzinostatin (NCS) for three hours, fixed, and stained with DAPI and an antibody to Rad51. A minimum of 300 cells were counted for each condition in 3 independent experiments. Data are presented as mean ± SEM.
Figure S3. EMSY is a substrate of CRL3KEAP1, related to Figure 3.
(A) FLAG-tagged human KEAP1 was immunoprecipitated from doxorubicin-treated HEK293T cells and subjected to mass spectrometry analysis. The table lists the number of unique peptides and the PSM (Peptide Spectral Match) score for each KEAP1 interacting protein.
(B) FLAG- tagged human EMSY was immunoprecipitated from doxorubicin-treated HEK293T cells and subjected to mass spectrometry analysis. The table lists the number of unique peptides and the PSM (Peptide Spectral Match) score for each EMSY interacting protein.
(C) HEK293T cells were transfected with either an EV or FLAG-tagged EMSY. 24 h post-transfection, cells were collected for immunoprecipitation (IP) and immunoblotting. WCE, whole-cell extract.
(D) HEK293T cells were transfected with either an EV or the indicated FLAG-tagged constructs. Twenty-four hours post-transfection, cells were collected for immunoprecipitation (IP) and immunoblotting. WCE, whole-cell extract.
(E) U2OS cells were treated with MG132 for the indicated times, collected, lysed, and immunoblotted as indicated.
(F) U2OS cells were treated with MLN4924 for the indicated times, collected, lysed, and immunoblotted as indicated.
(G) H2009 cells were transfected with either a non-targeting (NT) siRNA or an siRNA to KEAP1. Forty-eight hours post-transfection, cells were treated with hydrogen peroxide (H2O2), collected at the indicated times, lysed and immunoblotted as indicated.
(H) HEK293T cells were transfected with FLAG-tagged EMSY, either hemagglutinin (HA)-tagged KEAP1 wild-type or mutants, and MYC-tagged wild-type ubiquitin. Twenty-four hours post-transfection, cells were treated with MG132 for 3 hours before collection for IP under denaturing condition and immunoblotting. The bracket indicates a ladder of bands with a relative molecular mass of >170,000 corresponding to polyubiquitylated EMSY. WCE, whole-cell extract.
Figure S4. Mapping of the Keap1 degron in Emsy, related to Figure 4.
(A) Alignment of the Keap1 binding motif in murine Emsy. Critical amino acids required for Keap1 binding are highlighted in red.
(B) KP cells were transfected with either an EV or the indicated FLAG-tagged constructs. Twenty-four hours post-transfection, cells were collected for immunoprecipitation (IP) and immunoblotting. WCE, whole-cell extract.
(C) KP cells infected with lentiviruses expressing either wild-type Emsy or Emsy(EEGE/AAAA) were treated with NCS for 3 hours, fixed, and stained with DAPI and an anti-pH2ax antibody. A minimum of 300 cells were counted for each condition in 3 independent experiments (each with 3 technical repeats). Data are presented as mean ± SEM. Slides were co-stained with an anti-Rad51 antibody (see Fig. 4C).
(D) KP and KPK cells were infected with lentiviruses expressing either a non-targeting (shCTRL) shRNA or an shRNA to EMSY (shEmsy) under the control of a doxycycline-inducible promoter and treated with 0.2 μg/μL doxycycline for 72 hours. Cells were then treated with the indicated concentrations of talazoparib (PARPi). Seventy-two hours after the addition of PARPi, cell viability was measured using alamarBlue. Cell viability was set as 100% for cells not treated with PARPi. Each experiment was performed at least three times, each with triplicate measurements (±SEM).
(E) KP and KPK cells were infected with lentiviruses expressing either a non-targeting (shCTRL) shRNA or an shRNA to EMSY (shEmsy) under the control of a doxycycline-inducible promoter and treated with 0.2 μg/μL doxycycline. After 72 hours, cells were collected, lysed and immunoblotted as indicated.
(F) The indicated cell lines (5 × 10⁵ cells) were implanted subcutaneously into the flanks of 6- to 8-week-old female syngeneic mice (C57BL/6J). Once tumors were measurable, mice were divided into two groups, one treated with vehicle control (shCTRL: n=8; shEmsy: n=10) and the other with talazoparib (PARPi) (shCTRL: n=10; shEmsy: n=9) for the indicated days. Tumor size was monitored biweekly. Mice were sacrificed by the end of the treatment. Data represent mean ± SEM.
(G) Quantification of tumor weight from tumors described in (F).
(H) IHC analysis of pH2ax (S139) in tumors from experiment in Fig. 4F–G. Data represent mean ± SEM relative to vehicle control.
(I) IHC analysis of Ki67 in tumors from experiment in Fig. 4F–G. Data represent mean ± SEM relative to vehicle control.
Figure S5. Exogenous DNA promotes the Keap1-mediated degradation of Emsy, related to Figure 5
(A) Top 50 most significant biological processes down-regulated in KPK tumors compared to KP tumors both stably infected with a not-targeting shRNA (shCTRL).
(B) Volcano plot comparing the differential expression of genes in KP shEmsy and KP shCTRL cells. Plotted for each transcript are the negative log10 of the p-value and the log2 of the fold change of gene expression of KP shEmsy versus KP shCTRL cells. The blue dots represent genes with an FDR threshold of 5%.
(C) U2OS cells were transfected with either a non-targeting (NT) siRNA or an siRNA to KEAP1. Forty-eight hours post-transfection, cells were treated with either poly(ISD) or poly(G:C), collected at the indicated times and immunoblotted as indicated.
(D) KP cells were treated with either poly(G:C) for the indicated before collection for IP under denaturing condition with an anti-Emsy antibody followed by immunoblotting. The bracket indicates a ladder of bands with a relative molecular mass of >170,000 corresponding to polyubiquitylated Emsy. WCE, whole-cell extract.
(E) KP cells were treated with poly(G:C) for the indicated before collection for IP with an anti-Emsy antibody followed by immunoblotting. WCE, whole-cell extract.
(F) The indicated cell lines were treated with either poly(G:C) for the indicated before collection for IP under denaturing condition with an anti-Emsy antibody followed by immunoblotting. The bracket indicates a ladder of bands with a relative molecular mass of >170,000 corresponding to polyubiquitylated Emsy. WCE, whole-cell extract.
(G) KP and KPK cells treated with poly(G:C) at the indicated times prior collection. Intracellular cGAMP production was analyzed by UPLC-MRM/MS. Values are presented as means ± SEM. n=3.
(H) KP and KPK cells were incubated in the presence or absence of poly(G:C) for 8 hours, fixed, and stained with DAPI and an antibody to Irf3. A minimum of 300 cells were counted for each condition in 3 independent experiments. Data are presented as mean ± SEM.
(I) Representative immunofluorescence staining images of Irf3 from experiment described in (H).
Figure S6. Loss of Keap1 induces suppression of type I interferon signaling in an Nrf2-independent manner, related to Figure 6
(A) KP and KPK cells were treated with poly(G:C) and collected at the indicated time. Relative expression levels of indicated genes were determined by qRT-PCR. Values are presented as means ± SEM. n=3.
(B) KP and KPK cells were treated with poly(G:C) for 16 hours, collected and immunoblotted. Untreated KP and KPK cells were treated for 8 hours with conditioned media coming from poly(G:C)-treated KP or KPK cells, collected and immunoblotted as indicated.
(C) KP cells infected with lentiviruses expressing either an empty vector (EV) or Nrf2(E79Q) were treated with poly(G:C) for 16 hours. Relative expression levels of Ifnα gene were determined by qRT-PCR. Data are presented as means ± SEM.
(D) KP cells infected with lentiviruses expressing either an empty vector (EV) or Nrf2(E79Q) were collected for RNA extraction. Relative expression levels of Nqo1 gene were determined by qRT-PCR. Data are presented as means ± SEM.
(E) KP cells infected with lentiviruses expressing either an EV or Emsy(EEGE/AAAA) were treated with poly(G:C) for 16 hours. Interferon alpha was measured by ELISA. Data are presented as means ± SEM. n=3.
(F) KP and KPK cells were infected with lentiviruses expressing either a non-targeting (shCTRL) shRNA or an shRNA to Emsy (shEmsy) under the control of a doxycycline-inducible promoter and treated with 0.2 μg/μL doxycycline for the indicated days, collected, and counted. Proliferation was plotted as the number of cells (mean ± SEM; n = 3)
(G) FACS analysis of Cd45+ cells among the total tumor infiltrating live cells in tumors described in Fig.6G.
(H) FACS analysis of phospho-Tbk1 (pTbk1) levels within the Cd11b+, Gr1− (TAMs) among the total tumor infiltrating Cd45+ cells in in tumors described in Fig.6G.
(I) FACS analysis of phospho-Tbk1 (pTbk1) levels within the Cd11c+, MhcII high (DCs) cells among the total tumor infiltrating Cd45+ cells in in tumors described in Fig.6G.
(J) FACS analysis of phospho-Irf3 (pIrf3) levels within the Cd11b+ cells among the total tumor infiltrating Cd45+ cells in in tumors described in Fig.6G.
Figure S7. STINGa treatment activates type I interferon response in the TME of Keap1-null tumors, related to Figure 7
(A) tSNE plot demonstrating cluster separation for live leukocytes isolated from vehicle or STINGa treated orthotopic KP and KPK tumors analysed by 10x single cell RNA sequencing (sc-RNA seq).
(B) Heat map demonstrating transcriptomic signatures used to identify immune-cell population identities on sc-RNA seq data from tumors above. Gene identifiers are listed on right and cluster ID are listed on top.
(C) KP and KPK cells were treated with the indicated concentrations of the STING agonist DMXAA (STINGa). Seventy-two hours after the addition of STINGa, cell viability was measured using alamarBlue. Cell viability was set as 100% for cells not treated with STINGa. Each experiment was performed at least three times, each with triplicate measurements (±SEM).
(D) KP cell lines (5 × 10⁵ cells) were implanted subcutaneously into the flanks of 6–8-weekold female syngeneic mice (C57BL/6J). Once tumors were measurable, mice were randomized and treated with the indicated drugs. Tumor size was monitored biweekly. Mice were sacrificed by the end of the treatment. Data represent mean ± SEM. n=10.
(E) Quantification of tumor weight from tumors described in (D).
(F) KP and KPK tumors described in Fig 7F–G and KP tumors described in S7D–E were lysed and immunoblotted as indicated.
(G) Gating strategy used for FACS immune analysis.
Table S1. List of cellular clusters determined using the tSNE algorithm, related to Figure S7
Table S2. List of genes used for the heatmap shown in Figure S7B, related to Figure S7
Data Availability Statement
Single-cell RNA-seq and RNA-seq data have been deposited at GEO and are publicly available as of the date of publication. Accession numbers are listed in the key resources table. Original western blot images have been deposited at Mendeley and are publicly available as of the date of publication. The DOI is listed in the key resources table.
This paper does not report original code.
Any additional information required to reanalyze the data reported in this paper is available from the lead contact upon request.