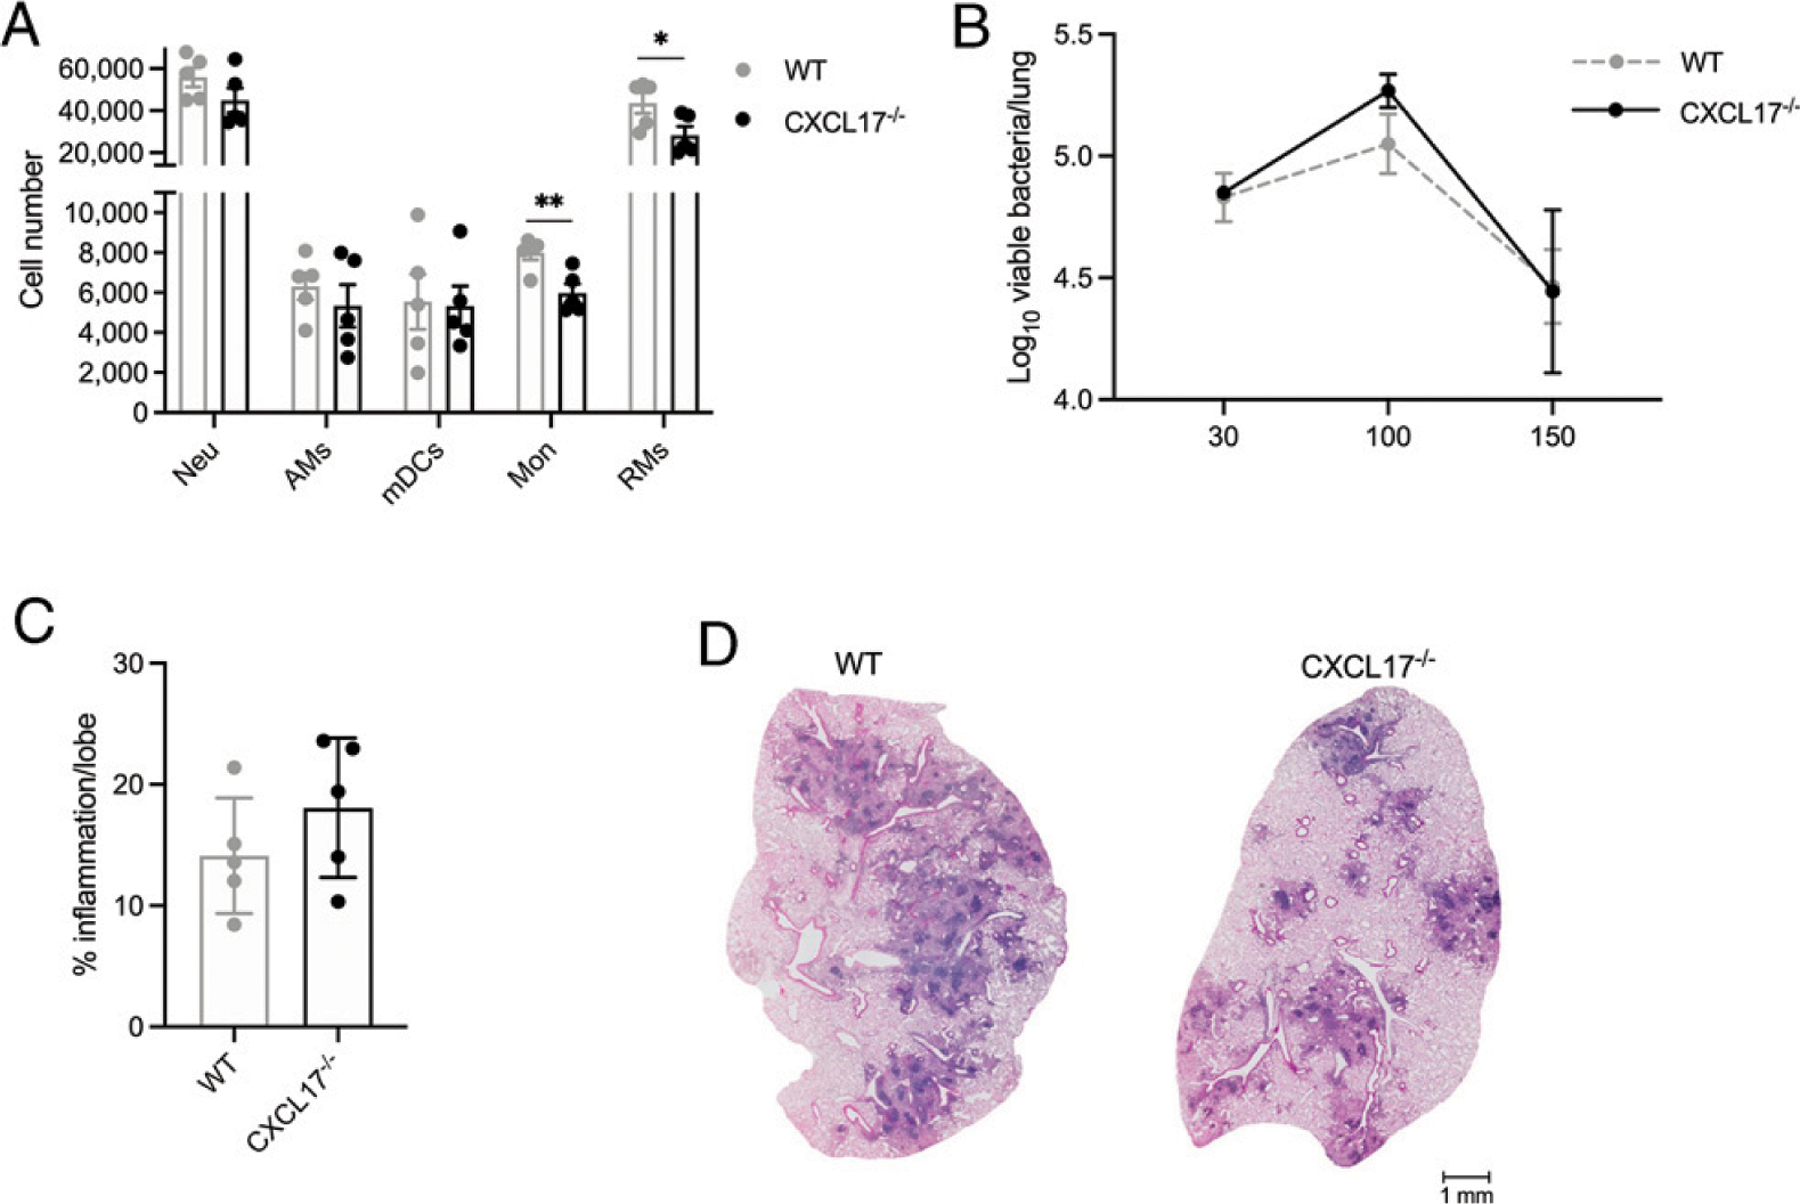
FIGURE 3. M. tuberculosis HN878 infection in CXCL17−/− mice.

WT B6 and CXCL17−/− mice were aerosol-infected with ~100 CFU of M. tuberculosis HN878 and sacrificed at given dpi (n = 5 per group per time point). (A) Lung myeloid cell populations were enumerated in M. tuberculosis HN878-infected WT and CXCL17−/− mice using flow cytometry at 30 dpi. (B) Lung bacterial burden was determined by plating and counting CFUs at 30, 100, and 150 dpi. (C) Lung area occupied by inflammation was quantified in H&E-stained, formalin-fixed, and paraffin-embedded (FFPE) lungs using NanoZoomer software. The percentage of lung area occupied by inflammation per mouse lung was determined at 100 dpi. (D) Representative microphotographs showing H&E-stained FFPE lung sections from M. tuberculosis HN878-infected WT and CXCL17−/− mice at 100 dpi. Comparisons between groups were performed using the unpaired Student t test at each time point. The data shown represent mean (± SD) values from two to three independent experiments. *p ≤ 0.05, **p ≤ 0.01.
