Abstract
Dynamical diffraction leads to an interesting, unavoidable set of interference effects for neutron interferometers. This experiment studies the interference signal from two and three successive Bragg diffractions in the Laue geometry. We find that intrinsic Bragg-plane misalignment in monolithic, “perfect” silicon neutron interferometers is relevant between successive diffracting crystals, as well as within the Borrmann fan for typical interferometer geometries. We show that the dynamical phase correction employed in the Colella, Overhauser, and Werner gravitationally induced quantum interference experiments is attenuated by slight, intrinsic misalignments between diffracting crystals, potentially explaining the long-standing 1% discrepancy between theory and experiment. This systematic may also impact precision measurements of the silicon structure factor, affecting previous and future measurements of the Debye-Waller factor and neutron-electron scattering length as well as potential fifth-force searches. For the interferometers used in this experiment, Bragg planes of different diffracting crystals were found to be misaligned by 10 to 40 nrad.
I. INTRODUCTION
For the past 40 years, single-crystal neutron interferometers have demonstrated their robustness in the fields of fundamental physics, quantum mechanics, neutron scattering, nuclear theory, and quantum information. This is due to the neutron’s interaction with magnetic and nuclear structure and earth’s terrestrial gravitational field having roughly equal magnitudes and through the high sensitivity gained over other techniques in measuring interference effects. For most interferometry experiments only properties of the sample or interaction being probed are of interest, and the details of the physical interferometer can be ignored. However, some of the most interesting neutron interferometry experiments are sensitive to a neutron’s path and phase accumulated within the crystal beam splitters. Dynamical diffraction, which describes Bragg diffraction within a crystal lattice, describes the inner workings of the interferometer and is dependent on multiple Bragg diffractions constructively interfering before leaving the device.
The standard neutron interferometer consists of several crystals or “blades” for consecutive Bragg diffraction. Bragg scattering requires that each of these blades be aligned relative to each other within the angular acceptance of the silicon crystal, called the Darwin width , typically between 5 and 25 μrad. For this reason, neutron interferometers are made from a single, float-zone silicon ingot. The blades create a Mach-Zehnder neutron interferometer with several centimeters of path separation. The blades are formed by removing material from the ingot but preserving approximately half the ingot to serve as a common base (see Fig. 1). This common base ensures that the crystal blades are aligned relative to each other to within . Further details of constructing an interferometer can be found in Ref. [1]. Typically, this relative alignment between the blades is assumed to be perfect, even over the relatively large dimensions of the crystal (~10 cm). This assumption, however, is justified only at the microradian level, while outside this alignment the interferometer would cease to function. Our work considers how the relative imperfect alignment of these blades at levels over 100 times smaller than impacts the performance of the interferometer due to interference effects arising from dynamical Bragg diffraction.
FIG. 1.
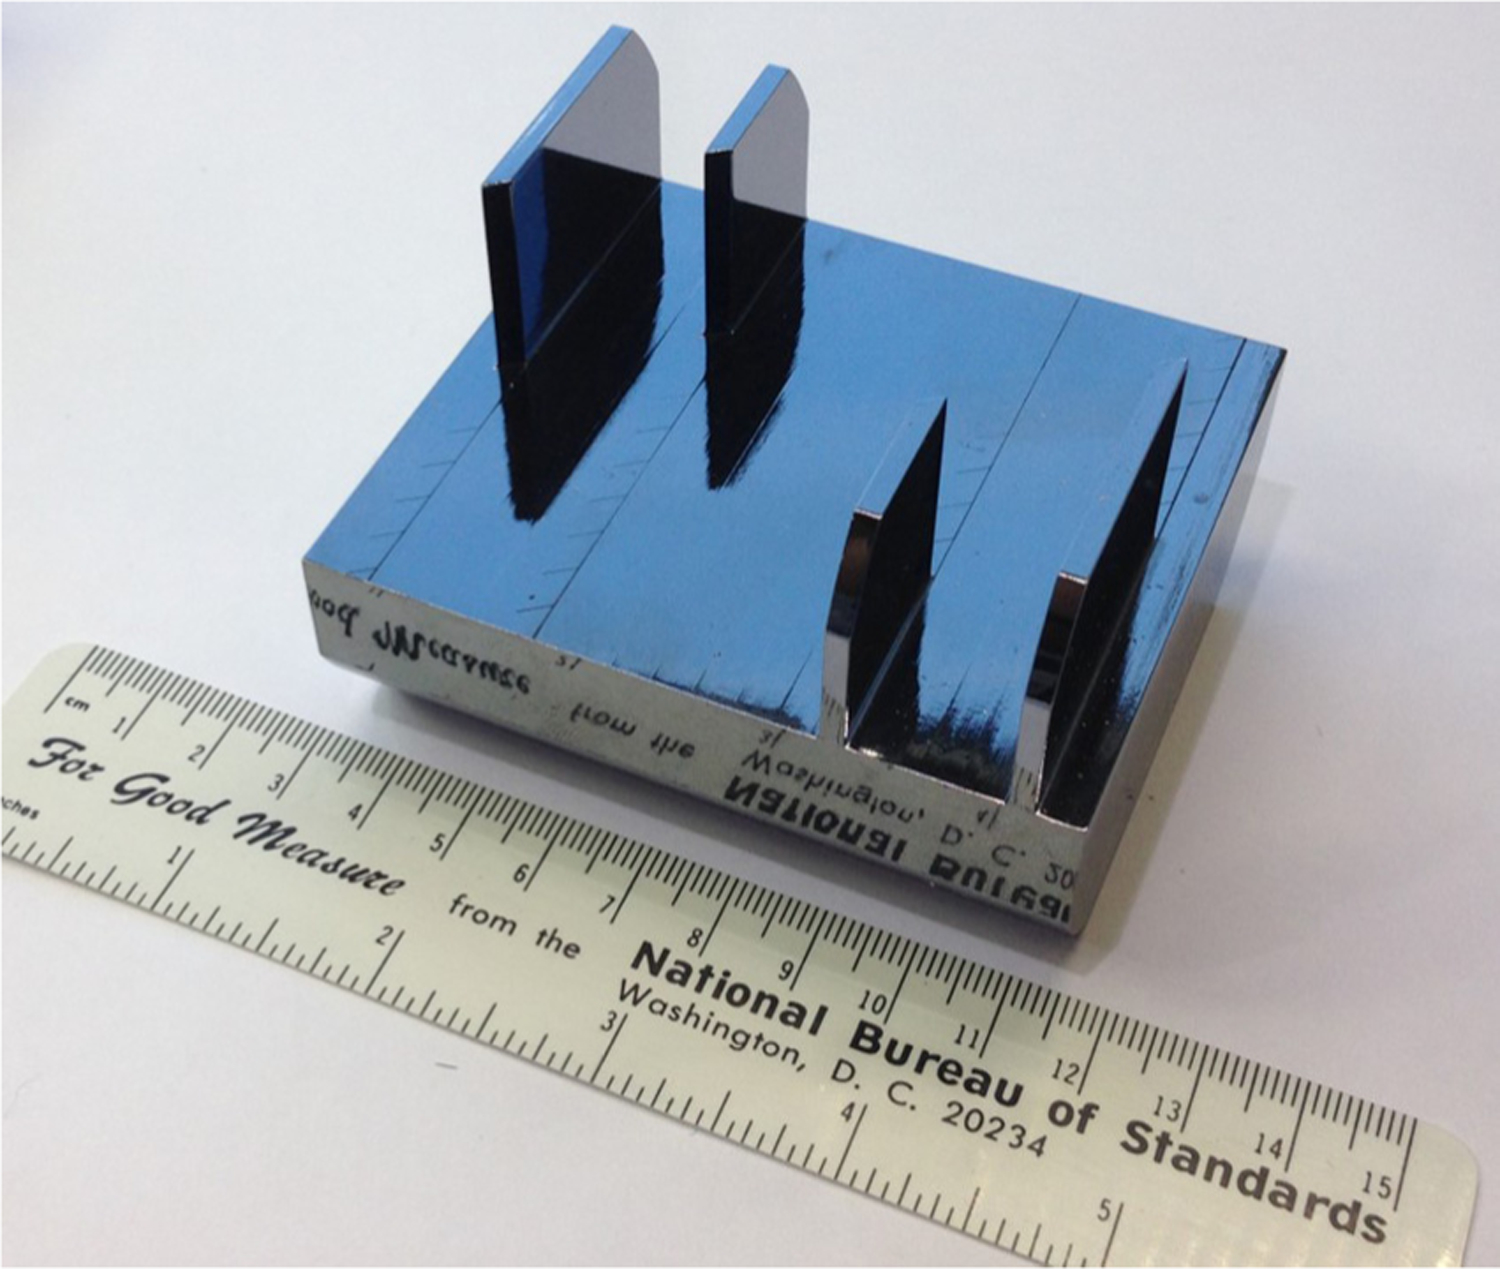
The crystal interferometer used in the second experiment described in text. Four blades protrude from a common base.
Inside the crystal blades neutrons undergo Bragg diffraction (Fig. 2) where the incoming free-particle state splits into two degenerate branches. This is because the solution of the Schrodinger equation within the crystal lattice has two unique solutions per incident momentum mode . Each of the two branches accrues a different dynamical-induced phase which is a function of the incident neutron momentum mode’s deviation from the Bragg condition.
FIG. 2.
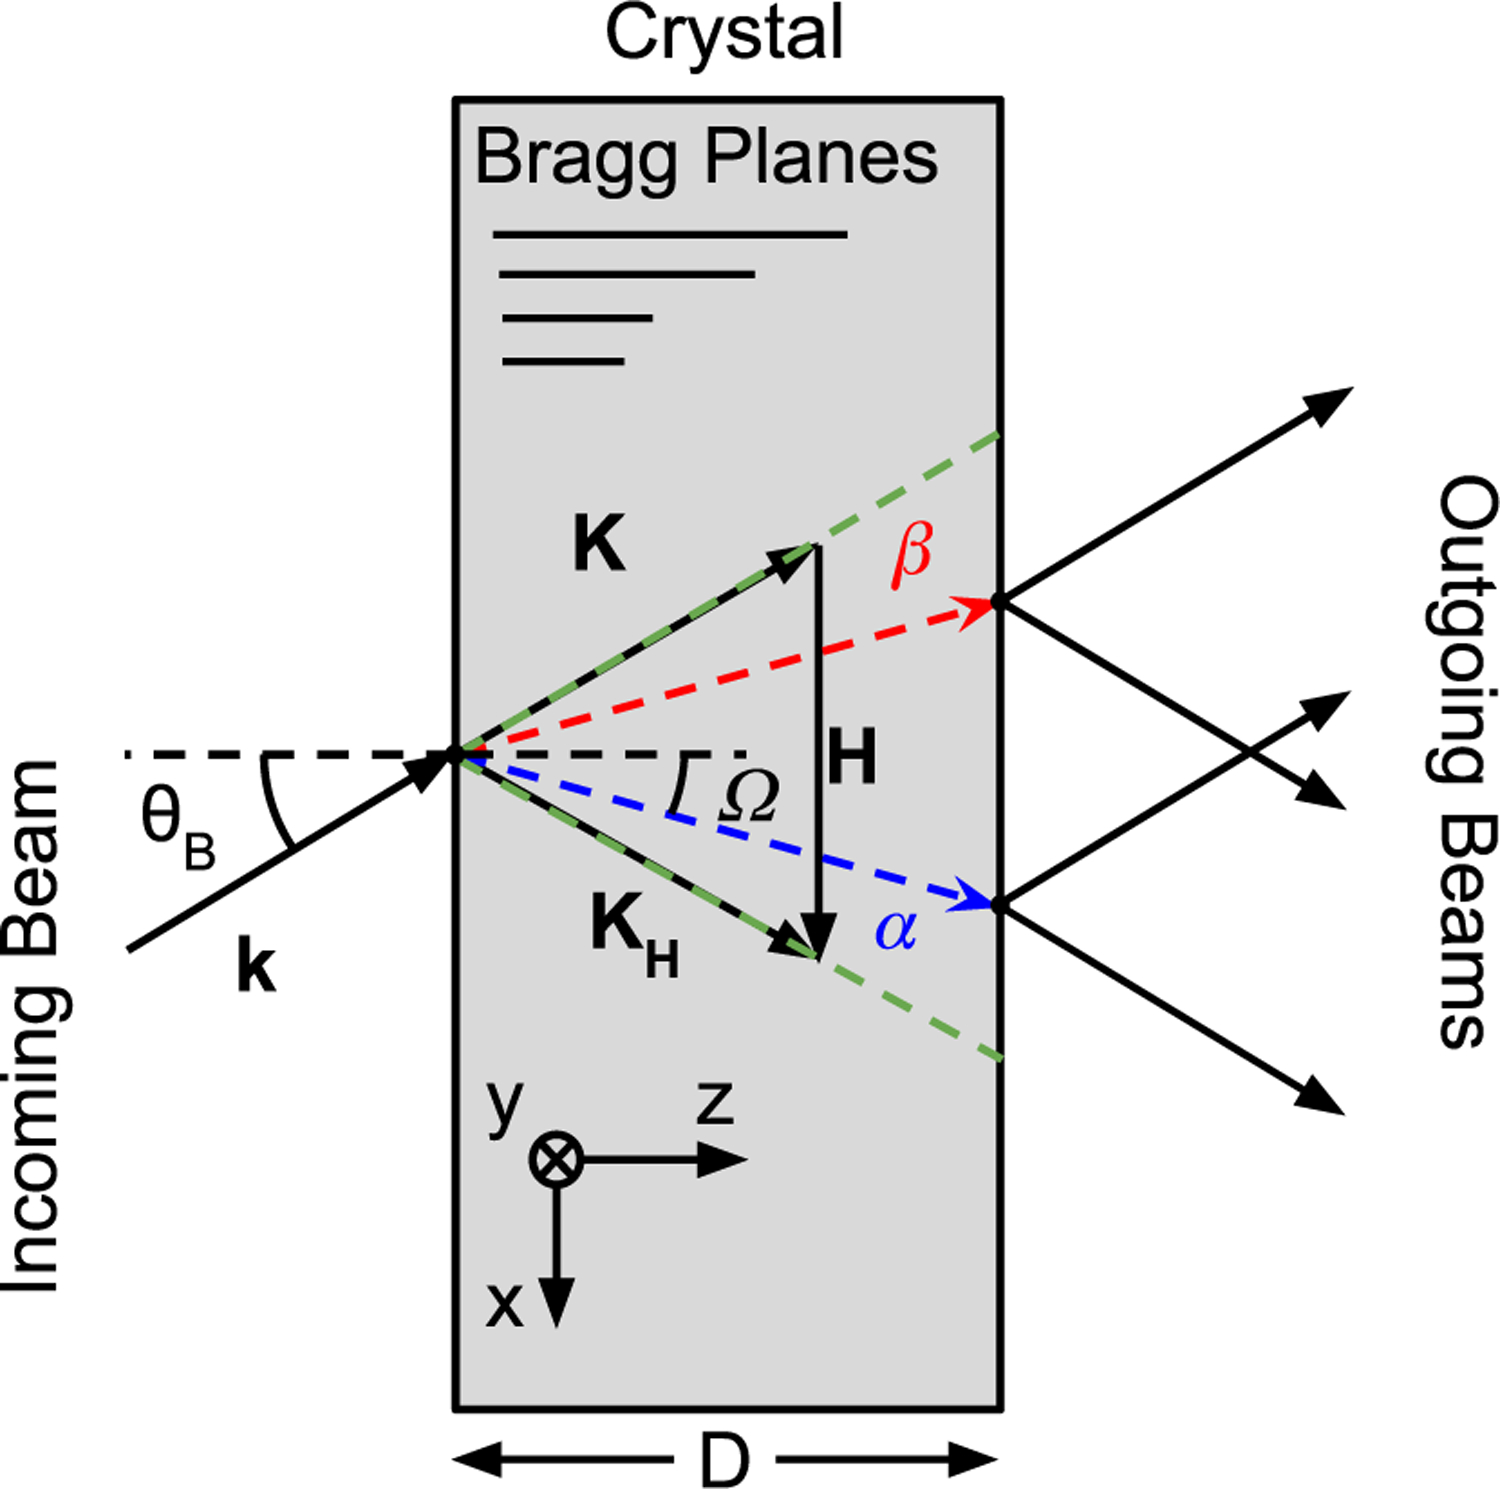
An incoming momentum state excites two degenerate, , states within the crystal. These two states become spatially separated according to the microradian misalignment of from the exact Bragg condition. Each incoming neutron wave packet fills the entire Borrmann fan (outlined by green dashed lines).
For momenta of the incoming particle extremely close to the exact Bragg condition, this leads to the well-known Pendellösung interference in a single diffracting crystal [2]. The two states become at least partially separated in space and can recombine upon subsequent Bragg diffractions. This leads to an interference peak in the reflected intensity as a function of crystal misalignment at the nanoradian scale [3–6]. These effects are also seen in Mach-Zehnder neutron interferometers. For example, dynamical phases affected measurements of gravitationally induced quantum interference [7–10]. More recently, it was demonstrated that one can use a Mach-Zehnder geometry with extra diffracting crystals to measure dynamical phase differences between fully separated beams [1,11,12].
This work was performed at the National Institute for Standards and Technology (NIST) Center for Neutron Research (NCNR) in Gaithersburg, Maryland. Following [3–6], two- and three-crystal rocking curves were measured by counterrotating two fused silica prisms between blades of a neutron interferometer. Our measurements show that both the net offset and variation of intrinsic Bragg plane misalignments are large enough to be relevant between and within diffracting crystal blades. It is then shown that this phenomenon is a possible culprit for the 20-yr discrepancy between theory and experiment for measurements of gravitationally induced quantum interference using a perfect-crystal neutron interferometer [9,10,13]. These experiments, beginning in 1975, are commonly referred to as the COW experiments after Colella, Overhauser, and Werner, the authors of the first measurement [14]. Bragg-plane misalignment will also affect future experiments that measure dynamical phases, such as precision measurements of the silicon structure factor, the measurement of which is sensitive to the Debye-Waller factor, the neutron-electron scattering length, and even fifth forces at the angstrom length scale [15–17].
We begin with the necessary, but unfortunately dense, results from dynamical diffraction theory. Two experiments to measure the net Bragg-plane misalignment between diffracting crystals of a neutron interferometer at the nanoradian level are covered in Sec. IV. Finally, we discuss the implications of this systematic on gravitationally induced quantum interference measurements in Sec. V.
II. DYNAMICAL DIFFRACTION IN PERFECT-CRYSTAL NEUTRON INTERFEROMETERS
Dynamical diffraction for the neutron case has been thoroughly treated in the past [18–20]. When a neutron wave packet undergoes Bragg diffraction in the Laue geometry (the reciprocal lattice vector H, pointed along the crystal surface), the reflected wave packet has a Lorentzian phase-space profile with a width δk/k ∼ vH/Hk ∼ 10−6, with vH given by [18]
| (1) |
where the summation is over one unit cell, with a3 being its volume and bv being the nuclear scattering length of the vth nuclei.
Dynamical phases are incurred from the momentum-space-dependent filling of the Borrmann fan, as shown in Fig. 3. For each incoming neutron momentum mode, two degenerate states are excited within the crystal. These two states, , are linear combinations of the transmitted, , and diffracted, , states and propagate in a direction through the crystal that is a function of the incoming momentum mode’s misalignment from Bragg. The definition of these states is given in Appendix A. Neutron momentum modes that are exactly on Bragg propagate orthogonally to H. Off-Bragg components pass through the crystal at an angle [20]
| (2) |
where θB is the Bragg angle, K is the incident momentum mode inside the crystal, and KH = K + H. Note that is another way of writing the Bragg condition, such that Ω = 0 at the exact Bragg condition and Ω → θB for increasingly off Bragg momenta.
FIG. 3.
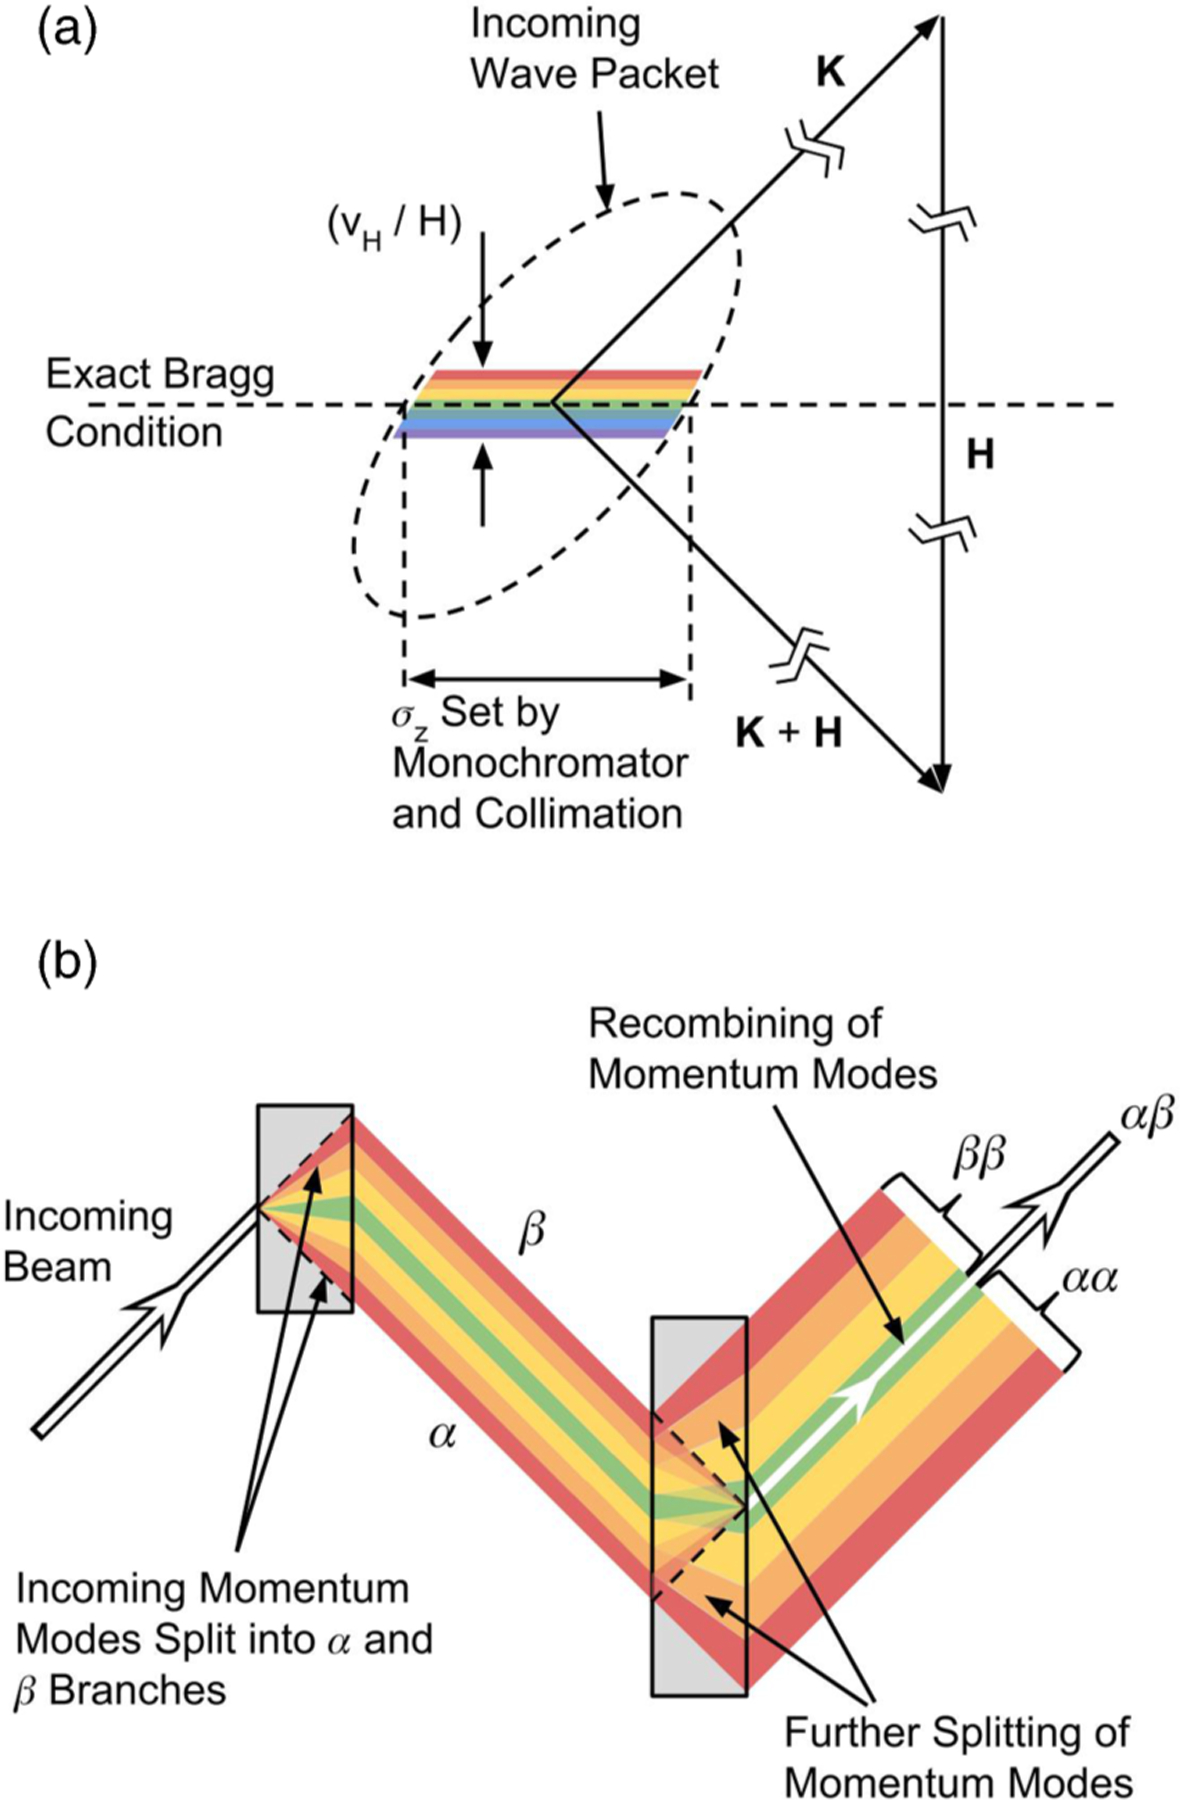
Dynamical phases in a two-crystal geometry. (a) Momentum-space depiction, with the component of k along H selected by the crystal colored. The magnitude of the crystal’s angular acceptance relative to the spread of the wave packet in phase space is greatly exaggerated for clarity. (b) Coherent recombination is dependent on the precise alignment of the crystals and a uniform potential between and within the diffracting crystals. Only the infrared deviations from Bragg are shown; the ultraviolet deviations follow the same pattern.
In the case of multiple diffracting crystals, the twofold-degenerate splitting of each incoming continues, such that there is a 2N splitting after N crystals. The α and β states are labeled according to the first crystal, corresponding to the sign of the current density, , relative to H for the first crystal, H0. If all of the crystals have the same thickness, there are N + 1 combinations of α and β reflections or transmissions leaving the Nth crystal with N − 1 recombination points (Fig. 4). If the crystals are perfectly aligned and have the same thickness, then there is no phase shift between the permutations of α and β states for each of the N − 1 recombination points. However, if one crystal is misaligned with respect to another, a momentum-dependent phase shift arises, which quickly leads to dephasing and a loss of contrast in the interferometer. This effect is why perfect-crystal neutron interferometers must be cut from single, float-zone-grown silicon ingots. Additionally, the interferometer blades are made to have the same thickness to a few micrometers to avoid similar dephasing effects.
FIG. 4.
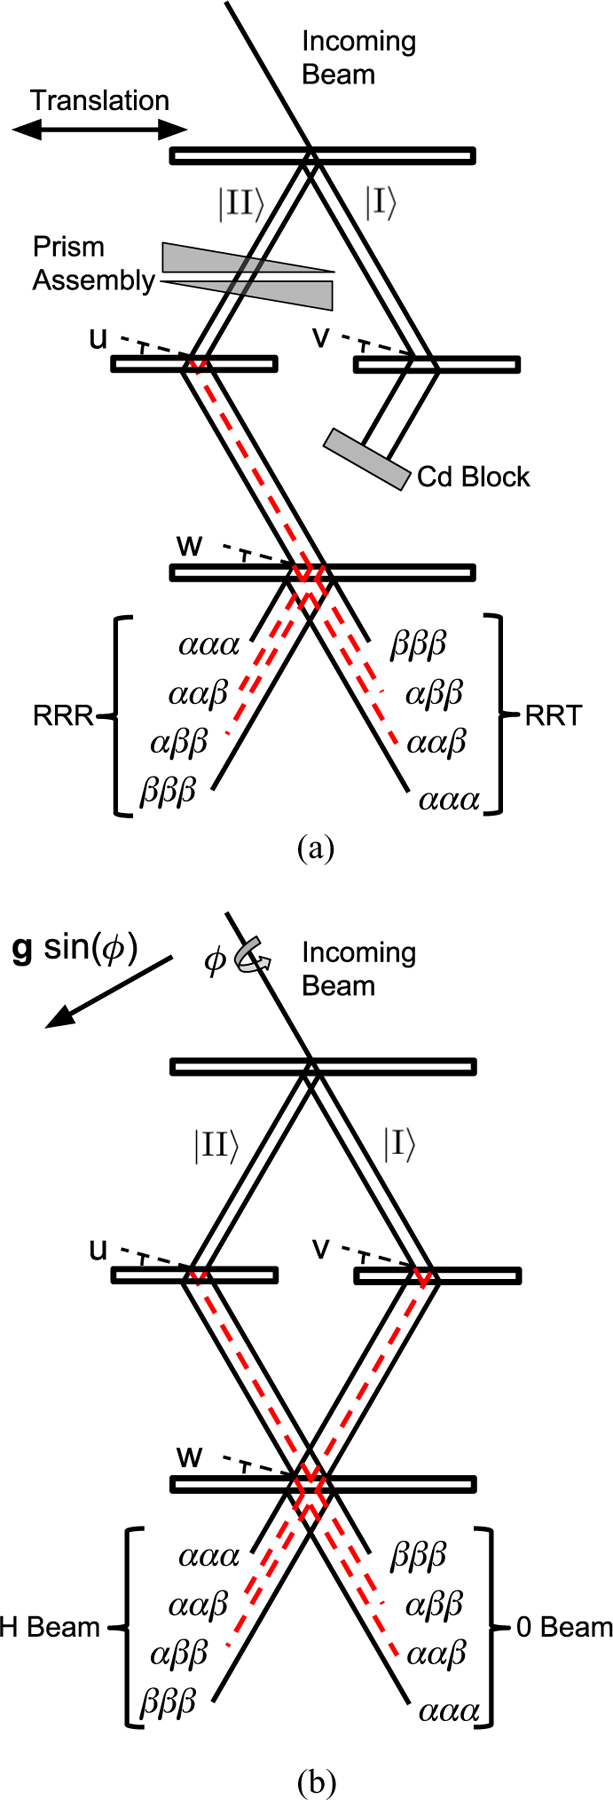
(a) Our experimental setup used to measure intrinsic misalignments in an interferometer. (b) The Mach-Zehnder neutron interferometer geometry used in the COW experiments. Here the direction of gravity is denoted by g sin(ϕ), where ϕ is the interferometer tilt about the incoming beam axis.
III. DYNAMICAL PHASE INTERFERENCE
Dynamical phases affect many diffracting geometries, from single-crystal Pendellösung interference [2,21,22] to multicrystal rocking curves [3–6], traditional Mach-Zehnder neutron interferometers [7,8,10], and more complicated geometries [1,11,12,16]. Crystal misalignment behaves as a phase shifter for a multicrystal interference peak [6], implying that such misalignments will change the predicted response of an overall Mach-Zehnder neutron interferometer. To see this, our measurements utilize the geometry depicted in Figs. 4(a) and 4(b). In Fig. 4(a) we depict how we use a Mach-Zehnder interferometer for our measurements, and in Fig. 4(b) we depict the usual method in which these interferometers are used (for example, in the COW experiments). We use the interference peak structure of two and three Bragg reflections to measure Bragg-plane misalignments. We then show how these misalignments affect the phase and contrast of a Mach-Zehnder interferometer.
A. Two-crystal geometry
It can be shown that the intensity for a twice Bragg reflected neutron is (up to a normalization constant)
| (3) |
where D1 and D2 are the thicknesses of the first and second diffracting crystals, δ is the angular Bragg-plane misalignment of the two crystals in the k,H plane, kz is the neutron momentum along the Bragg planes (see Fig. 2), and is the momentum-space intensity profile of the incoming wave packet (Fig. 3) along z. The integration variable Г ranges from −1 to 1 and is related to momentum in the H direction [20],
| (4) |
| (5) |
The function P is defined by
| (6) |
which is the origin of Pendellösung interference. Except for P(D2 − D1), the P(D) terms correspond to the overlap of states with different combinations of α and β reflections.
For the NIST setup, the width of (Fig. 3) is , and . As a result, the P (D) term is attenuated by only a few percent after the integration of over kz. However, the range of Г of and the envelope ensure that the highly oscillatory term
| (7) |
integrates to a small value. In other words, Pendellösung interference terms dephase very quickly for the crystal thicknesses typically used in neutron interferometers of D ~ 2.5 mm. As a result P (D) terms are often ignored, and most authors use the approximation
| (8) |
where J1 is the first-order Bessel function of the first kind and u = HDδ.
This approximation of letting P(D) → 0 is generally a good one and can be extended to any geometry of diffracting crystals. We therefore will not derive the equivalent of Eq. (3) for three-crystal rocking curves or Mach-Zehnder interferometers. However, we will explore what we call the “fine structure” in the intensity arising from nonzero P(D) terms in Sec. IVC for the two-crystal rocking curve.
For a more in-depth analysis of a two-crystal interferometer with thick blades the reader is encouraged to see [6]. The authors use a combination of prisms, phase steps, and a slit on the second crystal to characterize the interferometer.
B. Three-crystal geometry
In the Pendellösung dephasing limit, P(D) → 0, the interfering portion of a neutron undergoing three Bragg reflections is (Fig. 4) [23]
| (9) |
where u = HDδ1,2 and w = HDδ1,3, with δi,j being the angular misalignment between the ith and j th crystals. The u terms in Eqs. (8) and (9) are equivalent. We employ this relationship later to make an absolute measurement of the misalignment,
| (10) |
C. Misalignment in a Mach-Zehnder interferometer
The typical Mach-Zehnder geometry is depicted in Fig. 4(b), where two spatially separated, coherent beams (I and II) are produced in the first crystal blade and recombined in the final blade, resulting in two interfering beams, the 0 beam and the H beam. The COW experiments utilize this geometry. We can describe the response of a Mach-Zehnder neutron interferometer to misalignments with three independent variables, {u,v,w} (Fig. 4), which describe the misalignment between the two mirror and analyzer crystal blades relative to the initial splitter crystal blade. To do this, we start by writing down the state leaving the interferometer:
| (11) |
where we are coherently adding the states from paths I and II together. Then let
| (12) |
where ϕ0 is the nondynamical phase shift between the two paths of the interferometer and and are states that depend on the misalignments {u,v,w}. Notice that and is not a function u and |II) is not a function v, so that the misalignments of the mirror crystals for each path need not be the same. Comparing the intensity of the two beams exiting the interferometer to the measured interferogram,
| (13) |
The measured, dynamical phase φD is then [9]
| (14) |
and the contrast is given by
| (15) |
In general we can write in terms of the {α,β} branches,
| (16) |
Different combinations of α and β reflections and transmissions give Pendellösung terms similar to those already discussed in reference to Eq. (3). Therefore, in the Pendellösung dephasing approximation, the overlap between states with different numbers of α and β reflections and transmissions is taken to be zero when forming . Expressions for for the 0 beam are given in Appendix B.
IV. EXPERIMENT
An assembly of two fused silica prisms, each with a pitch of 6°, was placed between the first and second blades of a three-blade interferometer [Fig. 4(a)]. The prism assembly is the same as the one used in [24]. The beam transmitted through the first crystal blade was blocked. The prisms were counterrotated to deflect the neutron beam in the k,H plane, generating interference peaks in two detectors, labeled RRR and RRT. The RRR RRT (equivalent to RR) and RRR signals are of interest here and are given by Eqs. (8) and (9), respectively.
Measurements were made with two of the NIST neutron interferometers. For the first interferometer, a single set of RR and RRR curves was measured over a long period of time, so that the uncertainty in the peak position would be low, and the fine structure [P (D) ≠ 0] of the RR curve could be analyzed (see Sec. IV C). For the second interferometer, the RR and RRR curves were measured as a function of interferometer translation to measure any spatial dependence of the Bragg-plane misalignments between crystal blades.
To measure a rocking-curve interference peak, the prisms are counterrotated (Fig. 5), and the beam deflection due the prisms is of the form
| (17) |
where γ is the pitch of the prism; θ is the angle between the prism rotation axis and the neutron beam; and ϕ is the angle of the prism from vertical. For the first set of measurements, the prism assembly was aligned parallel to the interferometer blades, so that .
FIG. 5.
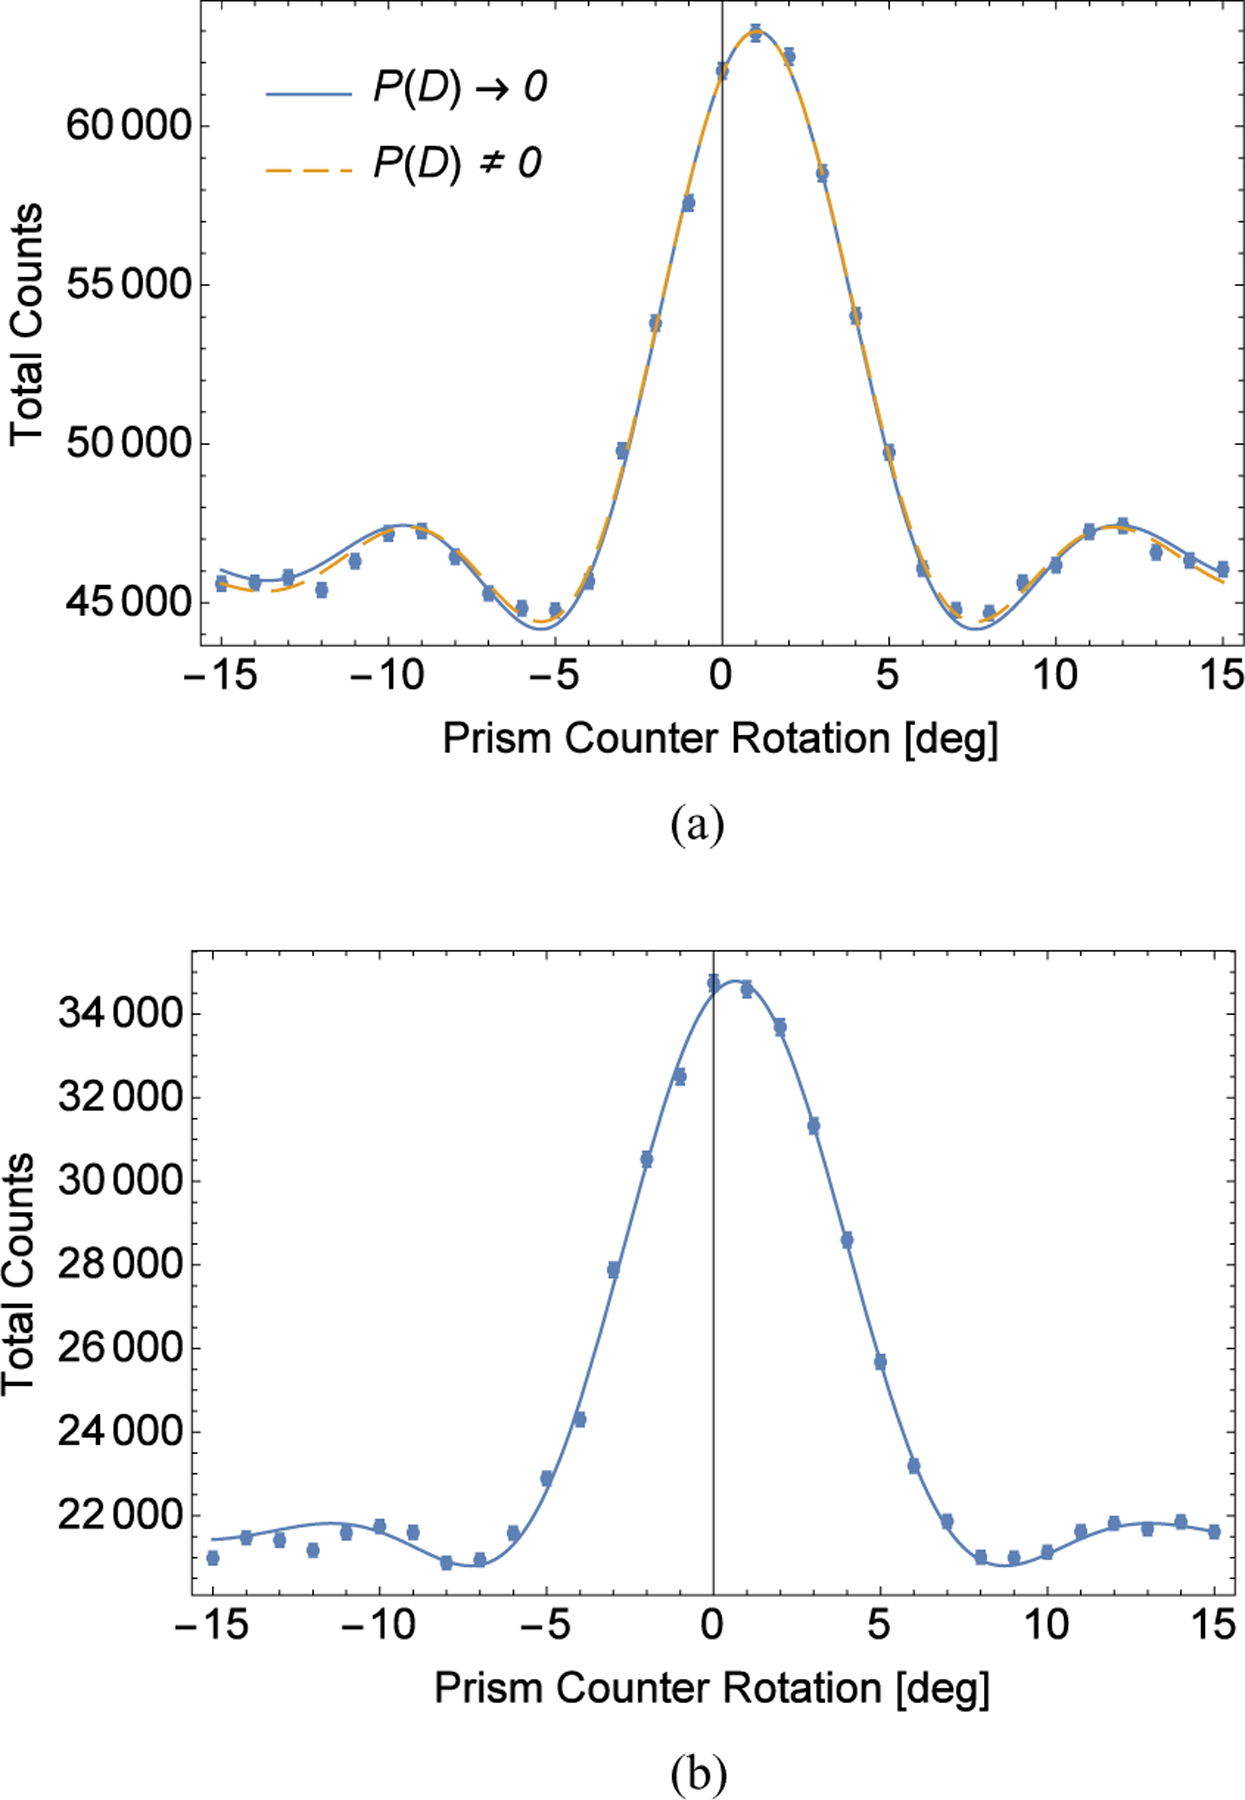
RR and RRR summed intensity with fits. Integrated count time was 89 min per point. Each plot is the sum of 89 individual rocking curves. (a) RR intensity. The P (D) → 0 fit uses Eq. (20), and the P (D) ≠ 0 fit is explained in Sec. IV C. (b) The RRR intensity with the fit to Eq. (21).
For the second set of measurements, the prism assembly was aligned perpendicular to the beam such that . The horizontal spatial dependence of the rocking-curve peak positions was measured by translating the interferometer relative to the beam by 1 cm in 1 mm steps, with rocking curves taken for each translational position (see Fig. 7 below). With the translation of the interferometer, the crystal volume probed by neutrons is also shifted. Rocking-curve position vs translation thus gives a one-dimensional map of the Bragg-plane misalignment between crystal blades as a function of position.
FIG. 7.
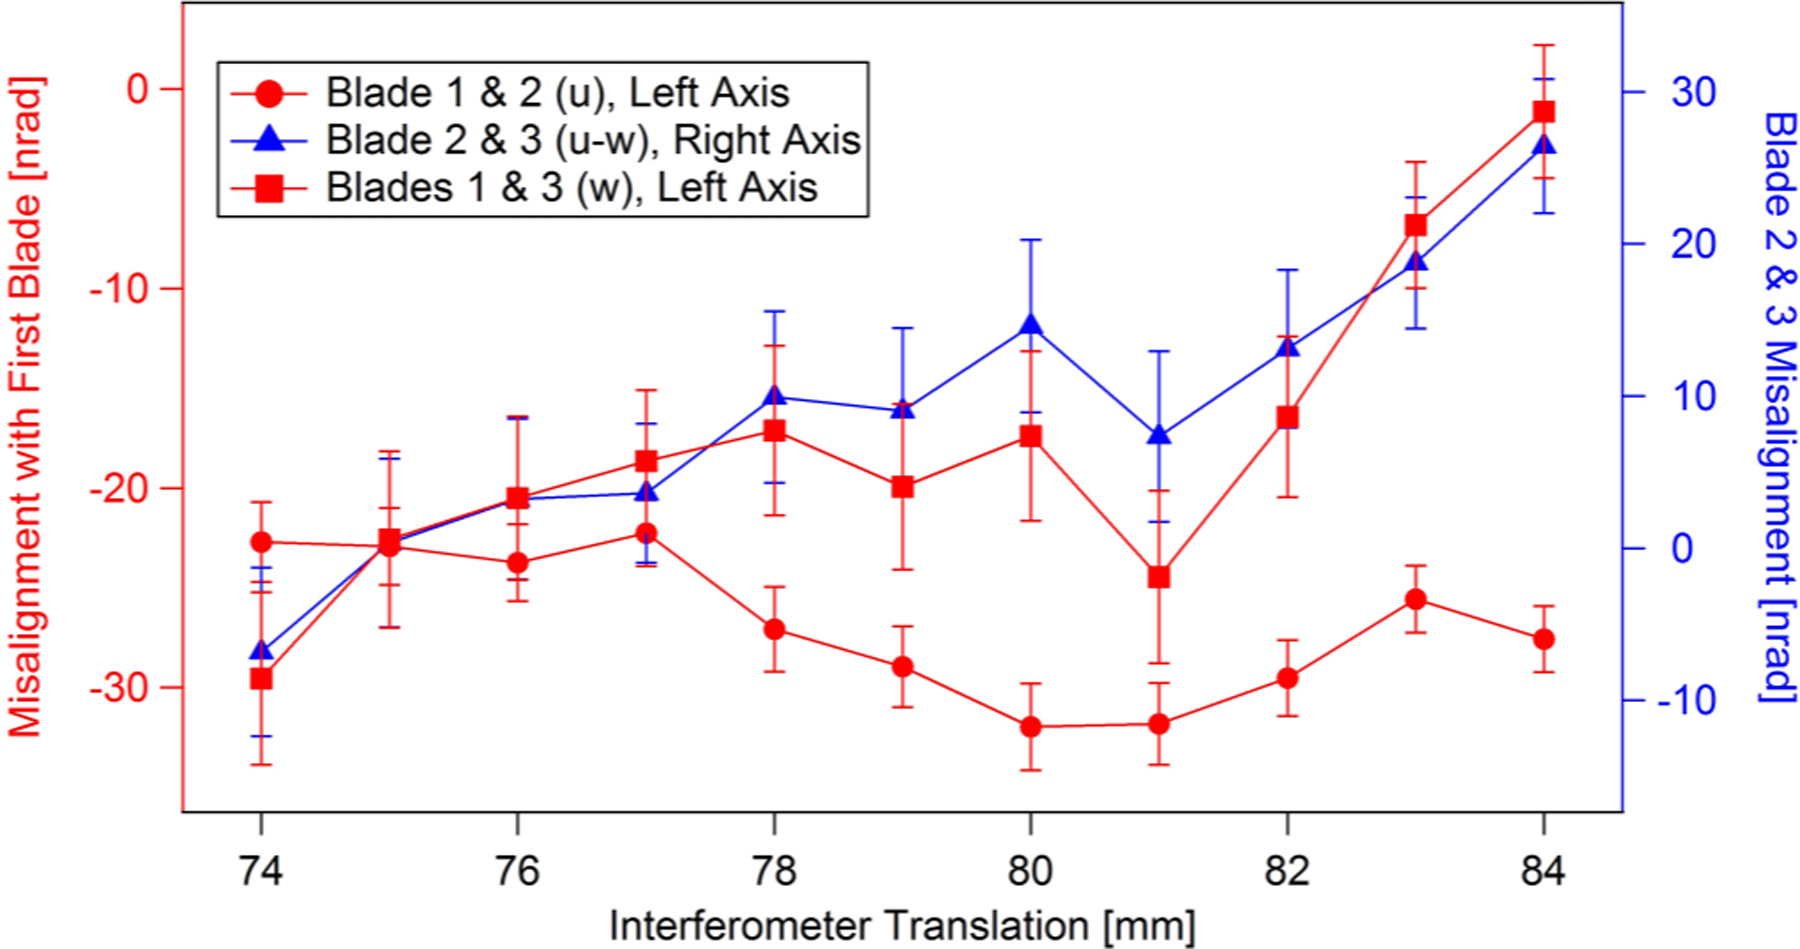
Misalignments as a function of interferometer translation. The measured misalignments between blades 1 and 2 and blades 1 and 3 are shifted depending on a possible offset in the prism counterrotation (red data, left axis), while the misalignment between blades 2 and 3 is an absolute measurement (blue data, right axis).
A. Peak location and sensitivity
To assess a rocking curve’s tendency to drift (similar to the way the phase of a Mach-Zehnder neutron interferometer drifts), the peak position of each RR rocking curve for the first crystal was found by fitting to Eq. (20), which is defined in the next section; included is an explanation of how the peak locations can be reported in terms of an intrinsic angular alignment. The set of 89 rocking-curve positions fits a Gaussian distribution , with μ = (16.9 ± 0.4) nrad and σ = (3.24 ± 0.34) nrad (Fig. 6). The peak locations are stable, and the uncertainty matches that which is predicted by counting statistics; the average peak location uncertainty was 2.94 nrad. Furthermore, averaging the 89 individual rocking-curve positions gives (16.78 ± 0.31) nrad, which is indistinguishable from fitting the combined data to Eq. (20). This yields a peak location of (16.37 ± 0.31) nrad. The average reduced χ2 (31 – 4 DOF (degree of freedom)) for the 89 individual rocking-curve fits was 1.1. The reduced χ2 for the combined fit was 2.8.
FIG. 6.
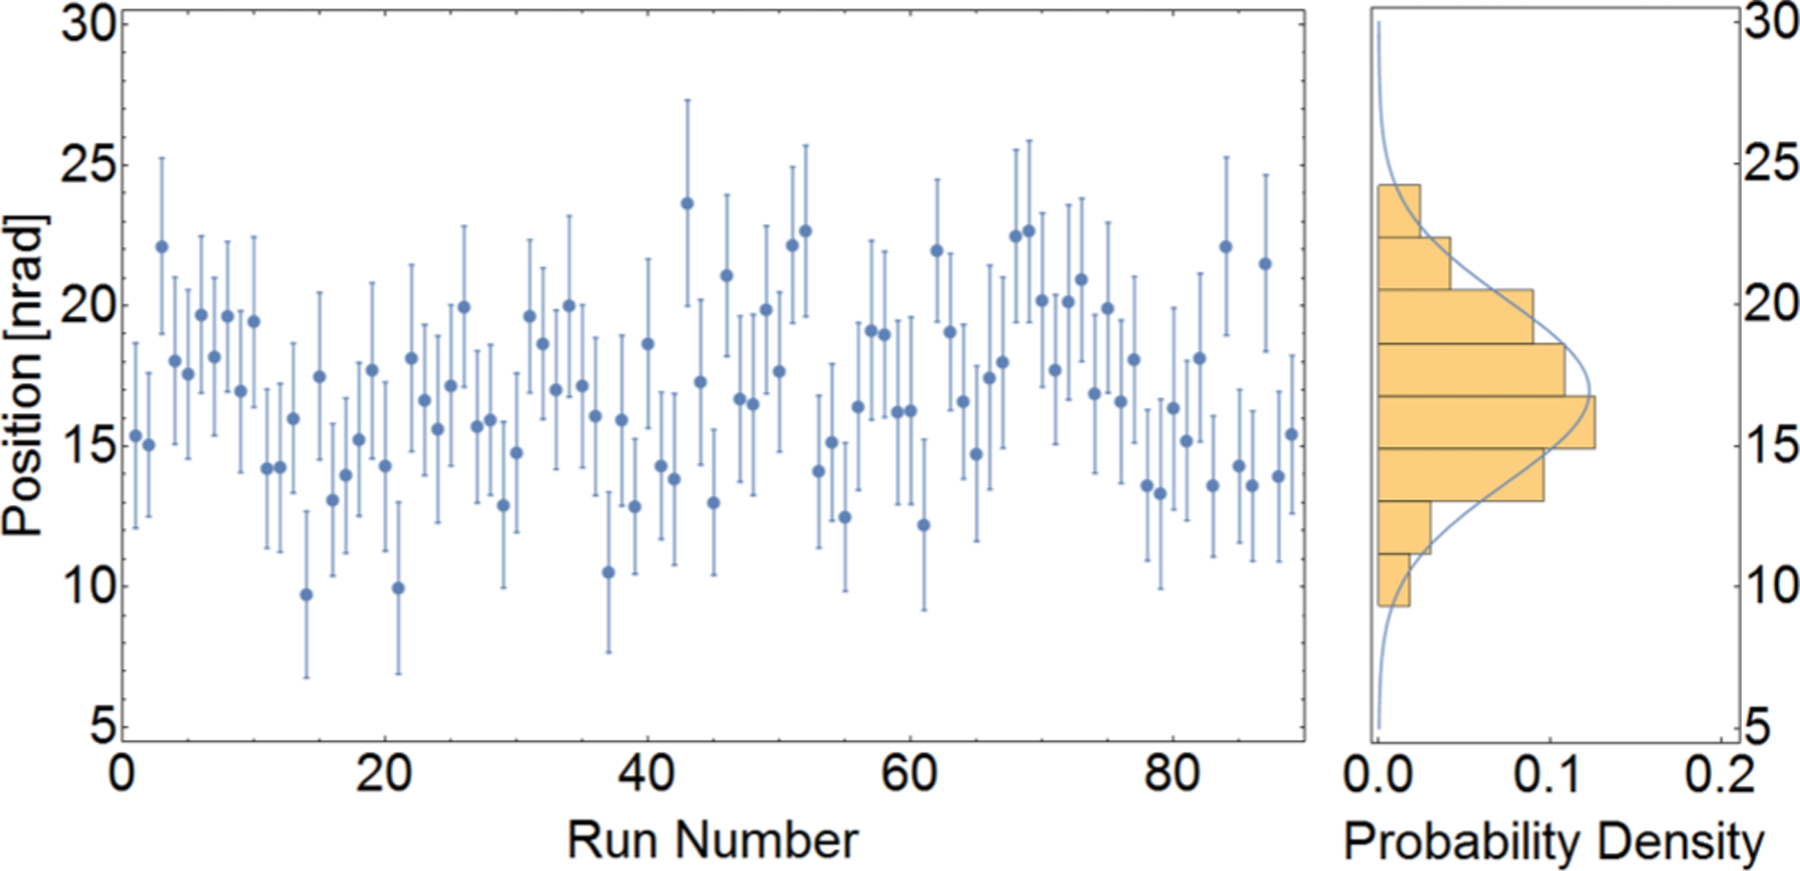
Fitted peak locations follow the distribution predicted by counting statistics. The average uncertainty in the individual rocking-curve peak positions was 2.94 nrad. This should be compared to fitting the set of 89 rocking-curve peak positions to a Gaussian distribution, which gives σ = (3.24 ± 0.34) nrad.
The interference structure outside the central peak is undetectable in an individual rocking curve yet can be resolved from summing many rocking curves together. Complications arising from Pendellösung interference may explain why the χ2 from the single rocking curve is inferior to the χ2 from 89 individual fits (see Sec. IV C). The uncertainty in the central peak location corresponds to an angular resolution for the setup used here of 0.35 nrad misalignment between crystals for 2 days of measurement. This sensitivity can conceivably be increased by two or more orders of magnitude by using thicker diffracting crystals, blocking the noninterfering portions of the outgoing beam and running a dedicated experiment for ~1 month, making angular deflection measurements at the picoradian level a possibility.
B. Intrinsic Bragg-plane misalignment
Intrinsic misalignment of Bragg planes has been observed in two-blade interferometers before by Arthur et al. [6]. We are able to measure the intrinsic misalignment between the second and third blades here. The intrinsic misalignments elsewhere in the interferometer are indistinguishable from the relative alignment of the prisms. We form fit functions by substituting
| (18) |
into Eqs. (8) and (9), where a is a fit parameter that has to do with the prism material and neutron wavelength and δp is given by Eq. (17). If there is an offset in the prism counterrotation, ϕ → ϕ + ϕ0 in Eq. (17), then to first order in ϕ0 this adds the same constant offset to u0 and w0. Inserting Eq. (18) into Eq. (9), the form of the RRR beam intensity is given by
| (19) |
The first term changes only the peak baseline, which is absorbed into the A and B fit parameters below. Combing this result with the RR result, we now have two fit functions with related parameters:
| (20) |
| (21) |
where {A1,2,B1,2,a,u0,w0} are fit parameters and δp is the independent variable given by the prism counterrotation [Eq. (17)]. Here we have let the prism counterrotation misalignment be absorbed into u0 and w0, such that
| (22) |
where the c and p subscripts refer to the intrinsic crystallographic misalignment and the effective misalignment from an unknown offset in the prism counterrotation, respectively, and we have noted that wp = up. In short, the RR peak is located at u0, and the RRR peak location is (u0 + w0)/2. As a result, computing the misalignment u0 – w0 = uc – wc automatically removes the effective misalignment from the prism counterrotation offset ϕ0.
Fitting the RR curve [Fig. 5(a)] to Eq. (20) gives . Combining this result with the RRR fit of Fig. 5(b) to Eq. (21) yields , leading to a measured absolute misalignment, for the first interferometer. Both fits have reduced χ2 (31 − 4 DOF) of 2.8. The uncertainties quoted here do not use expanded error bars to decrease the reduced χ2 to 1. Doing so increases the quoted uncertainties by a factor of .
When the second interferometer was translated, we found a variation in misalignment on the order of 4 nrad/mm. Shown in Fig. 7 are the measured rocking-curve positions as a function of interferometer translation. This suggests that the variation in crystallographic misalignment within each diffracting crystal is large enough to be relevant. If crystallographic misalignments are taken to be fields instead of constants, then the integrals over Г as well as the solutions to Shrödinger’s equation within the crystal are perturbed. These effects, which we do not take into account in our fits of the RR and RRR intensity, as well as the discussion in the next section, help explain the poor reduced χ2 for both the RR and RRR fits.
C. Rocking-curve fine structure
If the P (D) terms in Eq. (3) are not neglected in regards to the RR curve, the fit can be improved. An outline of the fit functions used is given in Appendix C. Keeping the P (D) terms adds three more parameters to the fit,
| (23) |
In this context D is the average of the crystal thicknesses. The reduced χ2 (31 – 4 DOF) when using Eq. (20) as a fit function was 2.8. If |vH|D/kz is allowed to be a fit parameter, the reduced χ2 (31 – 5 DOF) falls to 1.9. It was found that |vH|(D2 – D1)/kz and did not impact the quality of the fit. However, a range for each can be computed given what we know about the thicknesses of the interferometer blades and the phase-space profile of the incoming neutron beam. For the beam used here, , which attenuates the P (D) terms by only a few percent, and the crystal thicknesses are thought to be the same to a few microns.
Even though the parameters |vH|(D2 – D1)/kz and do not improve the fit, they are covariant with u0 and |vH|D/kz. As such, assuming a possible range of values for the difference in crystal thicknesses and the beam divergence slightly changes the best fits for the rocking-curve peak position and silicon structure factor. We should therefore include a systematic uncertainty when reporting rocking-curve peak positions. By performing fits over the acceptable ranges of |vH|(D2 – D1)/kz and , we find a systematic uncertainty in and |vH|D/kz of 0.08 and 0.15 nrad, respectively. This leaves us with x ± σstat ± σsys of and |vH |D/kz = (220.29 ± 0.25 ± 0.15), with for 31 – 5 DOF.
The still large reduced χ2 of 1.9 indicates there may be additional complications to the rocking-curve structure. This is likely due to variation in crystallographic misalignment between crystal blades demonstrated in Sec. IV B. Our fit of |vH |D/kz corresponds to a sensitivity to vH of one part in 10−3, which is the level at which the neutron electron scattering length impacts vH. However, the uncertainty in the Debye-Waller factor prevents a measurement of the neutron electron scattering length from being performed with only one Bragg diffraction [15]. Our sensitivity to vH is not surprising, as two-crystal rocking curves have been used to measure the x-ray silicon structure factor [25]. In that case the impact of the incoming momentum-space profile has also been studied [26]. While the net misalignment between the two diffracting crystals of the RR curve does not affect a measurement of vH, the same cannot be said for the setups used in [1,11,12] or in [16], where extra diffracting crystals are placed in a Mach-Zehnder neutron interferometer. However, all Bragg diffraction measurements of vH are subject to possible systematics caused by variations in H within the diffracting crystal(s). Our measurement of the spatial dependence of Bragg-plane misalignments discussed in Sec. IVB suggests this effect is not negligible. We leave the analysis of the impact of such stress fields on rocking curves and Pendellösung interference to future work.
V. IMPLICATIONS FOR GRAVITATIONALLY INDUCED QUANTUM INTERFERENCE EXPERIMENTS
In the COW gravitationally induced quantum interference experiments, a Mach-Zehnder neutron interferometer is tilted about the incoming beam axis to induce a gravitational phase shift between paths of the interferometer from the earth’s gravitational field [Fig. 4(b)]. The resulting phase shift versus sin ϕ, where ϕ is the interferometer tilt angle, is predicted to be linear, with the slope qgrav being the measured value to be compared to theory. The primary contribution to qgrav is due to the path separation in the earth’s gravitational field, but a few corrections are needed.
Dynamical phase effects contributed a perturbation in the expected phase shift for the COW experiments. The Sagnac effect constituted another correction, and bending of the interferometer crystal itself was accounted for using simultaneous neutron, x-ray measurements [9]. Later experiments used two neutron wavelengths to account for the crystal bending [10,13]. We will focus on data from [9], which used the x-ray technique, because they are more easily analyzed from information given in the article. For a history and more thorough description of the COW experiments, see [20].
When the interferometer is tilted in the COW geometry, the beam between crystal blades is deflected by up to about 100 nrad by gravity, leading to the dynamical phase correction. We measured misalignments between diffracting crystals on the order of 10 to 40 nrad. The relative size of the intrinsic misalignments and gravitational deflection imply that the natural misalignment of the interferometer is large enough to perturb the predicted dynamical phase shift. This is a likely explanation for the dynamical phase in the COW experiments being consistently smaller than predicted. Recalculating the dynamical phase contribution to the gravitationally induced phase shift while allowing for intrinsic crystal misalignment, we find that including nonzero Bragg-plane misalignments attenuate the dynamical phase contribution [Figs. 8(a) and 8(c)] and also impact the predicted loss of contrast as a function of interferometer tilt [Fig. 8(b)]. Here we have assumed the phase shift due to the bending of the interferometer under its own weight is already accounted for by the simultaneous x-ray measurement. The distortion of the theoretical contrast and dynamical phase contribution are due to net misalignments that we have not allowed to change upon tilting the interferometer. The nonlinear nature of the dynamical phase and contrast corrections and the three degrees of freedom create the predicted distortions of the dynamical phase and contrast response. The correction from reasonable misalignments as measured in this work is of the correct size to account for the discrepancy between theory and experiment in [9].
FIG. 8.
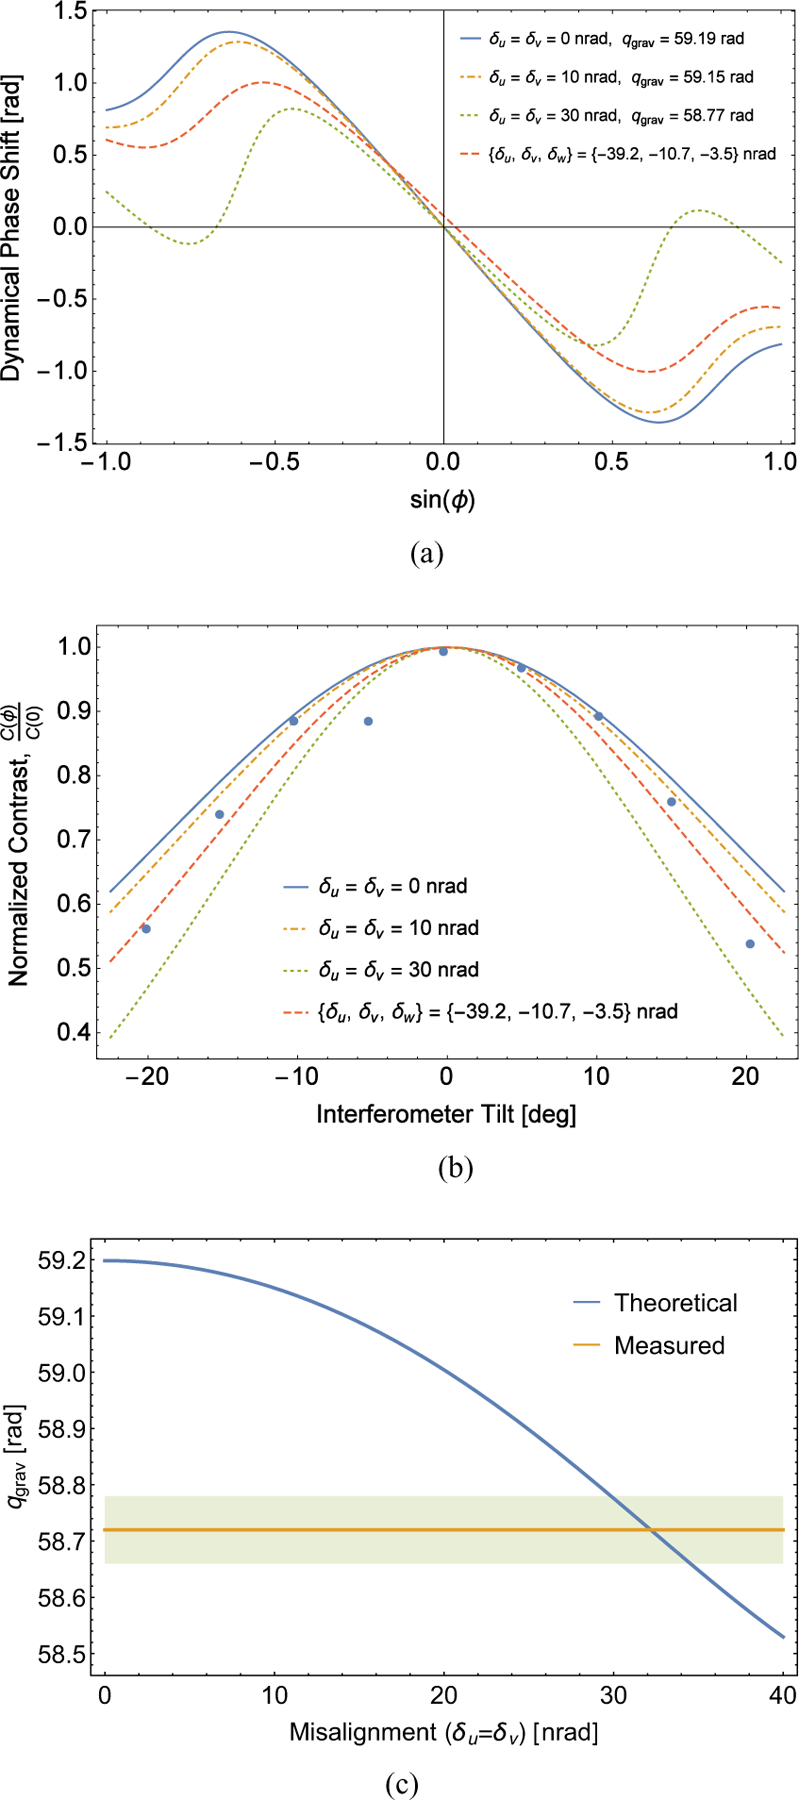
(a) Dynamical phase [Eq. (14)] for the interferometer used in [9] were it to have intrinsic misalignments. The corresponding theoretical values of qgrav are given in the legend. The final curve has qgrav set to the measured value of (58.72 ± 0.03) rad [9]. (b) Normalized contrast [Eqn. (15)] vs tilt for the interferometer used in [9] were it to have intrinsic misalignments. Data points are from [9]. Uncertainties were not reported. (c) Theoretical slope of the gravitational phase shift as a function of δu = δv crystal misalignment with δw = 0. Experimental results ±2σ from [9] are also shown.
There are too many relevant parameters that would need to be measured to recompute the dynamical phase correction for previous COW experiments with intrinsic crystallographic misalignments in the interferometer crystal included. However, for the interferometer used in [9], we were able to find a set of misalignments that were consistent with qgrav and fitted to normalized contrast, [Fig. 8(b)]. A fit to contrast versus tilt angle cannot determine all three misalignment parameters. As a result, the fit to contrast was performed with the theoretical value of qgrav fixed to be the value measured in [9]. Additionally, to see that misalignments tend to decrease the theoretical value of qgrav, Fig. 8(c) shows qgrav as a function of misalignment with δu = δv and δw = 0 compared to the measured value from [9].
The predicted contrast at no tilt with {δu,δv,δw}= {−39.2 nrad, − 10.7 nrad, − 3.5 nrad} for the interferometer used in [9] is 81%, which should be compared with the measured value of 59%. Fits to absolute contrast, instead of normalized contrast, yielded poor results, suggesting that there are other factors contributing to loss of contrast in this interferometer. The variation in misalignments within diffracting crystals as discussed in Sec. IV B or environmental factors such as vibrations are possible culprits.
A two-crystal interferometer such as the one used in [6] may be able to resolve the disagreement between theory and experiment for gravitationally induced quantum interference using silicon neutron interferometers. If such an interferometer were tilted along the beam axis, deflection due to gravity would shift the central interference peak. As we have shown here, complications from crystal-blade misalignments can be measured for such an interferometer in a fairly direct manner. Only the centroid of the rocking curve would be affected due to gravity and the Sagnac effect, the consequences of which are calculable.
Finally, we note that gravitationally induced quantum interference has since been found to agree with theory at the 0.1% level using a spin-echo neutron interferometer [27] and at 0.08% with a very cold grating neutron interferometer [28]. Atom interferometer experiments have confirmed theory at the parts per billion level [20].
The effect of intrinsic misalignments in neutron interferometers does not end with gravitationally induced quantum interference. In the experiment performed in [11], a measurement of the dynamical phase upon Laue transmission resulted in a weaker dynamical phase response than predicted. It is unclear whether including nonzero intrinsic interferometer misalignments would explain the discrepancy.
VI. CONCLUSION
Measurements that rely on dynamical phases in neutron interferometry require careful characterization of imperfections in the interferometer crystal. Crystal misalignments on the 10 to 40 nrad level, as well as a dependence on Pendellösung oscillations, have been measured for two monolithic silicon neutron interferometers at the NCNR. Such crystallographic imperfections may affect future precision measurements of the silicon structure factor and provide a likely explanation for the discrepancy between theory and experiment in the COW gravitationally induced quantum interference measurements. Rocking-curve interference peaks have the potential to measure very small deflections (on the order of picoradians) of the neutron beam in an interferometer, as well as characterize the strain in Mach-Zehnder neutron interferometers.
ACKNOWLEDGMENTS
The authors would like to acknowledge S. Werner for leading the long effort to precisely measure gravitationally induced quantum interference with neutron interferometers. We would also like to thank M. Snow and F. Wietfeldt for fruitful discussions. This work was supported in part by the U.S. Department of Energy under Grant No. DE-FG02–97ER41042, National Science Foundation Grants No. PHY-1307426 and No. PHY-1205342, Canadian Excellence Research Chairs (CERC) (Grant No. 215284), Natural Sciences and Engineering Research Council of Canada (NSERC) Discovery (Grant No. RGPIN-418579), Collaborative Research and Training Experience (CREATE) (Grant No. 414061), and with the coefficients the NIST Quantum Information Program.
APPENDIX A: ENERGY EIGENSTATES OF THE DYNAMICAL DIFFRACTION HAMILTONIAN
We wish to find solutions to the dynamical diffraction Hamiltonian [18]:
| (A1) |
where bℓ,v is the scattering length of the nucleus located at rℓ,v, ℓ indexes the unit cells, and v indexes the position within the crystal cell. It is customary to expand Eq. (A1) in momentum space:
where KH ≡ K + H and vq is the neutron-silicon structure factor per unit cell, given by [18]
| (A3) |
where e−W is the Debye-Waller factor and Ω0 is the volume of a unit cell. This Hamiltonian leads to the secular equation
| (A4) |
where we have suggestively labeled our energy eigenvalue (with factored out) as k2. This will later turn out to be the momentum of an incoming momentum mode . Solving the secular equation for a fixed momentum K gives
| (A5) |
The energy states of the dynamical diffraction Hamiltonian therefore make up a continuous spectrum with a twofold degeneracy formed by two momentum states, which we now call K±,
| (A6) |
where
| (A7) |
with δK being the deviation from the exact Bragg condition. The corresponding value of is then
| (A8) |
We are now ready to write down the energy eigenstates of the dynamical diffraction Hamiltonian,
| (A9) |
with the coefficients
or, in terms of the customary η parameter (which will replace K in the H direction as an integration variable),
| (A10) |
| (A11) |
Additionally, it can be shown that the ± states traverse a distance x′ − x along the crystal,
| (A12) |
It is usually more useful to switch from the {±} basis to the {α,β} basis where , which simply requires that [20]
for the ± in the equations above.
APPENDIX B: MACH-ZEHNDER GEOMETRY CALCULATIONS
Following previous work [3,9,10,23] but generalizing to let there be three separate misalignments {u,v,w} gives
| (B1) |
| (B2) |
| (B3) |
| (B4) |
for the 0 beam. The phase and contrast of a regular interferogram can then be extracted by inserting these expressions into Eqs. (14) and (15).
APPENDIX C: ROCKING-CURVE FINE STRUCTURE
We wish to estimate Eq. (3) in terms of a set of parameters, , which corresponds to integrals of the form
| (C1) |
Because the blades of the interferometer are nearly the same thickness, the P (D2 − D1) term in Eq. (3) can be expanded in terms of ∆ → ξ,
| (C2) |
This approximation is found to have an error of less than 0.5% of the peak maximum for ξ = 0.2 and any value of μ. The P (D) terms in Eq. (3), on the other hand, are extremely oscillatory, so we integrate over and use a stationary phase method, similar to [29,30]. In this case, it is better to integrate over η than Г:
| (C3) |
We then expand the argument of the exponential f(η) around η0, which should be close to a minimum of f(η). To avoid having to numerically find η0, we neglect terms and higher in , which gives
| (C4) |
We then neglect terms in the argument of the exponential of (η − η0)3 and higher and complete the integral as a Gaussian,
| (C5) |
This function is found to have an error of less than 0.5% of the peak value over the relevant ranges of {μ,∆,σ}.
References
- [1].Zawisky M, Springer J, Farthofer R, and Kuetgens U, Nucl. Instrum. Methods Phys. Res., Sect. A 612, 338 (2010). [Google Scholar]
- [2].Shull C, Phys. Rev. Lett 21, 1585 (1968). [Google Scholar]
- [3].Bonse U, Graeff W, Teworte R, and Rauch H, Phys. Status Solidi A 43, 487 (1977). [Google Scholar]
- [4].Bonse U, Graeff W, and Rauch H, Phys. Lett. A 69, 420 (1979). [Google Scholar]
- [5].Rauch H, Kischko U, Petrascheck D, and Bonse U, Z. Phy. B 51, 11 (1983). [Google Scholar]
- [6].Arthur J, Shull CG, and Zeilinger A, Phys. Rev. B 32, 5753 (1985). [DOI] [PubMed] [Google Scholar]
- [7].Bonse U and Wroblewski T, Phys. Rev.D 30, 1214 (1984). [Google Scholar]
- [8].Horne MA, Physica B C (Amsterdam) 137, 260 (1986). [Google Scholar]
- [9].Werner SA, Kaiser H, Arif M, and Clothier R, Physica B C (Amsterdam) 151, 22 (1988). [Google Scholar]
- [10].Littrell KC, Allman BE, Motrunich O, and Werner SA, Acta Crystallogr., Sect. A 54, 563 (1998). [Google Scholar]
- [11].Springer J, Zawisky M, Lemmel H, and Suda M, Acta Crystallogr., Sect. A 66, 17 (2009). [DOI] [PubMed] [Google Scholar]
- [12].Potocar T, Zawisky M, Lemmel H, Springer J, and Suda M, Acta Crystallogr., Sect. A 71, 534 (2015). [DOI] [PubMed] [Google Scholar]
- [13].Littrell KC, Allman BE, and Werner SA, Phys. Rev. A 56, 1767 (1997). [Google Scholar]
- [14].Colella R, Overhauser AW, and Werner SA, Phys. Rev. Lett 34, 1472 (1975). [Google Scholar]
- [15].Sparenberg J-M and Leeb H, J. Electron Spectrosc. Relat. Phenom 129, 315 (2003). [Google Scholar]
- [16].Wietfeldt F, Huber M, Black TC, Kaiser H, Arif M, Jacobson D, and Werner S, Phys. B (Amsterdam, Neth.) 385, 1374 (2006). [Google Scholar]
- [17].Greene GL and Gudkov V, Phys. Rev.C 75, 015501 (2007). [Google Scholar]
- [18].Sears VF, Can. J. Phys 56, 1261 (1978). [Google Scholar]
- [19].Lemmel H, Acta Crystallogr., Sect. A 69, 459 (2013). [Google Scholar]
- [20].Rauch H and Werner SA, Neutron Interferometry: Lessons in Experimental Quantum Mechanics, Wave-Particle Duality, and Entanglement, 2nd ed. (Oxford University Press, Oxford, 2015). [Google Scholar]
- [21].Shull CG and Oberteuffer J, Phys. Rev. Lett 29, 871 (1972). [Google Scholar]
- [22].Shull C and Shaw W, Z. Naturforsch. A 28, 657 (1973). [Google Scholar]
- [23].Petrascheck D and Rauch H, Acta Crystallogr., Sect. A 40, 445 (1984). [Google Scholar]
- [24].Pushin D, Cory D, Arif M, Jacobson D, and Huber M, Appl. Phys. Lett 90, 224104 (2007). [Google Scholar]
- [25].Teworte R and Bonse U, Phys. Rev.B 29, 2102 (1984). [Google Scholar]
- [26].Bonse U and Teworte R, Z. Naturforsch. A 37, 427 (1982). [Google Scholar]
- [27].de Haan V-O, Plomp J, van Well AA, Rekveldt MT, Hasegawa YH, Dalgliesh RM, and Steinke N-J, Phys. Rev. A 89, 063611 (2014). [Google Scholar]
- [28].Van der Zouw G, Weber M, Felber J, Gähler R, Geltenbort P, and Zeilinger A, Nucl. Instrum. Methods Phys. Res., Sect. A 440, 568 (2000). [Google Scholar]
- [29].Kato N, Acta Crystallogr 14, 526 (1961). [Google Scholar]
- [30].Kato N, Acta Crystallogr 14, 627 (1961). [Google Scholar]


