

Abstract
Background
Trimethylamine‐N‐oxide (TMAO) is a small molecule derived from the metabolism of dietary nutrients by gut microbes and contributes to cardiovascular disease. Plasma TMAO increases following consumption of red meat. This metabolic change is thought to be partly because of the expansion of gut microbes able to use nutrients abundant in red meat.
Methods and Results
We used data from a randomized crossover study to estimate the degree to which TMAO can be estimated from fecal microbial composition. Healthy participants received a series of 3 diets that differed in protein source (red meat, white meat, and non‐meat), and fecal, plasma, and urine samples were collected following 4 weeks of exposure to each diet. TMAO was quantitated in plasma and urine, while shotgun metagenomic sequencing was performed on fecal DNA. While the cai gene cluster was weakly correlated with plasma TMAO (rho=0.17, P=0.0007), elastic net models of TMAO were not improved by abundances of bacterial genes known to contribute to TMAO synthesis. A global analysis of all taxonomic groups, genes, and gene families found no meaningful predictors of TMAO. We postulated that abundances of known genes related to TMAO production do not predict bacterial metabolism, and we measured choline‐ and carnitine‐trimethylamine lyase activity during fecal culture. Trimethylamine lyase genes were only weakly correlated with the activity of the enzymes they encode.
Conclusions
Fecal microbiome composition does not predict systemic TMAO because, in this case, gene copy number does not predict bacterial metabolic activity.
Registration
URL: https://www.clinicaltrials.gov; Unique identifier: NCT01427855.
Keywords: fecal microbiome, metagenomics, trimethylamine lyase, trimethylamine N‐oxide
Subject Categories: Diet and Nutrition, Risk Factors, Metabolism
Nonstandard Abbreviations and Acronyms
- RMSE
root‐mean‐square‐error
- RPKM
reads per kilobase per million reads
- TMAO
trimethylamine‐N‐oxide
Clinical Perspective
What Is New?
Although the presence of gut microbes is required for trimethylamine‐N‐oxide synthesis, the fecal abundance of microbial genes known to produce trimethylamine only predicted a small amount of variance in plasma trimethylamine‐N‐oxide.
The abundance of these genes only weakly predicted the activity of the enzymes they encode.
The fecal abundance of the cutC gene was correlated with plasma trimethylamine‐N‐oxide only in participants who consumed a non‐meat diet before being exposed to a red meat diet.
What Are the Clinical Implications?
Fecal microbiome composition cannot be substituted for trimethylamine‐N‐oxide as a biomarker for cardiovascular risk.
Circulating trimethylamine N‐oxide (TMAO) is a contributor to cardiovascular disease (CVD), which in turn is the leading cause of disability and mortality worldwide. 1 TMAO enhances atherosclerosis, thrombosis, and platelet aggregation in animal models and strongly predicts incident CVD in humans.2, 3, 4, 5, 6, 7 Understanding the determinants of plasma TMAO may lead to the discovery of novel targets for the treatment and prevention of CVD via TMAO reduction.
Although fish and other foods contain TMAO, the major source of circulating TMAO is gut microbial production of the metabolic precursor trimethylamine.2, 8 A phylogenetically diverse group of bacterial strains convert compounds abundant in beef such as carnitine to trimethylamine, which is absorbed and converted to TMAO by host enzymes.9, 10 Suppression of bacterial trimethylamine production with antibiotics also suppresses TMAO production in humans,9, 10, 11 and trimethylamine‐lyase enzyme inhibitors suppress TMAO production in mice.12, 13 Furthermore, self‐described vegans without prior meat exposure produce far less TMAO from ingested carnitine than omnivores.9, 10, 11, 14 A small diet intervention study found that 8 weeks of a meat‐free diet prevented a meat‐induced increase in TMAO, but no bacterial taxa were associated with TMAO. 15 Stool 16S rRNA gene sequencing has identified bacterial genera more abundant in omnivores and high TMAO producers, suggesting that consumption of animal products, and specifically red meat, raises TMAO by providing a competitive advantage to gut microbes with the capacity to use carnitine and other substrates abundant in red meat while producing trimethylamine as a waste product.8, 11, 16, 17, 18
If red meat increases TMAO via the growth of trimethylamine‐producing gut microbes, then the abundance of their genes, especially trimethylamine‐lyases, should predict TMAO. Previous efforts have been made to model TMAO and CVD as a function of microbial gene abundance, but these experiments were insufficient to test the hypothesis that diet‐induced changes in microbial composition predict changes in TMAO. A recent multiomic study of TMAO determinants modeled human plasma TMAO as a function of stool microbial taxa and basic clinical labs, but those factors could only account for 14% of the variability in plasma TMAO. 19 Importantly, this multiomic study could not quantify specific bacterial strains or genes. One cross‐sectional study of atherosclerotic CVD used metagenomics sequencing to quantify 2 trimethylamine‐lyases, and these genes were not strongly associated with CVD. 20 Both studies were observational and may have been affected by variation in dietary habits that impact both TMAO and the gut microbiota.
We present our findings from a randomized dietary study of stool microbial gene composition and its effect on TMAO in 113 individuals that used shotgun metagenomics (mean 11 million reads per sample) of stool to quantify microbial taxa and genes. We used a gene cluster‐based approach to quantify low‐abundance trimethylamine‐lyases and expanded our analysis to include millions of microbial genes. Finally, we measured fecal trimethylamine‐lyase enzyme activities to better understand the relationships between gene abundance, trimethylamine production in stool, and TMAO production in the host.
Methods
To minimize the possibility of unintentionally sharing information that can be used to re‐identify private information, a subset of the data generated for this study are available at the National Center for Biotechnology Information Sequence Read Archive and can be accessed at https://www.ncbi.nlm.nih.gov/bioproject/PRJEB44883/.
Study Participants
Healthy subjects were enrolled in the APPROACH (Animal and Plant Protein and Cardiovascular Health) study, as previously described (NCT0142785518, 21, 22). Briefly, APPROACH assigned healthy participants to consume 4 diets prepared in a metabolic kitchen. The first diet was designed to reflect a typical American diet while the other 3 differed in protein source: red meat, white meat, or non‐meat. Participants were assigned to the latter 3 diets in random order, each lasting 4 weeks and separated by a 2‐ to 7‐week washout period during which participants returned to their habitual diets. Following each 4‐week period, stool, plasma, urine, and body measurements were collected in a single clinic visit. TMAO and creatinine were quantitated in plasma and urine as previously described. 22 Fractional renal excretion of TMAO was calculated as . Fecal samples were homogenized and split into 2 parts for metagenomics sequencing and determination of trimethylamine‐lyase enzyme activities. This study has been approved by the local institutional review board, and all participants provided written informed consent.
Metagenomic Sequencing
Fecal samples were prepared for shotgun metagenomic sequencing using the previously reported BGI methods workflow. 23 DNA library construction was performed following the manufacturer’s instruction (Illumina Hiseq2000). One paired‐end library with insert size of 350 bp for each sample was built and sequenced with 100 bp read length from each end. SolexaQA 24 was used to trim bases with Phred score <20 and remove reads <45 bp. SOAPAligner2 was then used to mapping high‐quality reads to the human genome (build hg19, Genome Reference Consortium Human Build 37), and only unmapped, high‐quality reads were used for metagenomic analysis (mean 11 million reads per sample). 25
Metagenomic data sets are publicly available through National Center for Biotechnology Information’s Sequence Read Archive Database under BioProject PRJEB44883.
Bioinformatics
Microbial genes were quantified globally with MOCAT2 26 using the Integrated Genome Catalog 27 as a reference. Gene families were quantified with Humann2. 28 To quantify low‐abundance trimethylamine‐related genes, gene cluster reference sequences were constructed based on Kyoto Encyclopedia of Genes and Genomes (KEGG) Sequence Similarity Database annotations. 29 For each gene, a representative gene was chosen to query the prokaryote Sequence Similarity Database with a similarity score threshold of 100. The application program interface KEGGREST was used to download genomic coordinates for gene and gene cluster homologs. These coordinates were mapped to sequence data from KEGG GENOMES. Because of distant genes occasionally included in KEGGREST records, gene clusters >40 kb were excluded from further analysis. The implementation of this gene cluster‐based quantification is available at: https://github.com/maf167/Fecal‐Microbiome‐Composition‐Does‐Not‐Predict‐Diet‐Induced‐TMAO‐Production‐in‐Healthy‐Adults.
High‐quality reads were aligned to the resulting reference sequences using Bowtie2 with “very‐sensitive‐local” parameters. Gene cluster alignments allowed multimapping, and homologs were analyzed independently. Gene alignments did not allow multimapping, and read counts were pooled among all homologs. Gene and gene cluster abundance was expressed in reads per kilobase per million reads (RPKM) units, except where indicated. A second method of normalization based on universal single copy genes yielded nearly identical results. Similar to the Metagenomic Universal Single‐Copy Correction method, 30 universal single copy genes (USCGs) were quantified in RPKM units and used to normalize gene abundances:
Determination of Fecal Enzyme Activities
All fecal samples (n=430) were weighed by subtracting the mass of a 2‐mL Eppendorf tube. After weighing, 20% fecal slurries were prepared with TT media (3% Trypticase Soy Broth [Becton Dickson]; 1% Trehalose) in a Coy anaerobic chamber. Raw fecal slurries were filtered by centrifugation at 200 g for 2 minutes using 100 µm EASYstrainers. DMSO was then added to 5% of total volume, and the complete fecal slurries were then aliquoted and stored at −80 °C for later incubation with labeled trimethylamine precursors.
Eight replicates of each fecal slurry were diluted 100× in M9 media under anaerobic conditions. Both d6‐choline and d9‐carnitine, which were chemically synthesized and purified as previously reported, 22 were added for a final concentration of 200 µmol/L. This culture was split in 3 parts. One part was used to measure baseline optical density, a second part was used to measure baseline cell viability with Thermo PrestoBlue, and the final part was incubated at 37 °C under anaerobic conditions for 36 hours.
At 18‐ and 36‐hour time points, the incubated culture was vortexed and a 100 µL volume was removed. This 100 µL sample was quenched with excess formic acid and stored at −80 °C for later mass spectrometric analysis. All analytes were quantified with stable isotope dilution high‐performance liquid chromatography with on‐line electrospray ionization as previously described. 22
TMAO Modeling With Elastic Net and Random Forest
From 461 clinic visits, clinical data, gene cluster abundances (RPKM), fecal trimethylamine‐lyase activities, TMAO fractional excretion rate, and plasma and urine TMAO were concatenated. For 100 participants who completed 4 weeks of the non‐meat and red meat diets, the percent change from non‐meat to red meat was calculated for each measurement as . Urine and plasma TMAO were modeled with clinic measurements, while ΔTMAO in urine and plasma were modeled with percent changes in measurements.
One hundred training/testing sets were selected (70/30, with replacement) using fractional stratification (in‐house stratFrac function) to ensure the distribution of the response variable was approximately the same in training and testing sets. Performance measures are reported across all 100 testing sets. 31
Preprocessing was performed separately for training and testing sets. Continuous values used as predictors were scaled to represent the number of standard deviations from the mean. The R package caret was used to perform 10‐fold cross validation of elastic net and obtain the trained linear model by minimizing root‐mean‐square error, as previously described.31, 32 Model training is described in greater depth in Data S1. When a single predictor was used, linear regression was used to obtain the model. Root‐mean‐square error (RMSE) was defined as:
For each elastic net run, we predicted either plasma TMAO (Figure 4), the change in plasma TMAO between non‐meat and red meat diet (ΔTMAO, Figure 4), or choline consumption in a fecal culture (18‐hour d6‐choline, Figure 6). The predictors included either the clinical measurements listed in Table 1, the homologs of a trimethylamine‐related microbial gene cluster (cai, cut, tor, yea), fecal trimethylamine‐lyase enzyme activities, or, as a sanity check, TMAO fractional excretion rate. Interactions and other non‐linear terms were not included, as they would complicate interpretation.
Figure 4. Abundance of genes related to trimethylamine synthesis do not improve models of trimethylamine N‐oxide (TMAO).
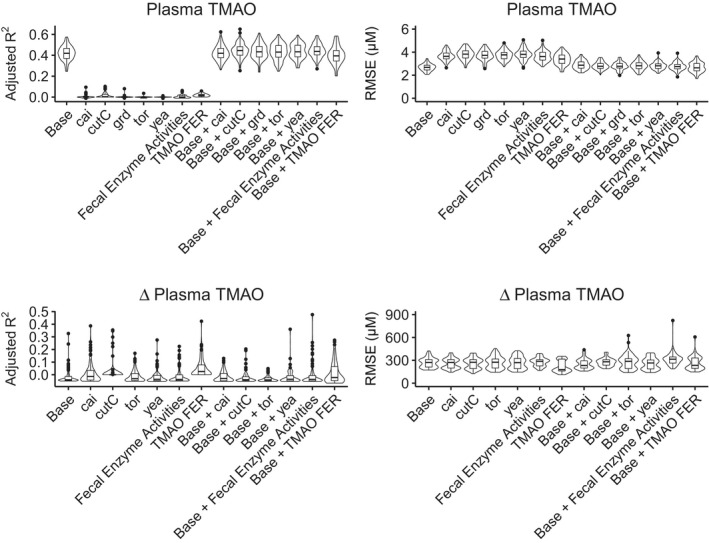
Elastic net was used to train and test linear models of plasma TMAO, as well as percent changes in TMAO from non‐meat to red meat diets. Models were tested with 100 randomly selected training/testing groups, using adjusted R2 and root‐mean‐squared error as performance metrics. The base model, using data summarized in Table 1, predicted 41% of the variance in TMAO, and the addition of trimethylamine‐related gene abundances did not improve model performance. TMAO fractional excretion rate outperformed the base model in predicting changes in plasma TMAO, in terms of root‐mean‐squared error (P<0.001, Wilcox test). FER, fractional excretion rate; RMSE indicates root‐mean‐squared error; and TMAO, trimethylamine‐N‐oxide.
Figure 6. cutC abundance marginally outperforms clinical data in predicting fecal choline‐trimethylamine lyase activity.
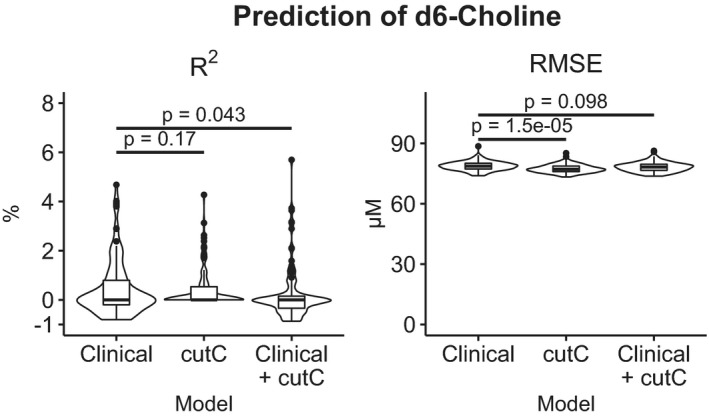
Fecal samples were cultured with 200 µmol/L d6‐choline and labeled trimethylamine and synthetic intermediates were quantitated after 18‐hour incubation. Elastic net models were trained to predict 18‐hour d6‐choline with 70% of samples and tested on the remaining 30%, and testing was iterated over 100 different training/testing sets. Although the cutC models had less error than models trained with clinical data (Table 1), cutC models did not result in higher correlations between predicted and actual d6‐choline concentration. RMSE indicates root‐mean‐squared error.
Table 1.
Participant Characteristics at the Time of Sample Collection
| Baseline | Non‐meat | Red meat | White meat | P value | |
|---|---|---|---|---|---|
| n | 116 | 115 | 115 | 115 | >.99 |
| Sex (percent women) | 60.3 | 61.7 | 60.9 | 60.9 | >.99 |
| Age, y | 45 (33–56) | 45 (33–56) | 45 (33–56) | 45 (33–56) | >.99 |
| Triglycerides | 71.8 (57.1–95.5) | 69.2 (54.5–87.4) | 67.8 (52.9–93.6) | 66.2 (54.6–83.6) | 0.33 |
| TC | 172 (152–196) | 153 (141–177) | 160 (144–184) | 164 (144–183) | 0.003 |
| LDL‐C | 101 (83.9–122) | 86.9 (73.7–106) | 92.2 (80.2–111) | 94.8 (77.3–114) | 0.003 |
| HDL‐C | 53 (45–63.5) | 51 (42–59.5) | 51.8 (43–61.5) | 53.5 (44–60.8) | 0.6 |
| Apo A1 | 133 (120–145) | 130 (114–140) | 130 (117–144) | 132 (119–140) | 0.5 |
| ApoB | 73.8 (60.5–86.5) | 65 (52.6–74.4) | 69 (55.4–78.1) | 69.5 (54.8–82) | 0.022 |
| BMI | 25.4 (22.7–27.9) | 25.5 (22.8–27.9) | 25.6 (22.8–27.9) | 25.6 (22.8–28.3) | 0.99 |
| SBP | 108 (102–116) | 107 (101–116) | 107 (99.8–117) | 107 (102–115) | 0.95 |
| DBP | 69.5 (63–74) | 69 (62.2–73) | 68 (63–73) | 68 (62–73) | 0.78 |
| Hip circumference, cm | 101 (95.4–107) | 101 (94–106) | 100 (95.3–107) | 101 (94.4–108) | 0.95 |
| Waist circumference, cm | 82 (73.3–90) | 81.2 (73–89.6) | 81.6 (74.2–89.9) | 81.8 (74.1–89.5) | 0.98 |
| WaistIC | 88 (81.9–97.8) | 87.2 (80.9–95.4) | 87.8 (81.2–96.4) | 88.6 (81.7–96.4) | 0.98 |
| Weight, lbs | 158 (140–181) | 159 (139–181) | 161 (140–182) | 160 (139–182) | 0.99 |
| Height, cm | 168 (161–177) | 168 (161–177) | 168 (161–177) | 168 (161–177) | >.99 |
| Diet compliance | 5 (4.5–5) | 5 (4.12–5) | 5 (4–5) | 5 (4.12–5) | >.99 |
Fecal and plasma samples were collected at baseline and following exposure to 3 prepared diets. Data are shown as median (interquartile range). Diet groups were compared with the Kruskal‒Wallis test, except for sex (Chi‐square test). BMI indicates body mass index; DBP, diastolic blood pressure; HDL‐C, high‐density lipoprotein cholesterol; LDL‐C, low‐density lipoprotein cholesterol; SBP, systolic blood pressure; TC, Total cholesterol; and WaistIc, waist circumference measured at superior border of the iliac crest.
To quantify non‐linear associations between plasma TMAO and the predictors listed above, we implemented a random forest regressor with the R package randomForest. The number of variables sampled at each node was tuned with caret, and each model consisted of 500 trees. TMAO estimates were obtained from 100 training/testing sets, and variable importance was quantified as the mean cross validation residual sum of squares increase across all trees after permuting a given variable.
The implementation of this method in R is accessible at: https://github.com/maf167/Fecal‐Microbiome‐Composition‐Does‐Not‐Predict‐Diet‐Induced‐TMAO‐Production‐in‐Healthy‐Adults.
Results
Diet‐Induced Changes in TMAO Are Not Predicted by Trimethylamine‐Lyase Abundance
We sought to measure changes in TMAO and the fecal microbiota in healthy individuals undergoing changes in diet (baseline characteristics shown in Table 1). Plasma and urine TMAO were increased significantly during red meat consumption compared with a meat‐free period, and isotope tracer studies implicated increased microbial production of trimethylamine from carnitine, possibly because of expansion of bacterial strains selectively using carnitine. 22 We hypothesized that individual differences in TMAO production among the protein sources could be predicted by the copy number of genes related to TMAO synthesis in stool, and our analyses are summarized in Figure 1.
Figure 1. Overview of analyses.
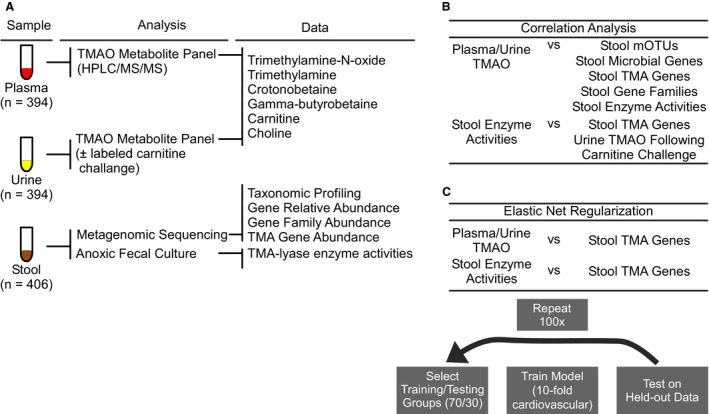
A, Healthy adults were provided non‐meat, white meat, or red meat diets for 4‐week periods and donated plasma, urine, and stool samples during clinic visits. Trimethylamine N‐oxide (TMAO) and related metabolites were measured in plasma and urine samples. A subset of urine samples (n=38) was taken after oral challenge with isotope labeled choline and carnitine. Isotope‐labeled TMAO was measured in these urine samples. Stool was used for both anoxic cultures to determine the activities of enzymes related to trimethylamine production and metagenomics sequencing. Metagenomic sequence data were used to compute metagenomic operational taxonomic units, as well as global gene and gene family abundances. Low abundance trimethylamine‐related genes were quantified using a gene cluster‐base d approach. B, Plasma and urine TMAO were not correlated with any stool data set, and stool trimethylamine ‐related enzyme activities were not correlated with related genes or with TMAO production during the oral challenge. C, Elastic net models trained with trimethylamine‐related gene abundances did not predict TMAO or stool enzyme activities. CV indicates cardiovascular; FMO, flavin mono‐oxygenases; GBB, gamma‐butyrobetaine; HPLC/MS/MS, high performance liquid chromatography with tandem mass spectrometry; MI, myocardial infarction; mOTUs, metagenomic operational taxonomic units; and TMAO, trimethylamine‐N‐oxide.
The Uniprot Knowledgebase lists 5 non‐mammalian enzymes directly involved in trimethylamine production in the human gut (Figure 2): the choline trimethylamine‐lyases cutC/D,12, 33, 34 the carnitine oxygenase cntA/B,16, 35, 36, 37 the non‐specific trimethylamine‐lyase yeaW/X, 35 the betaine reductase component grdH,38, 39, 40 and the TMAO reductase torA.40, 41 We also considered homologs of the crotonobetainyl‐CoA reductase system caiA/B/C, as it catalyzes the first step in a 2‐step synthesis of trimethylamine from carnitine.10, 42, 43, 44 For 6 out of 10 of these genes, >30% of samples had no sequencing reads align to any reference sequence (Table S1). We hypothesized that these genes were not absent, but present at low abundance. To quantify low‐abundance genes, we used a novel approach based on conserved gene clusters.
Figure 2. Synthesis of trimethylamine N‐oxide requires dietary substrate as well as host and microbial enzymes.
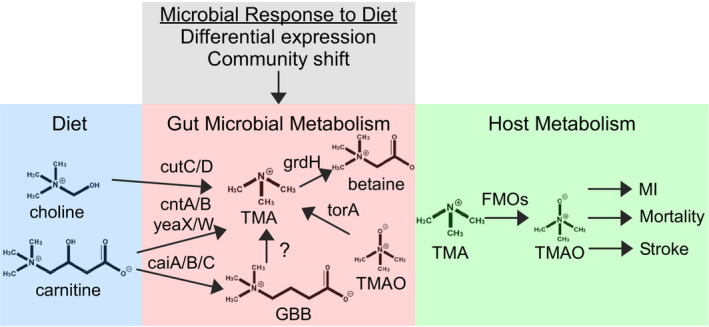
Nutrients including choline and carnitine, which are abundant in red meat, are converted to trimethylamine via multiple synthetic pathways. The copy number of related genes is altered by diet and may contribute to trimethylamine N‐oxide production by host enzymes. caiA/B/C, crotonobetainyl‐CoA dehydrogenase; cntA/B, carnitine oxygenase/reductase; cutC/D, choline utilization gene cluster; FMOs, flavin monooxygenases; GBB, gamma‐butyrobetaine; grdH, betaine reductase complex component B subunit beta; MI, myocardial infarction; TMA, trimethylamine; TMAO, trimethylamine‐N‐oxide; torA, trimethylamine‐N‐oxide reductase (cytochrome c); and yeaX/W, carnitine monooxygenase subunit YeaX.
The 6 enzyme systems described above are coded by gene clusters conserved within phylogenetic clades. We estimated the abundance of each related gene cluster as a proxy for the gene of interest. After normalizing for reference length, homologs of all gene clusters except cnt and cut were highly correlated with gene‐level quantification, and present in >70% of fecal samples (Figure S1). The cntA gene has been estimated to have <30% prevalence in humans, 45 while the cut gene cluster is phylogenetically diverse and not well conserved. 33 Gene cluster‐based quantifications allowed us to test whether each homolog of each gene predicts diet‐induced changes in TMAO.
Homologs of the cai gene cluster were weakly correlated with plasma TMAO (Table 2, Table S2). The cai gene cluster was also among the most important predictors of plasma TMAO in random forest models (Figure S4).
Table 2.
Abundance of Gene Cluster cai is Correlated With Plasma TMAO
| Gene Cluster | Organism | ρ | P value* |
|---|---|---|---|
| cai | Escherichia coli O18:K1:H7 | 0.17 | 0.040 |
| cai | Salmonella enterica subsp. enterica serovar Bareilly | 0.16 | 0.069 |
| cai | Citrobacter werkmanii | 0.16 | 0.070 |
| cai | Salmonella enterica subsp. enterica serovar Enteritidis EC20090332 | 0.16 | 0.073 |
| cai | Salmonella enterica subsp. enterica serovar Enteritidis EC20090135 | 0.16 | 0.11 |
Four candidate genes were quantified using Kyoto Encyclopedia of Genes and Genomes Sequence Similarity Database gene clusters. Of 274 gene cluster homologs, 60 were detected in >70% of samples. Spearman correlations were calculated between these 60 homolog abundances and plasma TMAO. The top 5 cai homologs are shown, and all data are shown in Table S2. TMAO indicates trimethylamine‐N‐oxide.
Adjusted according to the method of Bonferroni.
A recent diet intervention study observed that participants who consumed a meat‐free diet first did not have increased plasma TMAO after switching to a red meat diet, while those assigned to the red meat diet first had increased TMAO that decreased after switching to a meat‐free diet. 15 This diet order effect could not be explained by 16S rRNA taxonomic profiling, so we examined correlations between trimethylamine‐related genes and plasma TMAO in participants assigned to non‐meat before red meat and vice versa. The fecal abundance of cutC was weakly correlated with plasma TMAO in those assigned to non‐meat before red meat (rho=0.21, P=0.002, Figure 3). The same diet order effect was observed with an alternative normalization method based on universal single copy genes (Tables S3 through S5).
Figure 3. cutC predicts trimethylamine N‐oxide in those assigned to non‐meat before red meat.
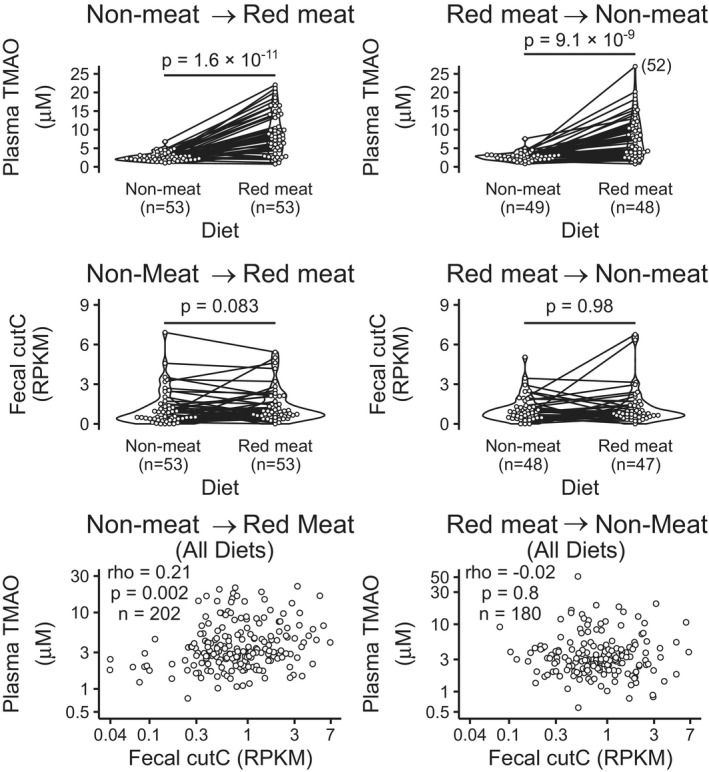
Plasma trimethylamine N‐oxide is higher during red meat consumption vs a meat‐free diet regardless of diet order. Although cutC is not differentially abundant in red meat vs meat‐free, cutC abundance is correlated with plasma trimethylamine N‐oxide among those assigned to non‐meat before red meat. P values represent Wilcox tests. RPKM indicates reads per kilobase per million reads; TMAO, trimethylamine‐N‐oxide.
To assess whether any genes directly related to trimethylamine metabolism predict TMAO production, we trained an elastic net linear model with 70% of available samples using 10‐fold cross validation to minimize RMSE. We then used the resulting linear model to predict TMAO concentrations in the held‐out samples and used Pearson correlation coefficient to estimate the portion of variance in TMAO predicted by the model. Finally, we repeated training and testing on 100 randomly selected held‐out groups. Using clinical data summarized in Table 1, the model accounted for 41% of the variance in plasma TMAO (Figure 4). We used TMAO fractional excretion rate as a sanity check to confirm that a valid predictor of plasma TMAO has the expected effects on model performance metrics (increased adjusted R 2 and decreased RMSE). We also implemented a random forest to predict TMAO with non‐linear associations. The percent change in the fractional excretion rate of TMAO from a non‐meat to a red meat diet improved prediction of the percent change in urine TMAO by 12%, as predicted by the findings of Wang, et al. 22 However, trimethylamine‐lyase gene abundances did not predict plasma or urine TMAO nor did they improve the linear models or non‐linear random forest models based on clinical data (Figure 4 and Figure S3).
TMAO is Not Predicted by Functional Metagenomic Analysis
While the abundance of candidate, trimethylamine‐related genes did not predict TMAO, there are many undescribed microbial genes that may. Diet‐related changes in microbial taxa have been reported in this cohort using 16S rRNA gene sequencing, 18 and we used metagenomic data to quantify taxa, genes, and gene families. No single taxonomic unit or gene was directly correlated with plasma or urine TMAO. Three Uniref gene families were weakly correlated with plasma TMAO with borderline significance (Table 3). These correlations were also significant after multiple testing adjustment with the method of Benjamini and Hochberg. 46 We next sought to understand why TMAO is not more strongly predicted by fecal microbiota composition.
Table 3.
Spearman Correlation Between Plasma TMAO and Gene Families
| UniRef90 ID | Name | ρ | P value* |
|---|---|---|---|
| A6BD41 | Uncharacterized protein | 0.22 | 0.047 |
| F0R5N1 | SF3 helicase domain‐containing protein | −0.22 | 0.047 |
| F7JHG5 | Uncharacterized protein | 0.22 | 0.047 |
| C0BEB7 | Uncharacterized protein | 0.22 | 0.050 |
| G2SXI9 | Phosphomethylpyrimidine synthase | 0.22 | 0.050 |
Gene abundances were aggregated into Uniref90 gene family abundances using Humann2. Of 28 441 gene families detected in >75% of samples, 5 were weakly correlated with plasma trimethylamine‐N‐oxide. TMAO indicates trimethylamine‐N‐oxide.
Adjusted according to the method of Benjamani and Hochberg. 46
Trimethylamine‐Lyase Gene Abundance Does Not Predict Direct Measurements of Enzyme Activity in Fecal Samples
TMAO is a product of both commensal and host metabolism, while trimethylamine is produced only by gut microbes. 2 Microbial gene abundance may not be an effective predictor of microbial trimethylamine production, and trimethylamine production may not be a strong predictor of TMAO. We first compared trimethylamine and TMAO production in 13 individuals.
Isotope tracer studies involving a subset of the cohort (n=38) reported increased conversion of oral carnitine to urine trimethylamine and TMAO during a red meat diet versus white meat and non‐meat, consistent with unlabeled TMAO. 22 We anoxically cultured fecal samples from the same clinic visits in the presence of isotopically labeled carnitine and choline and measured labeled trimethylamine and synthetic intermediates after 18‐ and 36‐hour incubations. These measures allowed us compare trimethylamine production by gut microbes to TMAO production in the microbe‐host system.
Although there were no strong correlations between trimethylamine production in feces and TMAO production in urine, choline metabolite concentrations were moderately correlated in urine and feces (rho=−0.46, P=0.003, Figure 5). This correlation was also significant after multiple testing adjustment (adjusted P=0.04) with the method of Benjamini and Hochberg. 46 In the prediction of d6‐choline consumption, elastic net linear models trained with cutC abundances outperformed those trained with clinical data (Table 1), however no model of fecal enzyme activity predicted >6 percent of the variation in labeled metabolites (Figure 6).
Figure 5. Fecal trimethylamine‐lyase activities are not correlated with trimethylamine N‐oxide (TMAO) production in host.
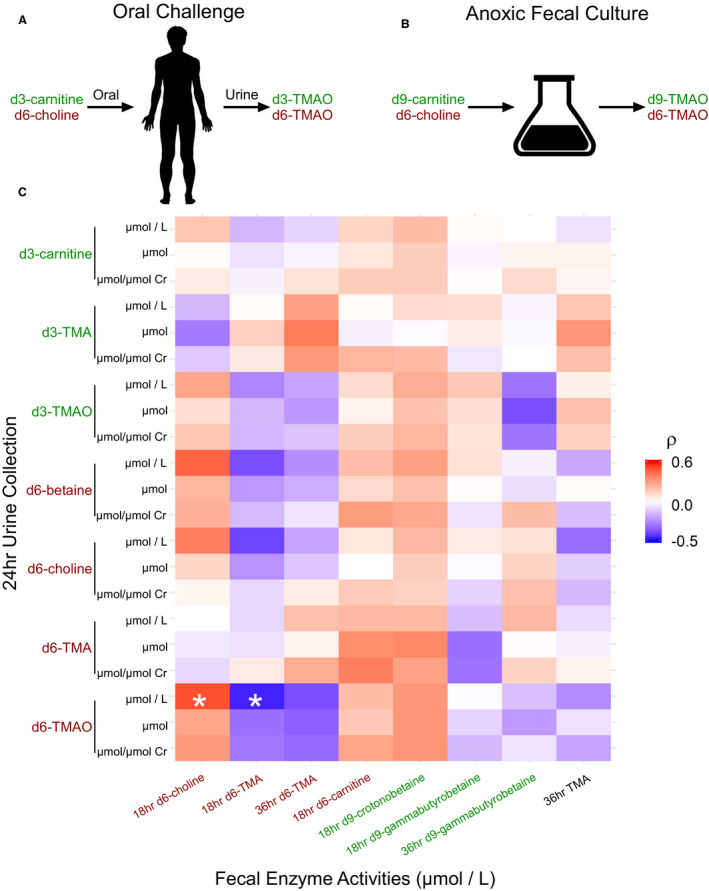
In a single visit, 13 participants randomly selected from the APPROACH cohort donated a fecal sample and participated in a heavy‐isotope‐labeled choline and carnitine challenge (38 visits total). A, Participants were dosed orally with 250mg d6‐choline and d3‐carnitine. Labeled TMAO and synthetic intermediates were quantitated in 24‐hour urine collection. B, Paired fecal samples were cultured with 200 µmol/L d6‐choline and d9‐carnitine and labeled TMAO and synthetic intermediates were quantitated after 18‐ and 36‐hour incubations. Analytes not detected in >30% of samples were excluded. C, The heatmap shows Spearman correlations between fecal enzyme activities and the indicated isotopologue in 24‐hour urine collection. TMAO produced from carnitine in the host was not highly correlated with carnitine‐derived trimethylamine in fecal cultures. Urine choline‐derived TMAO was negatively correlated with choline‐trimethylamine‐lyase activity in feces (ρ=−0.46, P=0.003). Cr, creatinine; RMSE indicates root‐mean‐squared error; and TMAO, trimethylamine‐N‐oxide. * Adjusted P<0.05. P values adjusted with the method of Benjamani and Hochberg. 46
Production of trimethylamine from carnitine in feces was not correlated with TMAO production from carnitine in the host (Spearman correlation, P=0.5), and carnitine trimethylamine‐lyase gene abundances did not predict carnitine metabolism in feces (Figure S2). In short, abundances of genes known to encode enzymes that produce trimethylamine in feces fail to predict systemic TMAO because they cannot predict total fecal enzyme activity, at least under the culture conditions described in Methods.
Discussion
The gut microbial metabolite TMAO is a major contributor to cardiovascular disease, and intervention may be complicated by the complex interactions that result in elevated circulating TMAO. 19 Plasma TMAO can be raised and lowered with dietary change or gut microbial suppression.12, 22 In addition, TMAO response to these interventions is modulated by pre‐existing vegan diet and renal function. A vegan diet, or more specifically a non‐meat diet, has been observed to cause changes in both stool microbiome composition and TMAO metabolism.9, 14 The abundance of carnitine in red meat presumably gives an advantage to gut microbial strains that consume carnitine, thus increasing production of trimethylamine and TMAO. However, TMA‐related gene abundance did not predict systemic TMAO, possibly because of limitations in metagenomics technology or a large impact of host factors.
As interventions to lower TMAO are considered, it will be important to understand the relationships among diet, gut microbiota composition, and TMAO. We hypothesized that if the growth of specific strains plays a role in TMAO metabolism, then abundance of the relevant taxa or genes would predict TMAO levels. We used paired fecal, plasma, and urine samples from healthy participants assigned to diets with and without meat in a random crossover design to test predictive models of TMAO based on the abundance of genes related to trimethylamine production. We used shotgun metagenomic sequencing to quantify gene abundance in feces and measured TMAO in plasma and urine.
We first tested whether the abundance of 5 genes known to be involved in trimethylamine production could predict diet‐induced changes in TMAO. Although the cai gene cluster and cutC gene were correlated with TMAO, (Table 2, Figure 3) none improved machine learning models of plasma TMAO over clinical data alone (Figure 4). The cutC gene was correlated with plasma TMAO only in those assigned to the non‐meat diet before red meat (Figure 3), but the observed effect of diet order on cutC might be diminished by the study design. The APPROACH study was designed to measure independent effects of multiple diet interventions in the same individuals. Participants were instructed to return to their habitual diets for at least 2 weeks between experimental diets to “wash out” any transient effects of the previous diet. Minimizing the effect of diet order was intended to be an advantage, but given the diet order effects on cutC, the washout periods may be a limitation by diminishing the strength of relationships that require a non‐meat diet before a red meat diet or vice versa.
Expanding our analysis to the entire metagenome did not reveal any associations with plasma or urine TMAO. No gene, taxonomic group, or gene family met the Bonferroni significance threshold for correlation with TMAO. Three gene families met a less stringent significance threshold for correlation (Tables 2 and 3). The metagenome of human feces did not predict systemic TMAO levels (Figure 4) or in vitro trimethylamine production (Figure S2), and this lack of association may be because of the limitations of metagenomic functional profiling.
Functional metagenomic analysis aims to quantify the metabolic potential of a microbial community given genomic information. 47 The presence of genes coding for an enzyme is one of many requirements for enzyme activity. Enzymatic reactions require transcription and translation of the gene, sufficient substrate, and a microenvironment conducive to maintaining the structure of the enzyme and the health of the cell. 48
Multiomic analyses, in which the metagenome, metabolome, etc are surveyed in the same samples, elucidate the extent to which the metagenome predicts metabolic activity and should create an expectation that TMAO is not predicted by the metagenome. Comparisons of fecal gene and transcript abundances have estimated the metagenome accounts for less than half the variation in the meta‐transcriptome. 49 Strong associations between gene abundances and metabolites should not be expected when the intermediate processes (ie, transcription) are so loosely connected to gene copy number.
Although the presence or absence of 50% of metabolites detected by liquid chromatography mass spectrometry can be predicted with metagenomic data, <10% of the variation in metabolite levels is accounted for by DNA‐level data.49, 50 Metabolite production is predicted to be low when required genes are not detected, but we have demonstrated that aligning reads to reference gene sequences often fails to detect low‐abundance genes whose conserved gene clusters are present (Table S1). Quantitative polymerase chain reaction has been used to measure fecal cutC and grdH as low as 0.05% of bacterial genomes. 45
The trimethylamine/TMAO synthetic pathway has many of the features that complicate prediction of activity levels with meta‐genomic data. Even with simulated sequence data, analysis of low‐abundance strains is challenging, and bacterial strains at <0.4% abundance in the mouse gut can have an outsized influence on trimethylamine and TMAO production.34, 51 The regulation of transcription can also limit the prediction of metabolites from gene abundance data, and in fact, the transcription of at least 1 trimethylamine‐lyase, cutC/D, is regulated by substrate availability. 33 Regulation via translation rate, post‐translational modifications, and cofactor availability may also impact enzyme activity independent of gene copy number. Trimethylamine‐producing microbes active in the gut may be inactive in stool or vice versa. Finally, circulating trimethylamine and TMAO concentrations are impacted by host liver enzymes and renal filtration as well as microbial activity.6, 22, 52
Our isotope tracer studies in humans and fecal cultures challenged with labeled carnitine revealed discrepancies in the metabolism of microbes and the host‐microbe system (Figure 4). This metabolic discrepancy is consistent with at least one report of transcriptionally inactive strains in human stool. 53 A lack of transcription would also account for the observed inability of trimethylamine‐lyase gene abundance to predict enzyme activity in stool (Figure 4). Finally, tools like MelonPann that use metagenomic data to predict the presence or absence of metabolites would have no translational application to TMAO, because low, detectable plasma or urine TMAO does not impact cardiovascular risk.50, 54, 55 Metabolomic analysis of metagenomes using flux balance analysis and optimization predicts many microbial metabolites well, but it assumes a relationship between gene abundance and metabolite concentration and requires high‐quality annotated genomes of relevant microbes. 56 While the quantitative prediction of nearly any metabolite with metagenomics data are challenging, TMAO is an especially difficult case because of the impact of host metabolism and the limitations of metagenomic analysis.
While microbial trimethylamine production is required for TMAO synthesis, red‐meat‒induced TMAO production is not strongly predicted by fecal microbial composition or the abundance of genes related to trimethylamine production.
Sources of Funding
This work is supported by grants from the National Institutes of Health and the Office of Dietary Supplements R01DK106000, R01HL103866, and R01HL126827 (S.L.H and W.H.W.T), R01HL130819 (Z.W.) and R01 HL144651 and R01 HL147883 (A.J.L.) and Proctor & Gamble. S.L.H and A.J.L. are also supported in part by grants from the Leducq Foundation (17CVD01). M.F. has received salary support from T32GM007250 and T32HL134622. The funders had no role in data analysis or in the writing and submission of the article.
Disclosures
Z.W. and S.L.H. are named as co‐inventor on pending and issued patents held by the Cleveland Clinic relating to cardiovascular diagnostics and therapeutics and have received royalty payments for inventions or discoveries related to cardiovascular diagnostics or therapeutics from Cleveland Heart Lab and Proctor & Gamble. S.L.H. is a paid consultant for Proctor & Gamble, Pfizer Inc, and Roche Diagnostics. W.H.W.T. is a consultant for Sequana Medical AG, Owkin Inc, Relypsa Inc, PreCardia Inc, Genomics plc, and CardioRx Inc, all unrelated to the contents or topic of this paper. J.C.G.‐G. is employed by Procter & Gamble. R.M.K. holds stock options with DayTwo. The remaining authors have no disclosures to report.
Supporting information
Data S1
Tables S1–S5
Figures S1–S4
Supplementary Material for this article is available at https://www.ahajournals.org/doi/suppl/10.1161/JAHA.121.021934
For Sources of Funding and Disclosures, see page 12.
References
- 1. Benjamin EJ, Virani SS, Callaway CW, Chamberlain AM, Chang AR, Cheng S, Chiuve SE, Cushman M, Delling FN, Deo R, et al. Heart disease and stroke statistics—2018 update: a report from the American Heart Association. Circulation. 2018;137:67–492. doi: 10.1161/CIR.0000000000000558 [DOI] [PubMed] [Google Scholar]
- 2. Wang Z, Klipfell E, Bennett BJ, Koeth R, Levison BS, DuGar B, Feldstein AE, Britt EB, Fu X, Chung YM, et al. Gut flora metabolism of phosphatidylcholine promotes cardiovascular disease. Nature. 2011;472:57–65. doi: 10.1038/nature09922 [DOI] [PMC free article] [PubMed] [Google Scholar]
- 3. Shan Z, Clish CB, Hua S, Scott JM, Hanna DB, Burk RD, Haberlen SA, Shah SJ, Margolick JB, Sears CL, et al. Gut microbial‐related choline metabolite trimethylamine‐N‐oxide is associated with progression of carotid artery atherosclerosis in HIV infection. Top Antivir Med. 2018;218:1474–1479. doi: 10.1093/infdis/jiy356 [DOI] [PMC free article] [PubMed] [Google Scholar]
- 4. Seldin MM, Meng Y, Qi H, Zhu WF, Wang Z, Hazen SL, Lusis AJ, Shih DM. Trimethylamine N‐oxide promotes vascular inflammation through signaling of mitogen‐activated protein kinase and nuclear factor‐κb. J Am Heart Assoc. 2016;5:e002767. doi: 10.1161/JAHA.115.002767 [DOI] [PMC free article] [PubMed] [Google Scholar]
- 5. Zhu W, Zeneng W, Wilson Tang WH, Hazen SL. Gut microbe‐generated TMAO from dietary choline is prothrombotic in subjects. Circulation. 2017;135:1671–1673. [DOI] [PMC free article] [PubMed] [Google Scholar]
- 6. Zhu W, Buffa JA, Wang Z, Warrier M, Schugar R, Shih DM, Gupta N, Gregory JC, Org E, Fu X, et al. Flavin monooxygenase 3, the host hepatic enzyme in the metaorganismal trimethylamine N‐oxide‐generating pathway, modulates platelet responsiveness and thrombosis risk. J Thromb Haemost. 2018;16:1857–1872. doi: 10.1111/jth.14234 [DOI] [PMC free article] [PubMed] [Google Scholar]
- 7. Stubbs JR, House JA, Ocque AJ, Zhang S, Johnson C, Kimber C, Schmidt K, Gupta A, Wetmore JB, Nolin TD, et al. Serum trimethylamine‐N‐oxide is elevated in CKD and correlates with coronary atherosclerosis burden. J Am Soc Nephrol. 2016;27:305–313. [DOI] [PMC free article] [PubMed] [Google Scholar]
- 8. Cho CE, Taesuwan S, Malysheva OV, Bender E, Tulchinsky NF, Yan J, Sutter JL, Caudill MA. Trimethylamine‐N‐oxide (TMAO) response to animal source foods varies among healthy young men and is influenced by their gut microbiota composition: a randomized controlled trial. Mol Nutr Food Res. 2017;61:1600324. [DOI] [PubMed] [Google Scholar]
- 9. Koeth RA, Wang Z, Levia R, Garcia‐Garcia JC, Tang WHW, Hazen SL. Gut microbiota metabolism of l‐carnitine, a nutrient in red meat, and the atherogenic metabolites y‐gammabutyrobetaine and TMAO in humans. Circulation. 2017;136:A16758. [Google Scholar]
- 10. Koeth RA, Lam‐Galvez BR, Kirsop J, Wang Z, Levison BS, Gu X, Copeland MF, Bartlett D, Cody DB, Dai HJ, et al. L‐Carnitine in omnivorous diets induces an atherogenic gut microbial pathway in humans. J Clin Invest. 2019;129:373–387. doi: 10.1172/JCI94601 [DOI] [PMC free article] [PubMed] [Google Scholar]
- 11. Koeth RA, Wang Z, Levison BS, Buffa JA, Org E, Sheehy BT, Britt EB, Fu X, Wu Y, Li L, et al. Intestinal microbiota metabolism of l‐carnitine, a nutrient in red meat, promotes atherosclerosis. Nat Med. 2013;19:576–585. doi: 10.1038/nm.3145 [DOI] [PMC free article] [PubMed] [Google Scholar]
- 12. Wang Z, Roberts A, Buffa J, Levison B, Zhu W, Org E, Gu X, Huang Y, Zamanian‐Daryoush M, Culley M, et al. Non‐lethal inhibition of gut microbial trimethylamine production for the treatment of atherosclerosis. Cell. 2015;163:1585–1595. doi: 10.1016/j.cell.2015.11.055 [DOI] [PMC free article] [PubMed] [Google Scholar]
- 13. Gupta N, Buffa JA, Roberts AB, Sangwan N, Skye SM, Li L, Ho KJ, Varga J, DiDonato JA, Tang WHW, et al. Targeted inhibition of gut microbial TMAO production reduces renal tubulointerstitial fibrosis and functional impairment in a murine model of chronic kidney disease. Arterioscler Thromb Vasc Biol. 2020;40:1239–1255. [DOI] [PMC free article] [PubMed] [Google Scholar]
- 14. De Filippis F, Pellegrini N, Vannini L, Jeffery IB, La Storia A, Laghi L, Serrazanetti DI, Di Cagno R, Ferrocino I, Lazzi C, et al. High‐level adherence to a Mediterranean diet beneficially impacts the gut microbiota and associated metabolome. Gut. 2016;65:1812–1821. doi: 10.1136/gutjnl-2015-309957 [DOI] [PubMed] [Google Scholar]
- 15. Crimarco A, Springfield S, Petlura C, Streaty T, Cunanan K, Lee J, Fielding‐Singh P, Carter MM, Topf MA, Wastyk HC, et al. A randomized crossover trial on the effect of plant‐based compared with animal‐based meat on trimethylamine‐N‐oxide and cardiovascular disease risk factors in generally healthy adults: Study With Appetizing Plantfood—Meat Eating Alternative Trial (SWAP‐MEAT). Am J Clin Nutr. 2020;112:1188–1199. doi: 10.1093/ajcn/nqaa203 [DOI] [PMC free article] [PubMed] [Google Scholar]
- 16. Wu WK, Chen CC, Liu PY, Panyod S, Liao BY, Chen PC, Kao HL, Kuo HC, Kuo CH, Chiu THT, et al. Identification of TMAO‐producer phenotype and host‐diet‐gut dysbiosis by carnitine challenge test in human and germ‐free mice. Gut. 2019;68:1439–1449. doi: 10.1136/gutjnl-2018-317155 [DOI] [PMC free article] [PubMed] [Google Scholar]
- 17. Smits LP, Kootte RS, Levin E, Prodan A, Fuentes S, Zoetendal EG, Wang Z, Levison BS, Cleophas MCP, Kemper EM, et al. Effect of vegan fecal microbiota transplantation on carnitine‐ and choline‐derived trimethylamine‐N‐oxide production and vascular inflammation in patients with metabolic syndrome. J Am Heart Assoc. 2018;7:e008342. doi: 10.1161/JAHA.117.008342 [DOI] [PMC free article] [PubMed] [Google Scholar]
- 18. Lang JM, Pan C, Cantor RM, Tang WHW, Garcia‐Garcia JC, Kurtz I, Hazen SL, Bergeron N, Krauss RM, Lusis AJ. Impact of individual traits, saturated fat, and protein source on the gut microbiome. MBio. 2018;9. doi: 10.1128/mBio.01604-18 [DOI] [PMC free article] [PubMed] [Google Scholar]
- 19. Manor O, Zubair N, Conomos MP, Xu X, Rohwer JE, Krafft CE, Lovejoy JC, Magis AT. A multi‐omic association study of trimethylamine N‐oxide. Cell Rep. 2018;24:935–946. doi: 10.1016/j.celrep.2018.06.096 [DOI] [PubMed] [Google Scholar]
- 20. Jie Z, Xia H, Zhong SL, Feng Q, Li S, Liang S, Zhong H, Liu Z, Gao Y, Zhao H, et al. The gut microbiome in atherosclerotic cardiovascular disease. Nat Commun. 2017;8:845. doi: 10.1038/s41467-017-00900-1 [DOI] [PMC free article] [PubMed] [Google Scholar]
- 21. Bergeron N, Chiu S, Williams PT, King MS, Krauss RM. Effects of red meat, white meat, and nonmeat protein sources on atherogenic lipoprotein measures in the context of low compared with high saturated fat intake: a randomized controlled trial. Am J Clin Nutr. 2019;110:24–33. doi: 10.1093/ajcn/nqz035 [DOI] [PMC free article] [PubMed] [Google Scholar]
- 22. Wang Z, Bergeron N, Levison BS, Li XS, Chiu S, Jia X, Koeth RA, Li L, Wu Y, Tang WHW, et al. Impact of chronic dietary red meat, white meat, or non‐meat protein on trimethylamine N‐oxide metabolism and renal excretion in healthy men and women. Eur Heart J. 2019;40:583–594. doi: 10.1093/eurheartj/ehy799 [DOI] [PMC free article] [PubMed] [Google Scholar]
- 23. Bäckhed F, Roswall J, Peng Y, Feng Q, Jia H, Kovatcheva‐Datchary P, Li Y, Xia Y, Xie H, Zhong H, et al. Dynamics and stabilization of the human gut microbiome during the first year of life. Cell Host Microbe. 2015;17:690–703. doi: 10.1016/j.chom.2015.04.004 [DOI] [PubMed] [Google Scholar]
- 24. Cox MP, Peterson DA, Biggs PJ. SolexaQA: at‐a‐glance quality assessment of Illumina second‐generation sequencing data. BMC Bioinformatics. 2010;11:485. doi: 10.1186/1471-2105-11-485 [DOI] [PMC free article] [PubMed] [Google Scholar]
- 25. Li R, Li Y, Kristiansen K, Wang J. SOAP: short oligonucleotide alignment program. Bioinformatics. 2008;24:713–714. doi: 10.1093/bioinformatics/btn025 [DOI] [PubMed] [Google Scholar]
- 26. Kultima JR, Coelho LP, Forslund K, Huerta‐Cepas J, Li SS, Driessen M, Voigt AY, Zeller G, Sunagawa S, Bork P. MOCAT2: a metagenomic assembly, annotation and profiling framework. Bioinformatics. 2016;32:2520–2523. doi: 10.1093/bioinformatics/btw183 [DOI] [PMC free article] [PubMed] [Google Scholar]
- 27. Li J, Jia H, Cai X, Zhong H, Feng Q, Sunagawa S, Arumugam M, Kultima JR, Prifti E, Nielsen T, et al. An integrated catalog of reference genes in the human gut microbiome. Nat Biotechnol. 2014;32:834–841. doi: 10.1038/nbt.2942 [DOI] [PubMed] [Google Scholar]
- 28. Franzosa EA, McIver LJ, Rahnavard G, Thompson LR, Schirmer M, Weingart G, Lipson KS, Knight R, Caporaso JG, Segata N, et al. Species‐level functional profiling of metagenomes and metatranscriptomes. Nat Methods. 2018;15:962–968. doi: 10.1038/s41592-018-0176-y [DOI] [PMC free article] [PubMed] [Google Scholar]
- 29. Kanehisa M, Furumichi M, Tanabe M, Sato Y, Morishima K. KEGG: new perspectives on genomes, pathways, diseases and drugs. Nucleic Acids Res. 2017;45:D353–D361. doi: 10.1093/nar/gkw1092 [DOI] [PMC free article] [PubMed] [Google Scholar]
- 30. Manor O, Borenstein E. MUSiCC: a marker genes based framework for metagenomic normalization and accurate profiling of gene abundances in the microbiome. Genome Biol. 2015;16:15. doi: 10.1186/s13059-015-0610-8 [DOI] [PMC free article] [PubMed] [Google Scholar]
- 31. Zou H, Hastie T. Regularization and variable selection via the elastic net. J R Stat Soc Ser B. 2005;67:301–320. doi: 10.1111/j.1467-9868.2005.00503.x [DOI] [Google Scholar]
- 32. Friedman J, Hastie T, Tibshirani R. Regularization paths for generalized linear models via coordinate descent. J Statistical Softw. 2010;33. doi: 10.18637/jss.v033.i01 [DOI] [PMC free article] [PubMed] [Google Scholar]
- 33. Craciun S, Balskus EP. Microbial conversion of choline to trimethylamine requires a glycyl radical enzyme. Proc Natl Acad Sci USA. 2012;109:21307–21312. doi: 10.1073/pnas.1215689109 [DOI] [PMC free article] [PubMed] [Google Scholar]
- 34. Skye SM, Zhu W, Romano KA, Guo CJ, Wang Z, Jia X, Kirsop J, Haag B, Lang JM, DiDonato JA, et al. Microbial transplantation with human gut commensals containing CutC is sufficient to transmit enhanced platelet reactivity and thrombosis potential. Circ Res. 2018;123:1164–1176. doi: 10.1161/CIRCRESAHA.118.313142 [DOI] [PMC free article] [PubMed] [Google Scholar]
- 35. Koeth R, Levison B, Culley M, Buffa J, Wang Z, Gregory J, Org E, Wu Y, Li L, Smith J, et al. γ‐butyrobetaine is a proatherogenic intermediate in gut microbial metabolism of L‐carnitine to TMAO. Cell Metab. 2014;20:799–812. doi: 10.1016/j.cmet.2014.10.006 [DOI] [PMC free article] [PubMed] [Google Scholar]
- 36. Falony G, Vieira‐Silva S, Raes J. Microbiology meets big data: the case of gut microbiota–derived trimethylamine. Annu Rev Microbiol. 2015;69:305–321. doi: 10.1146/annurev-micro-091014-104422 [DOI] [PubMed] [Google Scholar]
- 37. Zhu Y, Jameson E, Crosatti M, Schäfer H, Rajakumar K, Bugg TDH, Chen Y. Carnitine metabolism to trimethylamine by an unusual Rieske‐type oxygenase from human microbiota. Proc Natl Acad Sci USA. 2014;111:4268–4273. doi: 10.1073/pnas.1316569111 [DOI] [PMC free article] [PubMed] [Google Scholar]
- 38. Wagner M, Sonntag D, Grimm R, Pich A, Eckerskorn C, Söhling B, Andreesen JR. Substrate‐specific selenoprotein B of glycine reductase from Eubacterium acidaminophilum. Biochemical and molecular analysis. Eur J Biochem. 1999;260:38–49. doi: 10.1046/j.1432-1327.1999.00107.x [DOI] [PubMed] [Google Scholar]
- 39. Meyer M, Granderath K, Andreesen JR. Purification and characterization of protein PB of Betaine Reductase and its relationship to the corresponding proteins Glycine Reductase and Sarcosine Reductase from Eubacterium acidaminophilum . Eur J Biochem. 1995;234:184–191. doi: 10.1111/j.1432-1033.1995.184_c.x [DOI] [PubMed] [Google Scholar]
- 40. Borrel G, McCann A, Deane J, Neto MC, Lynch DB, Brugère JF, O’Toole PW. Genomics and metagenomics of trimethylamine‐utilizing Archaea in the human gut microbiome. ISME J. 2017;11:2059–2074. doi: 10.1038/ismej.2017.72 [DOI] [PMC free article] [PubMed] [Google Scholar]
- 41. Méjean V, Lobbi‐Nivol C, Lepelletier M, Giordano G, Chippaux M, Pascal M‐C. TMAO anaerobic respiration in Escherichia coli: involvement of the tor operon. Mol Microbiol. 1994;11:1169–1179. doi: 10.1111/j.1365-2958.1994.tb00393.x [DOI] [PubMed] [Google Scholar]
- 42. Eichler K, Bourgis F, Buchet A, Kleber H‐P, Mandrand‐Berthelot M‐A. Molecular characterization of the cai operon necessary for carnitine metabolism in Escherichia coli . Mol Microbiol. 1994;13:775–786. [DOI] [PubMed] [Google Scholar]
- 43. Engemann C, Elssner T, Pfeifer S, Krumbholz C, Maier T, Kleber HP. Identification and functional characterisation of genes and corresponding enzymes involved in carnitine metabolism of Proteus sp. Arch Microbiol. 2005;183:176–189. doi: 10.1007/s00203-005-0760-2 [DOI] [PubMed] [Google Scholar]
- 44. Arense P, Bernal V, Charlier D, Iborra JL, Foulquié‐Moreno MR, Cánovas M. Metabolic engineering for high yielding L(‐)‐carnitine production in Escherichia coli . Microb Cell Fact. 2013;12:56. doi: 10.1186/1475-2859-12-56 [DOI] [PMC free article] [PubMed] [Google Scholar]
- 45. Rath S, Rud T, Pieper DH, Vital M. Potential TMA‐producing bacteria are ubiquitously found in mammalia. Front Microbiol. 2020;10. doi: 10.3389/fmicb.2019.02966 [DOI] [PMC free article] [PubMed] [Google Scholar]
- 46. Benjamini Y, Hochberg Y. Controlling the false discovery rate: a practical and powerful approach to multiple testing. J R Stat Soc Ser B. 1995;57:289–300. doi: 10.1111/j.2517-6161.1995.tb02031.x [DOI] [Google Scholar]
- 47. Jo J, Oh J, Park C. Microbial community analysis using high‐throughput sequencing technology: a beginner’s guide for microbiologists. J Microbiol. 2020;58:176–192. doi: 10.1007/s12275-020-9525-5 [DOI] [PubMed] [Google Scholar]
- 48. Cani PD. Human gut microbiome: hopes, threats and promises. Gut. 2018;67:1716–1725. doi: 10.1136/gutjnl-2018-316723 [DOI] [PMC free article] [PubMed] [Google Scholar]
- 49. Lloyd‐Price J, Arze C, Ananthakrishnan AN, Schirmer M, Avila‐Pacheco J, Poon TW, Andrews E, Ajami NJ, Bonham KS, Brislawn CJ, et al. Multi‐omics of the gut microbial ecosystem in inflammatory bowel diseases. Nature. 2019;569:655–662. doi: 10.1038/s41586-019-1237-9 [DOI] [PMC free article] [PubMed] [Google Scholar]
- 50. Mallick H, Franzosa EA, Mclver LJ, Banerjee S, Sirota‐Madi A, Kostic AD, Clish CB, Vlamakis H, Xavier RJ, Huttenhower C. Predictive metabolomic profiling of microbial communities using amplicon or metagenomic sequences. Nat Commun. 2019;10:3136. doi: 10.1038/s41467-019-10927-1 [DOI] [PMC free article] [PubMed] [Google Scholar]
- 51. Sczyrba A, Hofmann P, Belmann P, Koslicki D, Janssen S, Dröge J, Gregor I, Majda S, Fiedler J, Dahms E, et al. Critical assessment of metagenome interpretation—a benchmark of metagenomics software. Nat Methods. 2017;14:1063–1071. doi: 10.1038/nmeth.4458 [DOI] [PMC free article] [PubMed] [Google Scholar]
- 52. Bouchemal N, Ouss L, Brassier A, Barbier V, Gobin S, Hubert L, De Lonlay P, Le Moyec L. Diagnosis and phenotypic assessment of trimethylaminuria, and its treatment with riboflavin: 1H NMR spectroscopy and genetic testing. Orphanet J Rare Dis. 2019;14:222. doi: 10.1186/s13023-019-1174-6 [DOI] [PMC free article] [PubMed] [Google Scholar]
- 53. Schirmer M, Franzosa EA, Lloyd‐Price J, McIver LJ, Schwager R, Poon TW, Ananthakrishnan AN, Andrews E, Barron G, Lake K, et al. Dynamics of metatranscription in the inflammatory bowel disease gut microbiome. Nat Microbiol. 2018;3:337–346. doi: 10.1038/s41564-017-0089-z [DOI] [PMC free article] [PubMed] [Google Scholar]
- 54. Qi J, You T, Li J, Pan T, Xiang L, Han Y, Zhu L. Circulating trimethylamine N‐oxide and the risk of cardiovascular diseases: a systematic review and meta‐analysis of 11 prospective cohort studies. J Cell Mol Med. 2018;22:185–194. doi: 10.1111/jcmm.13307 [DOI] [PMC free article] [PubMed] [Google Scholar]
- 55. Yao ME, Da LP, Zhao XJ, Wang L. Trimethylamine‐N‐oxide has prognostic value in coronary heart disease: a meta‐analysis and dose‐response analysis. BMC Cardiovasc Disord. 2020;20:7. doi: 10.1186/s12872-019-01310-5 [DOI] [PMC free article] [PubMed] [Google Scholar]
- 56. Garza DR, van Verk MC, Huynen MA, Dutilh BE. Towards predicting the environmental metabolome from metagenomics with a mechanistic model. Nat Microbiol. 2018;3:456–460. doi: 10.1038/s41564-018-0124-8 [DOI] [PubMed] [Google Scholar]
Associated Data
This section collects any data citations, data availability statements, or supplementary materials included in this article.
Supplementary Materials
Data S1
Tables S1–S5
Figures S1–S4