

Abstract
Background
We conducted a 2‐sample Mendelian randomization study to assess the associations of cardiometabolic, lifestyle, and nutritional factors with varicose veins.
Methods and Results
Independent single‐nucleotide polymorphisms associated with height (positive control), body mass index, type 2 diabetes, diastolic and systolic blood pressure, smoking, alcohol and coffee consumption, 7 circulating vitamins (A, B6, B9, B12, C, 25‐hydroxyvitamin D, and E), and 5 circulating minerals (calcium, iron, magnesium, selenium, and zinc) at the genome‐wide significance level were used as instrumental variables. Summary‐level data for the genetic associations with varicose veins were obtained from the UK Biobank (8763 cases and 352 431 noncases) and the FinnGen consortium (13 928 cases and 153 951 noncases). Genetically predicted higher height, body mass index, smoking, and circulating iron levels were associated with an increased risk of varicose veins. The odds ratios (ORs) per 1‐SD increase in the exposure were 1.34 (95% CI, 1.25–1.43) for height, 1.39 (95% CI, 1.27–1.52) for body mass index, 1.12 (95% CI, 1.04–1.22) for the prevalence of smoking initiation, and 1.24 (95% CI, 1.16–1.33) for iron. Higher genetically predicted systolic blood pressure and circulating calcium and zinc levels were associated with a reduced risk of varicose veins, whereas the association for systolic blood pressure did not persist after adjustment for genetically predicted height. The OR was 0.75 (95% CI, 0.62–0.92) per 1‐SD increase in calcium levels and 0.97 (95% CI, 0.95–0.98) for zinc.
Conclusions
This study identified several modifiable risk factors for varicose veins.
Keywords: lifestyle, Mendelian randomization, metabolic, mineral, varicose veins
Subject Categories: Diet and Nutrition, Genetics, Lifestyle, Obesity, Vascular Disease
Nonstandard Abbreviations and Acronyms
- MR
Mendelian randomization
Clinical Perspective
What Is New?
Genetically predicted height, body mass index, smoking, and circulating iron levels were positively associated with risk of varicose veins, whereas genetically predicted systolic blood pressure and circulating calcium and zinc levels were inversely associated with the disease.
The association for genetically predicted systolic blood pressure did not remain after adjustment for height.
Genetically predicted coffee consumption and circulating vitamin B12 and magnesium levels were suggestively associated with varicose veins.
There was no association of genetically predicted type 2 diabetes, alcohol consumption, circulating vitamin A, vitamin B6, folate, vitamin C, 25‐hydroxyvitamin D, vitamin E, and selenium with varicose veins.
What Are the Clinical Implications?
Strategies targeting the above‐mentioned modifiable factors, such as lowering body mass index, reducing smoking initiation and encouraging smoking cessation, and avoiding excessive iron intake may prevent varicose veins and reduce corresponding disease burden.
Varicose veins as a common manifestation of chronic venous disease affects >23% of adults in the United States. 1 Its high prevalence along with complications, such as chronic venous ulcers, impose a large burden on health care systems and society. 2 Recent studies showed that patients with varicose veins had a substantially greater risk of developing deep vein thrombosis 3 and suffered from impaired quality of life. 4
Modifiable factors, including obesity, blood pressure, and lifestyle and nutritional factors have been shown to influence vascular health and to be associated with vascular‐related diseases. 5 , 6 Epidemiological studies have associated age, sex (more common in women), obesity, pregnancy, and prior deep vein thrombosis to an increased risk of varicose veins. 7 , 8 A recent study based on data from 502 619 UK adults additionally proposed smoking and hypertension as potential modifiable risk factors for varicose veins. 9 Data on other modifiable factors, such as alcohol and coffee consumption and nutritional factors (eg, circulating levels of vitamins and minerals changed with dietary intake 10 , 11 ), in relation to varicose veins are limited. 12 An exploration of the causal associations between these modifiable factors and varicose veins is of great importance in preventing or delaying disease progression.
Mendelian randomization (MR) analysis can strengthen causal inference in an exposure–outcome association by leveraging genetic variants as instrumental variables for a modifiable exposure. 13 The approach can diminish unobserved confounding because genetic variants are randomly assorted at conception and therefore unassociated with self‐adapted lifestyle factors and behaviors. The method can also minimize reverse causation, because the onset and progression of a disease are unlikely to modify germline genotype. Previous MR studies have shown potential causal links of blood iron and several anthropometric traits, including weight and height, with risk of varicose veins. 9 , 14 , 15 , 16 However, MR evidence on other modifiable factors in relation to varicose veins is limited. Here, we conducted a 2‐sample MR study to confirm previously established associations for varicose veins and to further explore the associations of other metabolic, lifestyle, and nutritional factors with risk of varicose veins.
Methods
All data analyzed in this study are available in the Open Science Framework data respiratory (https://osf.io/9s3hd/).
Genetic Instrument Selection
Single‐nucleotide polymorphisms (SNPs) associated with cardiometabolic (body mass index, 17 type 2 diabetes, 18 and systolic and diastolic blood pressure 19 ), lifestyle (smoking initiation, 20 smoking index [defined by the method outlined by Leffondré et al, 21 taking into account smoking status as well as smoking duration, heaviness, and cessation in ever smokers], 22 alcohol, 20 and coffee consumption 23 ) and nutritional factors (circulating vitamin A, 24 vitamin B6, 25 folate [vitamin B9], 26 vitamin B12, 26 vitamin C, 27 25‐hydroxyvitamin D, 28 vitamin E, 29 calcium, 30 iron, 31 magnesium, 32 selenium, 33 and zinc 34 ) at the genome‐wide significance threshold (P<5×10⁻⁸) were identified from corresponding genome‐wide association studies. Linkage disequilibrium among SNPs for one exposure was estimated based on the 1000 Genomes European reference panel. Independent SNPs (SNPs without linkage disequilibrium, defined by r 2<0.01 and clump distance >10 000 kb) were selected as instruments. Information on used genome‐wide association studies is presented in Table S1.
Positive Control
Standing height was used as a positive control for varicose veins. 9 Independent SNPs (r2 <0.01 and clump distance >10 000 kb) associated with height at the genome‐wide significance level were used as instrumental variables from the Genetic Investigation of Anthropometric Traits consortium with 253 288 individuals of European ancestry. 35
Data Sources
Summary‐level data on the associations of exposure‐associated SNPs with varicose veins were obtained from the UK Biobank study (8763 cases and 352 431 noncases) and the FinnGen consortium (13 928 cases and 153 951 noncases). Incident and prevalent cases of varicose veins were defined by the International Classification of Diseases, Eighth and Ninth Revision (ICD‐8/9) code 454 and the International Classification of Diseases, Tenth Revision (ICD‐10) code I83. The UK Biobank is a cohort study including 500 000 adults, aged 40 to 69 years, across the UK from 2006 to 2010. In this study, data in UK Biobank were extracted from the second wave of genome‐wide association analyses by the Neale Lab, where individuals of non‐European ancestry, closely related individuals, individuals with sex chromosome aneuploidies, and individuals who had withdrawn consent were excluded. 36 The FinnGen consortium is a growing project studying genetic variation in relation to disease trajectories. We used data from the R4 release of genome‐wide analysis results in FinnGen including a total of 218 792 individuals after the exclusion of individuals with ambiguous gender, high genotype missingness (>5%), excess heterozygosity (±4 SDs), and non‐Finnish ancestry. 37
Statistical Analysis
For exposures instrumented by at least 3 SNPs, the inverse‐variance–weighted method under a multiplicative random‐effects model was used as the primary statistical method; otherwise, the inverse‐variance–weighted fixed‐effects method was applied. Estimates from UK Biobank and FinnGen were combined using the fixed‐effects meta‐analysis method. Three sensitivity analyses, including the weighted median, 38 MR‐Egger (Mendelian randomization‐Egger), 39 and MR‐PRESSO (Mendelian Randomization Pleiotropy Residual Sum and Outlier) 40 methods, were conducted to examine the robustness of the associations and to test for horizontal pleiotropy for exposures instrumented by ≥3 SNPs. The weighted median method provides consistent causal estimates when >50% of the weight comes from valid instruments. 38 The MR‐Egger regression can detect unbalanced horizontal pleiotropy by its intercept and provides estimates after correction for pleiotropic effects but is limited by low statistical power. 39 The MR‐PRESSO method can detect outlying SNPs and provides causal estimates after the removal of corresponding outliers. 40 For vitamins and minerals associated with varicose veins at P<0.05 in the inverse‐variance–weighted analysis based on UK Biobank and FinnGen combined data, we performed colocalization analysis (calcium only because of lack of summary‐level data for the other nutrients), 41 leave‐one‐out analysis, 42 and supplementary MR analysis using SNPs mapping to genes with a proximal biological link to the risk factor. Given that blood pressure and height are inversely correlated, 43 we performed multivariable MR analyses to assess the association between genetically predicted blood pressure and varicose veins with the adjustment for genetically predicted standing height and vice versa. Given sample overlap between exposure and outcome data sets for analysis in UK Biobank, we calculated the F statistic for all studied traits in UK Biobank (Table S2). 44 Conditional F statistic for systolic blood pressure (F statistic=34.2) in multivariable MR analysis was calculated using the MVMR (multivariable Mendelian randomization) package. 45 A Cochrane Q value was used to assess heterogeneity among estimates of individual SNPs in the analysis of one exposure. The false discovery rate method was used to correct for multiple testing (Table S3). Power was estimated using an online tool (Table S2). 46 All tests were 2‐sided and performed using the TwoSampleMR, 47 MR‐PRESSO, 40 Coloc, 41 and MendelianRandomization 48 packages in the R software (version 4.0.2).
Ethical Approval
All studies included in cited genome‐wide association studies had been approved by a relevant review board. All participants had given informed consent. The MR analyses were approved by the Swedish Ethical Review Authority (2019‐02793).
Results
Higher genetically predicted height and body mass index was associated with an increased risk of varicose veins in both UK Biobank and FinnGen (Figure 1). For a 1‐SD increment of genetically predicted height and body mass index, the combined odds ratio (OR) of varicose veins was 1.34 (95% CI, 1.25–1.43; P<0.001) and 1.39 (95% CI, 1.27–1.52; P<0.001), respectively. Genetically predicted systolic but not diastolic blood pressure was inversely associated with varicose veins (Figure 1). The combined ORs of varicose veins were 0.87 (95% CI, 0.79–0.96; P=0.007) and 0.92 (95% CI, 0.78–1.08; P=0.315) per 10‐mm Hg increases in genetically predicted systolic and diastolic blood pressure, respectively. The associations were stable in sensitivity analyses (Table S4). However, the association for genetically predicted systolic blood pressure did not persist in the multivariable MR analysis with adjustment for genetically predicted height (Figure 1). Genetic liability to type 2 diabetes was not associated with varicose veins (Figure 1).
Figure 1. Associations of genetically predicted metabolic factors with risk of varicose veins.
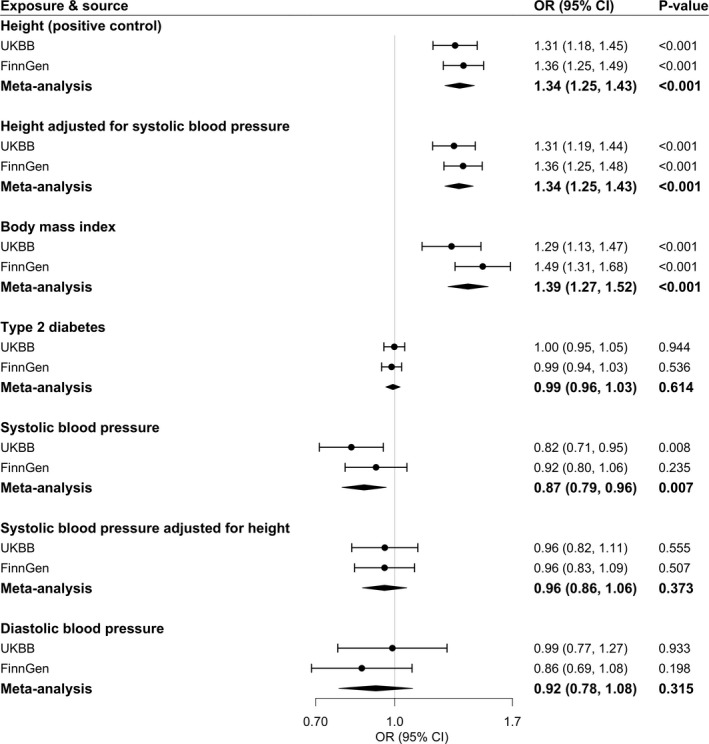
Estimates were obtained from the univariable and multivariable inverse‐variance–weighted method. ORs were scaled to a 1‐SD increase in genetically predicted height and body mass index, 1‐unit increase in log‐transformed OR of type 2 diabetes, and 10‐mm Hg increase in genetically predicted blood pressures. Circles represent the study‐specific OR, and horizontal lines represent the 95% CI of the OR. Diamonds represent the meta‐analysis OR estimate with it 95% CI. OR indicates odds ratio; and UKBB, UK Biobank.
Among 3 studied lifestyle factors, genetic predisposition to smoking initiation showed a robust positive association with varicose veins risk (Figure 2). For a 1‐SD increase in the log‐transformed OR of genetic predisposition to smoking initiation, the OR of varicose veins was 1.12 (95% CI, 1.04–1.22; P=0.004) in the meta‐analysis of UK Biobank and FinnGen. The positive association was replicated in the analysis of genetically predicted lifetime smoking index (combined OR, 1.31 [95% CI, 1.09–1.57]; P=0.003, for a 1‐SD increase in the genetically predicted index). Higher genetically predicted coffee consumption was associated with a lower risk of varicose veins in UK Biobank (OR, 0.70 [95% CI, 0.58–0.84]; P=0.002, for a 50% increase in genetically predicted coffee consumption) but not in FinnGen (Figure 2). Genetically predicted alcohol consumption was not associated with varicose veins (Figure 2). The associations remained consistent in sensitivity analyses (Table S4).
Figure 2. Associations of genetically predicted lifestyle factors with risk of varicose veins.
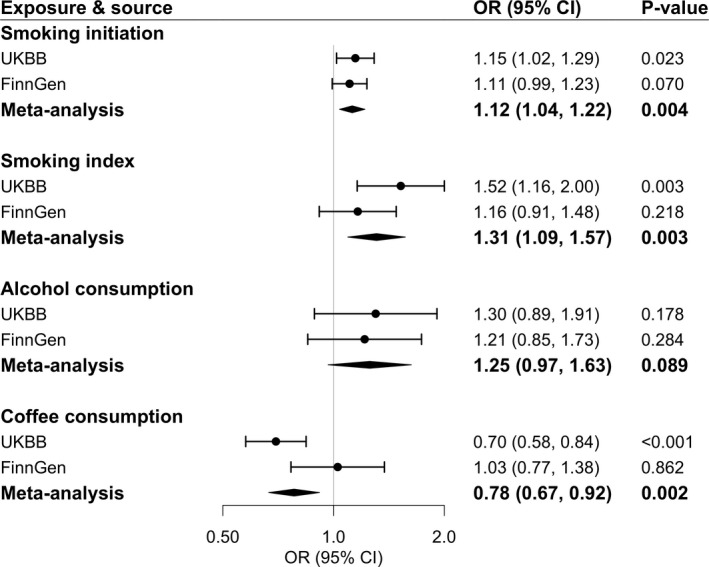
Estimates were obtained from the inverse‐variance–weighted method. ORs were scaled to a 1‐SD increase in log‐transformed OR of smoking initiation,1‐SD increase in genetically predicted lifetime smoking index (equivalent to an individual smoking 20 cigarettes a day for 15 years and stopping 17 years ago or an individual smoking 60 cigarettes a day for 13 years and stopping 22 years ago), 1‐SD increase in log‐transformed alcoholic drinks per week, and 50% increase of genetically predicted coffee consumption. Circles represent the study‐specific OR, and horizontal lines represent the 95% CI of the OR. Diamonds represent the meta‐analysis OR estimate with it 95% CI. OR indicates odds ratio; and UKBB, UK Biobank.
Higher genetically predicted vitamin A (retinol) and vitamin B12 levels were associated with an elevated risk of varicose veins in UK Biobank; however, only the association for genetically predicted vitamin B12 was directionally replicated in FinnGen (Figure 3). For a 1‐SD increase in genetically predicted vitamin B12 levels, the combined OR of varicose veins was 1.07 (95% CI, 1.01–1.14; P=0.032), whereas the combined association for genetically predicted vitamin B12 did not survive multiple testing correction. The association for vitamin B12 was consistent in leave‐one‐out analysis (Table S5) and in the analysis based on rs602662 in FUT2 (Table S6), which plays a role in vitamin B12 absorption. 49 Genetically predicted vitamin C levels were positively associated with risk of varicose veins in FinnGen (OR, 1.24 [95% CI, 1.05–1.48]; P=0.014, for a 1‐SD increase in genetically predicted vitamin C levels) but not in UK Biobank (Figure 3). Genetically predicted vitamin B6, folate, 25‐hydroxyvitamin D, and vitamin E were not associated with varicose veins (Figure 3).
Figure 3. Associations of genetically predicted circulating vitamins with risk of varicose veins.
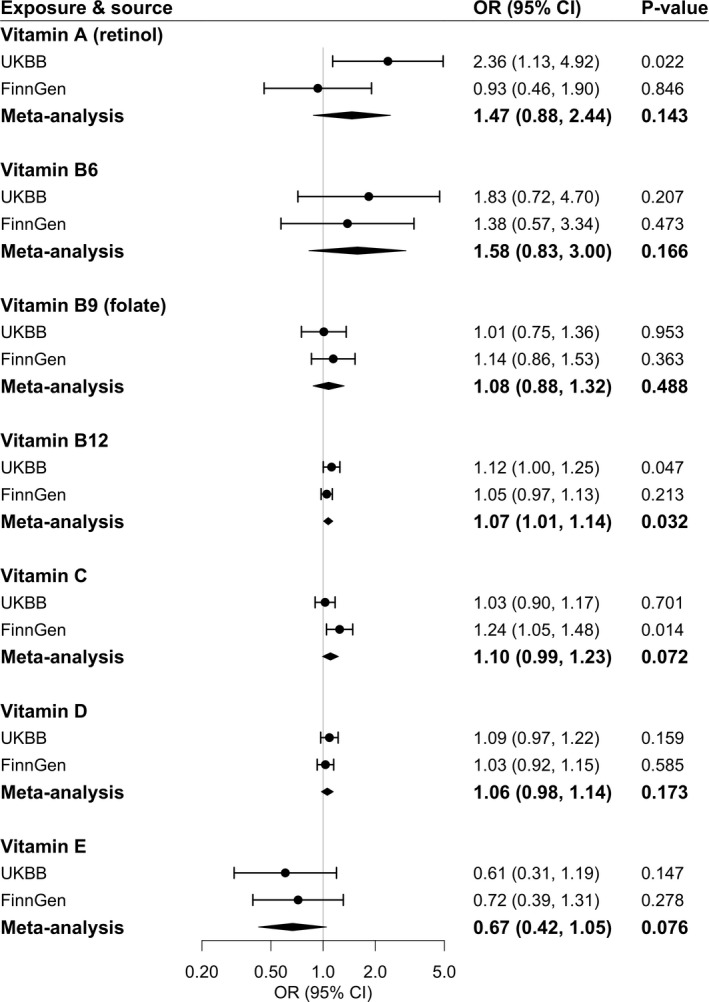
Estimates were obtained from the inverse‐variance–weighted method. ORs were scaled to a 1‐unit increase in natural logarithm (ln)‐transformed levels of genetically predicted vitamin A in micrograms per liter, 1‐SD increase in genetically predicted vitamin B6, folate, B12, C and D levels, and 1‐unit increase in ln–transformed levels of genetically predicted vitamin E in milligrams per liter. Circles represent the study‐specific OR, and horizontal lines represent the 95% CI of the OR. Diamonds represent the meta‐analysis OR estimate with it 95% CI. OR indicates odds ratio; and UKBB, UK Biobank.
Higher genetically predicted calcium and zinc levels were associated with a decreased risk of varicose veins, whereas genetically predicted iron levels were positively associated with the disease (Figure 4). The combined ORs per 1‐SD increase in genetically predicted circulating levels of these minerals were 0.75 (95% CI, 0.62–0.92; P=0.005) for calcium, 0.97 (95% CI, 0.95–0.98; P<0.001) for zinc, and 1.24 (95% CI, 1.16–1.33; P<0.001) for iron (Figure 4). The association remained consistent in leave‐one‐out analysis (Table S5). The association for calcium persisted in the analysis based on rs1801725 located in the CASR gene that encodes the calcium‐sensing receptor, and the association for iron remained in the analysis based on SNPs in HFE and TMPRSS6 genes that regulate iron homeostasis (Table S6). The colocalization analysis of calcium did not have adequate power to detect a causal link with varicose veins (Table S7). Genetically predicted selenium and magnesium levels were not associated with varicose veins (Figure 4). However, the inverse association between genetically predicted magnesium and varicose veins became clearer in the weighted median and MR‐Egger analyses (Table S4).
Figure 4. Associations of genetically predicted circulating minerals with risk of varicose veins.
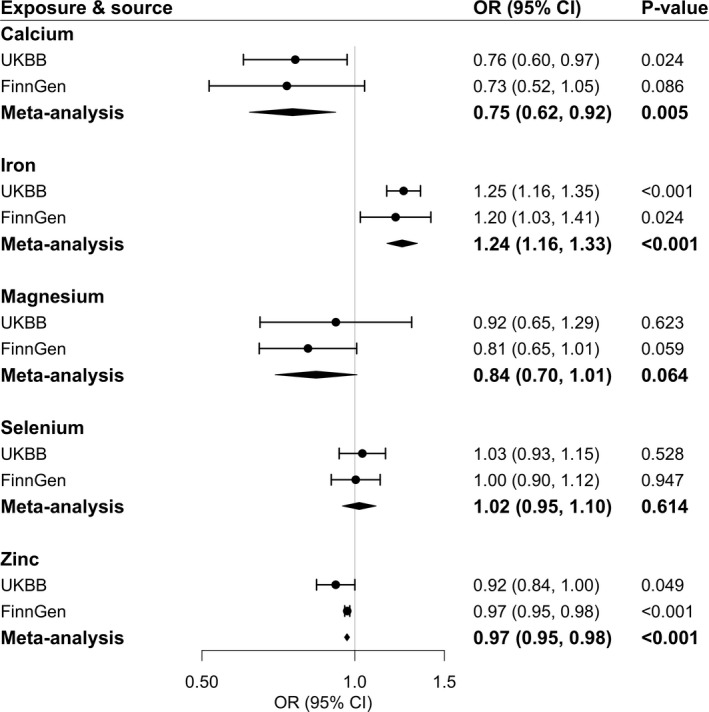
Estimates were obtained from the inverse‐variance–weighted method. ORs were scaled to a 1‐SD increase in genetically predicted calcium, iron, and magnesium levels and 1‐unit increase in log‐transformed levels of genetically predicted toenail selenium in micrograms per gram. The unit for zinc is unknown. Circles represent the study‐specific OR, and horizontal lines represent the 95% CI of the OR. Diamonds represent the meta‐analysis OR estimate with it 95% CI. OR indicates odds ratio; and UKBB, UK Biobank.
We detected moderate heterogeneity in the analyses of height, body mass index, blood pressure, smoking initiation, lifetime smoking index, and alcohol consumption (Table S4). Horizontal pleiotropy indicated by the intercept in MR‐Egger regression (P<0.05) was observed in the analyses of blood pressure and smoking initiation, and the associations of these exposures with varicose veins became stronger after adjustment for this horizontal pleiotropy (Table S4). A few outliers were detected in the MR‐PRESSO analysis (Table S4).
Discussion
The present study found that genetically predicted higher height (positive control), body mass index, smoking, and higher circulating iron levels were associated with an increased risk of varicose veins, whereas genetically predicted systolic blood pressure and circulating calcium and zinc levels were inversely associated with the disease. However, the association for genetically predicted systolic blood pressure did not remain after adjustment for genetically predicted height. There was suggestive evidence in support of associations of genetically predicted coffee consumption and circulating vitamin B12 and magnesium levels with varicose veins. There was limited evidence in support of associations for genetically predicted type 2 diabetes, alcohol consumption, circulating vitamin A, vitamin B6, folate, vitamin C, 25‐hydroxyvitamin D, vitamin E, and selenium, whereas power for these analyses might be inadequate.
We validated our outcome data using genetically predicted height as the positive control. 9 A positive association between body mass index and risk of varicose veins is a consistent finding in previous traditional observational studies 7 , 8 , 9 , 50 and supported the present MR study. In the largest of previous studies, including 493 519 British adults followed up for a median of 6.2 years, the risk of incident varicose veins increased by 11% per 1‐kg/m2 increase in body mass index. 9 The same study also found an inverse association between systolic blood pressure and risk of varicose veins, 9 a finding confirmed by another previous study 51 and our MR study, but not all studies. 7 , 8 The association for systolic blood pressure did not remain after adjusting for genetically predicted height, which indicated that the observed association for systolic blood pressure was caused by pleiotropy from height.
Evidence on the association between smoking and varicose veins is inconsistent. Some studies observed an elevated risk of varicose veins in smokers compared with nonsmokers, 7 , 52 whereas other studies failed to replicate this positive association. 53 , 54 , 55 A large cohort study reported a suggestive positive association between current smoking and varicose veins after adjustment for traditional risk factors and genetic ancestry. 9 The present study using 2 sets of genetic instruments for smoking and 2 data sources for varicose veins found a strong causal association of smoking initiation and lifetime smoking index with an increased risk of varicose veins.
Studies on alcohol and coffee consumption in relation to varicose veins are limited. An MR phenome‐wide association study showed that certain coffee‐consumption–associated SNPs in ABCG2 and BDNF gene regions were associated with varicose veins in the UK Biobank study. 56 We also observed an inverse association between coffee consumption instrumented by 12 SNPs and varicose veins in the UK Biobank study. However, the association was not replicated in Finnish adults, a population with the highest per capita consumption of coffee. Genetically predicted coffee consumption is also associated with standard tea consumption in UK Biobank, 57 and it is possible that the observed association in the UK population is related to consumption of tea, which contains thousands of biological compounds with potential cholesterol‐lowering and antioxidative effects. 58 In addition, we noticed a sample overlap for the analysis of coffee consumption in UK Biobank, which might bias the causal estimation in MR analysis. The discrepancy in the association for coffee consumption with varicose veins between 2 populations might be explained by this sample overlap. Although we observed no association between genetically predicted alcohol consumption and varicose veins, the association was in the positive direction in both populations. Considering the low variance explained by the genetic instrument for alcohol, we cannot rule out that a weak association was overlooked. 59
Data on the associations of vitamins and minerals with varicose veins are scarce. A small case‐control study found that patients with varicose veins had more hyperhomocysteinemia, which was caused by the MTHFR C677T homozygous genotype or vitamin B12 deficiency, compared with the controls. 60 Nevertheless, another small case‐control study found no difference in circulating ferritin, vitamin B12, folate, or homocysteine level in patients with varicose veins compared with the controls. 61 We observed a possibly elevated risk of varicose veins with higher circulating levels of vitamin B12 with validated genetic instruments. 62 , 63 A previous MR study observed a positive association between blood iron levels instrumented by 3 SNPs and risk of varicose veins in 310 999 unrelated UK Biobank participants, 15 with a robust association in both sexes. 14 We replicated the association with more SNPs and confirmed the association in a Finnish population, therefore strengthening the evidence of a causal detrimental role of high circulating iron levels in the development of varicose veins. The observed protective associations of high levels of calcium and zinc and possibly magnesium with risk of varicose veins in 2 independent populations. The association for calcium was observed in the analysis based on the SNP located in the CASR gene (encoding calcium‐sensing receptor) but not in the colocalization analysis. These findings were novel and need confirmation.
Although the mechanisms linking the studied exposures to risk of varicose veins are not fully understood, several explanations are proposed, such as venous endothelial injury caused by cigarette smoking, systemic inflammation activated by smoking, obesity, and high iron status. 12 In addition, the beneficial effects of calcium and zinc may be a consequence of moisturizing vein cells, relaxing veins and thus preventing and deferring structural changes in the vein wall. 12 , 64
There are several strengths of the present study, of which the main one is the MR design. This study design diminished residual confounding and reverse causality and strengthened the causal inference in the observed exposure–varicose vein associations. We examined associations in 2 independent populations, and the high consistency of results reduces the likelihood that the observed associations are chance findings. The meta‐analysis of 2 sources also increases the number of cases and the statistical power of the analyses. Despite this, we might have overlooked weak associations, in particular in analyses based on instruments explaining a small proportion of the phenotypic variance. In addition, we confined the analysis to individuals of European descent, which reduced potential bias introduced by population structure but limited the generalizability of our findings to other populations.
Limitations deserve consideration when interpreting our findings. An important limitation in MR studies is horizontal pleiotropy. However, we did not detect any horizontal pleiotropy in MR‐Egger analyses of the studied exposures with the exception for blood pressure. The associations for systolic blood pressure persisted in the MR‐Egger regression with adjustment for pleiotropic effects and MR‐PRESSO analysis with the removal of outliers. Associations across sensitivity analyses were consistent, which reinforced our results and minimized the possibility that our findings were biased by horizontal pleiotropy, whereas sensitivity analyses were unavailable with regard to several exposures proxied by few SNPs. In addition, results of the weighted median analysis for the exposure with a few SNPs might be driven by the estimate of a single SNP that explains the majority of phenotypic variance. For certain traits proxied by SNPs that explained limited phenotypic variance, this study might have had inadequate power to detect associations with varicose veins (false negative findings). We detected moderate to high sample overlap for certain exposures in the analyses based on data from UK Biobank, which would bias the causal estimates toward observational estimates. However, the corresponding F statistics for these associations were >10, which means a good strength of used genetic instruments and a minimal bias caused by sample overlap. 44 SNPs for vitamin B6 and zinc were identified from genome‐wide association studies with a small sample size, which might introduce imprecision in SNP selection for these traits. Furthermore, genetic instruments that we used might not be strongly associated with the exposure in the outcome population given that no replication was conducted for these associations in UK Biobank or FinnGen. In addition, the summary‐level data for these associations in the genome‐wide association studies on the exposure could be inflated because of winner's curse and thus bias the MR results in the direction away from the null. Future study is needed to confirm our findings. Circulating levels of vitamins and minerals do not necessarily equate to dietary intake, whereas endogenous levels of nutrients increase with exogenous dietary consumption over a certain range of intake. 10 , 11 For certain factors, such as alcohol and coffee consumption and circulating biomarkers, nonlinear associations could not be explored in this study based on summary‐level data.
In conclusion, this MR study provides results in support of causal associations between several metabolic, lifestyle, and nutritional factors and risk of varicose veins. Strategies targeting these modifiable factors, such as lowering body mass index, reducing smoking initiation and encouraging smoking cessation, and avoiding excessive iron intake may prevent varicose veins and reduce corresponding disease burden. The associations of coffee consumption, vitamin B12, calcium, zinc, and magnesium with varicose veins need more study.
Sources of Funding
This study is supported by the Swedish Research Council for Health, Working Life, and Welfare (Forte; grant number 2018‐00123) and the Swedish Research Council (Vetenskapsrådet; grant number 2019‐00977). Dr Damrauer is supported by US Department of Veterans Affairs (grant number IK2‐CX001780). This publication does not represent the views of the Department of Veterans Affairs or the United States government.
Disclosures
S. Yuan and Drs Bruzelius and Larsson declare no competing interests. Dr Damrauer receives research support from RenalytixAI and personal consulting fees from Calico Labs, outside the scope of the current research.
Supporting information
Tables S1–S7
Acknowledgments
Genetic association estimates for varicose veins were obtained from the UK Biobank study (the Neale Lab) and the FinnGen consortium. The authors thank all investigators for sharing these data.
Author contributions: S. Yuan and Drs Damrauer and Larsson designed the study. S. Yuan analyzed the data, made the figures, and drafted the article. S. Yuan and Drs Bruzelius, Damrauer, and Larsson contributed with critical review of the interpretation and the article, and approved the final version of the article.
For Sources of Funding and Disclosures, see page 9.
References
- 1. Hamdan A. Management of varicose veins and venous insufficiency. JAMA. 2012;308:2612–2621. doi: 10.1001/jama.2012.111352 [DOI] [PubMed] [Google Scholar]
- 2. Bergan JJ, Schmid‐Schönbein GW, Smith PD, Nicolaides AN, Boisseau MR, Eklof B. Chronic venous disease. N Engl J Med. 2006;355:488–498. doi: 10.1056/NEJMra055289 [DOI] [PubMed] [Google Scholar]
- 3. Chang SL, Huang YL, Lee MC, Hu S, Hsiao YC, Chang SW, Chang CJ, Chen PC. Association of varicose veins with incident venous thromboembolism and peripheral artery disease. JAMA. 2018;319:807–817. doi: 10.1001/jama.2018.0246 [DOI] [PMC free article] [PubMed] [Google Scholar]
- 4. Shepherd AC, Gohel MS, Lim CS, Davies AH. A study to compare disease‐specific quality of life with clinical anatomical and hemodynamic assessments in patients with varicose veins. J Vasc Surg. 2011;53:374–382. doi: 10.1016/j.jvs.2010.09.022 [DOI] [PubMed] [Google Scholar]
- 5. Boehme AK, Esenwa C, Elkind MS. Stroke risk factors, genetics, and prevention. Circ Res. 2017;120:472–495. doi: 10.1161/CIRCRESAHA.116.308398 [DOI] [PMC free article] [PubMed] [Google Scholar]
- 6. Bhatnagar A. Environmental determinants of cardiovascular disease. Circ Res. 2017;121:162–180. doi: 10.1161/CIRCRESAHA.117.306458 [DOI] [PMC free article] [PubMed] [Google Scholar]
- 7. Brand FN, Dannenberg AL, Abbott RD, Kannel WB. The epidemiology of varicose veins: the Framingham Study. Am J Prev Med. 1988;4:96–101. doi: 10.1016/S0749-3797(18)31203-0 [DOI] [PubMed] [Google Scholar]
- 8. Sisto T, Reunanen A, Laurikka J, Impivaara O, Heliövaara M, Knekt P, Aromaa A. Prevalence and risk factors of varicose veins in lower extremities: mini‐Finland health survey. Eur J Surg. 1995;161:405–414. [PubMed] [Google Scholar]
- 9. Fukaya E, Flores AM, Lindholm D, Gustafsson S, Zanetti D, Ingelsson E, Leeper NJ. Clinical and genetic determinants of varicose veins. Circulation. 2018;138:2869–2880. doi: 10.1161/CIRCULATIONAHA.118.035584 [DOI] [PMC free article] [PubMed] [Google Scholar]
- 10. Payette H, Gray‐Donald K. Dietary intake and biochemical indices of nutritional status in an elderly population, with estimates of the precision of the 7‐d food record. Am J Clin Nutr. 1991;54:478–488. doi: 10.1093/ajcn/54.3.478 [DOI] [PubMed] [Google Scholar]
- 11. Ahn J, Abnet CC, Cross AJ, Sinha R. Dietary intake and nutritional status. IARC Sci Publ. 2011:163:189–198. [PubMed] [Google Scholar]
- 12. Piazza G. Varicose veins. Circulation. 2014;130:582–587. doi: 10.1161/CIRCULATIONAHA.113.008331 [DOI] [PubMed] [Google Scholar]
- 13. Burgess S, Thompson SG. Mendelian Randomization: Methods for Using Genetic Variants in Causal Estimation. CRC Press; 2015. [Google Scholar]
- 14. Yang F, Bao Q, Wang Z, Ma M, Shen J, Ye F, Xie X. Sex‐specific genetically predicted iron status in relation to 12 vascular diseases: a Mendelian randomization study in the UK Biobank. Biomed Res Int. 2020;2020:6246041. doi: 10.1155/2020/6246041 [DOI] [PMC free article] [PubMed] [Google Scholar]
- 15. Zhou J, Liu C, Francis M, Sun Y, Ryu MS, Grider A, Ye K. The causal effects of blood iron and copper on lipid metabolism diseases: evidence from phenome‐wide Mendelian randomization study. Nutrients. 2020;12:3174. [DOI] [PMC free article] [PubMed] [Google Scholar]
- 16. Shadrina AS, Sharapov SZ, Shashkova TI, Tsepilov YA. Varicose veins of lower extremities: insights from the first large‐scale genetic study. PLoS Genet. 2019;15:e1008110. doi: 10.1371/journal.pgen.1008110 [DOI] [PMC free article] [PubMed] [Google Scholar]
- 17. Pulit SL, Stoneman C, Morris AP, Wood AR, Glastonbury CA, Tyrrell J, Yengo L, Ferreira T, Marouli E, Ji Y, et al. Meta‐analysis of genome‐wide association studies for body fat distribution in 694 649 individuals of European ancestry. Hum Mol Genet. 2019;28:166–174. [DOI] [PMC free article] [PubMed] [Google Scholar]
- 18. Vujkovic M, Keaton JM, Lynch JA, Miller DR, Zhou J, Tcheandjieu C, Huffman JE, Assimes TL, Lorenz K, Zhu X, et al. Discovery of 318 new risk loci for type 2 diabetes and related vascular outcomes among 1.4 million participants in a multi‐ancestry meta‐analysis. Nat Genet. 2020;52:680–691. doi: 10.1038/s41588-020-0637-y [DOI] [PMC free article] [PubMed] [Google Scholar]
- 19. Evangelou E, Warren HR, Mosen‐Ansorena D, Mifsud B, Pazoki R, Gao HE, Ntritsos G, Dimou N, Cabrera CP, Karaman I, et al. Genetic analysis of over 1 million people identifies 535 new loci associated with blood pressure traits. Nat Genet. 2018;50:1412–1425. doi: 10.1038/s41588-018-0205-x [DOI] [PMC free article] [PubMed] [Google Scholar]
- 20. Liu M, Jiang YU, Wedow R, Li Y, Brazel DM, Chen F, Datta G, Davila‐Velderrain J, McGuire D, Tian C, et al. Association studies of up to 1.2 million individuals yield new insights into the genetic etiology of tobacco and alcohol use. Nat Genet. 2019;51:237–244. doi: 10.1038/s41588-018-0307-5 [DOI] [PMC free article] [PubMed] [Google Scholar]
- 21. Leffondré K, Abrahamowicz M, Xiao Y, Siemiatycki J. Modelling smoking history using a comprehensive smoking index: application to lung cancer. Stat Med. 2006;25:4132–4146. doi: 10.1002/sim.2680 [DOI] [PubMed] [Google Scholar]
- 22. Wootton RE, Richmond RC, Stuijfzand BG, Lawn RB, Sallis HM, Taylor GMJ, Hemani G, Jones HJ, Zammit S, Davey Smith G, et al. Evidence for causal effects of lifetime smoking on risk for depression and schizophrenia: a Mendelian randomisation study. Psychol Med. 2019;50:2435–2443. [DOI] [PMC free article] [PubMed] [Google Scholar]
- 23. Zhong VW, Kuang A, Danning RD, Kraft P, van Dam RM, Chasman DI, Cornelis MC. A genome‐wide association study of bitter and sweet beverage consumption. Hum Mol Genet. 2019;28:2449–2457. doi: 10.1093/hmg/ddz061 [DOI] [PMC free article] [PubMed] [Google Scholar]
- 24. Mondul AM, Yu K, Wheeler W, Zhang H, Weinstein SJ, Major JM, Cornelis MC, Männistö S, Hazra A, Hsing AW, et al. Genome‐wide association study of circulating retinol levels. Hum Mol Genet. 2011;20:4724–4731. doi: 10.1093/hmg/ddr387 [DOI] [PMC free article] [PubMed] [Google Scholar]
- 25. Tanaka T, Scheet P, Giusti B, Bandinelli S, Piras MG, Usala G, Lai S, Mulas A, Corsi AM, Vestrini A, et al. Genome‐wide association study of vitamin B6, vitamin B12, folate, and homocysteine blood concentrations. Am J Hum Genet. 2009;84:477–482. doi: 10.1016/j.ajhg.2009.02.011 [DOI] [PMC free article] [PubMed] [Google Scholar]
- 26. Grarup N, Sulem P, Sandholt CH, Thorleifsson G, Ahluwalia TS, 89Steinthorsdottir V, Bjarnason H, Gudbjartsson DF, Magnusson OT, Sparsø T, et al. Genetic architecture of vitamin B12 and folate levels uncovered applying deeply sequenced large datasets. PLoS Genet. 2013;9:e1003530. doi: 10.1371/journal.pgen.1003530 [DOI] [PMC free article] [PubMed] [Google Scholar]
- 27. Zheng J‐S, Luan J, Sofianopoulou E, Imamura F, Stewart ID, Day FR, Pietzner M, Wheeler E, Lotta LA, Gundersen TE, et al. Plasma vitamin C and type 2 diabetes: genome‐wide association study and Mendelian randomization analysis in European populations. Diabetes Care. 2021;44:98–106. doi: 10.2337/dc20-1328 [DOI] [PMC free article] [PubMed] [Google Scholar]
- 28. Jiang X, O’Reilly PF, Aschard H, Hsu Y‐H, Richards JB, Dupuis J, Ingelsson E, Karasik D, Pilz S, Berry D, et al. Genome‐wide association study in 79,366 European‐ancestry individuals informs the genetic architecture of 25‐hydroxyvitamin D levels. Nat Commun. 2018;9:260. doi: 10.1038/s41467-017-02662-2 [DOI] [PMC free article] [PubMed] [Google Scholar]
- 29. Major JM, Yu K, Wheeler W, Zhang H, Cornelis MC, Wright ME, Yeager M, Snyder K, Weinstein SJ, Mondul A, et al. Genome‐wide association study identifies common variants associated with circulating vitamin E levels. Hum Mol Genet. 2011;20:3876–3883. doi: 10.1093/hmg/ddr296 [DOI] [PMC free article] [PubMed] [Google Scholar]
- 30. O'Seaghdha CM, Wu H, Yang Q, Kapur K, Guessous I, Zuber AM, Kottgen A, Stoudmann C, Teumer A, Kutalik Z, et al. Meta‐analysis of genome‐wide association studies identifies six new loci for serum calcium concentrations. PLoS Genet. 2013;9:e1003796. [DOI] [PMC free article] [PubMed] [Google Scholar]
- 31. Benyamin B, Esko T, Ried JS, Radhakrishnan A, Vermeulen SH, Traglia M, Gögele M, Anderson D, Broer L, Podmore C, et al. Novel loci affecting iron homeostasis and their effects in individuals at risk for hemochromatosis. Nat Commun. 2014;5:4926. doi: 10.1038/ncomms5926 [DOI] [PMC free article] [PubMed] [Google Scholar]
- 32. Meyer TE, Verwoert GC, Hwang S‐J, Glazer NL, Smith AV, van Rooij FJA, Ehret GB, Boerwinkle E, Felix JF, Leak TS, et al. Genome‐wide association studies of serum magnesium, potassium, and sodium concentrations identify six loci influencing serum magnesium levels. PLoS Genet. 2010;6:e1001045. doi: 10.1371/journal.pgen.1001045 [DOI] [PMC free article] [PubMed] [Google Scholar]
- 33. Cornelis MC, Fornage M, Foy M, Xun P, Gladyshev VN, Morris S, Chasman DI, Hu FB, Rimm EB, Kraft P, et al. Genome‐wide association study of selenium concentrations. Hum Mol Genet. 2015;24:1469–1477. doi: 10.1093/hmg/ddu546 [DOI] [PMC free article] [PubMed] [Google Scholar]
- 34. Evans DM, Zhu GU, Dy V, Heath AC, Madden PAF, Kemp JP, McMahon G, St Pourcain B, Timpson NJ, Golding J, et al. Genome‐wide association study identifies loci affecting blood copper, selenium and zinc. Hum Mol Genet. 2013;22:3998–4006. doi: 10.1093/hmg/ddt239 [DOI] [PMC free article] [PubMed] [Google Scholar]
- 35. Wood AR, Esko T, Yang J, Vedantam S, Pers TH, Gustafsson S, Chu AY, Estrada K, Luan J, Kutalik Z, et al. Defining the role of common variation in the genomic and biological architecture of adult human height. Nat Genet. 2014;46:1173–1186. doi: 10.1038/ng.3097 [DOI] [PMC free article] [PubMed] [Google Scholar]
- 36. The Neale Lab . The 2nd GWAS results in UK Biobank. 2021. Available at: http://www.nealelab.is/uk‐biobank. Accessed March 15, 2021.
- 37. The FinnGen Consortium . FinnGen documentation of R4 release. 2021. Available at: https://finngen.gitbook.io/documentation/. Accessed March 15, 2021.
- 38. Bowden J, Davey Smith G, Haycock PC, Burgess S. Consistent estimation in Mendelian randomization with some invalid instruments using a weighted median estimator. Genet Epidemiol. 2016;40:304–314. doi: 10.1002/gepi.21965 [DOI] [PMC free article] [PubMed] [Google Scholar]
- 39. Bowden J, Davey Smith G, Burgess S. Mendelian randomization with invalid instruments: effect estimation and bias detection through Egger regression. Int J Epidemiol. 2015;44:512–525. doi: 10.1093/ije/dyv080 [DOI] [PMC free article] [PubMed] [Google Scholar]
- 40. Verbanck M, Chen CY, Neale B, Do R. Detection of widespread horizontal pleiotropy in causal relationships inferred from Mendelian randomization between complex traits and diseases. Nat Genet. 2018;50:693–698. doi: 10.1038/s41588-018-0099-7 [DOI] [PMC free article] [PubMed] [Google Scholar]
- 41. Giambartolomei C, Vukcevic D, Schadt EE, Franke L, Hingorani AD, Wallace C, Plagnol V. Bayesian test for colocalisation between pairs of genetic association studies using summary statistics. PLoS Genet. 2014;10:e1004383. doi: 10.1371/journal.pgen.1004383 [DOI] [PMC free article] [PubMed] [Google Scholar]
- 42. Burgess S, Thompson SG. Interpreting findings from Mendelian randomization using the MR‐Egger method. Eur J Epidemiol. 2017;32:377–389. doi: 10.1007/s10654-017-0255-x [DOI] [PMC free article] [PubMed] [Google Scholar]
- 43. Cochran JM, Siebert VR, Bates J, Butulija D, Kolpakchi A, Kadiyala H, Taylor A, Jneid H. The relationship between adult height and blood pressure. Cardiology. 2021;146:345–350. doi: 10.1159/000514205 [DOI] [PubMed] [Google Scholar]
- 44. Burgess S, Davies NM, Thompson SG. Bias due to participant overlap in two‐sample Mendelian randomization. Genet Epidemiol. 2016;40:597–608. doi: 10.1002/gepi.21998 [DOI] [PMC free article] [PubMed] [Google Scholar]
- 45. Sanderson E, Davey Smith G, Windmeijer F, Bowden J. An examination of multivariable Mendelian randomization in the single‐sample and two‐sample summary data settings. Int J Epidemiol. 2019;48:713–727. doi: 10.1093/ije/dyy262 [DOI] [PMC free article] [PubMed] [Google Scholar]
- 46. Brion MJ, Shakhbazov K, Visscher PM. Calculating statistical power in Mendelian randomization studies. Int J Epidemiol. 2013;42:1497–1501. doi: 10.1093/ije/dyt179 [DOI] [PMC free article] [PubMed] [Google Scholar]
- 47. Hemani G, Zheng J, Elsworth B, Wade KH, Haberland V, Baird D, Laurin C, Burgess S, Bowden J, Langdon R, et al. The MR‐base platform supports systematic causal inference across the human phenome. Elife. 2018;7:e34408. doi: 10.7554/eLife.34408 [DOI] [PMC free article] [PubMed] [Google Scholar]
- 48. Yavorska OO, Burgess S. MendelianRandomization: an R package for performing Mendelian randomization analyses using summarized data. Int J Epidemiol. 2017;46:1734–1739. doi: 10.1093/ije/dyx034 [DOI] [PMC free article] [PubMed] [Google Scholar]
- 49. Hazra A, Kraft P, Selhub J, Giovannucci EL, Thomas G, Hoover RN, Chanock SJ, Hunter DJ. Common variants of FUT2 are associated with plasma vitamin B12 levels. Nat Genet. 2008;40:1160–1162. doi: 10.1038/ng.210 [DOI] [PMC free article] [PubMed] [Google Scholar]
- 50. Kröger K, Ose C, Rudofsky G, Roesener J, Weiland D, Hirche H. Peripheral veins: influence of gender, body mass index, age and varicose veins on cross‐sectional area. Vasc Med. 2003;8:249–255. doi: 10.1191/1358863x03vm508oa [DOI] [PubMed] [Google Scholar]
- 51. Scott TE, LaMorte WW, Gorin DR, Menzoian JO. Risk factors for chronic venous insufficiency: a dual case‐control study. J Vasc Surg. 1995;22:622–628. doi: 10.1016/S0741-5214(95)70050-1 [DOI] [PubMed] [Google Scholar]
- 52. Scott TE, Mendez MV, LaMorte WW, Cupples LA, Vokonas PS, Garcia RI, Menzoian JO. Are varicose veins a marker for susceptibility to coronary heart disease in men? Results from the Normative Aging Study. Ann Vasc Surg. 2004;18:459–464. doi: 10.1007/s10016-004-0056-z [DOI] [PubMed] [Google Scholar]
- 53. Abramson JH, Hopp C, Epstein LM. The epidemiology of varicose veins. a survey in western Jerusalem. J Epidemiol Community Health. 1981;35:213–217. doi: 10.1136/jech.35.3.213 [DOI] [PMC free article] [PubMed] [Google Scholar]
- 54. Komsuoğlu B, Göldeli O, Kulan K, Cetinarslan B, Komsuoğlu SS. Prevalence and risk factors of varicose veins in an elderly population. Gerontology. 1994;40:25–31. doi: 10.1159/000213571 [DOI] [PubMed] [Google Scholar]
- 55. Malhotra SL. An epidemiological study of varicose veins in Indian railroad workers from the South and North of India, with special reference to the causation and prevention of varicose veins. Int J Epidemiol. 1972;1:177–183. doi: 10.1093/ije/1.2.177 [DOI] [PubMed] [Google Scholar]
- 56. Nicolopoulos K, Mulugeta A, Zhou A, Hyppönen E. Association between habitual coffee consumption and multiple disease outcomes: a Mendelian randomisation phenome‐wide association study in the UK Biobank. Clin Nutr. 2020;39:3467–3476. doi: 10.1016/j.clnu.2020.03.009 [DOI] [PubMed] [Google Scholar]
- 57. Taylor AE, Davey Smith G, Munafò MR. Associations of coffee genetic risk scores with consumption of coffee, tea and other beverages in the UK Biobank. Addiction. 2018;113:148–157. doi: 10.1111/add.13975 [DOI] [PMC free article] [PubMed] [Google Scholar]
- 58. Naveed M, BiBi J, Kamboh AA, Suheryani I, Kakar I, Fazlani SA, FangFang X, Kalhoro SA, Yunjuan L, Kakar MU, et al. Pharmacological values and therapeutic properties of black tea (Camellia sinensis): a comprehensive overview. Biomed Pharmacother. 2018;100:521–531. doi: 10.1016/j.biopha.2018.02.048 [DOI] [PubMed] [Google Scholar]
- 59. Yuan S, Gill D, Giovannucci EL, Larsson SC. Obesity, type 2 diabetes, lifestyle factors, and risk of gallstone disease: a Mendelian randomization investigation. Clin Gastroenterol Hepatol. 2021. doi: 10.1016/j.cgh.2020.12.034 [DOI] [PubMed] [Google Scholar]
- 60. Sam RC, Burns PJ, Hobbs SD, Marshall T, Wilmink AB, Silverman SH, Bradbury AW. The prevalence of hyperhomocysteinemia, methylene tetrahydrofolate reductase C677T mutation, and vitamin B12 and folate deficiency in patients with chronic venous insufficiency. J Vasc Surg. 2003;38:904–908. doi: 10.1016/S0741-5214(03)00923-6 [DOI] [PubMed] [Google Scholar]
- 61. Selçuk Kapısız N, Uzun Kulaoğlu T, Fen T, Kapısız HF. Potential risk factors for varicose veins with superficial venous reflux. Int J Vasc Med. 2014;2014:531689. doi: 10.1155/2014/531689 [DOI] [PMC free article] [PubMed] [Google Scholar]
- 62. Yuan S, Carter P, Vithayathil M, Kar S, Mason AM, Burgess S, Larsson SC. Genetically predicted circulating B vitamins in relation to digestive system cancers. Br J Cancer. 2021;124:1997–2003. doi: 10.1038/s41416-021-01383-0 [DOI] [PMC free article] [PubMed] [Google Scholar]
- 63. Yuan S, Mason AM, Carter P, Burgess S, Larsson SC. Homocysteine, B vitamins, and cardiovascular disease: a Mendelian randomization study. BMC Med. 2021;19:97. doi: 10.1186/s12916-021-01977-8 [DOI] [PMC free article] [PubMed] [Google Scholar]
- 64. Raffetto JD, Khalil RA. Mechanisms of varicose vein formation: valve dysfunction and wall dilation. Phlebology. 2008;23:85–98. doi: 10.1258/phleb.2007.007027 [DOI] [PubMed] [Google Scholar]
Associated Data
This section collects any data citations, data availability statements, or supplementary materials included in this article.
Supplementary Materials
Tables S1–S7