

Abstract
Background
Lower cardiorespiratory fitness (CRF) is associated with an increased risk for cardiovascular disease. However, very little information is available about the association between lower CRF and right ventricular (RV) remodeling. We investigated the relationship between CRF and RV structure and function in a large, aging, and largely sedentary adult population–based cohort.
Methods and Results
We used cross‐sectional data of 2844 subjects (1486 women; median age, 51 years; interquartile range, 40–62 years) from the population‐based cohort SHIP (Study of Health in Pomerania) with echocardiography, of which 941 also had cardiac magnetic resonance imaging. We analyzed the associations of peak oxygen uptake with RV parameters determined by both imaging techniques using multivariable‐adjusted linear regression models. In echocardiography, a 1 L/min lower peak oxygen uptake was associated with a 1.18 mm (95% CI, 0.66–1.71; P<0.001) smaller RV end‐diastolic diameter and a 1.41 mm (95% CI, 0.90–1.92; P<0.001) narrower RV end‐diastolic outflow tract diameter. Similarly, using cardiac magnetic resonance imaging measurements, a 1 L/min lower peak oxygen uptake was associated with a 23.5 mL (95% CI, 18.7–28.4; P<0.001) smaller RV end‐diastolic volume, a 13.0 mL (95% CI, 9.81–16.2; P<0.001) lower RV end‐systolic volume, and a 10.7 mL/beat (95% CI, 8.10–13.3; P<0.001) lower RV stroke volume.
Conclusions
Our results indicate a significant association between CRF and RV remodeling. Lower CRF was associated with smaller RV chamber and lower RV systolic function, stroke volume, and cardiac output.
Keywords: cardiorespiratory fitness, peak oxygen uptake, physical inactivity, right ventricular geometry and function, right ventricular volumes
Subject Categories: Aging, Cardiovascular Disease, Epidemiology, Exercise, Lifestyle
Nonstandard Abbreviations and Acronyms
- CRF
cardiorespiratory fitness
- PA
physical activity
- RVEDD
right ventricular end‐diastolic diameter
- RVEDV
right ventricular end‐diastolic volume
- SHIP
Study of Health in Pomerania
- VO2peak
peak oxygen uptake
Clinical Perspective
What Is New?
Our study demonstrates that lower cardiorespiratory fitness is associated with smaller chambers size and lower systolic function, stroke volume, and cardiac output of the right heart.
We believe that this relation might explain the previously described aging‐related decrease in size of the heart wherein the sedentary lifestyle of most individuals throughout life might be the most important contributor.
What Are the Clinical Implications?
Further studies are needed to identify the mechanisms of these changes in detail for a possible therapeutic use and to develop more information about the clinical relevance of the right ventricle, possibly also in different populations.
Cardiorespiratory fitness (CRF) is inversely associated with cardiovascular diseases, 1 which remain the most common cause of death worldwide. 2 Interestingly, in the middle of the worldwide COVID‐19 pandemic, a recent study was also able to show that maximal exercise capacity was inversely associated with the probability of hospitalization because of COVID‐19. 3 , 4
CRF refers to the ability of the circulatory and respiratory systems to supply oxygen to skeletal muscles during sustained physical activity (PA). 5 , 6 , 7 The gold standard to determine CRF is the measurement of the peak oxygen uptake (VO2peak) assessed during cardiopulmonary exercise testing (CPET). 8 Higher levels of CRF are associated with a lower risk for cardiovascular disease and morbidity. 9 Higher CRF is related with a higher cardiac output through augmented stroke volume or heart rate, 10 , 11 lower systolic blood pressure, 12 pulmonary arterial pressure, and vascular resistance. 11 , 13 Moreover, greater CRF is associated with increased left ventricular (LV) mass, volume, end‐diastolic diameter and wall thickness as well as with lower resting heart rate—“the athlete’s heart.” 11 , 14 , 15 , 16 , 17 On the other side, in a previous study of our group, 18 we found that lower CRF was associated with a smaller heart size, lower LV stroke volume, cardiac output, LV mass, and higher LV diastolic stiffness.
However, very little information is available about the association between CRF and right ventricular (RV) remodeling. Previous studies mostly included young male endurance athletes. 19 , 20 , 21 , 22 , 23 To the best of our knowledge, only 1 study reported that intentional PA was associated with a higher RV mass in the general population. 11
The aim of our study was to assess the relationship between CRF and RV structure and function in a large, aging, and largely physically inactive adult population–based cohort. We used data from the SHIP (Study of Health in Pomerania) with available cardiac measurements based on echocardiography and cardiac magnetic resonance imaging (cMRI).
Methods
SHIP data are publicly available for scientific and quality control purpose. Data usage can be applied for via www.community‐medicine.de. 24
Study Population
The Study of Health in Pomerania
The presented data were derived from the population‐based prospective cohort SHIP. 25 Recruitment strategy and study design have been reported elsewhere. 24 Briefly, between 1997 and 2001 a random cluster sample of 6265 subjects (aged 20–79) was drawn from the population of West Pomerania, a region in the northeast of Germany. A total of 4308 (2193 women) subjects participated in the baseline (SHIP‐0) study (response=68.8%). In the first examination follow‐up (SHIP‐1), which was realized between 2002 and 2006, of 3949 eligible persons, 3300 subjects were reexamined (follow‐up response=83.6%). In the second examination follow‐up (SHIP‐2), which took place between 2008 and 2012, of 3708 eligible persons, 2333 subjects were reexamined (follow‐up response=62.9%). 24 Between 2008 and 2012, while SHIP‐2 was being conducted, a second independent cohort was established, called Study of Health in Pomerania (SHIP) ‐ Trend, covering a population from the same region as SHIP. A stratified random sample of 8826 adults (aged 20–79) was selected. Subjects who participated in the initial SHIP cohort were excluded from SHIP‐TREND. Thus, 4420 individuals were examined in SHIP‐TREND (response=50.1%). 24
For the present study, we pooled data from SHIP‐2 and SHIP‐TREND (n=6753; 3510 women [52.0%]) and performed cross‐sectional analyses. We excluded, sequentially, participants with previous myocardial infarction or stroke (n=367), pacemakers (n=60), left bundle block (n=51), and LV ejection fraction (determined by echocardiography) <40% (n=38). We also excluded individuals with missing values for either CRF (n=1869) or RV end‐diastolic diameter (RVEDD; n=769) as well as both CRF and RVEDD (n=716) or any of the covariates (n=39) (Figure 1). The final sample comprised 2844 subjects with echocardiographic data (1486 women; 52.3%) aged 20 to 88 years. A subsample of 966 individuals also underwent cMRI, and data of 941 subjects with good‐quality images for the RV were available for further analyses (Figure 1).
Figure 1. Participants flowchart.
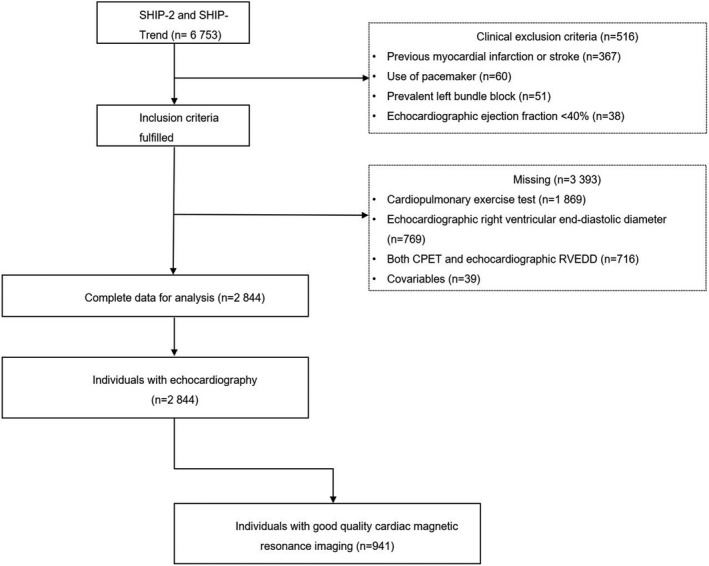
CPET indicates cardiopulmonary exercise test; RVEDD, right ventricular end‐diastolic diameter; SHIP, Study of Health in Pomerania; and Study of Health in Pomerania (SHIP) ‐ Trend.
All study participants gave written informed consent. The study was approved by the ethics committee of the University of Greifswald and complies with the Declaration of Helsinki.
Exercise Testing and Gas Exchange Variables
A symptom‐limited CPET using a calibrated electromagnetically braked cycle ergometer (Ergoselect 100, Ergoline, Germany) was performed with a physician in attendance according to a modified Jones protocol (3 minutes of rest, 1 minute of unloaded cycling at 60 rpm, 1‐minute increases in workload of 16 W/min until symptom‐limited [volitional exertion, dyspnea, or fatigue] or terminated by the physician because of chest pain or ECG abnormalities, and 5 minutes of recovery). 26 , 27 All tests were performed at room air according to current guidelines for exercise testing, with continuous monitoring of ECG, blood pressure, and pulse oximetry. Gas exchange and ventilatory variables VO2peak was analyzed breath by breath averaged over 10‐second intervals using a computer‐based system called VIASYS HEALTHCARE system (Oxycon Pro, Rudolph`s mask, JAEGER/VIASYS Healthcare system; Hoechberg, Germany). 26 Exercise duration was defined from the start of exercise (without resting period) up to its termination. VO2peak in L/min was defined as the highest 10‐second average of absolute oxygen uptake during late exercise or early recovery. 26 The median time interval between the core examination and the cardiopulmonary exercise testing was 28 days (interquartile range, 9; 48 days).
Echocardiographic Examination
Two‐dimensional, M‐mode and Doppler echocardiography were performed by physicians (vivid‐i, GE Medical Systems, Waukesha, Wisconsin, WI) as described in detail elsewhere. 28 Measurements of RVEDD, RV outflow tract diameter, pulmonary velocity acceleration time and tricuspid annular plane systolic excursion were performed according to the guidelines of the American Society of Echocardiography. 29 , 30 Mean pulmonary arterial pressure was calculated in mm Hg using the following equation: mean pulmonary arterial pressure=10^ (−0.0068 * pulmonary valve acceleration time + 2.1). Certification examinations for interobserver variations revealed an agreement of >90%.
cMRI and Analysis
cMRI was performed on a 1.5‐T MR system (Magnetom Avanto; Siemens Medical Systems, Erlangen, Germany) as previously described. 31 Quantitative image analysis was performed by 2 observers with 3 and 5 years of MRI experience using semiautomatic tools in QMass MR 7.2 (MEDIS, Leiden, Netherlands). Interobserver variability was computed in a random subsample of 5%. Certification examinations for interobserver variations revealed an agreement of >90%. 28 Postcontrast images were interpreted of the 2 readers mentioned above and supervised in a consensus reading by a radiologist with 12 years of experience. All observers were unaware of the participants’ medical history.
For the RV measurements, RV end‐diastolic volume (RVEDV) and RV end‐systolic volume were manually traced in end diastole and end systole in transverse axis view. Volumes below the pulmonary valve were included. At the inflow tract, thin‐walled structures without trabeculations were not included as part of the RV. RVEDV was determined during the first image of the acquisition. RV end‐systolic volume was measured by determining the phase in which the RV intracavity blood pool was at its smallest by visual assessment at the midventricular level. RV stroke volume, RV cardiac output and RV ejection fraction were calculated following the equations below:
Statistical Analyses
To characterize the study sample, data are reported as the median (25th and 75th percentile) for continuous variables and as percentages for categorical variables stratified by quartiles and sex. The P for trend was calculated by univariate linear regression models with the continuous VO2peak variable as outcome and each of the listed variables as explanatory variables. The association of VO2peak with RV parameters was investigated by multivariable linear regression models adjusted for age, sex (not when stratified by sex), body fat mass, height2.7, systolic blood pressure, use of antihypertensive medication, glycated hemoglobin, use of hypoglycemic medication, smoking status, and estimated glomerular filtration rate. To evaluate the robustness of our findings in light of dropout from baseline to follow‐up examination (SHIP‐0 to SHIP‐2) and individuals that did not take part in the echocardiographic and magnetic resonance imaging examinations, we performed inverse probability weighting, 32 assuming a missing at random mechanism, 33 based on sociodemographic and health‐related variables in our analyses. We used fractional polynomials to test potentially nonlinear relationships between exposure and outcomes. 34 A 2‐sided P<0.05 was considered as statistically significant. Statistical analyses were performed using Stata 14.1 (Stata Corporation, College Station, TX).
Please see Data S1 for a more detailed description.
Results
Characteristics of the Study Population
The clinical and laboratory characteristics of all study participants stratified by quartiles of VO2peak and sex are summarized in Table 1. The median age of the sample was 51 (interquartile range, 40–62) years and 52.3% were women. Compared to women, men had a higher total body weight (P<0.001), body mass index (P=0.198) and fat‐free mass (P<0.001), while women were less likely to have hypertension (P<0.001), type 2 diabetes mellitus (P=0.001) and hypercholesterolemia (P<0.001). The prevalence of hypertension was 53.1% (men) and 38.3% (women), and of type 2 diabetes mellitus (8.9%, men; and 6.8%, women). Further, 48.1% of the men and 39.4% of the women had hypercholesterolemia. In higher quartiles of VO2peak, men and women had lower levels of physical inactivity (both P<0.001).
Table 1.
Characteristics of the Study Sample Stratified by Quartiles of VO2peak and Sex (n=2853)
| Parameter | First quartile | Second quartile | Third quartile | Fourth quartile | Total | P for trend* | |
|---|---|---|---|---|---|---|---|
| N (%) | Men | 341 | 338 | 340 | 339 | 1358 (47.75) | |
| Women | 372 | 372 | 371 | 371 | 1486 (52.25) | ||
| Age, y | Men | 65 (54–72) | 55 (45–64) | 47 (39–56) | 43 (35–49) | 51 (41–62) | <0.001 * |
| Women | 62 (51–69) | 55 (43–62) | 49 (41–58) | 41 (35–50) | 51 (40–61) | <0.001 * | |
| Fat‐free mass, kg | Men | 62.9 (57.9–69.0) | 65.3 (60.6–71.1) | 66.8 (61.7–72.0) | 69.4 (64.1–74.4) | 66.1 (60.9–72.0) | <0.001 * |
| Women | 44.3 (41.8–47.6) | 46.0 (43.5–49.2) | 47.3 (44.3–50.4) | 49.9 (46.8–53.4) | 46.9 (43.8–50.5) | <0.001 * | |
| Fat mass, kg | Men | 19.9 (16.0–24.3) | 20.0 (16.6–24.7) | 20.6 (16.3–25.0) | 20.6 (16.3–25.0) | 19.4 (15.2–24.5) | 0.715 |
| Women | 21.3 (16.4–28.0) | 23.4 (18.1–28.8) | 23.8 (18.3–29.0) | 25.1 (19.0–32.0) | 23.3 (18.0–29.6) | <0.001 * | |
| Body mass index, kg/m2 | Men | 27.7 (25.4–30.3) | 27.7 (25.6–30.3) | 27.7 (25.3–30.1) | 26.9 (24.9–29.8) | 27.5 (25.3–30.1) | 0.198 |
| Women | 25.7 (22.7–28.8) | 26.3 (23.1–29.4) | 25.8 (23.3–29.1) | 26.2 (23.6–30.2) | 26.0 (23.1–29.4) | 0.001 * | |
| Systolic blood pressure, mm Hg | Men | 135 (125–148) | 133 (125–145) | 133 (123–143) | 130 (122–140) | 133 (123–144) | <0.001 * |
| Women | 126 (111–138) | 119 (109–130) | 119 (109–130) | 116 (109–126) | 119 (109–132) | <0.001 * | |
| Diastolic blood pressure, mm Hg | Men | 79 (73–86) | 81 (74–87) | 82 (76–89) | 79 (74–86) | 80 (74–87) | 0.550 |
| Women | 75 (68–81) | 75 (69–80) | 75 (70–81) | 75 (69–81) | 75 (69–81) | 0.771 | |
| Hypertension, % | Men | 70.7 | 56.8 | 49.7 | 35.1 | 53.1 | <0.001 * |
| Women | 56.2 | 41.1 | 31.3 | 24.5 | 38.3 | <0.001 * | |
| Glycated hemoglobin, n (%) | Men | 5.5 (5.2–5.9) | 5.4 (5.0–5.7) | 5.3 (5.0–5.6) | 5.2 (4.9–5.4) | 5.3 (5.0–5.7) | <0.001 * |
| Women | 5.3 (4.9–5.6) | 5.2 (4.9–5.6) | 5.2 (4.8–5.5) | 5.1 (4.7–5.4) | 5.2 (4.8–5.5) | <0.001 * | |
| Diabetes mellitus type 2, % | Men | 15.8 | 11.2 | 5.59 | 2.95 | 8.91 | <0.001 * |
| Women | 8.87 | 9.41 | 5.12 | 3.77 | 6.80 | 0.001 * | |
| Total cholesterol, mmol/L | Men | 5.30 (4.60–6.10) | 5.50 (4.70–6.10) | 5.50 (4.80–6.30) | 5.20 (4.50–6.00) | 5.40 (4.70–6.10) | 0.053 * |
| Women | 5.70 (5.00–6.50) | 5.70 (5.00–6.50) | 5.40 (4.80–6.10) | 5.20 (4.60–5.90) | 5.50 (4.80–6.20) | <0.001 * | |
| LDL‐cholesterol, mmol/L | Men | 3.30 (2.76–3.87) | 3.46 (2.90–4.05) | 3.56 (3.00–4.12) | 3.28 (2.69–3.85) | 3.42 (2.83–3.97) | 0.153 |
| Women | 3.42 (2.82–4.08) | 3.42 (2.81–4.12) | 3.27 (2.68–3.91) | 3.13 (2.44–3.70) | 3.31 (2.69–3.97) | <0.001 * | |
| HDL‐cholesterol (mmol/L) | Men | 1.22 (1.03–1.47) | 1.26 (1.08–1.48) | 1.30 (1.11–1.49) | 1.31 (1.12–1.54) | 1.28 (1.09–1.50) | <0.001 * |
| Women | 1.58 (1.36–1.83) | 1.60 (1.36–1.87) | 1.55 (1.36–1.77) | 1.58 (1.35–1.81) | 1.58 (1.36–1.81) | 0.733 | |
| Cholesterol‐HDL ratio | Men | 4.30 (3.49–5.19) | 4.34 (3.54–5.20) | 4.32 (3.48–5.15) | 3.89 (3.32–4.70) | 4.21 (3.46–5.08) | <0.001 * |
| Women | 3.52 (3.00–4.18) | 3.46 (2.91–4.28) | 3.42 (2.93–4.04) | 3.31 (2.73–3.99) | 3.43 (2.89–4.11) | <0.001 * | |
| Estimated glomerular filtration rate, (mL/min per 1.73 m²) | Men | 82.0 (69.4–93.0) | 90.9 (78.7–100) | 94.3 (83.1–105) | 99.5 (88.7–109) | 91.9 (79.5–103) | <0.001 * |
| Women | 85.4 (71.9–96.1) | 90.4 (77.5–101) | 93.8 (80.6–106) | 96.0 (85.4–108) | 91.7 (78.8–103) | <0.001 * | |
| Smoking, % | Men | ||||||
| Never | 21.7 | 26.9 | 30.9 | 38.6 | 29.5 | ||
| Current | 28.5 | 24.9 | 23.8 | 18.0 | 23.8 | <0.001 * | |
| Former | 49.9 | 48.2 | 45.3 | 43.4 | 46.7 | <0.001 * | |
| Women | |||||||
| Never | 58.3 | 46.2 | 42.6 | 41.5 | 47.2 | ||
| Current | 14.5 | 21.0 | 21.3 | 22.6 | 19.9 | <0.001 * | |
| Former | 27.2 | 32.8 | 36.1 | 35.9 | 33.0 | 0.002 * | |
| Physical inactivity, % | Men | 36.1 | 30.2 | 28.2 | 19.5 | 28.5 | <0.001 * |
| Women | 33.3 | 26.6 | 24.3 | 15.4 | 24.9 | <0.001 * |
Data are medians (25th–75th percentile) or percentage.
P for trend was calculated by univariate linear regression models with the continuous VO2peak variable as outcome and each of the listed variables as explanatory variables. HDL indicates high‐density lipoprotein; LDL, low‐density lipoprotein; and VO2peak, maximal oxygen uptake.
Table S1 shows the characteristics of the study sample stratified by the whole sample and the analyses sample.
Although the associations of VO2peak with echocardiographically and cMRI‐determined parameters were not modified by age or sex (all P values for interaction >0.3), we decided to evaluate all the associations of VO2peak with parameters of cardiac geometry and function not only in pooled sex analyses (the total sample) but also stratified by sex. In sensitivity analyses, we also stratified by age (Table S2 shows our results stratified by age).
Association Between VO2peak and RV Structural and Functional Parameters
Table 2 shows the adjusted β‐coefficients (95% CI) of the associations between VO2peak and different RV structural and functional parameters based on echocardiography and cMRI, respectively.
Table 2.
Adjusted* β‐Coefficient (95% CI) of the Associations of Peak Oxygen Uptake (VO2peak) with Echocardiographic and Cardiac Magnetic Resonance Imaging Derived Parameters in Pooled Sex Analyses and Stratified by Sex
| Parameter | Overall | P value | R 2 | Men | P value | R 2 | Women | P value | R 2 |
|---|---|---|---|---|---|---|---|---|---|
| β coefficient (95% CI) | β coefficient (95% CI) | β coefficient (95% CI) | |||||||
| Right ventricular structural parameters based on echocardiography | |||||||||
| RVEDD, mm | 1.18 (0.66 to 1.71) | <0.001 | 0.16 | 1.08 (0.42 to 1.74) | 0.001 | 0.06 | 1.34 (0.40 to 2.27) | 0.005 | 0.11 |
| RVOT, mm | 1.41 (0.90 to 1.92) | <0.001 | 0.25 | 1.35 (0.70 to 2.00) | <0.001 | 0.13 | 1.59 (0.83 to 2.34) | <0.001 | 0.19 |
| Functional right ventricular parameters based on echocardiography | |||||||||
| MPAP, mm Hg | −0.97 (−1.71 to −0.22) | 0.011 | 0.17 | −1.25 (−2.20 to −0.31) | 0.009 | 0.17 | −0.28 (−1.52 to 0.95) | 0.650 | 0.17 |
| TAPSE, mm | 0.84 (0.46 to 1.22) | <0.001 | 0.05 | 0.82 (0.34 to 1.30) | 0.001 | 0.04 | 1.15 (0.48 to 1.81) | 0.001 | 0.06 |
| e´/a´ ratio | −0.016 (−0.062 to 0.030) | 0.499 | 0.10 | 0.034 (−0.021 to 0.089) | 0.222 | 0.18 | −0.111 (−0.239 to 0.017) | 0.090 | 0.18 |
| Functional and structural right ventricular parameters based on cMRI | |||||||||
| RVEDV, mL | 23.5 (18.7 to 28.4) | <0.001 | 0.53 | 19.6 (13.2 to 25.9) | <0.001 | 0.32 | 27.4 (19.2 to 35.6) | <0.001 | 0.35 |
| RVESV, mL | 13.0 (9.81 to 16.2) | <0.001 | 0.49 | 11.1 (6.97 to 15.1) | <0.001 | 0.24 | 14.0 (8.93 to 19.1) | <0.001 | 0.32 |
| RVSV, mL/beat | 10.7 (8.10 to 13.3) | <0.001 | 0.40 | 8.50 (4.91 to 12.1) | <0.001 | 0.25 | 13.5 (9.05 to 17.9) | <0.001 | 0.29 |
| RVCO, L/min | 0.58 (0.36 to 0.79) | <0.001 | 0.40 | 0.45 (0.18 to 0.72) | 0.001 | 0.30 | 0.76 (0.38 to 1.14) | <0.001 | 0.29 |
| RVEF, % | −0.91 (−1.96 to 0.15) | 0.092 | 0.17 | −0.78 (−1.99 to 0.43) | 0.206 | 0.03 | −0.97 (−2.80 to 0.86) | 0.297 | 0.14 |
*Linear regression adjusted for age, sex (not when stratified by sex), body fat mass, height2.7, systolic blood pressure, use of antihypertensive medication, glycated hemoglobin, use of hypoglycemic medication, smoking status, and estimated glomerular filtration rate (Chronic Kidney Disease Epidemiology Collaboration formula). Data were weighted according to dropout from baseline to follow‐up examination (SHIP‐0 to SHIP‐2) and individuals who did not take part in the echocardiographic and magnetic resonance imaging examinations (SHIP‐2 and SHIP‐Trend).
cMRI indicates cardiac magnetic resonance imaging; e´/a´ ratio, lateral early and late tricuspid annular peak diastolic velocity ratio; MPAP, mean pulmonary arterial pressure; RVCO, right ventricular cardiac output; RVEDD, right ventricular end‐diastolic diameter; RVEDV, right ventricular end‐diastolic volume; RVEF, right ventricular ejection fraction.; RVESV, right ventricular end‐systolic volume; RVOT, right ventricular end‐diastolic outflow tract diameter; RVSV, right ventricular stroke volume; SHIP, Study of Health in Pomerania; and TAPSE, tricuspid annular plane systolic excursion.
Echocardiography
Since CRF (independent variable in our analysis) decreases with age 35 and we aimed to assess the relationship between CRF and RV parameters (dependent variable) in our aging and mostly physically inactive study population, we inverted the x axis. A more detailed explanation can be found in the discussion. Figure 2A illustrates the associations of VO2peak with different echocardiographic parameters. Specifically, a 1 L/min lower VO2peak was associated with a 1.18 mm (95% CI; 0.66–1.71; P<0.001) smaller RVEDD and 1.41 mm (95% CI, 0.90–1.92; P<0.001) narrower RV outflow tract. In addition, a 1 L/min lower VO2peak was related with 0.97 mm Hg (95% CI, −1.71 to −0.22; P=0.011) greater mean pulmonary arterial pressure and 0.84 mm (95% CI, 0.46–1.22; P<0.001) lower tricuspid annular plane systolic excursion. There was no association between VO2peak and lateral early and late tricuspid annular peak diastolic velocity ratio.
Figure 2. Associations of VO2peak values with echocardiographic and cardiac magnetic resonance imaging determined right ventricular parameters.
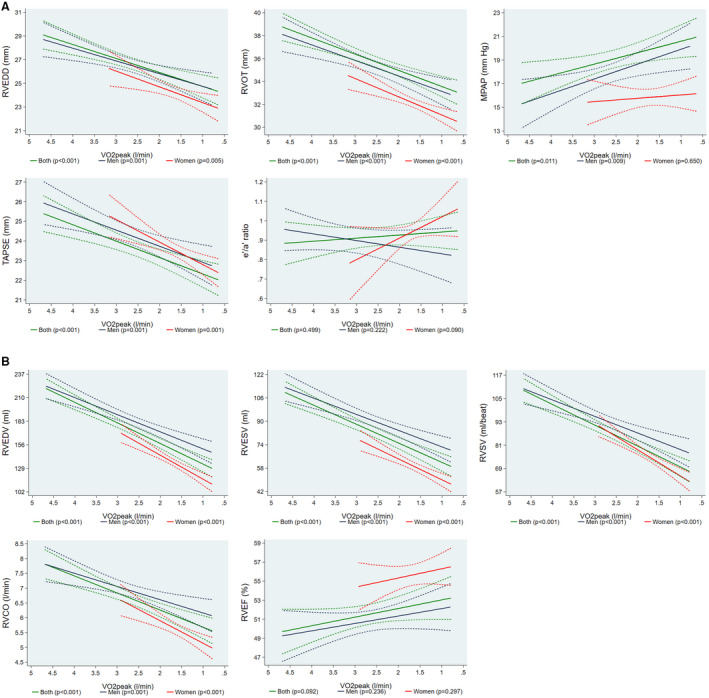
(A) Adjusted* line (95% CI) showing the associations of peak oxygen uptake (VO2peak) values with echocardiographic determined right ventricular end‐diastolic diameter (RVEDD), right ventricular end‐diastolic outflow tract diameter (RVOT), mean pulmonary arterial pressure (MPAP), tricuspid annular plane systolic excursion (TAPSE) and lateral early and late tricuspid annular peak diastolic velocity ratio (e′/a′ ratio) for both sexes together (n=2844) and stratified by sex (men=1358; women=1486). (B) Adjusted* line (95% CI) showing the associations of peak oxygen uptake (VO2peak) values with magnetic resonance imaging determined right ventricular end‐diastolic volume (RVEDV), right ventricular end‐systolic volume (RVESV), right ventricular stroke volume (RVSV), right ventricular cardiac output (RVCO) and right ventricular ejection fraction (RVEF) for both sexes together (n=941) and stratified by sex (men=499; women=442). *Linear regression adjusted for age, sex (not when stratified by sex), body fat mass, height2.7, systolic blood pressure, use of antihypertensive medication, glycated hemoglobin, use of hypoglycemic medication, smoking status, and estimated glomerular filtration rate (Chronic Kidney Disease Epidemiology Collaboration formula). Data were weighted according to dropout from baseline to follow‐up examination (SHIP‐0 to SHIP‐2) and individuals that did not take part in the echocardiographic and magnetic resonance imaging examinations (SHIP‐2 and SHIP‐Trend).
Cardiac Magnetic Resonance Imaging
Figure 2B shows the associations of VO2peak with cMRI parameters. A 1 L/min lower VO2peak was associated with a 23.5 mL (95% CI, 18.7–28.4; P<0.001) smaller RVEDV and a 13.0 mL (95% CI, 9.81–16.2; P<0.001) lower RV end‐systolic volume. Furthermore, lower levels of VO2peak were associated with a 10.7 mL/beat (95% CI, 8.10–13.3; P<0.001) and 0.58 L/min (95% CI, 0.36–0.79; P<0.001) smaller RV stroke volume and RV cardiac output, respectively. There was no statistically significant association between VO2peak and RV ejection fraction. Table S2 shows our results stratified by age.
To investigate which of the echocardiographic variables were independently of each other associated with the VO2peak, we conducted a linear regression analysis with VO2peak as outcome and all five echocardiographic variables as exposures adjusting for the same confounder than in the main analyses. In this model RVEDD (P=0.003), RV outflow tract (P<0.001) and tricuspid annular plane systolic excursion (P<0.001) were significantly associated with the VO2peak. For the MRI variables, such an analysis was not possible because these variables were highly correlated among each other.
Discussion
In this study, we evaluated associations of CRF with RV structure and function in a large sample of the general population that were mostly free of clinically relevant cardiometabolic diseases. Our main result is a positive association between VO2peak values and RV structural (eg, RVEDD and RVEDV) as well as functional parameters (eg, tricuspid annular plane systolic excursion).
In the Context of the Published Literature
To the best of our knowledge, only one previous population‐based study, the MESA (Multi‐Ethnic Study of Atherosclerosis), reported positive associations between PA and RV remodeling. 11 Higher levels of moderate and vigorous physical activity were linearly associated with greater RV mass and RV volumes. Further, intentional exercise was nonlinearly associated with RV mass (independent of LV mass) and with RVEDV. Study participants who spent more time doing intentional exercise also had greater RV stroke volume. However, there was no significant association between moderate and vigorous PA and RV ejection fraction as well as between intentional exercise and RV ejection fraction. A potential limitation of this analysis was that PA was assessed using self‐reported questionnaires, which may induce social desirability bias and overestimate the true levels of PA. 36 , 37 To exclude the mentioned bias of PA, we used CRF measured with the gold standard CPET. Further, PA and CRF are inversely and independently associated with all‐cause and cardiovascular mortality. 38 , 39 Physical inactivity or sedentary lifestyle is causally associated with deleterious cardiovascular risk profiles and outcomes. Importantly, the pathophysiological mechanisms involved with sedentary lifestyle are not fundamentally the opposite of those related with physical activity and exercise training. Previous studies, like the MESA, have predominantly investigated the effects of exercise training on cardiac parameters—“the athlete’s heart,” while only a few publications have evaluated the shrinkage of the heart following a sedentary lifestyle. The problem of this view is that, unfortunately, physical activity or exercise training is not a major characteristic of the lifestyle of the normal population. Western society tends to be more and more described as a prevalent sedentary society with all the deleterious effects that accompany this choice. Therefore, we believe that there is a lack of research that analyzes the associations of lower cardiorespiratory fitness with health parameters. Moreover, our study obtained a high agreement using our 2 methods (echo and cMRI) and we have a larger number of participants with a wider age range than MESA.
While higher levels of PA may increase CRF, 38 , 40 our population‐based cohort consists of an aging and largely physically inactive population. Hence, at least 2 interpretations of our findings are possible. One may discuss the positive association between higher levels of VO2peak and RV structural and functional parameters. Alternatively, because of our study population, one may conclude that aging and physical inactivity may also induce RV remodeling. Older individuals have lower levels of CRF and are more sedentary than young individuals. To facilitate the interpretation of our data we changed the directionality of the x axis in our figures to clarify this interpretation.
Potential Mechanisms for the Observed Associations
The decline in VO2peak caused by aging is a multifactorial process. The central physiological mechanism that might explicate the finding of our study is the volume unloading of the heart caused by a decline in total blood and plasma volume. Physical inactivity reduces circulating plasma proteins and thirst resulting in reduced oncotic pressure and less fluid intake. In addition, physical inactivity seems to lead to an inhibition of the renin‐aldosterone system that results in less renal sodium and water retention, which causes more urine output. All these effects, following physical inactivity, lead to a volume unload of the heart, 35 which decreases venous return and, moreover, reduces cardiac filling and stroke volume, which in turn further lowers VO2peak. 41 In a previous analysis, 18 we found similar results regarding the LV structure and function. In addition, physical inactivity induces endothelial dysfunction as well as vasoconstriction. During aging, the skeletal muscles also atrophy, which leads to the activation of muscle proteolytic pathways via mitochondrial fission. 42 The cardiac stiffness results from a fibrous conversion of the amorphous intercellular substance, resulting in an impairment of oxygen delivery. 43 , 44 Hence, our results may be explained by an inactive aging population with less plasma volume and subsequently altered RV structure. This results in a smaller and stiffer heart, particularly in an aging and inactive population. 18 , 35 , 45 , 46
In modern societies, the prevalence of physical inactivity have reached pandemic levels. 9 Low levels of CRF, partially driven by inactivity, are associated with a higher risk of cardiovascular disease and all‐cause mortality. 9 , 47 , 48 , 49 Physical inactivity has adverse effects on the cardiovascular system (eg, a higher risk for hypertension and myocardial infarction), on the musculoskeletal system (eg, atrophy and sarcopenia) and the metabolism (eg, reduced fatty acid oxidation and glucose uptake). 48
Maintaining high levels of PA throughout life may help to reduce the age‐related RV alterations. The estimated rate of decline in VO2peak between the ages of 25 and 65 was about 40% slower in physically active compared with inactive men. 50 Physically inactive men also have a threefold greater decline in VO2peak than individuals who were recreationally active. 51 The age‐related decline in VO2peak is not only a result of lower levels of PA because there is also a 5% decline per decade in highly active individuals. 35 Sarcopenia describes the age‐related decline of muscle mass with decreased strength and aerobic and functional capacity. 9 , 52 , 53 The prevalence of sarcopenia is 5% to 13% in 60‐ to 70‐year‐old subjects and even 11% to 50% in subjects over the age of 80 years. 52 Reduced muscle mass leads to lower VO2peak. 53 VO2peak is also lower in older individuals because of reduced mitochondrial oxidative capacity in skeletal muscles. 35 , 45 The interaction between aging, age‐associated physical inactivity and decreased muscle mass leads to a reduction of VO2peak. 35 , 54
In summary and in line with our results, the decline in VO2peak is related primarily to a lower maximal cardiac output. Apart from this, a smaller stroke volume, a slower maximal heart rate, a decreased arteriovenous oxygen difference, and muscle blood flow are other important mechanisms. 35 , 45 , 50
Study Limitations and Strengths
There are at least 2 potential limitations of our study that merit discussion. The first limitation is the cross‐sectional design because causal inferences cannot be concluded. Further, our study included only White individuals of European ancestry. In spite of these limitations, our study has some significant strengths. First, our well‐characterized population‐based cohort with a large number of individuals, including men and women, all socioeconomic strata, and a wide age range. Second, the standardized assessment of VO2peak measured by CPET. One of the most relevant strengths are the 2 different imaging techniques we used. The cMRI data are especially important for the RV parameters because it is difficult to examine them in the echo, and cMRI images are much more meaningful. Finally, the availability of data on several metabolic risk factors, which were used as confounders.
Sources of Funding
SHIP is part of the Community Medicine Research net (http://www.medizin.uni‐greifswald.de/icm) of the University of Greifswald supported by grants from the German Federal Ministry of Education and Research (German Federal Ministry of Education and Research, grant number: 01ZZ96030 and 01ZZ0701) and by the German Competence Network Heart Failure MRI scans in SHIP‐TREND‐0 have been supported by a joint grant from Siemens Healthineers, Erlangen, Germany and the Federal State of Mecklenburg‐West Pomerania. This study was carried out in collaboration with the German Centre for Cardiovascular Research, which is supported by the German Federal Ministry of Education and Research and the German Center for Diabetes Research. This work was supported by the Kompetenznetz Adipositas (Competence Network Obesity) funded by the German Federal Ministry of Education and Research (grant number: 01GI1121B).
Disclosures
Dr Ewert reports grants and personal fees from Janssen, personal fees from Bayer Vital, grants and personal fees from Boehringer Ingelheim, grants and personal fees from OMT, and personal fees from Berlin Chemie outside the submitted work. Dr Gläser reports personal fees from Boehringen Ingelheim, personal fees from Roche Pharma, and personal fees from Berlin Chemie outside the submitted work. The remaining authors have no disclosures to report.
Supporting information
Acknowledgments
We thank all members of the examination center in Greifswald who were involved in the conduction of the study.
For Sources of Funding and Disclosures, see page 9.
References
- 1. Lavie CJ, Lee D‐C, Ortega FB. UK biobank contributes to aerobic and muscle fitness research. Mayo Clin Proc. 2020;95:840–842. doi: 10.1016/j.mayocp.2020.03.019 [DOI] [PubMed] [Google Scholar]
- 2. Townsend N, Wilson L, Bhatnagar P, Wickramasinghe K, Rayner M, Nichols M. Cardiovascular disease in Europe: epidemiological update 2016. Eur Heart J. 2016;37:3232–3245. doi: 10.1093/eurheartj/ehw334 [DOI] [PubMed] [Google Scholar]
- 3. Brawner CA, Ehrman JK, Bole S, Kerrigan DJ, Parikh SS, Lewis BK, Gindi RM, Keteyian C, Abdul‐Nour K, Keteyian SJ. Inverse relationship of maximal exercise capacity to hospitalization secondary to coronavirus disease 2019. Mayo Clin Proc. 2021;96:32–39. doi: 10.1016/j.mayocp.2020.10.003 [DOI] [PMC free article] [PubMed] [Google Scholar]
- 4. Lavie CJ, Coursin DB, Long MT. The obesity paradox in infections and implications for COVID‐19. Mayo Clin Proc. 2021;96:518–520. doi: 10.1016/j.mayocp.2021.01.014 [DOI] [PMC free article] [PubMed] [Google Scholar]
- 5. Bahls M, Dörr M. Epidemiology: Physical activity, exercise and mortality. In: Pressler A, Niebauer J, eds. Textbook of Sports and Exercise Cardiology. Cham: Springer International Publishing; 2020:703–717. [Google Scholar]
- 6. Alpert MA, Lavie CJ, Agrawal H, Aggarwal KB, Kumar SA. Obesity and heart failure: Epidemiology, pathophysiology, clinical manifestations, and management. Transl Res. 2014;164:345–356. [DOI] [PubMed] [Google Scholar]
- 7. Lavie CJ, Arena R, Swift DL, Johannsen NM, Sui X, Lee D‐C, Earnest CP, Church TS, O’Keefe JH, Milani RV, et al. Exercise and the cardiovascular system: clinical science and cardiovascular outcomes. Circ Res. 2015;117:207–219. doi: 10.1161/CIRCRESAHA.117.305205 [DOI] [PMC free article] [PubMed] [Google Scholar]
- 8. Ross R, Blair SN, Arena R, Church TS, Després J‐P, Franklin BA, Haskell WL, Kaminsky LA, Levine BD, Lavie CJ, et al. Importance of assessing cardiorespiratory fitness in clinical practice: a case for fitness as a clinical vital sign: a scientific statement from the American Heart Association. Circulation. 2016;134:e653–e699. doi: 10.1161/CIR.0000000000000461 [DOI] [PubMed] [Google Scholar]
- 9. Booth FW, Roberts CK, Thyfault JP, Ruegsegger GN, Toedebusch RG. Role of inactivity in chronic diseases: evolutionary insight and pathophysiological mechanisms. Physiol Rev. 2017;97:1351–1402. doi: 10.1152/physrev.00019.2016 [DOI] [PMC free article] [PubMed] [Google Scholar]
- 10. Rerych SK, Scholz PM, Sabiston DC, Jones RH. Effects of exercise training on left ventricular function in normal subjects: a longitudinal study by radionuclide angiography. Am J Cardiol. 1980;45:244–252. doi: 10.1016/0002-9149(80)90642-6 [DOI] [PubMed] [Google Scholar]
- 11. Aaron CP, Tandri H, Barr RG, Johnson WC, Bagiella E, Chahal H, Jain A, Kizer JR, Bertoni AG, Lima JAC, et al. Physical activity and right ventricular structure and function. Am J Respir Crit Care Med. 2011;183:396–404. Doi: 10.1164/rccm.201003-0469OC [DOI] [PMC free article] [PubMed] [Google Scholar]
- 12. Kokkinos P. Cardiorespiratory fitness, exercise, and blood pressure. Hypertension. 2014;64:1160–1164. doi: 10.1161/HYPERTENSIONAHA.114.03616 [DOI] [PubMed] [Google Scholar]
- 13. Wilhelm MSC. The athlete’s heart: different training responses, gender and ethnicity dependencies. Cardiovasc Med. 2012;15:69–77. doi: 10.4414/cvm.2012.01655 [DOI] [Google Scholar]
- 14. Turkbey EB, Jorgensen NW, Johnson WC, Bertoni AG, Polak JF, Diez Roux AV, Tracy RP, Lima JAC, Bluemke DA. Physical activity and physiological cardiac remodelling in a community setting: the Multi‐Ethnic Study of Atherosclerosis (MESA). Heart. 2010;96:42–48. doi: 10.1136/hrt.2009.178426 [DOI] [PMC free article] [PubMed] [Google Scholar]
- 15. Maron BJ, Pelliccia A. The heart of trained athletes: cardiac remodeling and the risks of sports, including sudden death. Circulation. 2006;114:1633–1644. doi: 10.1161/CIRCULATIONAHA.106.613562 [DOI] [PubMed] [Google Scholar]
- 16. Pluim BM, Zwinderman AH, Pluim BM, Zwinderman AH. van der Laarse A & van der Wall EE The athlete’s heart. Circulation. 2000;101:336–344. doi: 10.1161/01.cir.101.3.336 [DOI] [PubMed] [Google Scholar]
- 17. Pluim BM, Zwinderman AH, van der Laarse A, van der Wall EE. The athlete’s heart. A meta‐analysis of cardiac structure and function. Circulation. 2000;101:336–344. doi: 10.1161/01.cir.101.3.336 [DOI] [PubMed] [Google Scholar]
- 18. Markus MRP, Ittermann T, Drzyzga CJ, Bahls M, Schipf S, Siewert‐Markus U, Baumeister SE, Ewert R, Völzke H, Steinhagen‐Thiessen E, et al. Lower cardiorespiratory fitness is associated with a smaller and stiffer heart: the sedentary’s heart. JACC Cardiovasc Imaging. 2021;14:310–313. doi: 10.1016/j.jcmg.2020.07.032 [DOI] [PubMed] [Google Scholar]
- 19. Bohm P, Schneider G, Linneweber L, Rentzsch A, Krämer N, Abdul‐Khaliq H, Kindermann W, Meyer T, Scharhag J. Right and left ventricular function and mass in male elite master athletes: a controlled contrast‐enhanced cardiovascular magnetic resonance study. Circulation. 2016;133:1927–1935. doi: 10.1161/CIRCULATIONAHA.115.020975 [DOI] [PubMed] [Google Scholar]
- 20. Oxborough D, Shave R, Warburton D, Williams K, Oxborough A, Charlesworth S, Foulds H, Hoffman MD, Birch K, George K. Dilatation and dysfunction of the right ventricle immediately after ultraendurance exercise. Circ Cardiovasc Imaging. 2011;4:253–263. doi: 10.1161/circimaging.110.961938 [DOI] [PubMed] [Google Scholar]
- 21. Patil HR, O'Keefe JH, Lavie CJ, Magalski A, Vogel RA, McCullough PA. Cardiovascular damage resulting from chronic excessive endurance exercise. Mo Med. 2012;109:312–321. [PMC free article] [PubMed] [Google Scholar]
- 22. La Gerche A, Claessen G, Dymarkowski S, Voigt J‐U, de Buck F, Vanhees L, Droogne W, van Cleemput J, Claus P, Heidbuchel H. Exercise‐induced right ventricular dysfunction is associated with ventricular arrhythmias in endurance athletes. Eur Heart J. 2015;36:1998–2010. doi: 10.1093/eurheartj/ehv202 [DOI] [PubMed] [Google Scholar]
- 23. Teske AJ, Prakken NH, de Boeck BW, Velthuis BK, Martens EP, Doevendans PA, Cramer MJ. Echocardiographic tissue deformation imaging of right ventricular systolic function in endurance athletes. Eur Heart J. 2009;30:969–977. doi: 10.1093/eurheartj/ehp040 [DOI] [PubMed] [Google Scholar]
- 24. Volzke H, Alte D, Schmidt CO, Radke D, Lorbeer R, Friedrich N, Aumann N, Lau K, Piontek M, Born G, et al. Cohort profile: the study of health in Pomerania. Int J Epidemiol. 2011;40:294–307. doi: 10.1093/ije/dyp394 [DOI] [PubMed] [Google Scholar]
- 25. John U, Hensel E, Ldemann J, Piek M, Sauer S, Adam C, Born G, Alte D, Greiser E, Haertel U, et al. Study of Health in Pomerania (SHIP): A health examination survey in an east German region: objectives and design. Sozial‐ Und Präventivmedizin. 2001;46:186–194. doi: 10.1007/BF01324255 [DOI] [PubMed] [Google Scholar]
- 26. Gläser S, Koch B, Ittermann T, Schäper C, Dörr M, Felix SB, Völzke H, Ewert R, Hansen JE. Influence of age, sex, body size, smoking, and beta blockade on key gas exchange exercise parameters in an adult population. Eur J Cardiovasc Prev Rehabil. 2010;17:469–476. doi: 10.1097/HJR.0b013e328336a124 [DOI] [PubMed] [Google Scholar]
- 27. Jones NL, Makrides L, Hitchcock C, Chypchar T, McCartney N. Normal standards for an incremental progressive cycle ergometer test. Am Rev Respir Dis. 1985;131:700–708. doi: 10.1164/arrd.1985.131.5.700 [DOI] [PubMed] [Google Scholar]
- 28. Völzke H, Haring R, Lorbeer R, Wallaschofski H, Reffelmann T, Empen K, Rettig R, John U, Felix SB, Dörr M. Heart valve sclerosis predicts all‐cause and cardiovascular mortality. Atherosclerosis. 2010;209:606–610. doi: 10.1016/j.atherosclerosis.2009.10.030 [DOI] [PubMed] [Google Scholar]
- 29. Lang RM, Bierig M, Devereux RB, Flachskampf FA, Foster E, Pellikka PA, Picard MH, Roman MJ, Seward J, Shanewise J, et al. Recommendations for chamber quantification. Eur J Echocardiogr. 2006;7:79–108. doi: 10.1016/j.euje.2005.12.014 [DOI] [PubMed] [Google Scholar]
- 30. Lang RM, Badano LP, Mor‐Avi V, Afilalo J, Armstrong A, Ernande L, Flachskampf FA, Foster E, Goldstein SA, Kuznetsova T, et al. Recommendations for cardiac chamber quantification by echocardiography in adults: an update from the American Society of Echocardiography and the European Association of Cardiovascular Imaging. J Am Soc Echocardiogr. 2015;28:1–39.e14. doi: 10.1016/j.echo.2014.10.003 [DOI] [PubMed] [Google Scholar]
- 31. Bülow R, Ittermann T, Dörr M, Poesch A, Langner S, Völzke H, Hosten N, Dewey M. Reference ranges of left ventricular structure and function assessed by contrast‐enhanced cardiac MR and changes related to ageing and hypertension in a population‐based study. Eur Radiol. 2018;28:3996–4005. doi: 10.1007/s00330-018-5345-y [DOI] [PubMed] [Google Scholar]
- 32. Hogan JW, Roy J, Korkontzelou C. Handling drop‐out in longitudinal studies. Statist Med. 2004;23:1455–1497. doi: 10.1002/sim.1728 [DOI] [PubMed] [Google Scholar]
- 33. Haring R, Volzke H, Steveling A, Krebs A, Felix SB, Schofl C, Dorr M, Nauck M, Wallaschofski H. Low serum testosterone levels are associated with increased risk of mortality in a population‐based cohort of men aged 20–79. Eur Heart J. 2010;31:1494–1501. doi: 10.1093/eurheartj/ehq009 [DOI] [PubMed] [Google Scholar]
- 34. Sauerbrei W, Meier‐Hirmer C, Benner A, Royston P. Multivariable regression model building by using fractional polynomials: description of SAS, STATA and R programs. Comput Stat Data Anal. 2006;50:3464–3485. Doi: 10.1016/j.csda.2005.07.015 [DOI] [Google Scholar]
- 35. Betik AC, Hepple RT. Determinants of VO2 max decline with aging: an integrated perspective. Appl Physiol Nutr Metab. 2008;33:130–140. doi: 10.1139/H07-174 [DOI] [PubMed] [Google Scholar]
- 36. Warren JM, Ekelund U, Besson H, Mezzani A, Geladas N, Vanhees L. Assessment of physical activity ‐ a review of methodologies with reference to epidemiological research: a report of the exercise physiology section of the European Association of Cardiovascular Prevention and Rehabilitation. Eur J Cardiovasc Prev Rehabil. 2010;17:127–139. doi: 10.1097/HJR.0b013e32832ed875 [DOI] [PubMed] [Google Scholar]
- 37. Prince SA, Adamo KB, Hamel ME, Hardt J, Connor Gorber S, Tremblay M. A comparison of direct versus self‐report measures for assessing physical activity in adults: a systematic review. Int J Behav Nutr Phys Act. 2008;5:56. doi: 10.1186/1479-5868-5-56 [DOI] [PMC free article] [PubMed] [Google Scholar]
- 38. DeFina LF, Haskell WL, Willis BL, Barlow CE, Finley CE, Levine BD, Cooper KH. Physical activity versus cardiorespiratory fitness: two (partly) distinct components of cardiovascular health? Prog Cardiovasc Dis. 2015;57:324–329. doi: 10.1016/j.pcad.2014.09.008 [DOI] [PubMed] [Google Scholar]
- 39. Bahls M, Groß S, Baumeister SE, Völzke H, Gläser S, Ewert R, Markus MRP, Medenwald D, Kluttig A, Felix SB, et al. Association of domain‐specific physical activity and cardiorespiratory fitness with all‐cause and cause‐specific mortality in two population‐based cohort studies. Sci Rep. 2018;8:16066. doi: 10.1038/s41598-018-34468-7 [DOI] [PMC free article] [PubMed] [Google Scholar]
- 40. Myers J, McAuley P, Lavie CJ, Despres J‐P, Arena R, Kokkinos P. Physical activity and cardiorespiratory fitness as major markers of cardiovascular risk: their independent and interwoven importance to health status. Prog Cardiovasc Dis. 2015;57:306–314. doi: 10.1016/j.pcad.2014.09.011 [DOI] [PubMed] [Google Scholar]
- 41. Convertino VA. Blood volume response to physical activity and inactivity. Am J Med Sci. 2007;334:72–79. doi: 10.1097/MAJ.0b013e318063c6e4 [DOI] [PubMed] [Google Scholar]
- 42. Cartee GD, Hepple RT, Bamman MM, Zierath JR. Exercise promotes healthy aging of skeletal muscle. Cell Metab. 2016;23:1034–1047. doi: 10.1016/j.cmet.2016.05.007 [DOI] [PMC free article] [PubMed] [Google Scholar]
- 43. Aåstrand P‐O. Human physical fitness with special reference to sex and age. Physiol Rev. 1956;36:307–335. doi: 10.1152/physrev.1956.36.3.307 [DOI] [PubMed] [Google Scholar]
- 44. Baskin KK, Taegtmeyer H. Taking pressure off the heart: the ins and outs of atrophic remodelling. Cardiovasc Res. 2011;90:243–250. doi: 10.1093/cvr/cvr060 [DOI] [PMC free article] [PubMed] [Google Scholar]
- 45. Terjung RL, Zarzeczny R, Yang HT. Muscle blood flow and mitochondrial function: influence of aging. Int J Sport Nutr Exerc Metab. 2002;12:368–378. doi: 10.1123/ijsnem.12.3.368 [DOI] [PubMed] [Google Scholar]
- 46. Vernikos J, Schneider VS. Space, gravity and the physiology of aging: parallel or convergent disciplines? A mini‐review. Gerontology. 2010;56:157–166. doi: 10.1159/000252852 [DOI] [PubMed] [Google Scholar]
- 47. Koch LG, Britton SL. Theoretical and biological evaluation of the link between low exercise capacity and disease risk. Cold Spring Harb Perspect Med. 2018;8: doi: 10.1101/cshperspect.a029868 [DOI] [PMC free article] [PubMed] [Google Scholar]
- 48. Booth FW, Roberts CK, Laye MJ. Lack of exercise is a major cause of chronic diseases. Compr Physiol. 2012;2:1143–1211. doi: 10.1002/cphy.c110025 [DOI] [PMC free article] [PubMed] [Google Scholar]
- 49. Lavie CJ, Ozemek C, Carbone S, Katzmarzyk PT, Blair SN. Sedentary behavior, exercise, and cardiovascular health. Circ Res. 2019;124:799–815. doi: 10.1161/CIRCRESAHA.118.312669 [DOI] [PubMed] [Google Scholar]
- 50. Ogawa T, Spina RJ, Martin WH 3rd, Kohrt WM, Schechtman KB, Holloszy JO, Ehsani AA. Effects of aging, sex, and physical training on cardiovascular responses to exercise. Circulation. 1992;86:494–503. [DOI] [PubMed] [Google Scholar]
- 51. Dehn MM, Bruce RA. Longitudinal variations in maximal oxygen intake with age and activity. Journal of applied physiology. 1972;33:805–807. [DOI] [PubMed] [Google Scholar]
- 52. Cruz‐Jentoft AJ, Baeyens JP, Bauer JM, Boirie Y, Cederholm T, Landi F, Martin FC, Michel J‐P, Rolland Y, Schneider SM, et al. Sarcopenia: European consensus on definition and diagnosis: report of the European Working Group on Sarcopenia in Older People. Age Ageing. 2010;39:412–423. doi: 10.1093/ageing/afq034 [DOI] [PMC free article] [PubMed] [Google Scholar]
- 53. Woo J. Sarcopenia. Clin Geriatr Med. 2017;33:305–314. doi: 10.1016/j.cger.2017.02.003 [DOI] [PubMed] [Google Scholar]
- 54. Fleg JL, Morrell CH, Bos AG, Brant LJ, Talbot LA, Wright JG, Lakatta EG. Accelerated longitudinal decline of aerobic capacity in healthy older adults. Circulation. 2005;112:674–682. doi: 10.1161/CIRCULATIONAHA.105.545459 [DOI] [PubMed] [Google Scholar]
- 55. Eveleth PB. Physical status: the use and interpretation of anthropometry. Report of a WHO expert committee. Am J Hum Biol. 1996;8:786–787. doi: [DOI] [Google Scholar]
- 56. Levey AS, Stevens LA, Schmid CH, Zhang Y(, Castro AF, Feldman HI, Kusek JW, Eggers P, Van Lente F, Greene T, et al. A new equation to estimate glomerular filtration rate. Ann Intern Med. 2009;150:604. doi: 10.7326/0003-4819-150-9-200905050-00006 [DOI] [PMC free article] [PubMed] [Google Scholar]
- 57. Sauer BC, Brookhart MA, Roy J, VanderWeele T. A review of covariate selection for non‐experimental comparative effectiveness research. Pharmacoepidemiol Drug Saf. 2013;22:1139–1145. doi: 10.1002/pds.3506 [DOI] [PMC free article] [PubMed] [Google Scholar]
Associated Data
This section collects any data citations, data availability statements, or supplementary materials included in this article.