

Abstract
Background
Despite advances in cardiovascular disease and risk factor management, mortality from ischemic heart failure (HF) in patients with coronary artery disease (CAD) remains high. Given the partial role of genetics in HF and lack of reliable risk stratification tools, we developed and validated a polygenic risk score for HF in patients with CAD, which we term HF‐PRS.
Methods and Results
Using summary statistics from a recent genome‐wide association study for HF, we developed candidate PRSs in the Mount Sinai BioMe CAD patient cohort (N=6274) by using the pruning and thresholding method and LDPred. We validated the best score in the Penn Medicine BioBank (N=7250) and performed a subgroup analysis in a high‐risk cohort who had undergone coronary catheterization. We observed a significant association between HF‐PRS score and ischemic HF even after adjusting for evidence of obstructive CAD in patients of European ancestry in both BioMe (odds ratio [OR], 1.14 per SD; 95% CI, 1.05–1.24; P=0.003) and Penn Medicine BioBank (OR, 1.07 per SD; 95% CI, 1.01–1.13; P=0.016). In European patients with CAD in Penn Medicine BioBank who had undergone coronary catheterization, individuals in the top 10th percentile of PRS had a 2‐fold increased odds of ischemic HF (OR, 2.0; 95% CI, 1.1–3.7; P=0.02) compared with the bottom 10th percentile.
Conclusions
A PRS for HF enables risk stratification in patients with CAD. Future prospective studies aimed at demonstrating clinical utility are warranted for adoption in the patient setting.
Keywords: genomics, heart failure, personalized medicine, polygenic risk score
Subject Categories: Heart Failure
Nonstandard Abbreviations and Acronyms
- iHF
ischemic heart failure
- ob‐CAD
obstructive coronary artery disease
- PC
principal component
- PMBB
Penn Medicine BioBank
- PRS
polygenic risk score
Clinical Perspective
What Is New?
This is the first validated polygenic risk score that risk stratifies patients with coronary artery disease for risk of heart failure.
The polygenic risk score associates with heart failure after adjusting for evidence of obstructive coronary artery disease on coronary catheterization.
What Are the Clinical Implications?
A heart failure polygenic risk score may help risk stratify patients with coronary artery disease and impact clinical decision making after appropriate prospective longitudinal studies.
Despite improvements in cardiovascular prognosis, 5‐year mortality from ischemic heart failure (iHF) in coronary artery disease (CAD) is 50%. 1 Because CAD is partially attributable to genetic factors and the genetic heritability of heart failure (HF) is estimated to be 34%, 2 it is likely that genetic risk is a predictor of development of iHF.
A polygenic risk score (PRS) sums the cumulative weighted contribution of many common genetic variants across the entire genome as a single risk score. Various PRSs have been developed as a marker of genetic predisposition of complex diseases with varied heritability, such as schizophrenia, 3 , 4 urinary tract stones, 5 and CAD. 6 Notably, recent work has elucidated the potential role of a CAD PRS for risk stratification beyond contemporary clinical guidelines. 7 However, there are currently no studies assessing the polygenic contribution to the development of iHF in patients with CAD. Given the paucity of reliable risk prediction tools for incident HF secondary to CAD, a score that incorporates genetic variants provides an orthogonal risk factor to clinical criteria and thus may fill an unmet need.
We aimed to develop a PRS for iHF in a multiethnic biobank from a quaternary care integrated health system and validate it in an external cohort. Because individuals with a high polygenic risk burden carry this risk factor throughout life, a PRS may also be used to guide patient management before the onset of clinical disease, thus enabling the early diagnosis, screening, and potentially prevention of HF in a subset of genetically predisposed individuals.
Methods
The data that support the findings of this study are available from the corresponding author on reasonable request. All clinical and genetic data were collected with approval from the Institutional Review Board with patient consent at each institution.
Identification of Cases
Clinical and demographic data were extracted from an institutional electronic health record database. We identified iHF cases as patients with a diagnosis code for HF with a previous diagnosis of CAD using diagnostic codes for CAD and HF (Table S1). We also identified individuals with evidence of obstructive CAD (ob‐CAD) on coronary catheterization. Ob‐CAD was defined as the presence of ≥50% stenosis in the left main coronary artery or ≥70% stenosis in the left anterior descending, circumflex, or right coronary artery. Individuals who did not undergo coronary catheterization were assumed to not have ob‐CAD.
Derivation of PRSs
PRSs measure the cumulative impact of multiple genetic variants on disease risk. For each individual, scores are computed by taking the sum of the dosage of risk variants weighted by their effect on the disease under consideration.
We derived all PRSs using summary statistics from a recent genome‐wide association study (GWAS) for all‐cause HF. 8 We computed PRSs using both LDpred 9 and the pruning and thresholding method. The LDPred algorithm adjusts effect sizes for linkage disequilibrium (LD). We used the 1000 Genomes 10 European population LD reference panel. The tuning parameter in LDpred is ρ, the assumed proportion of causal single‐nucleotide polymorphisms. We adjusted ρ between 1 (assumes all single‐nucleotide polymorphisms are causal) and 0.001, as done previously. 6 We then computed a polygenic score for each value of ρ using an additive function, such that PRS=∑iSi×Gi, where Si=adjusted β statistics for minor allele and Gi=genotype (0,1, or 2). In the pruning and thresholding method, we varied the P‐value threshold from the discovery GWAS study and the r 2 cutoff, a measure of linkage disequilibrium. P values were varied between 0.000001 and 0.1. R 2 values were varied between 0.2 and 0.8. All scores were computed using the PLINK software package. 11 We then chose an optimal set of parameters by selecting the score that maximized the association with iHF in Mount Sinai BioMe using logistic regression adjusted for age, sex, and 10 genetic principal components (PCs).
BioMe Discovery Cohort
We used the BioMe Biobank at Mount Sinai as the discovery cohort. BioMe is an electronic health records–linked clinical care cohort composed of >60 000 participants from diverse ancestries (African, Hispanic/Latino, European, and Asian ancestries), with accompanying genome‐wide genotyping data for 31 441 participants. Along with the genetic information, BioMe is linked to a wide array of biomedical traits, originating from Mount Sinai’s system‐wide electronic health records. Enrollment of participants is predominantly through ambulatory care practices and is representative of Mount Sinai’s larger patient population. BioMe participants (N=31 441) were genotyped on the Illumina Global Screening Array platform. Quality control and imputation of the Global Screening Array data are detailed in Data S1.
Penn Medicine BioBank Validation Cohort
The Penn Medicine BioBank (PMBB) consists of 60 000 patients recruited from clinical sites across the University of Pennsylvania Health System who have provided consent for access to all electronic health records. This study included a subset of 9973 European ancestry and 5423 African ancestry patients who had undergone genotyping. DNA was extracted from peripheral blood samples within PMBB and genotyped in 3 batches on the Illumina Quad Omni SNP Chip by Regeneron, Global Screening Array V1, and Global Screening Array V2 chips. Following sequencing, standard quality control procedures were applied separately to each batch to remove rare and missing variants as well as variants in linkage disequilibrium. Variants with a minor allele frequency of <0.05, a missing rate of >0.05, and a Hardy‐Weinberg P of >10−6 were removed. Furthermore, samples with a genotype missingness of >0.02 were also removed.
Statistical Analysis
For comparison of demographics and clinical characteristics between cases and controls, we applied a Fisher exact test for categorical variables and a Wilcoxon rank‐sum test for continuous variables. PRSs were scaled to have mean 0 and SD 1. For the primary analysis, we associated iHF diagnosis with PRS in individuals with a history of CAD by fitting a logistic regression model, adjusted for age, sex, 10 genetic PCs, history of hypertension and type 2 diabetes, body mass index, history of ob‐CAD, and smoking status. Smoking status was defined as being either a current or former smoker based on survey data available in the electronic health record. All analyses were stratified by genetic ancestry groups and included ancestry‐specific PCs to account for population stratification. To assess the role of PRS in risk stratification in a high‐risk subgroup, we performed a secondary analysis in individuals who had undergone coronary catheterization. In all analyses, statistical significance was determined as P<0.05.
Results
Baseline Characteristics
The overall schema of the study is shown in the Figure.
Figure 1. Derivation and validation of ischemic heart failure polygenic risk score (HF‐PRS).
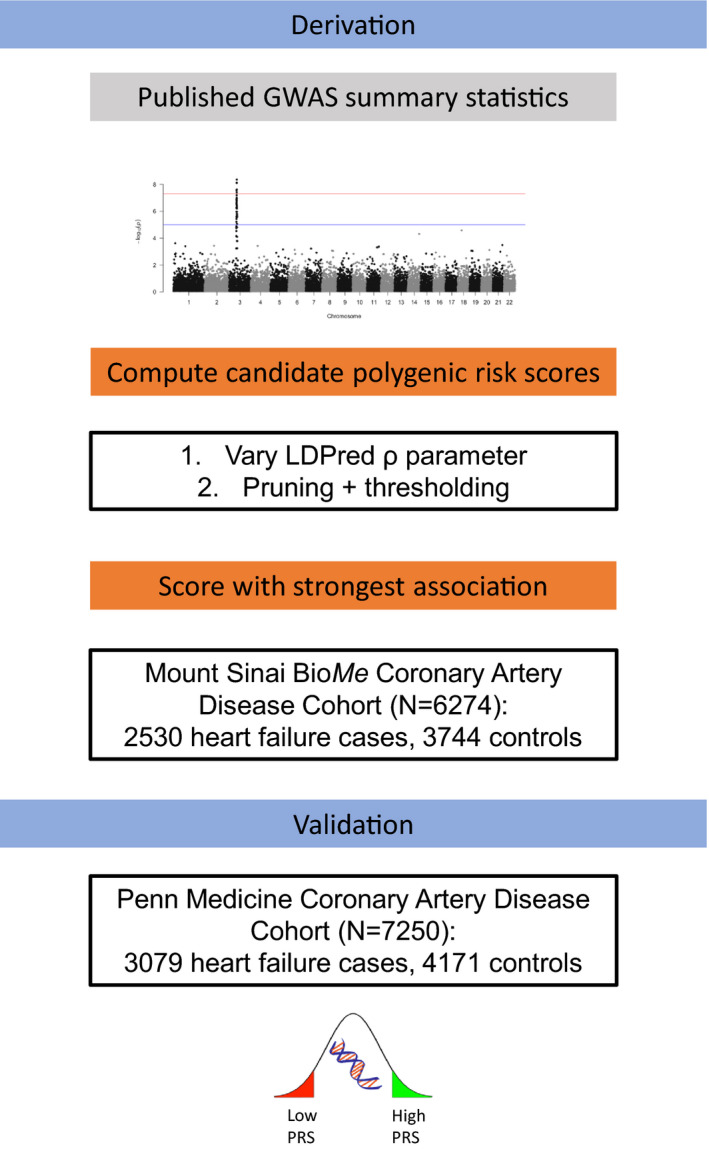
Genome‐wide association study (GWAS) 8 summary statistics were used to derive a candidate PRS using LDPred 9 and a pruning/thresholding method. The optimal PRS was chosen on the basis of degree of association with heart failure in a training data set, Mount Sinai BioMe, and then external validation was performed in Penn Medicine BioBank.
We included patients with a clinical diagnosis of CAD in Mount Sinai BioMe (N=6274) and PMBB (N=7250). Clinical and demographic characteristics are provided in Table 1. In BioMe, we identified 2530 iHF cases and 3744 controls. In BioMe, cases were significantly older (73 versus 71 years; P=0.002), had higher mean body mass index (30 versus 29 kg/m2; P<0.001), had a higher prevalence of hypertension (83% versus 68%; P<0.001) and type 2 diabetes (52% versus 38%; P<0.001), and had higher rates of previous cardiac catheterization (31% versus 26%; P<0.001). Cases were also more often of African genetic ancestry than controls (35% versus 27%; P<0.001).
Table 1.
Baseline Demographic and Clinical Characteristics of iHF Cases and Controls in Mount Sinai BioMe and PMBB
| Characteristic | Mount Sinai BioMe | PMBB | ||||
|---|---|---|---|---|---|---|
| Case (N=2530) | Control (N=3744) | P value | Case (N=3079) | Control (N=4171) | P value | |
| Age, mean (SD), y | 72.6 (12) | 71.8 (11) | 0.002 | 76.1 (11.9) | 71.9 (11.5) | <0.001 |
| BMI, mean (SD), kg/m2 | 29.9 (6.8) | 29 (5.7) | <0.001 | 28.7 (6.2) | 29.3 (6.3) | <0.001 |
| Ancestry, n(%) | ||||||
| Hispanic/Latino | 651 (25.7) | 812 (21.7) | <0.001 | 0 (0) | 0 (0) | |
| African | 890 (35.2) | 1011 (27) | 637 (20.7) | 981 (23.5) | 0.004 | |
| European | 872 (34.5) | 1670 (44.6) | 2442 (79.3) | 3190 (76.5) | 0.004 | |
| South Asian | 92 (3.64) | 202 (5.4) | 0 (0) | 0 (0) | ||
| East Asian | 25 (0.988) | 49 (1.31) | 0 (0) | 0 (0) | ||
| Male sex, n (%) | 1391 (55) | 2040 (54.5) | 0.72 | 2222 (72.2) | 2902 (69.6) | 0.018 |
| Current or former smoker, n (%) | 401 (15.8) | 656 (17.5) | 0.33 | 1937 (62.9) | 2487 (59.6) | <0.001 |
| Underwent coronary catheterization, n (%) | 795 (31.4) | 973 (26) | <0.001 | 678 (22.0) | 767 (18.4) | <0.001 |
| Clinical comorbidities, n (%) | ||||||
| Hypertension | 2105 (83.2) | 2548 (68) | <0.001 | 2823 (91.7) | 3620 (86.8) | <0.001 |
| Type 2 diabetes | 1320 (52.2) | 1406 (37.6) | <0.001 | 1433 (46.5) | 1357 (32.5) | <0.001 |
| Family history of heart failure | 62 (2.5) | 64 (1.7) | <0.001 | NA | NA | NA |
BMI indicates body mass index; iHF, ischemic heart failure; and PMBB, Penn Medicine BioBank.
In the PMBB (Table 1), we observed similar baseline differences in demographics and clinical comorbidities. Cases were significantly older (76 versus 72 years; P<0.001), were more commonly male (72% versus 70%; P=0.018), and had a higher prevalence of hypertension (92% versus 87%; P<0.001) and type 2 diabetes (47% versus 33%; P<0.001).
Derivation of PRS for iHF
We created multiple candidate PRSs using summary statistics from a recent GWAS for iHF in primarily European patients and tested their association with iHF in BioMe. Specifically, we applied the pruning and thresholding method by varying the P value and r 2 parameters and the LDPred algorithm by varying the ρ parameter (Table S2 ). We selected the derivation strategy that maximized the odds ratio (OR) for association. Applying LDPred with ρ=0.001 produced a score (6 214 514 variants) with greatest OR for association with iHF (OR, 1.15; 95% CI, 1.09–1.20) and was used for all downstream analysis.
Association of HF‐PRS With iHF
We tested the association of the HF‐PRS with ischemic failure (iHF) in patients with CAD by fitting a logistic regression model, adjusted for age, sex, 10 genetic PCs, history of hypertension and type 2 diabetes, body mass index, history of ob‐CAD, and smoking. All analyses were stratified by genetic ancestry groups and included ancestry‐specific PCs to account for population stratification. We observed a significant association between HF‐PRS score and iHF, even after adjusting for evidence of ob‐CAD (Table 2) in patients of European ancestry in both BioMe (OR, 1.14 per SD; 95% CI, 1.05–1.24; P=0.003) and PMBB (OR, 1.07 per SD; 95% CI, 1.01–1.13; P=0.016). A spline representation of HF risk for varying PRS percentiles is provided in Figure S1. To estimate absolute risk in patients with CAD, we then derived HF probabilities for the 90th and 10th percentile of PRS, while fixing the other covariates at their mean values in the logistic regression model used above. In BioMe, for the 90th percentile, absolute iHF risk was 44.5%; and for the 10th percentile, absolute iHF risk was 35.0%, implying an absolute risk reduction of 9.5%.
Table 2.
Association of HF‐PRS Score and iHF in Mount Sinai BioMe and PMBB
| Ancestry group | No. of cases | No. of controls | Odds ratio (95% CI) | P value |
|---|---|---|---|---|
| Mount Sinai BioMe | ||||
| African | 890 | 1011 | 1.10 (1.0–1.2) | 0.05 |
| European | 872 | 1670 | 1.14 (1.05–1.24) | 0.003 |
| Hispanic/Latino | 651 | 812 | 1.02 (0.91–1.14) | 0.8 |
| South Asian | 92 | 202 | 1.05 (0.79–1.39) | 0.8 |
| East Asian | 25 | 49 | 1.07 (0.52–2.2) | 0.9 |
| PMBB | ||||
| African | 918 | 637 | 0.97 (0.88–1.08) | 0.6 |
| European | 2442 | 3190 | 1.07 (1.01–1.13) | 0.02 |
iHF indicates ischemic heart failure; PMBB, Penn Medicine BioBank; and PRS, polygenic risk score.
We also conducted a subgroup analysis in individuals who had undergone coronary catheterization. Among European individuals with CAD in PMBB who had undergone coronary catheterization, individuals in the top 10th percentile of PRS had a 2‐fold increased odds of iHF (OR, 2.0; 95% CI, 1.1–3.7; P=0.02) compared with the bottom 10th percentile (Table 3).
Table 3.
Prevalence and Clinical Impact of a High HF‐PRS Score in Unrelated European Individuals With CAD Who Underwent Coronary Catheterization
| Group | Top 10% of distribution | Top 5% of distribution | Top 1% of distribution | |||
|---|---|---|---|---|---|---|
| Odds ratio (95% CI) | P value | Odds ratio (95% CI) | P value | Odds ratio (95% CI) | P value | |
| Mount Sinai BioMe European (N=651) | 1.3 (0.6–2.7) | 0.4 | 1.4 (0.5–3.4) | 0.5 | 2.3 (0.4–14.0) | 0.3 |
| Penn Medicine Biobank European (N=1170) | 2.0 (1.1–3.7) | 0.02 | 1.9 (0.9–3.7) | 0.09 | 3.1 (0.8–12.7) | 0.1 |
Odds ratios were calculated by comparing those with a high HF‐PRS with those in the bottom 10% of the HF‐PRS distribution using a logistic regression model, adjusted for age, sex, 10 genetic principal components, body mass index, and history of hypertension, obstructive CAD, type 2 diabetes, and smoking. CAD indicates coronary artery disease; iHF, ischemic heart failure; and PRS, polygenic risk score.
We then aimed to assess the impact of a high HF‐PRS score by comparing risk of iHF for individuals with a high HF‐PRS with those with a low HF‐PRS, adjusted for age, sex, 10 genetic PCs, body mass index, history of hypertension, ob‐CAD, and type 2 diabetes, and smoking. In BioMe, European individuals with a HF‐PRS in the top 10th percentile had a 1.5‐fold increased risk of iHF (Table 4) compared with those with an HF‐PRS in the bottom 10th percentile. In PMBB, European individuals in the top 10% had a 1.3‐fold increased risk of iHF (Table 4) compared with those in the bottom 10th percentile. Association of iHF with HF‐PRS percentiles for other ancestral groups are provided in Table S3.
Table 4.
Prevalence and Clinical Impact of a High HF‐PRS Score in Unrelated European Individuals With CAD
| Group (percentile) | No. of cases | No. of controls | Prevalence, % | Odds ratio (95% CI) | P value |
|---|---|---|---|---|---|
| Mount Sinai BioMe European | |||||
| Top 5% of distribution | 65 | 77 | 46 | 1.9 (1.2–3.0) | 0.009 |
| Top 10% of distribution | 121 | 163 | 43 | 1.5 (1.1–2.3) | 0.03 |
| Penn Medicine Biobank European | |||||
| Top 5% of distribution | 159 | 204 | 44 | 1.3 (0.97–1.8) | 0.08 |
| Top 10% of distribution | 311 | 415 | 43 | 1.3 (1.0–1.7) | 0.048 |
Odds ratios were calculated by comparing those with a high HF‐PRS score with those in the bottom 10% of the HF‐PRS distribution using a logistic regression model, adjusted for age, sex, 10 genetic principal components, body mass index, and history of hypertension, obstructive CAD, type 2 diabetes, and smoking. CAD indicates coronary artery disease; iHF, ischemic heart failure; and PRS, polygenic risk score.
Discussion
Previous work has consistently identified the role of a PRS in risk stratification in CAD. 6 In this study, we developed a PRS for HF secondary to CAD. More important, because coronary artery occlusion is a significant clinical risk factor for HF, 12 , 13 we adjusted all analyses for evidence of ob‐CAD, as determined by coronary catheterization. We show several key findings. Compared with the bottom 10th percentile, European patients with CAD with an HF‐PRS score in the top 10th percentile have a 1.5‐fold increased odds of developing HF in BioMe and a 1.3‐fold increased odds in an external validation cohort, PMBB. We observed a stronger effect (OR, 2.0) in high‐risk individuals who had undergone coronary catheterization. This effect was stronger in PMBB than in BioMe. One potential reason for this stronger association may be differences in recruitment strategies (recruitment from cardiovascular clinics in PMBB versus from general medicine clinics in BioMe) and indication for coronary catheterization. If patients underwent coronary catheterization for a wider range of indications in PMBB than BioMe, there may be a greater range of ischemic heart disease in the PMBB cohort and thus the PRS would allow greater risk discrimination. However, we do not have information on the indication for coronary catheterization. This difference in effect size also demonstrates the need for cohort‐specific model development because baseline risk may differ depending on medical comorbidities and nongenetic contributions. When applying the PRS in a clinical setting, the absolute risk difference is dependent on the overall HF prevalence. We restricted our cohort to only patients with CAD, a relatively high‐risk population. In this group of patients, our overall HF prevalence was 40%. However, in another large population‐level cohort, UK Biobank, the prevalence of HF within patients with CAD was 17%. 8 Because the UK Biobank cohort is composed of relatively healthy individuals with fewer comorbidities, the absolute risk difference may be smaller.
We observed the strongest effect sizes in individuals of European ancestry and were only able to replicate the association in individuals of African ancestry in BioMe data and not PMBB data. The GWAS from which our PRS was derived was performed in a European cohort and likely includes several ancestry informative markers. Because putative causative markers may be different across ancestral populations and transferability is limited for polygenic conditions, 14 application of summary statistics from a GWAS performed in European individuals may not be ideal.
Our work provides preliminary evidence of the role of a genome‐wide genetic risk score in risk stratification of HF in patients with CAD. Current risk stratification tools only provide prognostic information after the onset of HF rather than determination of HF risk in high‐risk patients with CAD. Thus, knowledge of genetic predisposition of HF may help fill an unmet clinical need. Because genetic risk is a nonmodifiable risk factor, a PRS may be measured at any point during a patient’s lifetime and thus may be applicable before the onset of CAD. In addition, as more information on modifiable risk factors, such as diet, lifestyle, and other medical comorbidities, is collected for large cohorts, future work may allow for communication of absolute HF risk rather than relative risk. Absolute HF risk is a function of not only genetic factors, such as the PRS presented in our work, but also modifiable factors that may increase or decrease genetic predisposition. For example, recent work from Khera et al demonstrated that adherence to a healthy lifestyle decreased the risk of coronary events by 46% in a group of patients with high polygenic risk for CAD. 15
Our study should be interpreted in light of several limitations. First, given the retrospective nature of the study, coronary catheterization was only performed in a subset of individuals as clinically indicated. Next, similar to previous work in which PRS associates with disease risk more strongly in European than non‐European ancestries, 16 , 17 , 18 , 19 , 20 our PRS was not significantly associated with iHF diagnosis in non‐European ancestral groups. Thus, because of the paucity of GWAS studies performed in non‐European populations, our PRS is applicable only in individuals of European ancestry. However, our results demonstrate the potential utility of a genetic risk score in stratifying HF risk in a high‐risk population with CAD, and future ancestry‐specific GWAS may make this method broadly applicable.
Future work may aim to apply more sophisticated feature engineering to improve the PRS generation process. The HF‐PRS we report is a linear combination of LDPred‐adjusted effect sizes. However, using feature selection methods, such as regularization and a nonlinear transformation of input features, may provide greater discriminative ability.
In addition, we aim to apply the HF‐PRS as a clinical risk stratification tool and determine its utility in conjunction with appropriate clinical assessment. Because HF is a clinical diagnosis with no established screening guidelines, our tool may be used to identify patients with CAD genetically predisposed to progress to HF and thus require close monitoring, assessment of structural abnormalities, and lifestyle modifications. This remains a testable hypothesis in a prospective randomized study. In addition, the HF‐PRS may serve as a nonmodifiable risk factor that can be combined with modifiable risk factors, such as medication compliance, diet, and exercise, in a multivariate model. Large prospective cohort studies with paired genotyping and regular survey data will enable such a study.
Sources of Funding
Dr Nadkarni is supported by a career development award from the National Institutes of Health (K23DK107908) and is also supported by R01DK108803, U01HG007278, U01HG009610, and 1U01DK116100. Dr Do is supported by R35GM124836 from the National Institute of General Medical Sciences of the National Institutes of Health and R01HL139865 from the National Heart, Lung, and Blood Institute of the National Institutes of Health and previously an American Heart Association Cardiovascular Genome‐Phenome Discovery grant (15CVGPSD27130014).
Disclosures
Dr Nadkarni receives financial compensation as consultant and advisory board member for RenalytixAI, Inc, and owns equity in RenalytixAI. Dr Nadkarni is a scientific cofounder of RenalytixAI. Dr Nadkarni has received operational funding from Goldfinch Bio and consulting fees from BioVie Inc and GLG consulting in the past 3 years. The remaining authors have no disclosures to report.
Supporting information
Appendix
Data S1
Table S1–S3
Figure S1
Supplementary Material for this article is available at https://www.ahajournals.org/doi/suppl/10.1161/JAHA.121.021916
For Sources of Funding and Disclosures, see pages 6 and 7.
References
- 1. Taylor CJ, Ordóñez‐Mena JM, Roalfe AK, Lay‐Flurrie S, Jones NR, Marshall T, Hobbs FDR. Trends in survival after a diagnosis of heart failure in the United Kingdom 2000–2017: population based cohort study. BMJ. 2019;364:I223. doi: 10.1136/bmj.l223 [DOI] [PMC free article] [PubMed] [Google Scholar]
- 2. Lindgren MP, PirouziFard MN, Gustav Smith J, Sundquist J, Sundquist K, Zöller B. A Swedish nationwide adoption study of the heritability of heart failure. JAMA Cardiol. 2018;3:703–710. doi: 10.1001/jamacardio.2018.1919 [DOI] [PMC free article] [PubMed] [Google Scholar]
- 3. Vassos E, Di Forti M, Coleman J, Iyegbe C, Prata D, Euesden J, O’Reilly P, Curtis C, Kolliakou A, Patel H, et al. An examination of polygenic score risk prediction in individuals with first‐episode psychosis. Biol Psychiatry. 2017;81:470–477. doi: 10.1016/j.biopsych.2016.06.028 [DOI] [PubMed] [Google Scholar]
- 4. Shafee R, Nanda P, Padmanabhan JL, Tandon N, Alliey‐Rodriguez N, Kalapurakkel S, Weiner DJ, Gur RE, Keefe RSE, Hill SK, et al. Polygenic risk for schizophrenia and measured domains of cognition in individuals with psychosis and controls. Transl Psychiatry. 2018;8:78. doi: 10.1038/s41398-018-0124-8 [DOI] [PMC free article] [PubMed] [Google Scholar]
- 5. Paranjpe I, Tsao N, Judy R, Paranjpe M, Chaudhary K, Klarin D, Forrest I, O’Hagan R, Kapoor A, Pfail J, et al. Derivation and validation of genome wide polygenic score for urinary tract stone diagnosis. Kidney Int. 2020;98:1323–1330. doi: 10.1016/j.kint.2020.04.055 [DOI] [PMC free article] [PubMed] [Google Scholar]
- 6. Khera AV, Chaffin M, Aragam KG, Haas ME, Roselli C, Choi SH, Natarajan P, Lander ES, Lubitz SA, Ellinor PT, et al. Genome‐wide polygenic scores for common diseases identify individuals with risk equivalent to monogenic mutations. Nat Genet. 2018;50:1219–1224. doi: 10.1038/s41588-018-0183-z [DOI] [PMC free article] [PubMed] [Google Scholar]
- 7. Aragam KG, Dobbyn A, Judy R, Chaffin M, Chaudhary K, Hindy G, Cagan A, Finneran P, Weng L‐C, Loos RJF, et al. Limitations of contemporary guidelines for managing patients at high genetic risk of coronary artery disease. J Am Coll Cardiol. 2020;75:2769–2780. doi: 10.1016/j.jacc.2020.04.027 [DOI] [PMC free article] [PubMed] [Google Scholar]
- 8. Aragam KG, Chaffin M, Levinson RT, McDermott G, Choi SH, Shoemaker MB, Haas ME, Weng L‐C, Lindsay ME, Smith JG, et al. Phenotypic refinement of heart failure in a national biobank facilitates genetic discovery. Circulation. 2019;139:489–501. doi: 10.1161/CIRCULATIONAHA.118.035774 [DOI] [PMC free article] [PubMed] [Google Scholar]
- 9. Vilhjálmsson B, Yang J, Finucane H, Gusev A, Lindström S, Ripke S, Genovese G, Loh P‐R, Bhatia G, Do R, et al. Modeling linkage disequilibrium increases accuracy of polygenic risk scores. Am J Hum Genet. 2015;97:576–592. doi: 10.1016/j.ajhg.2015.09.001 [DOI] [PMC free article] [PubMed] [Google Scholar]
- 10. Auton A, Abecasis GR, Altshuler DM, Durbin RM, Abecasis GR, Bentley DR, Chakravarti A, Clark AG, Donnelly P, Eichler EE, et al. A global reference for human genetic variation. Nature. 2015;526:68–74. doi: 10.1038/nature15393 [DOI] [PMC free article] [PubMed] [Google Scholar]
- 11. Purcell S, Neale B, Todd‐Brown K, Thomas L, Ferreira MAR, Bender D, Maller J, Sklar P, de Bakker PIW, Daly MJ, et al. PLINK: a tool set for whole‐genome association and population‐based linkage analyses. Am J Hum Genet. 2007;81:559–575. doi: 10.1086/519795 [DOI] [PMC free article] [PubMed] [Google Scholar]
- 12. Gheorghiade M, Sopko G, De Luca L, Velazquez EJ, Parker JD, Binkley PF, Sadowski Z, Golba KS, Prior DL, Rouleau JL, et al. Navigating the crossroads of coronary artery disease and heart failure. Circulation. 2006;114:1202–1213. doi: 10.1161/CIRCULATIONAHA.106.623199 [DOI] [PubMed] [Google Scholar]
- 13. Gheorghiade M, Bonow RO. Chronic heart failure in the United States: a manifestation of coronary artery disease. Circulation. 1998;97:282–289. doi: 10.1161/01.CIR.97.3.282 [DOI] [PubMed] [Google Scholar]
- 14. Sirugo G, Williams SM, Tishkoff SA. The missing diversity in human genetic studies. Cell. 2019;177:26–31. doi: 10.1016/j.cell.2019.02.048 [DOI] [PMC free article] [PubMed] [Google Scholar]
- 15. Khera AV, Emdin CA, Drake I, Natarajan P, Bick AG, Cook NR, Chasman DI, Baber U, Mehran R, Rader DJ, et al. Genetic risk, adherence to a healthy lifestyle, and coronary disease. N Engl J Med. 2016;375:2349–2358. doi: 10.1056/NEJMoa1605086 [DOI] [PMC free article] [PubMed] [Google Scholar]
- 16. Ripke S, Neale BM, Corvin A, Walters JTR, Farh KH, Holmans PA, Lee P, Bulik‐Sullivan B, Collier DA, Huang H, et al; Schizophrenia Working Group of the Psychiatric Genomics Consortium . Biological insights from 108 schizophrenia‐associated genetic loci. Nature. 2014;511:421–427. doi: 10.1038/nature13595 [DOI] [PMC free article] [PubMed] [Google Scholar]
- 17. Belsky DW, Moffitt TE, Sugden K, Williams B, Houts R, McCarthy J, Caspi A. Development and evaluation of a genetic risk score for obesity. Biodemography Soc Biol. 2013;59:85–100. doi: 10.1080/19485565.2013.774628 [DOI] [PMC free article] [PubMed] [Google Scholar]
- 18. Domingue B, Belsky D, Conley D, Harris KM, Boardman J. Polygenic influence on educational attainment: new evidence from the national longitudinal study of adolescent to adult health. AERA Open. 2015;1:2332858415599972. doi: 10.1177/2332858415599972 [DOI] [PMC free article] [PubMed] [Google Scholar]
- 19. Lee JJ, Wedow R, Okbay A, Kong E, Maghzian O, Zacher M, Nguyen‐Viet TA, Bowers P, Sidorenko J, Karlsson Linnér R, et al. Gene discovery and polygenic prediction from a genome‐wide association study of educational attainment in 1.1 million individuals. Nat Genet. 2018;50:1112–1121. doi: 10.1038/s41588-018-0147-3 [DOI] [PMC free article] [PubMed] [Google Scholar]
- 20. Li Z, Chen J, Yu H, He L, Xu Y, Zhang D, Yi Q, Li C, Li X, Shen J, et al. Genome‐wide association analysis identifies 30 new susceptibility loci for schizophrenia. Nat Genet. 2017;49:1576–1583. doi: 10.1038/ng.3973 [DOI] [PubMed] [Google Scholar]
Associated Data
This section collects any data citations, data availability statements, or supplementary materials included in this article.
Supplementary Materials
Appendix
Data S1
Table S1–S3
Figure S1