Abstract
Background
Ibrutinib and acalabrutinib are Bruton tyrosine kinase inhibitors used in the treatment of B‐cell lymphoproliferative disorders. Ibrutinib is associated with new‐onset atrial fibrillation. Cases of sinus bradycardia and sinus arrest have also been reported following ibrutinib treatment. Conversely, acalabrutinib is less arrhythmogenic. The basis for these different effects is unclear.
Methods and Results
The effects of ibrutinib and acalabrutinib on atrial electrophysiology were investigated in anesthetized mice using intracardiac electrophysiology, in isolated atrial preparations using high‐resolution optical mapping, and in isolated atrial and sinoatrial node (SAN) myocytes using patch‐clamping. Acute delivery of acalabrutinib did not affect atrial fibrillation susceptibility or other measures of atrial electrophysiology in mice in vivo. Optical mapping demonstrates that ibrutinib dose‐dependently impaired atrial and SAN conduction and slowed beating rate. Acalabrutinib had no effect on atrial and SAN conduction or beating rate. In isolated atrial myocytes, ibrutinib reduced action potential upstroke velocity and Na+ current. In contrast, acalabrutinib had no effects on atrial myocyte upstroke velocity or Na+ current. Both drugs increased action potential duration, but these effects were smaller for acalabrutinib compared with ibrutinib and occurred by different mechanisms. In SAN myocytes, ibrutinib impaired spontaneous action potential firing by inhibiting the delayed rectifier K+ current, while acalabrutinib had no effects on SAN myocyte action potential firing.
Conclusions
Ibrutinib and acalabrutinib have distinct effects on atrial electrophysiology and ion channel function that provide insight into the basis for increased atrial fibrillation susceptibility and SAN dysfunction with ibrutinib, but not with acalabrutinib.
Keywords: acalabrutinib, atrial fibrillation, ibrutinib, ion channels, sinoatrial node
Subject Categories: Atrial Fibrillation, Arrhythmias
Nonstandard Abbreviations and Acronyms
- 4‐AP
4‐aminopyridine
- AP
action potential
- APD
action potential duration
- BTK
Bruton tyrosine kinase
- CaMKII
Ca2+/calmodulin‐dependent kinase II
- CSK
C‐terminal Src kinase
- CV
conduction velocity
- DD
diastolic depolarization
- ICa,L
L‐type Ca2+ current
- IK(tot)
total K+ current
- IKr
rapid delayed rectifier K+ current
- IKur
ultrarapid delayed rectifier K+ current
- INa
Na+ current
- Ito
transient outward K+ current
- MDP
maximum diastolic potential
- OAP
optical
action potential
- RA
right atrial
- SAN
sinoatrial node
- V1/2(act)
voltage for 50% channel activation
- Vmax
upstroke velocity
Clinical Perspective
What Is New?
The Bruton tyrosine kinase inhibitor, ibrutinib, impairs sinoatrial node and atrial conduction by blocking ionic currents in the sinoatrial node (rapid delayed rectifier K+ current) and atria (Na+ current and transient outward K+ current), while a related, second‐generation inhibitor, acalabrutinib, does not affect these currents.
What Are the Clinical Implications?
These findings provide an explanation for the occurrence of atrial fibrillation and sinoatrial node dysfunction in patients receiving ibrutinib, but not acalabrutinib, for the treatment of B‐cell lymphomas.
Ibrutinib, an irreversible inhibitor of Bruton tyrosine kinase (BTK), is an important therapeutic agent used in the treatment of B‐cell lymphoproliferative disorders. 1 , 2 , 3 New‐onset atrial fibrillation (AF) occurs in up to 9% of patients treated with ibrutinib. 3 , 4 , 5 Furthermore, heart rate reductions of ≈6 beats per minute in healthy patients are noted in the ibrutinib product monograph, with both sinus bradycardia and sinus arrest resulting in pacemaker implantation reported in patients receiving ibrutinib. 6 , 7 Acalabrutinib, a more potent and selective second‐generation BTK inhibitor, 8 shows results of AF in only 3% of patients with no reports of bradycardia. 9 These clinical outcomes suggest distinct effects of ibrutinib and acalabrutinib on atrial and sinoatrial node (SAN) function, but the basis for these differences is poorly understood.
We previously demonstrated that acute delivery of ibrutinib (10 mg/kg) increased pacing‐induced AF in mice. 10 This effect was reversible with 24 hours of drug washout even after 14 consecutive days of drug delivery. 10 These observations suggest that an acute reversible electrophysiological effect contributes to ibrutinib‐related AF, consistent with the clinical observation that discontinuation or dose reduction of ibrutinib can prevent AF recurrence. 11
AF can result from the interaction of triggers and a susceptible substrate for initiation and maintenance of the arrhythmia. 12 , 13 Typically, early ectopic beats will trigger AF upon encountering substrates of structural heterogeneities, altered refractoriness, or abnormal impulse conduction. These factors can promote reentry, leading to AF maintenance.
Alterations in atrial action potential (AP) morphology can cause conduction slowing and lead to triggered activity resulting in AF. 13 Specifically, the upstroke of the atrial AP (upstroke velocity [Vmax]) is determined by the inward Na+ current (INa, carried by NaV1.5 channels) and is a major determinant of conduction velocity (CV). 12 Repolarization relies on the balance between inward L‐type Ca2+ current (ICa,L, carried by CaV1.2 and CaV1.3 channels) and several outward K+ currents including the transient outward K+ current (Ito, carried by KV4.2/4.3 channels), the ultrarapid delayed rectifier K+ current (IKur, carried by KV1.5 channels), a steady‐state K+ current (carried by KV2.1 channels), and, depending on species and location, rapid (IKr) and slow (IKs) components of the delayed rectifier K+ current. 12 , 14 , 15 The inward rectifier K+ current also contributes to repolarization as well as maintenance of the resting membrane potential. 14 Alterations in repolarization can affect AP duration (APD), which can be proarrhythmic by causing conduction block or triggered activity. 12
Heart rate is determined by the automaticity of the SAN. 16 , 17 Specifically, SAN myocytes generate spontaneous APs in association with a diastolic depolarization (DD) between successive APs. A number of ion channels contribute to the generation of spontaneous APs, including the hyperpolarization activated current (carried by HCN4) and ICa,L, which each affect the slope of the DD, as well as IKr, which affects repolarization, maximum diastolic potential (MDP), and ability to generate a DD. 16 , 18
The goal of this study was to investigate the effects of ibrutinib and acalabrutinib on atrial and SAN electrophysiology and arrhythmogenesis. We demonstrate that these drugs have distinct effects on atrial and SAN conduction, ion channel function in atrial and SAN myocytes, and AF susceptibility in vivo. These findings provide an explanation for the distinct clinical outcomes of ibrutinib compared with acalabrutinib.
Methods
The data from this study and the materials used are available from the corresponding author upon reasonable request.
Mice
This study was conducted using male C57BL/6 mice between the ages of 8 and 15 weeks. All experimental procedures were approved by the Animal Care and Use Committees of the University of Calgary and Western University and were in accordance with the guidelines of the Canadian Council on Animal Care.
In Vivo Electrophysiology and Arrhythmia Studies
Mice received an acute dose of either acalabrutinib (10 mg/kg) or vehicle (trappsol) by oral gavage followed by an intracardiac electrophysiology study 90 minutes after drug delivery. This dose was selected to directly compare with previous studies demonstrating that similar, clinically relevant doses of ibrutinib lead to pacing‐induced AF. 10 This dose of acalabrutinib would yield higher serum concentrations compared with ibrutinib, 19 ensuring that any effects on AF would be identified. Acalabrutinib was solubilized in trappsol dissolved in distilled water and delivered by oral gavage in a single dose. Intracardiac studies were performed as we have previously described. 10 , 20 Arrhythmia induction used both programmed electrical stimulation and burst pacing (2‐ms pulses at 50 Hz, 400‐ms burst duration) to determine susceptibility to AF (rapid atrial activity lasting >1 second) as well as atrial effective refractory period, ventricular effective refractory period, atrioventricular node effective refractory period, and Wenckebach cycle length. Additional information is available in Data S1.
High‐Resolution Optical Mapping
Activation patterns and electrical conduction in the atria and right atrial (RA) posterior wall (ie, SAN region) were investigated using high‐resolution optical mapping in isolated atrial preparations as previously described. 21 , 22 , 23 Atrial preparations were immobilized using blebbistatin (10 µmol/L). Changes in fluorescence were captured using the voltage‐sensitive dye RH‐237 (15 µmol/L) and a CMOS camera (SciMedia) at 1000 frames per second. Experiments were conducted in sinus rhythm and during pacing at 8 Hz. All experiments were performed at 37 °C. Data were analyzed using custom software written in MATLAB (MathWorks). Further details are available in Data S1.
Patch‐Clamping of Isolated Atrial and SAN Myocytes
RA and SAN myocytes were isolated from mice by enzymatic digestion as we have previously described. 23 , 24 , 25 These myocytes were used to record APs and ionic currents by whole‐cell patch‐clamp at room temperature (21–23 °C). The solutions and experimental protocols for each of these approaches are available in Data S1.
Drug Doses
In optical mapping and patch‐clamp studies, ibrutinib was primarily delivered acutely at concentrations of 0.1 µmol/L or 10 µmol/L. The lower dose (0.1 µmol/L) was used in some experiments to determine whether lower concentrations of ibrutinib produced similar effects to the higher dose. Note that in some experiments in isolated SAN myocytes, ibrutinib was used at an even lower dose of 0.05 µmol/L, which was necessary to observe effects without complete suppression of AP firing. Acalabrutinib was used at concentrations of 10 µmol/L and 50 µmol/L in isolated tissues. The dose of 10 µmol/L was used to directly compare with ibrutinib while the higher dose was used to ensure that an absence of effects at 10 µmol/L was not dose related. These concentrations of ibrutinib and acalabrutinib span a range that is expected to approximate those achieved at the doses used for in vivo studies.
Statistical Analysis
All data are expressed as mean±SEM. Statistical analysis was conducted using Prism version 8.3.1 (Graphpad Software). Data were analyzed using Fisher exact test, paired Student t test, 1‐way repeated measures ANOVA with a Tukey post hoc test, 2‐way repeated measures ANOVA with a Tukey post hoc test, or a mixed effects analysis with a Tukey post hoc test as indicated in the figure legends. Mixed effects analysis was used in instances when a value was missing from a data set, which prevented the use of 1‐way or 2‐way ANOVAs. P<0.05 was considered statistically significant.
Results
Effects of Acalabrutinib on Atrial Electrophysiology In Vivo
Previously, our group showed that acute administration of ibrutinib (10 mg/kg) significantly increases AF susceptibility in mice. 10 To assess whether acalabrutinib had similar effects on AF susceptibility, intracardiac electrophysiology studies were conducted in mice given a single acute dose of acalabrutinib (10 mg/kg) or vehicle control. No AF was observed in any mice (12 given acalabrutinib and 14 given vehicle) (Table and Figure S1). Furthermore, acalabrutinib had no significant effects on other measures of atrial or cardiac electrophysiology including atrial effective refractory period, Wenckebach cycle length, atrioventricular nodal effective refractory period, or ventricular effective refractory period (Table 1). These data indicate that, unlike ibrutinib, acalabrutinib is not associated with increased AF susceptibility.
Table 1.
Intracardiac Electrophysiology in Mice Treated With Acalabrutinib
| Vehicle | Acalabrutinib (10 mg/kg) | P value | |
|---|---|---|---|
| AF | 0/12 | 0/14 | >0.9999 |
| AHERP100, ms | 36.0±2.5 | 36.3±1.7 | 0.819 |
| AMERP100, ms | 27.2±1.8 | 29.1±1.1 | 0.166 |
| WCL, ms | 93.0±2.5 | 90.2±1.5 | 0.515 |
| AVNERP100, ms | 68.8±4.2 | 70.3±3.4 | 0.400 |
| VERP100, ms | 38.3±1.2 | 35.0±2.4 | 0.117 |
Atrial fibrillation (AF) occurrence analyzed by Fisher exact test. All other data analyzed by Student t test; 12 vehicle‐ and 14 acalabrutinib‐treated mice. AHERP indicates high right atrial effective refractory period; AMERP, mid‐right atrial effective refractory period; AVNERP, atrioventricular effective refractory period; VERP, ventricular effective refractory period; and WCL, Wenckebach cycle length.
Effects of Ibrutinib and Acalabrutinib on Atrial Electrophysiology in Isolated Atrial Preparations
Next, we sought to directly assess the effects of ibrutinib and acalabrutinib on atrial electrical conduction patterns and atrial optical AP (OAP) morphology using high‐resolution optical mapping in isolated atrial preparations. Representative activation maps (Figure 1A) and OAPs from the right and left atria (Figure 1B) demonstrate that conduction time across the atria was slowed and OAPs were prolonged following superfusion with ibrutinib. Beating rate in atrial preparations was dose‐dependently reduced in the presence of ibrutinib (0.1 µmol/L and 10 µmol/L). This effect was partially reversible upon washout but remained reduced compared with baseline (Figure 1C). Ibrutinib also dose‐dependently decreased right (Figure 1D) and left (Figure 1E) atrial CV in atrial preparations in sinus rhythm. In addition, ibrutinib dose‐dependently prolonged RA (Figure 1F) and left atrial (Figure 1G) APD, measured at 70% repolarization in atrial preparations in sinus rhythm. The effects of ibrutinib on atrial CV and APD were reversible upon drug washout. The effects of ibrutinib on atrial electrophysiology were also measured in atrial preparations paced at 8 Hz to account for rate‐dependent effects. The effects of ibrutinib on atrial CV and APD in paced preparations were similar to those observed in sinus rhythm (Figure S2).
Figure 1. Effects of ibrutinib and acalabrutinib on atrial electrophysiology.
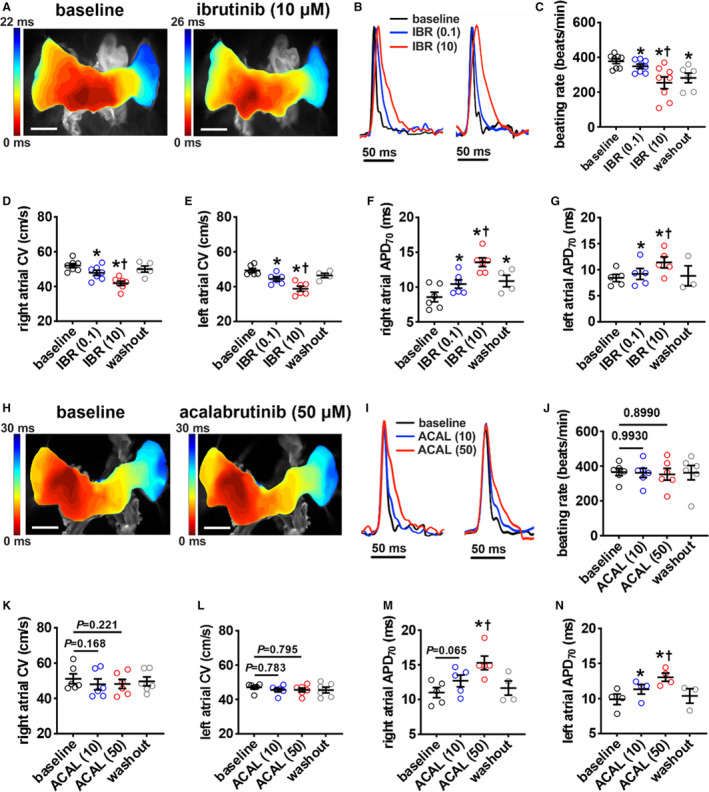
A, Representative activation maps in isolated atrial preparations in sinus rhythm at baseline and after superfusion with 10 µmol/L of ibrutinib. The right atrial (RA) appendage is on the left side of the image. Red indicates the earliest activation time. The color scale indicates total conduction time across the atrial preparation. Scale bar: 2 mm. B, Representative RA (left) and left atrial (right) optical action potentials (OAPs) at baseline and after superfusion with 0.1 µmol/L of ibrutinib (IBR (0.1)) or 10 µmol/L of ibrutinib (IBR (10)). C, Summary of the effects of ibrutinib on beating rate. D and E, Summary of local right (D) and left (E) atrial conduction velocities in sinus rhythm. F and G, Summary of right (F) and left (G) atrial action potential duration at 70% repolarization (APD70) in sinus rhythm. For panels C–G: *P<0.05 vs baseline, † P<0.05 vs IBR (0.1) by mixed effects analysis with a Tukey post hoc test; n=4–7 atria per group. H, Representative activation maps from isolated atrial preparations in sinus rhythm at baseline and after superfusion with 50 µmol/L of acalabrutinib. Scale bar: 2 mm. I, Representative RA (left) and left atrial (right) OAPs at baseline and after superfusion with 10 µmol/L of acalabrutinib (ACAL (10)) or 50 µmol/L of acalabrutinib (ACAL (50)). J, Summary of the effects of acalabrutinib on beating rate. K and L, Summary of local right (K) and left (L) atrial conduction velocities in sinus rhythm. M and N, Summary of right (M) and left (N) atrial APD70 in sinus rhythm. For panels J–N: *P<0.05 vs baseline, † P<0.05 vs ACAL(10) by mixed effects analysis with a Tukey post hoc test; n=4–6 atria per group.
Next, the effects of acalabrutinib on atrial electrophysiology were investigated at doses of 10 µmol/L and 50 µmol/L. In contrast to ibrutinib, representative activation maps (Figure 1H) demonstrate similar conduction patterns and conduction times before and after application of acalabrutinib. Representative OAPs (Figure 1I) show that acalabrutinib resulted in APD prolongation. There were no effects of acalabrutinib on atrial preparation beating rate (Figure 1J). Furthermore, acalabrutinib had no significant effects on right (Figure 1K) or left (Figure 1L) atrial CV in atrial preparations in sinus rhythm at either dose. Nevertheless, APD at 70% repolarization was prolonged in both atria following superfusion of acalabrutinib, particularly at the higher dose (Figure 1M and 1N). The effects of acalabrutinib on atrial CV and APD were similar in atrial preparations paced at 8 Hz (Figure S2).
Effects of Ibrutinib and Acalabrutinib on Atrial Myocyte Electrophysiology
To further investigate the basis for the distinct effects of ibrutinib and acalabrutinib on atrial electrophysiology, AP morphology (Figure 2A) was measured in isolated RA myocytes by patch‐clamping. Ibrutinib (10 μmol/L) had no significant effect on resting membrane potential (Figure 2B) but significantly reduced Vmax and overshoot (Figure 2C and 2D; Table S1). Consistent with optical mapping studies, ibrutinib also prolonged APD throughout repolarization in isolated atrial myocytes (Figure 2E through 2H, Table S1). These effects were reversible upon washout. In contrast, acalabrutinib (10 µmol/L and 50 µmol/L doses) had no significant effects on resting membrane potential, Vmax, or overshoot (Figure 2I through 2L, Table S2). The lower dose of acalabrutinib (10 µmol/L) also had no significant effect on APD; however, it did prolong APD at the higher dose (50 µmol/L) (Figure 2M through 2P, Table S2).
Figure 2. Effects of ibrutinib and acalabrutinib on atrial myocyte action potential (AP) morphology.
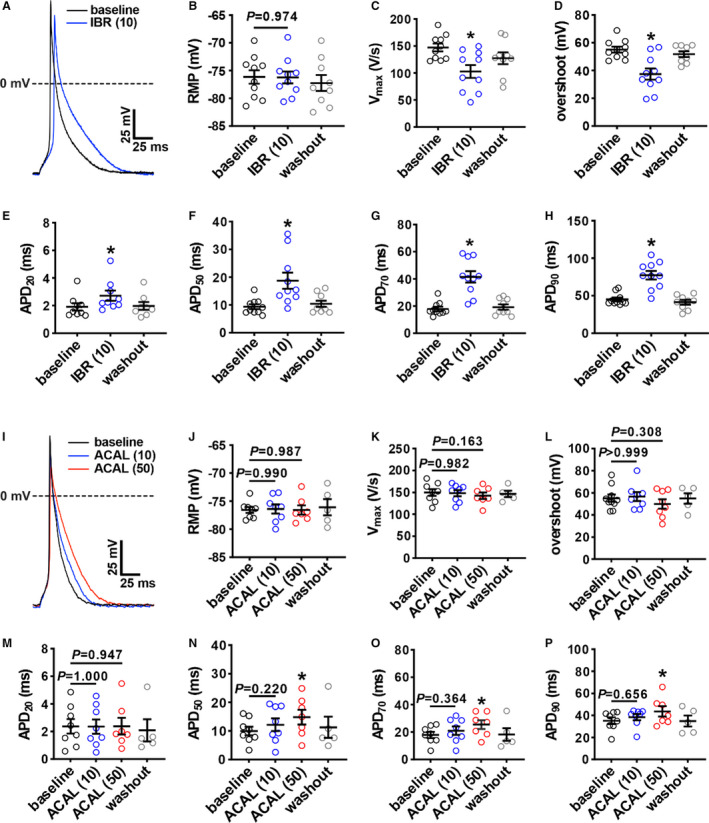
A, Representative stimulated APs in right atrial (RA) myocytes at baseline and after superfusion with 10 µmol/L of ibrutinib (IBR (10)). B through H, Summary of the effects of IBR (10) on RA resting membrane potential (RMP; B), maximum upstroke velocity (Vmax; C), overshoot (D), AP duration (APD) at 20% repolarization (APD20; E), APD at 50% repolarization (APD50; F), APD at 70% repolarization (APD70) (G), and APD at 90% repolarization APD90 (H). For panels B–H: *P<0.05 vs baseline, † P<0.05 vs IBR (10) by mixed effects analysis with a Tukey post hoc test; n=10 RA myocytes from 4 mice. I, Representative stimulated APs in RA myocytes at baseline and after superfusion with 10 µmol/L of acalabrutinib (ACAL (10)) and 50 µmol/L of acalabrutinib (ACAL (50)). J through P, Summary of the effects of ACAL (10) and ACAL (50) on RA RMP (J), Vmax (K), overshoot (L), APD20 (M), APD50 (N), APD70 (O), and APD90 (P). For panels J–P: *P<0.05 vs baseline by mixed‐effects analysis with Tukey post hoc test; n=8 RA myocytes from 6 mice.
To determine the basis for the changes in atrial AP morphology, the effects of ibrutinib and acalabrutinib on ionic currents were investigated. Because ibrutinib reduced AP Vmax in atrial myocytes, we measured INa following acute application of ibrutinib (10 µmol/L; Figure 3A). INa I‐V curves demonstrate that ibrutinib reduced INa density (Figure 3B) in association with a reduction in INa conductance as measured from steady‐state activation curves (Figure 3C). These effects of ibrutinib on INa density and conductance were reversed upon washout. While conductance was reduced, ibrutinib had no significant effects on INa voltage for 50% channel activation (V1/2(act)) (Figure 3D) or slope factor (Figure 3E). Ibrutinib also had no significant effects on INa steady‐state inactivation (Figure 3F through 3H). In contrast, acalabrutinib had no significant effects on INa current density or INa conductance even at the higher 50 µmol/L dose (Figure 4).
Figure 3. Effects of ibrutinib on Na+ current (INa) in right atrial (RA) myocytes.
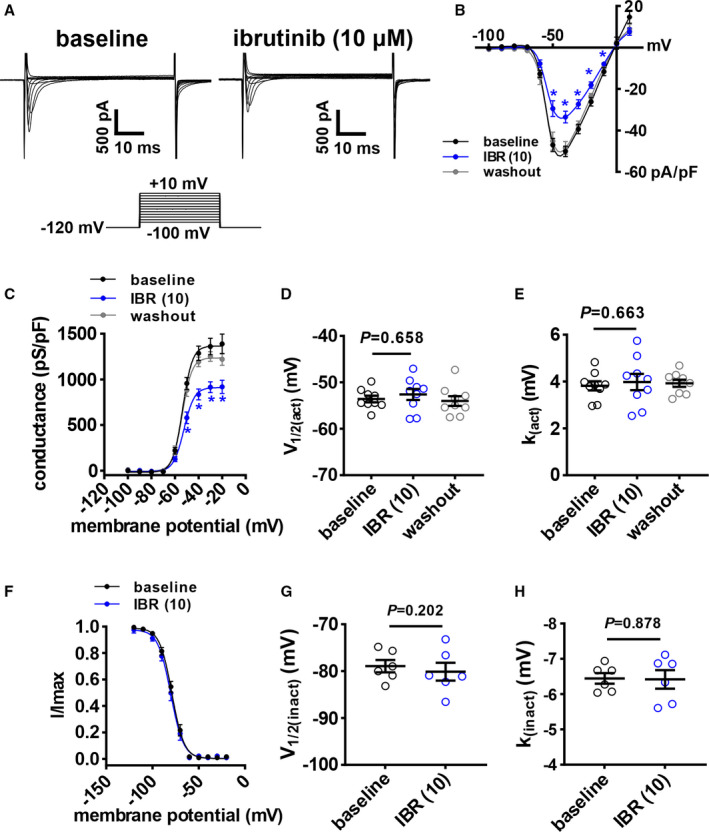
A, Representative RA INa recordings at baseline and after application of 10 µmol/L of ibrutinib (IBR (10)). Voltage clamp protocol shown below recordings. B, RA INa I‐V curves at baseline, after application of IBR (10), and after washout of ibrutinib. C, RA INa activation curves at baseline, after application of IBR (10), and after washout of ibrutinib. D and E, Summary of INa voltage for 50% channel activation (V1/2(act); D) and INa slope factor (k(act); E) at baseline, after application of IBR (10), and after washout of ibrutinib. Panels B and C analyzed by 2‐way repeated measures ANOVA with Tukey post hoc test, data in panels D and E were analyzed by mixed effects analysis with Tukey post hoc test; n=9 RA myocytes from 4 mice. F, RA INa inactivation curves at baseline and after application of IBR (10). G and H, Summary of voltage for INa half‐maximal inactivation (V1/2(inact); G) and INa slope factor (k(inact); H). Data in panel F were analyzed by 2‐way repeated measures ANOVA with Tukey post hoc test; data in panels G and H were analyzed by paired Student t test; n=6 RA myocytes from 3 mice.
Figure 4. Effects of acalabrutinib on Na+ current (INa) in right atrial (RA) myocytes.
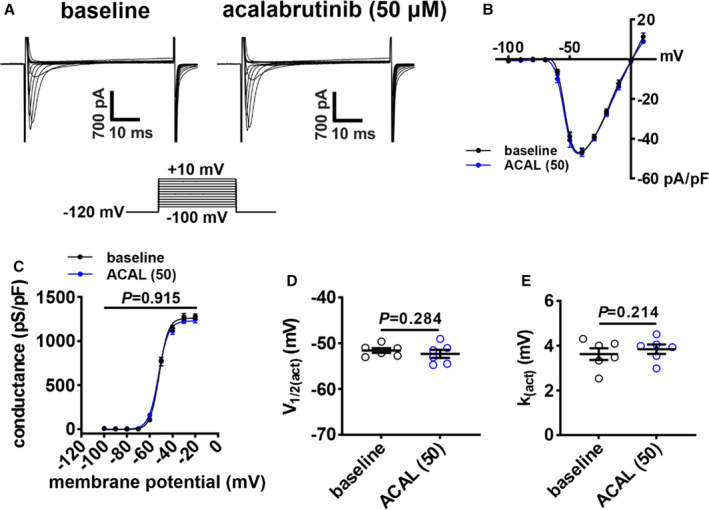
A, Representative RA INa recordings at baseline and after application of 50 µmol/L of acalabrutinib (ACAL (50)). B, RA INa I‐V curves at baseline and after application of ACAL (50). C, RA INa activation curves at baseline and after application of ACAL (50). D and E, Summary of INa voltage for 50% channel activation (V1/2(act); D) and slope factor (k(act); E) at baseline and after application of ACAL (50). Data in panels B and C were analyzed by 2‐way repeated measures ANOVA with a Tukey post hoc text; data in panels D and E were analyzed by paired Student t test; n=6 RA myocytes from 3 mice.
To investigate the basis for APD prolongation, we next measured repolarizing K+ currents between −120 mV and +80 mV using voltage‐clamp protocols with and without a prepulse to inactivate Ito 21 , 22 (Figure 5A). Summary I‐V curves illustrate that ibrutinib (10 µmol/L) reduced peak outward total K+ current (IK(tot)) when recorded with and without a prepulse (Figure 5B and 5C). Furthermore, the difference in current between these 2 recordings demonstrates that ibrutinib reduced Ito (Figure 5D and 5E). These effects were reversible upon washout. The effects of ibrutinib on IKur, measured as the component of IK(tot) sensitive to 4‐aminopyridine (4‐AP), 22 were also assessed by superfusing atrial myocytes with ibrutinib followed by 4‐AP (100 µmol/L) in the presence of ibrutinib (Figure 5F). Ibrutinib reduced outward IK(tot), and subsequent application of 4‐AP had no further effect indicating that ibrutinib inhibited the 4‐AP–sensitive IKur (Figure 5G). Ibrutinib had no significant effects on inward rectifier K+ current as seen at membrane potentials more negative than −80 mV (Figure 5A through 5C).
Figure 5. Effects of ibrutinib on repolarizing K+ currents in right atrial (RA) myocytes.
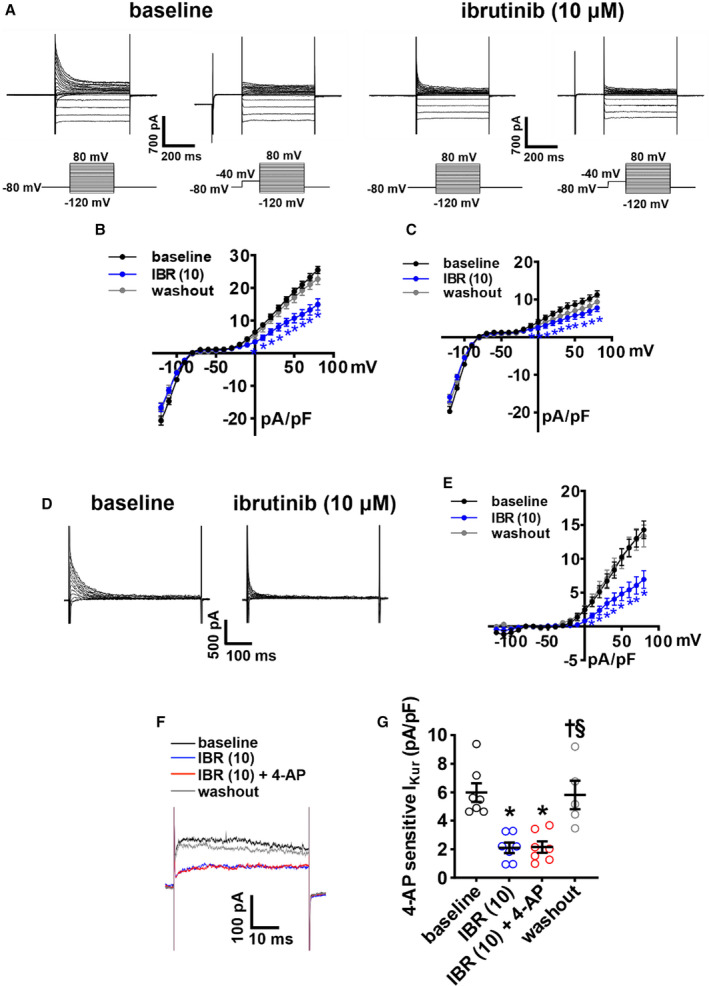
A, Representative RA total K+ current (IK(tot)) recordings, with and without a prepulse (−40 mV) to inactivate transient outward K+ current (Ito), at baseline and after application of 10 µmol/L of ibrutinib (IBR (10)). Voltage clamp protocols shown below recordings. B–C, Summary IK(tot) I‐V curves measured at the peak of the recordings without the prepulse (B) and with the prepulse (C) at baseline, after application of IBR (10) and after washout of IBR. D, Representative Ito recordings at baseline and after application of IBR (10) generated by digital subtraction of peak IK(tot) with and without a prepulse as shown in panel A. E, Ito I‐V curves at baseline, after application of IBR (10), and after washout of IBR. Ito was measured as the difference current between IK(tot) recordings with and without the prepulse. For panels B–E: *P<0.05 vs baseline by mixed effects analysis with Tukey post hoc test; n=8 RA myocytes from 3 mice. F, Representative RA IK(tot) recordings at +30 mV illustrating the effects of IBR (10) and 4‐aminopyridine (4‐AP; 100 µmol/L, inhibits Kv1.5) on IK(tot). G, Summary data illustrating the effects of IBR (10) and 4‐AP on IK(tot). *P<0.05 vs baseline, † P<0.05 vs IBR (10), § P<0.05 vs IBR (10) + 4‐AP by mixed effects analysis with a Tukey post hoc test; n=7 RA myocytes from 3 mice.
Because only 50 μmol/L of acalabrutinib prolonged APD, we also investigated the effects of this dose of acalabrutinib on Ik(tot) (Figure 6A). Summary I‐V curves demonstrate that acalabrutinib reduced peak outward IK(tot) when recorded with and without an inactivating prepulse (Figures 6B and 6C); however, there was no effect of acalabrutinib on Ito (Figure 6D and 6E). Similar to ibrutinib, acalabrutinib reduced the 4‐AP–sensitive IKur in atrial myocytes (Figure 6F). Acalabrutinib had no significant effects on inward rectifier K+ current (Figure 6A and 6B).
Figure 6. Effects of acalabrutinib on repolarizing K+ currents in right atrial (RA) myocytes.
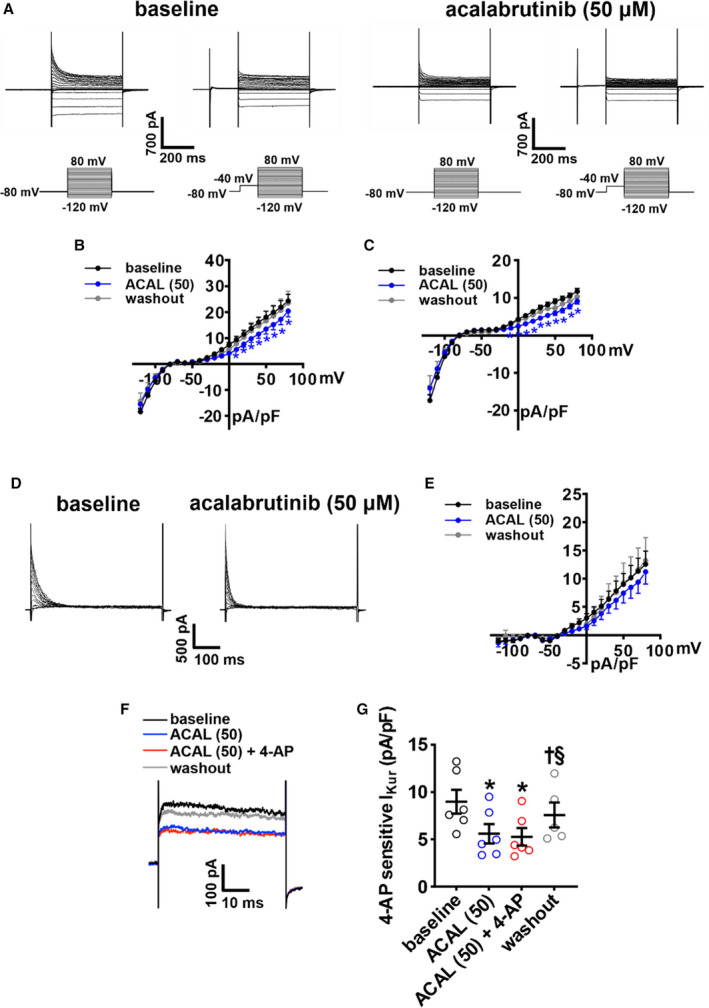
A, Representative RA total K+ current (IK(tot)) recordings, with and without a prepulse to inactivate transient outward K+ current (Ito), at baseline and after application of 50 µmol/L of acalabrutinib (ACAL (50)). Voltage clamp protocols shown below recordings. B through C, Summary IK(tot) I‐V curves measured at the peak of the recordings without the prepulse (B) and with the prepulse (C) at baseline, after application of ACAL (50) and after washout of acalabrutinib. D, Representative Ito recordings at baseline and after application of ACAL (50) generated by digital subtraction of peak IK(tot) with and without a prepulse as shown in panel A. E, Ito I‐V curves at baseline, after application of ACAL (50), and after washout of ACAL. For panels B–E: *P<0.05 vs baseline by mixed effects analysis with a Tukey post hoc test; n=13 RA myocytes from 7 mice. F, Representative RA IK(tot) recordings at +30 mV illustrating the effects of ACAL (50) and 4‐aminopyridine (4‐AP; 100 µmol/L, inhibits Kv1.5) on IK(tot). G, Summary data illustrating the effects of ACAL (50) and 4‐AP on IK(tot). *P<0.05 vs baseline, † P<0.05 vs ACAL (50), § P<0.05 vs ACAL (50) + 4‐AP by mixed effects analysis with a Tukey post hoc test; n=6 RA myocytes from 3 mice.
As APD can also be affected by ICa,L, the effects of ibrutinib (10 µmol/L) on ICa,L in RA myocytes were measured (Figure S3). These data demonstrate that ibrutinib had no significant effects on atrial ICa,L density, ICa,L conductance, or ICa,L steady‐state activation properties (Figure S3).
Effects of Ibrutinib and Acalabrutinib on SAN Electrophysiology in Isolated Atrial Preparations
Given that beating rate in isolated atrial preparations was reduced by ibrutinib, but not acalabrutinib, the effects of both drugs on SAN electrophysiology were further investigated using optical mapping (Figure 7). Activation maps, as well as OAPs from the SAN in the region of the leading activation site and in the adjacent atrial myocardium (first atrial activation adjacent to the CT in the RA free wall) were measured (Figure 7A and 7B). These were used to analyze CV in the SAN region of the RA posterior wall as well as SAN to atrial conduction time. Ibrutinib dose‐dependently reduced CV in the RA posterior wall and increased SAN to atrial conduction time (Figure 7C and 7D). Ibrutinib also increased SAN APD at 50% repolarization (Figure 7E). These effects of ibrutinib were reversible upon washout. In contrast, acalabrutinib had no significant effects on CV, SAN to atrial conduction time, or APD at 50% repolarization in the SAN when applied at doses of 10 µmol/L (to directly compare with the higher dose of ibrutinib) or an even higher dose of 50 µmol/L (Figure 7F through 7J).
Figure 7. Effects of ibrutinib and acalabrutinib on sinoatrial node (SAN) electrophysiology.
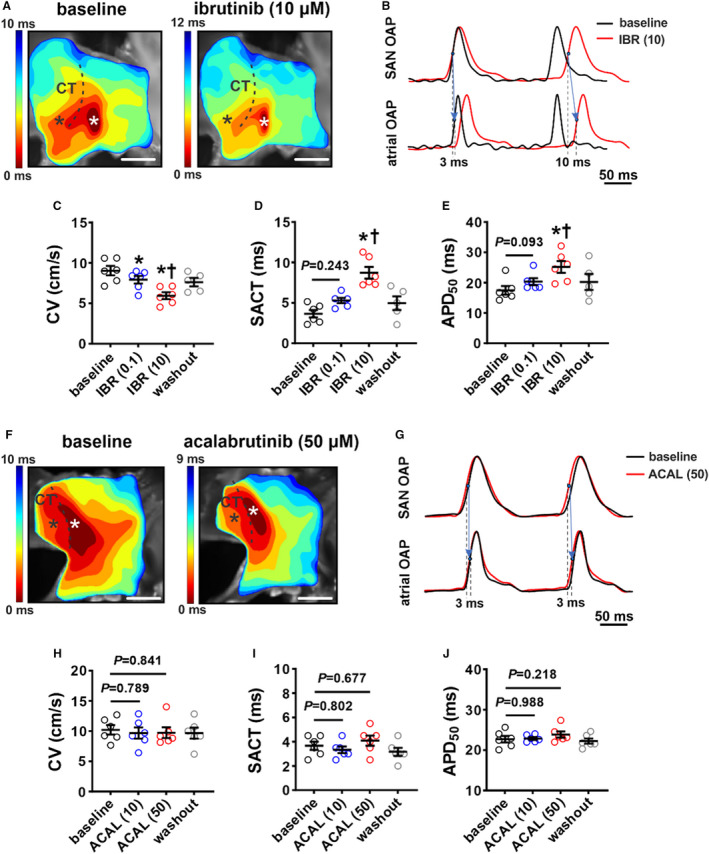
A, Representative activation maps of the right atrial (RA) posterior wall containing the SAN, located adjacent to the crista terminalis (CT) at baseline and after superfusion with 10 µmol/L of ibrutinib (IBR (10)). Red indicates the earliest activation time corresponding to initial activation of the SAN. The color scale indicates total conduction time across the posterior wall. Scale bar: 2 mm. B, Representative optical action potentials (OAPs) from the initial activation site in the SAN region (white asterisk on activation map) and earliest RA activation site (black asterisk on activation map) at baseline and after superfusion with IBR (10). These OAPs were used to quantify SAN to atrial conduction time (SACT). C through E, Summary of the effects of ibrutinib on RA posterior wall conduction velocity (CV; C), SACT (D), and SAN action potential duration at 50% repolarization (APD50; E). For panels C–E: *P<0.05 vs baseline, † P<0.05 vs IBR (0.1) by mixed effects analysis with a Tukey post hoc test; n=5–6 hearts per group. F, Representative activation maps of the SAN region at baseline and after superfusion with 50 µmol/L acalabrutinib. Scale bar: 2mm. G, Representative OAPs from the initial pacemaker site in the SAN region and earliest RA activation site at baseline and after superfusion with 50 µmol/L of acalabrutinib (ACAL (10)). H through J, Summary of the effects of acalabrutinib on RA posterior wall CV (H), SACT (I), and SAN APD50 (J). For panels H–J: *P<0.05 vs baseline, † P<0.05 vs ACAL (10) by 1‐way repeated measures ANOVA with a Tukey post hoc test; n=5 hearts per group.
Effect of Ibrutinib on Isolated SAN Myocyte Electrophysiology
The ability of ibrutinib to decrease beating rate and modulate SAN conduction in isolated atrial preparations indicates direct effects on the SAN. This was further investigated by measuring the effects of ibrutinib on spontaneous APs in isolated SAN myocytes. Strikingly, 10 μmol/L of ibrutinib fully arrested regular spontaneous AP firing in SAN cells in association with a depolarization of the MDP (Figure 8A and 8B). Only low‐amplitude oscillating membrane potentials between −20 mV and −30 mV, which could not be recovered following up to 45 minutes of washout, were seen (Figure 8A). To observe more modest effects on SAN myocytes that did not result in complete suppression of AP firing, it was necessary to use a lower concentration of ibrutinib of 0.05 µmol/L. At this lower dose, ibrutinib reduced SAN myocyte spontaneous AP firing (Figure 8C and 8D) in association with a depolarization of the MDP (Figure 8E), prolongation of APD at 50% repolarization (Figure 8F), and a reduction in DD slope (Figure 8G). Other measures of SAN AP morphology are provided in Table S3. Conversely, acalabrutinib (10 μmol/L) had no significant effects on SAN AP firing or morphology (Figure 8H through 8L, Table S4).
Figure 8. Effects of ibrutinib and acalabrutinib on spontaneous action potential (AP) morphology in isolated sinoatrial node (SAN) myocytes.
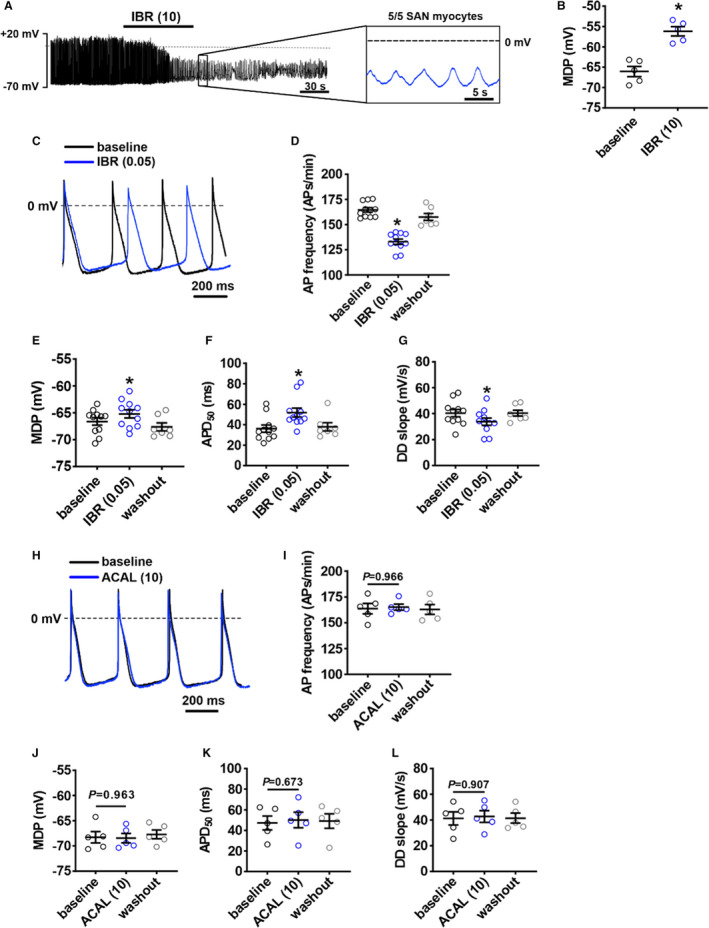
A, Representative spontaneous AP recordings demonstrating that 10 µmol/L of ibrutinib (IBR (10)) fully supresses AP firing in SAN myocytes. Recording is representative of the response in 5 SAN myocytes. B, Summary of the effect of IBR (10) on maximum diastolic potential (MDP) in SAN myocytes. *P<0.05 vs baseline by Student t test; n=5 SAN myocytes from 3 mice. C, Representative spontaneous SAN APs at baseline and after application of 0.05 µmol/L of ibrutinib (IBR (0.05)). D through G, Summary of the effects of IBR (0.05) on SAN AP frequency (D), MDP (E), APD at 50% repolarization (APD50) (F), and diastolic depolarization (DD) slope (G). For panels D–G: *P<0.0001 vs baseline by mixed effects analysis with a Tukey post hoc test; n=11 SAN myocytes from 6 mice. H, Representative spontaneous SAN APs at baseline and after application of 10 µmol/L of acalabrutinib (ACAL (10)). I through L, Summary of the effects of ACAL (10) on SAN AP frequency (I), MDP (J), APD50 (K), and DD slope (L). For panels I–L: data were analyzed by 2‐way repeated measures ANOVA with a Tukey post hoc test; n=5 SAN myocytes from 5 mice.
To determine the basis for the effects of ibrutinib on SAN AP firing frequency, MDP, and APD, we measured repolarizing K+ currents under voltage clamp conditions in isolated SAN myocytes before and after application of ibrutinib (10 μmol/L). Similar to atrial myocytes, summary I‐V curves illustrate that ibrutinib reduced outward IK(tot) in isolated SAN myocytes (Figure S4A and S4B). In contrast, there was no effect of acalabrutinib (10 µmol/L) on outward Ik(tot) in SAN myocytes (Figure S4C and S4D).
IKr plays an essential role in regulating APD, MDP, and AP firing rate in the SAN, including in mice. 26 Thus, the effects of ibrutinib (10 µmol/L) on IKr were measured in SAN myocytes using voltage‐clamp protocols designed to detect IKr tail currents 26 (Figure 9A). Ibrutinib again reduced peak outward IK during the test pulses (measured between −50 mV and +40 mV; Figure 9B). Furthermore, Boltzmann fitting of IKr tail currents (measured at −45 mV) 26 illustrate that ibrutinib reduced IKr density (Figure 9C) in association with a negative shift in the V1/2(act) (Figure 9D). The lower dose of ibrutinib (0.05 µmol/L) had similar effects on IKr in SAN myocytes (Figure S5). In contrast, and consistent with the lack of an effect on APD and Ik(tot), acalabrutinib (10 µmol/L) had no significant effects on IKr in SAN myocytes (Figure 8, 9).
Figure 9. Effects of ibrutinib and acalabrutinib on the rapid delayed rectifier K+ current (IKr) in isolated sinoatrial node (SAN) myocytes.
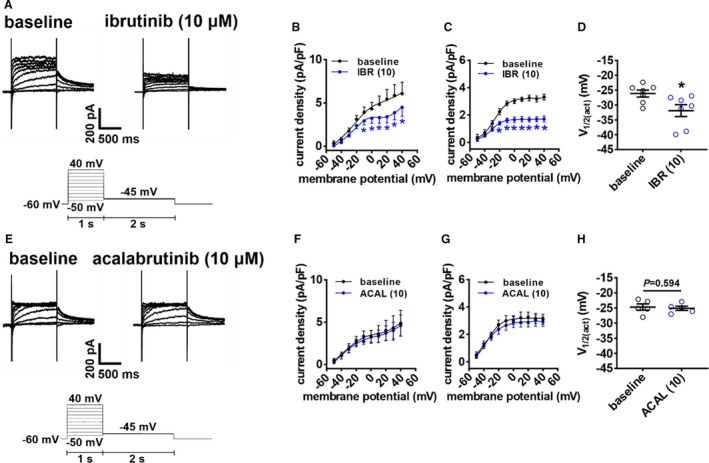
A, Representative IKr recordings in isolated SAN myocytes at baseline and after application of 10 µmol/L of ibrutinib of (IBR (10)). Voltage clamp protocol shown below recordings. B, Peak total K+ current (IK(tot)) I‐V curves, measured at the end of the 1‐second depolarizing steps, at baseline and after application of IBR (10). C, Boltzmann fit of IKr tail currents (measured at −45 mV) at baseline and after application of IBR (10). D, Voltage for 50% channel activation (V1/2(act)) for IKr tail current at baseline and after application of IBR (10). For panels B–C: *P<0.05 vs baseline by 2‐way repeated measures ANOVA with a Tukey post hoc test; for panel D: *P<0.05 vs baseline by paired Student t test; n=7 SAN myocytes from 3 mice. E, Representative IKr recordings in isolated SAN myocytes at baseline and after application of 10 µmol/L of acalabrutinib (ACAL (10)). F, Peak IK I‐V curves, measured at the end of the 1‐second depolarizing steps, at baseline and after application of ACAL (10). G, Boltzmann fit of IKr tail currents (measured at −45 mV) at baseline and after application of ACAL (10). D, V1/2(act) for IKr tail current at baseline and after application of ACAL (10). For panels F–G: data analyzed by 2‐way repeated measures ANOVA with a Tukey post hoc test; for panel H: data analyzed by paired Student t test; n=5 SAN myocytes from 3 mice.
Ibrutinib (10 µmol/L) had no significant effects on hyperpolarization activated current amplitude or activation kinetics in isolated SAN myocytes (Figure S6). Ibrutinib also had no significant effects on ICa,L density or activation kinetics in SAN myocytes (Figure S7).
Discussion
This study provides new insight into the basis for ibrutinib‐mediated AF, as well as sinus bradycardia and sinus arrest, following ibrutinib treatment. We demonstrate the effects of ibrutinib on atrial and SAN electrophysiology that are consistent with increased AF susceptibility and SAN dysfunction and provide insight into the ionic basis for these effects. Furthermore, this study demonstrates that several of these effects are specific to ibrutinib and that another more selective BTK inhibitor, acalabrutinib, does not elicit the same effects. Thus, we have shown that ibrutinib and acalabrutinib have distinct effects on atrial electrophysiology and arrhythmogenesis that explain why ibrutinib is proarrhythmic while acalabrutinib is not.
We previously demonstrated that acute application of ibrutinib in vivo resulted in increased susceptibility to pacing‐induced AF in mice. 10 Consistent with this, we now show that ibrutinib dose‐dependently reduced atrial CV as assessed using high‐resolution optical mapping. These effects were elicited by acute drug application and could largely be reversed upon washout. Consistent with these impairments in conduction, ibrutinib reduced AP Vmax and atrial INa without altering INa activation kinetics. In stark contrast, acalabrutinib had no effects on atrial AP Vmax or INa. Atrial INa and AP Vmax are critical determinants of atrial CV. 12 Furthermore, slow conduction increases susceptibility to AF by shortening the wavelength for reentry. 12 , 13 Based on this, our data indicate that ibrutinib increases AF occurrence by impairing atrial conduction via its effects on INa. Consistent with the absence of effects on INa, we show that acalabrutinib did not increase susceptibility to AF in mice in vivo, further supporting the conclusion that the presence or absence of effects on INa and atrial conduction are key determinants of AF susceptibility in the presence of ibrutinib compared with acalabrutinib.
We also found that ibrutinib and acalabrutinib each increased atrial APD; however, these effects occurred by distinct mechanisms. Ibrutinib prolonged APD by blocking Ito and IKur, while acalabrutinib increased APD by blocking IKur only. Furthermore, it took higher doses of acalabrutinib to increase APD and the effects were still smaller in magnitude compared with ibrutinib, which could be caused by the effects of ibrutinib on both Ito and IKur. Increases in APD could increase the likelihood of early afterdepolarizations and conduction block, each of which can favor AF initiation or maintenance. 12 , 27 Thus, more substantial AP prolongation, along with reductions in AP Vmax, could contribute to AF occurrence in the presence of ibrutinib, while more modest increases in APD alone are insufficient to increase AF susceptibility in the presence of acalabrutinib.
Previous studies have shown that chronic ibrutinib treatment in mice is associated with enhanced Ca2+/calmodulin‐dependent protein kinase II (CaMKII) activity and changes in C‐terminal Src kinase (CSK) activity. 28 , 29 These studies further show that chronic ibrutinib led to atrial enlargement, atrial fibrosis, inflammation, and changes in sarcoplasmic reticulum Ca2+ handling as a result of these alterations in CaMKII and CSK activity. While BTK is expressed in the heart, 30 , 31 these findings, in conjunction with our study, support the hypothesis that ibrutinib increases AF susceptibility via off‐target effects independent of BTK inhibition. This is further supported by our finding that acalabrutinib, which is a more selective BTK inhibitor, has minimal effects on atrial electrophysiology and no effects arrhythmogenesis. Whether CaMKII and/or CSK mediate any of the effects of ibrutinib on atrial myocyte electrophysiology is unknown, and ibrutinib may also modulate other signaling pathways in atrial myocytes. 32 Our observations that ibrutinib, but not acalabrutinib, can inhibit multiple currents (INa and Ito), and that INa is reduced without changes in activation kinetics, may indicate that these effects involve direct binding of ibrutinib to these ion channels. On the other hand, ibrutinib and acalabrutinib both inhibited IKur similarly, suggesting that this effect could involve BTK inhibition or effects on another common signaling pathway. These hypotheses could be investigated in future studies.
The implications of atrial enlargement and fibrosis in AF occurrence during ibrutinib treatment are not completely clear given we have previously shown that AF susceptibility is reduced after a 24‐hour washout of ibrutinib. 10 This suggests that the rapidly activatable effects of ibrutinib on atrial ion channels that we have identified are centrally involved in ibrutinib‐mediated atrial arrhythmogenesis. Nevertheless, atrial enlargement and fibrosis can both contribute importantly to conduction disturbances and reentry in AF 13 ; therefore, these effects of ibrutinib could further enhance susceptibility to arrythmia along with changes in atrial ion channel function. Interestingly, 1 study suggested that long‐term treatment with ibrutinib did not affect atrial AP morphology; however, this study delivered ibrutinib for 4 weeks in vivo and then conducted patch‐clamp studies in isolated myocytes, which were compared with a vehicle control group. 29 Based on our data, it is possible that the effects of ibrutinib on atrial myocyte electrophysiology could have been washed out during the cell isolation procedure, causing the effects of ibrutinib on cellular atrial electrophysiology to go undetected. Our study indicates that it is critical to consider the acute effects of ibrutinib on cellular electrophysiology and ion channel function when interpreting the effects of ibrutinib on AF occurrence.
In addition to promoting AF, ibrutinib has also been associated with sinus bradycardia and even sinus arrest 6 , 7 ; however, the basis for this was completely unknown. We found that ibrutinib consistently decreased beating rate in association with impaired conduction in the RA posterior wall and increases in SAN to atrial conduction time in isolated atrial preparations, while acalabrutinib had no effects on these properties. Using isolated SAN myocytes, we also show that ibrutinib, but not acalabrutinib, slowed spontaneous AP firing in SAN myocytes in association with depolarization of the MDP, a reduction in DD slope, and increases in APD. At higher doses, ibrutinib completely suppressed AP firing in association with substantial depolarization of the MDP. Interestingly, these effects of ibrutinib did not involve hyperpolarization activated current or ICa,L. Rather, ibrutinib potently inhibited IKr, which has previously been shown to play an important role in SAN AP firing. 26 , 33 Specifically, inhibition of IKr in SAN myocytes with compounds such as dofetilide or E‐4031 leads to effects similar to those observed with ibrutinib, including depolarization of the MDP, reduction in DD slope, and increases in APD, all of which can contribute to a reduction in spontaneous AP firing. 18 , 26 , 33 , 34 These findings indicate that ibrutinib has selective effects on IKr in SAN myocytes that account for the effects on AP morphology and reductions in heart rate. These effects are also likely to be independent of BTK as acalabrutinib had no effect on heart rate or IKr in SAN myocytes.
Some limitations should be noted for our study. Our experiments were performed in mice, which exhibit some differences in ion channel expression and function compared with humans. For example, IKr contributes to atrial repolarization in large mammals and humans, but not in mice. 15 Interestingly, IKr is an important ionic current in mouse SAN and we have demonstrated that it is potently affected by ibrutinib in SAN myocytes. As such, future studies on the role of IKr in ibrutinib‐mediated AF are warranted. In addition, our study focused on acute effects of ibrutinib and acalabrutinib. While no AF was observed during acute acalabrutinib application, the effects of chronic acalabrutinib treatment on atrial electrophysiology were not studied. In addition to being affected by INa, atrial conduction is also affected by gap junction conductance, 12 which was not investigated in the present study. Patch‐clamp studies were not performed in left atrial myocytes; however, optical mapping studies demonstrate that the effects of ibrutinib and acalabrutinib in right and left atria were similar. Accordingly, it is expected that drug effects on ion channels demonstrated in isolated RA myocytes would be similar in left atrial myocytes.
In conclusion, our study provides novel insight into the electrophysiological effects of the BTK inhibitors ibrutinib and acalabrutinib on atrial electrophysiology and AF susceptibility. We demonstrate that ibrutinib and acalabrutinib have distinct effects on atrial conduction, atrial AP morphology, and atrial ion channel function. We also demonstrate distinct effects of these BTK inhibitors on SAN beating rate and SAN ion channel function. These data provide an explanation for the occurrence of AF and SAN dysfunction in patients treated with ibrutinib compared with those treated with acalabrutinib.
Sources of Funding
This work was supported by the Canadian Institutes of Health Research to R.A.R. (MOP 142486 and PJT 1666105) and a Canadian Cardiovascular Society Bayer Resident Vascular Research Award to J.M.T. L.J.B. holds a University of Calgary Silver Anniversary fellowship. T.W.D. holds a Canadian Institutes of Health Research Doctoral Research Award. H.J.J. was supported by a Killam Postdoctoral Fellowship and holds a Libin Cardiovascular Institute Postdoctoral Fellowship. Y.L. holds a Canadian Institutes of Health Research Postdoctoral Fellowship.
Disclosures
None.
Supporting information
Data S1
Tables S1–S4
Figures S1–S7
For Sources of Funding and Disclosures, see page 15.
References
- 1. Honigberg LA, Smith AM, Sirisawad M, Verner E, Loury D, Chang B, Li S, Pan Z, Thamm DH, Miller RA, et al. The Bruton tyrosine kinase inhibitor PCI‐32765 blocks B‐cell activation and is efficacious in models of autoimmune disease and B‐cell malignancy. Proc Natl Acad Sci USA. 2010;107:13075–13080. doi: 10.1073/pnas.1004594107 [DOI] [PMC free article] [PubMed] [Google Scholar]
- 2. Herman SE, Gordon AL, Hertlein E, Ramanunni A, Zhang X, Jaglowski S, Flynn J, Jones J, Blum KA, Buggy JJ, et al. Bruton tyrosine kinase represents a promising therapeutic target for treatment of chronic lymphocytic leukemia and is effectively targeted by PCI‐32765. Blood. 2011;117:6287–6296. doi: 10.1182/blood-2011-01-328484 [DOI] [PMC free article] [PubMed] [Google Scholar]
- 3. Ganatra S, Sharma A, Shah S, Chaudhry GM, Martin DT, Neilan TG, Mahmood SS, Barac A, Groarke JD, Hayek SS, et al. Ibrutinib‐Associated Atrial Fibrillation. JACC Clin Electrophysiol. 2018;4:1491–1500. doi: 10.1016/j.jacep.2018.06.004 [DOI] [PubMed] [Google Scholar]
- 4. Munir T, Brown JR, O'Brien S, Barrientos JC, Barr PM, Reddy NM, Coutre S, Tam CS, Mulligan SP, Jaeger U, et al. Final analysis from RESONATE: up to six years of follow‐up on ibrutinib in patients with previously treated chronic lymphocytic leukemia or small lymphocytic lymphoma. Am J Hematol. 2019;94:1353–1363. doi: 10.1002/ajh.25638 [DOI] [PMC free article] [PubMed] [Google Scholar]
- 5. Leong DP, Caron F, Hillis C, Duan A, Healey JS, Fraser G, Siegal D. The risk of atrial fibrillation with ibrutinib use: a systematic review and meta‐analysis. Blood. 2016;128:138–140. doi: 10.1182/blood-2016-05-712828 [DOI] [PubMed] [Google Scholar]
- 6. Brown JR. How I treat CLL patients with ibrutinib. Blood. 2018;131:379–386. doi: 10.1182/blood-2017-08-764712 [DOI] [PubMed] [Google Scholar]
- 7. Mathur K, Saini A, Ellenbogen KA, Shepard RK. Profound sinoatrial arrest associated with ibrutinib. Case Rep Oncol Med. 2017;2017:7304021. doi: 10.1155/2017/7304021 [DOI] [PMC free article] [PubMed] [Google Scholar]
- 8. Wu J, Zhang M, Liu D. Acalabrutinib (ACP‐196): a selective second‐generation BTK inhibitor. J Hematol Oncol. 2016;9:21. doi: 10.1186/s13045-016-0250-9 [DOI] [PMC free article] [PubMed] [Google Scholar]
- 9. Isaac K, Mato AR. Acalabrutinib and its therapeutic potential in the treatment of chronic lymphocytic leukemia: a short review on emerging data. Cancer Manag Res. 2020;12:2079–2085. doi: 10.2147/CMAR.S219570 [DOI] [PMC free article] [PubMed] [Google Scholar]
- 10. Tuomi JM, Xenocostas A, Jones DL. Increased susceptibility for atrial and ventricular cardiac arrhythmias in mice treated with a single high dose of ibrutinib. Can J Cardiol. 2018;34:337–341. doi: 10.1016/j.cjca.2017.12.001 [DOI] [PubMed] [Google Scholar]
- 11. Thompson PA, Lévy V, Tam CS, Al Nawakil C, Goudot FX, Quinquenel A, Ysebaert L, Michallet AS, Dilhuydy MS, Van Den Neste E, et al. Atrial fibrillation in CLL patients treated with ibrutinib. An international retrospective study. Br J Haematol. 2016;175:462–466. doi: 10.1111/bjh.14324 [DOI] [PubMed] [Google Scholar]
- 12. Jansen HJ, Bohne LJ, Gillis AM, Rose RA. Atrial remodeling and atrial fibrillation in acquired forms of cardiovascular disease. Heart Rhythm O2. 2020;1:147–159. doi: 10.1016/j.hroo.2020.05.002 [DOI] [PMC free article] [PubMed] [Google Scholar]
- 13. Heijman J, Voigt N, Nattel S, Dobrev D. Cellular and molecular electrophysiology of atrial fibrillation initiation, maintenance, and progression. Circ Res. 2014;114:1483–1499. doi: 10.1161/CIRCRESAHA.114.302226 [DOI] [PubMed] [Google Scholar]
- 14. Bartos DC, Grandi E, Ripplinger CM. Ion channels in the heart. Compr Physiol. 2015;5:1423–1464. doi: 10.1002/cphy.c140069 [DOI] [PMC free article] [PubMed] [Google Scholar]
- 15. Nerbonne JM, Kass RS. Molecular physiology of cardiac repolarization. Physiol Rev. 2005;85:1205–1253. doi: 10.1152/physrev.00002.2005 [DOI] [PubMed] [Google Scholar]
- 16. Mangoni ME, Nargeot J. Genesis and regulation of the heart automaticity. Physiol Rev. 2008;88:919–982. doi: 10.1152/physrev.00018.2007 [DOI] [PubMed] [Google Scholar]
- 17. MacDonald EA, Rose RA, Quinn TA. Neurohumoral control of sinoatrial node activity and heart rate: insight from experimental models and findings from humans. Front Physiol. 2020;11:170. doi: 10.3389/fphys.2020.00170 [DOI] [PMC free article] [PubMed] [Google Scholar]
- 18. Ono K, Ito H. Role of rapidly activating delayed rectifier K+ current in sinoatrial node pacemaker activity. Am J Physiol. 1995;269:H453–H462. doi: 10.1152/ajpheart.1995.269.2.H453 [DOI] [PubMed] [Google Scholar]
- 19. Patel V, Balakrishnan K, Bibikova E, Ayres M, Keating MJ, Wierda WG, Gandhi V. Comparison of acalabrutinib, a selective Bruton tyrosine kinase inhibitor, with ibrutinib in chronic lymphocytic leukemia cells. Clin Cancer Res. 2017;23:3734–3743. doi: 10.1158/1078-0432.CCR-16-1446 [DOI] [PMC free article] [PubMed] [Google Scholar]
- 20. Tuomi JM, Chidiac P, Jones DL. Evidence for enhanced M3 muscarinic receptor function and sensitivity to atrial arrhythmia in the RGS2‐deficient mouse. Am J Physiol Heart Circ Physiol. 2010;298:H554–H561. doi: 10.1152/ajpheart.00779.2009 [DOI] [PubMed] [Google Scholar]
- 21. Bohne LJ, Jansen HJ, Daniel I, Dorey TW, Moghtadaei M, Belke DD, Ezeani M, Rose RA. Electrical and structural remodeling contribute to atrial fibrillation in type 2 diabetic db/db mice. Heart Rhythm. 2021;18:118–129. doi: 10.1016/j.hrthm.2020.08.019 [DOI] [PubMed] [Google Scholar]
- 22. Jansen HJ, Mackasey M, Moghtadaei M, Belke DD, Egom EE, Tuomi JM, Rafferty SA, Kirkby AW, Rose RA. Distinct patterns of atrial electrical and structural remodeling in angiotensin II mediated atrial fibrillation. J Mol Cell Cardiol. 2018;124:12–25. doi: 10.1016/j.yjmcc.2018.09.011 [DOI] [PubMed] [Google Scholar]
- 23. Mackasey M, Egom EE, Jansen HJ, Hua R, Moghtadaei M, Liu Y, Kaur J, McRae MD, Bogachev O, Rafferty SA, et al. Natriuretic peptide receptor‐C protects against angiotensin II‐mediated sinoatrial node disease in mice. JACC Basic Transl Sci. 2018;3:824–843. doi: 10.1016/j.jacbts.2018.08.004 [DOI] [PMC free article] [PubMed] [Google Scholar]
- 24. Jansen HJ, Mackasey M, Moghtadaei M, Liu Y, Kaur J, Egom EE, Tuomi JM, Rafferty SA, Kirkby AW, Rose RA. NPR‐C (Natriuretic Peptide Receptor‐C) modulates the progression of angiotensin II‐mediated atrial fibrillation and atrial remodeling in mice. Circ Arrhythm Electrophysiol. 2019;12:e006863. doi: 10.1161/CIRCEP.118.006863 [DOI] [PubMed] [Google Scholar]
- 25. Egom EE, Vella K, Hua R, Jansen HJ, Moghtadaei M, Polina I, Bogachev O, Hurnik R, Mackasey M, Rafferty S, et al. Impaired sinoatrial node function and increased susceptibility to atrial fibrillation in mice lacking natriuretic peptide receptor C. J Physiol. 2015;593:1127–1146. doi: 10.1113/jphysiol.2014.283135 [DOI] [PMC free article] [PubMed] [Google Scholar]
- 26. Clark RB, Mangoni ME, Lueger A, Couette B, Nargeot J, Giles WR. A rapidly activating delayed rectifier K+ current regulates pacemaker activity in adult mouse sinoatrial node cells. Am J Physiol Heart Circ Physiol. 2004;286:H1757–H1766. doi: 10.1152/ajpheart.00753.2003 [DOI] [PubMed] [Google Scholar]
- 27. Aguilar M, Rose RA, Takawale A, Nattel S, Reilly S. New aspects of endocrine control of atrial fibrillation and possibilities for clinical translation. Cardiovasc Res. 2021;117:1645–1661. doi: 10.1093/cvr/cvab080 [DOI] [PMC free article] [PubMed] [Google Scholar]
- 28. Jiang LE, Li L, Ruan Y, Zuo S, Wu X, Zhao Q, Xing Y, Zhao X, Xia S, Bai R, et al. Ibrutinib promotes atrial fibrillation by inducing structural remodeling and calcium dysregulation in the atrium. Heart Rhythm. 2019;16:1374–1382. doi: 10.1016/j.hrthm.2019.04.008 [DOI] [PubMed] [Google Scholar]
- 29. Xiao L, Salem JE, Clauss S, Hanley A, Bapat A, Hulsmans M, Iwamoto Y, Wojtkiewicz G, Cetinbas M, Schloss MJ, et al. Ibrutinib‐mediated atrial fibrillation attributable to inhibition of C‐terminal Src Kinase. Circulation. 2020;142:2443–2455. doi: 10.1161/CIRCULATIONAHA.120.049210 [DOI] [PMC free article] [PubMed] [Google Scholar]
- 30. O'Riordan CE, Purvis GSD, Collotta D, Chiazza F, Wissuwa B, Al Zoubi S, Stiehler L, Martin L, Coldewey SM, Collino M, et al. Bruton's tyrosine kinase inhibition attenuates the cardiac dysfunction caused by cecal ligation and puncture in mice. Front Immunol. 2019;10:2129. doi: 10.3389/fimmu.2019.02129 [DOI] [PMC free article] [PubMed] [Google Scholar]
- 31. McMullen JR, Boey EJ, Ooi JY, Seymour JF, Keating MJ, Tam CS. Ibrutinib increases the risk of atrial fibrillation, potentially through inhibition of cardiac PI3K‐Akt signaling. Blood. 2014;124:3829–3830. doi: 10.1182/blood-2014-10-604272 [DOI] [PubMed] [Google Scholar]
- 32. Shafaattalab S, Lin E, Christidi E, Huang H, Nartiss Y, Garcia A, Lee J, Protze S, Keller G, Brunham L, et al. Ibrutinib displays atrial‐specific toxicity in human stem cell‐derived cardiomyocytes. Stem Cell Reports. 2019;12:996–1006. doi: 10.1016/j.stemcr.2019.03.011 [DOI] [PMC free article] [PubMed] [Google Scholar]
- 33. Hu W, Clark RB, Giles WR, Shibata E, Zhang H. Physiological roles of the rapidly activated delayed rectifier K(+) current in Adult mouse heart primary pacemaker activity. Int J Mol Sci. 2021;22:4761. doi: 10.3390/ijms22094761 [DOI] [PMC free article] [PubMed] [Google Scholar]
- 34. Verheijck EE, van Ginneken AC, Bourier J, Bouman LN. Effects of delayed rectifier current blockade by E‐4031 on impulse generation in single sinoatrial nodal myocytes of the rabbit. Circ Res. 1995;76:607–615. doi: 10.1161/01.RES.76.4.607 [DOI] [PubMed] [Google Scholar]
Associated Data
This section collects any data citations, data availability statements, or supplementary materials included in this article.
Supplementary Materials
Data S1
Tables S1–S4
Figures S1–S7


