

Abstract
Background
Prior studies showed that life expectancy in patients who underwent surgical aortic valve replacement (AVR) was lower than in the general population. Explanations for this shorter life expectancy are unknown. The aim of this nationwide, observational cohort study was to investigate the cause‐specific death following surgical AVR.
Methods and Results
We included 33 018 patients who underwent primary surgical AVR in Sweden between 1997 and 2018, with or without coronary artery bypass grafting. The SWEDEHEART (Swedish Web‐System for Enhancement and Development of Evidence‐Based Care in Heart Disease Evaluated According to Recommended Therapies) register and other national health‐data registers were used to obtain and characterize the study cohort and to identify causes of death, categorized as cardiovascular mortality, cancer mortality, or other causes of death. The relative risks for cause‐specific mortality in patients who underwent AVR compared with the general population are presented as standardized mortality ratios. During a mean follow‐up period of 7.3 years (maximum 22.0 years), 14 237 (43%) patients died. The cumulative incidence of death from cardiovascular, cancer‐related, or other causes was 23.5%, 8.3%, and 11.6%, respectively, at 10 years, and 42.8%, 12.8%, and 23.8%, respectively, at 20 years. Standardized mortality ratios for cardiovascular, cancer‐related, and other causes of death were 1.79 (95% CI, 1.75–1.83), 1.00 (95% CI, 0.97–1.04), and 1.08 (95% CI, 1.05–1.12), respectively.
Conclusions
We found that life expectancy following AVR was lower than in the general population. Lower survival after AVR was explained by an increased relative risk of cardiovascular death. Future studies should focus on the role of earlier surgery in patients with asymptomatic aortic stenosis and on optimizing treatment and follow‐up after AVR.
Registration
URL: https://www.clinicaltrials.gov; Unique identifier: NCT02276950.
Keywords: aortic valve replacement, cardiac surgery, cause of death, life expectancy
Subject Categories: Cardiovascular Disease, Mortality/Survival
Nonstandard Abbreviation and Acronym
- AVR
aortic valve replacement
Clinical Perspective
What Is New?
Life expectancy in patients who underwent surgical aortic valve replacement was lower than in the general population.
Reduced life expectancy after aortic valve replacement was explained by an increased risk of cardiovascular death.
Compared with the general population, the risk of death from cardiovascular causes was higher in younger age groups.
What Are the Clinical Implications?
The increased relative risk of cardiovascular death can hypothetically be reduced by earlier surgery.
Suboptimal postoperative follow‐up is another potential explanation for the shorter life expectancy, which may result in delayed diagnosis of complications.
Future research should focus on the role of earlier surgery in patients with aortic stenosis and on optimizing treatment and follow‐up after aortic valve replacement.
Prior studies showed that life expectancy in those who underwent surgical aortic valve replacement (AVR) was lower than in the general population, and loss in life expectancy was more pronounced in younger patients. 1 However, explanations for this shorter life expectancy are unknown. Some studies reported causes of death after transcatheter AVR, 2 , 3 although there is a paucity of literature on causes of death in contemporary surgical AVR populations, particularly with comparisons with the general population. According to current guidelines, only symptomatic patients, or those with reduced left ventricular function secondary to their aortic valve disease, have a class I indication for surgery. 4 , 5 However, recent studies showed that asymptomatic patients may benefit from early surgery, and the optimal timing for AVR has been debated. 6 , 7 , 8 , 9 Severe valve disease results in gradual and irreversible myocardial damage. 10 Valve replacement before occurrence of symptoms and myocardial injury may improve long‐term outcomes. To gain further insights into this hypothesis, it is necessary to determine if death from cardiovascular causes is a factor that contributes to shorter life expectancy following AVR. Therefore, we performed a population‐based, nationwide, observational cohort study to investigate causes of death following surgical AVR. The relative risks for different causes of death after AVR were estimated by comparisons with cause‐specific death rates from the general Swedish population.
Methods
Study Design
This was an observational, register‐based, nationwide, population‐based cohort study. All data and supporting materials have been provided with the published article. The reporting follows the Strengthening the Reporting of Observational Studies in Epidemiology and the Reporting of Studies Conducted using Observational Routinely Collected Health Data guidelines for observational studies using routinely collected data. 11 , 12 This study complies with the Declaration of Helsinki. The Swedish Ethical Review Authority approved this study and the requirement for informed consent was waived (Dnr: 2020‐04967).
Setting
We included all patients who underwent surgical AVR in Sweden between January 1, 1997 and December 31, 2018. Follow‐up ended on December 31, 2018.
Data Sources
The study cohort and baseline characteristics were obtained from the SWEDEHEART (Swedish Web‐System for Enhancement and Development of Evidence‐Based Care in Heart Disease Evaluated According to Recommended Therapies) register. 13 , 14 The National Patient Register 15 and the longitudinal integration database for health insurance and labor market studies (maintained by Statistics Sweden) 16 were used to obtain additional baseline characteristics. Cause of death, vital status, and date of death were retrieved from the Swedish Cause of Death register. 17 The international version of the International Classification of Diseases (ICD) codes has been used for classification of causes of death since 1997. The Cause of Death register is updated annually and includes information from all death certificates issued in Sweden since 1961. Therefore, follow‐up for the primary outcome was complete. Data from the national registers were able to be individually cross‐linked because of the unique 12‐digit personal identity number system used in Sweden. 18 The national registers used in this study have been described previously. 19
Study Population and Exposure
We included all patients who underwent surgical AVR in Sweden between January 1, 1997 and December 31, 2018. Patients with concomitant coronary artery bypass grafting and those who underwent surgery of the ascending aorta and/or arrhythmia surgery were included, although patients who required concomitant procedures of other valves, prior cardiac surgery, or emergent surgery or had active endocarditis were excluded.
Outcome
The outcome of this study was cause‐specific death retrieved from the Swedish Cause of Death register. 17 Cause of death was categorized as cardiovascular mortality, cancer mortality, or other causes of death according to the corresponding ICD codes (Table S1).
Statistical Analysis
Baseline characteristics are presented as mean and SD (continuous variables) and as number and percentage (categorical variables). The relative risks for all‐cause and cause‐specific mortality in patients who underwent AVR compared with the general population are presented as standardized mortality ratios, and stratified according to sex and age at surgery. Standardized mortality ratios and corresponding 95% CIs were calculated as the ratio of the observed number of deaths in the study population to the expected number of deaths in an age‐, sex‐, and calendar‐year matched Swedish population obtained from the publicly available statistical database provided by the Swedish National Board of Health and Welfare. 20 A standardized mortality ratio over 1.0 indicates that there were more deaths (excess deaths) in the study population than expected. The cause‐specific cumulative incidences of cardiovascular, cancer‐related, and other causes of death were obtained from flexible parametric survival models. 21 The competing risk of death from other causes was accounted for in the models. The follow‐up time for each patient was counted from the date of AVR until the date of death or end of follow‐up (December 31, 2018). All analyses were repeated excluding patients who died during the first 90 postoperative days. Data management and statistical analyses were performed using R programming language version 4.0.3 (R Foundation for Statistical Computing, Vienna, Austria) and Stata version 16.1 (Stata Corp LP, College Station, TX, USA) and included use of the stpm2cr command. 21
Results
We included 33 018 patients who underwent primary surgical AVR in Sweden between 1997 and 2018. The number of operations per year is shown in Figure S1 and the baseline characteristics according to vital status and cause of death are shown in Table 1. In the total study population, mean age was 68.9 years and 12 141 (37%) patients were women. Patients who died from cardiovascular causes had increased incidence of ischemic heart disease (prior myocardial infarction and prior coronary artery bypass grafting), atrial fibrillation, and stroke compared with patients who were alive or who died from cancer‐related or other causes.
Table 1.
Baseline Characteristics in 33 108 Patients Who Underwent Aortic Valve Replacement in Sweden Between 1997 and 2018 According to Cause of Death
|
All patients n=33 108 (100%) |
Alive n=18 781 (57%) |
Cardiovascular death n=7778 (24%) |
Cancer death n=2483 (8%) |
Other death n=3976 (12%) |
|
|---|---|---|---|---|---|
| Age, y, mean (SD) | 68.9 (12) | 65.4 (12) | 73.8 (8.3) | 72.5 (8.1) | 73.5 (8.8) |
| Female sex | 12 141 (37) | 6295 (34) | 3302 (43) | 852 (34) | 1692 (43) |
| Civil status | |||||
| Not married or cohabiting | 20 451 (62) | 11 642 (62) | 4733 (61) | 1638 (66) | 2438 (61) |
| Education | |||||
| <10 y | 14 313 (44) | 6587 (35) | 4286 (56) | 1275 (52) | 2165 (56) |
| 10–12 y | 12 302 (38) | 7808 (42) | 2430 (32) | 841 (34) | 1223 (31) |
| >12 y | 6008 (18) | 4239 (23) | 933 (12) | 335 (14) | 501 (13) |
| Region of birth | |||||
| Non‐Nordic countries | 1969 (6.0) | 1340 (7.1) | 324 (4.2) | 110 (4.4) | 195 (4.9) |
| Body mass index (kg/cm2) | |||||
| <18.5 | 323 (1.1) | 133 (0.8) | 99 (1.5) | 25 (1.2) | 66 (1.9) |
| 18.5–25 | 10 342 (35.2) | 5629 (32.7) | 2519 (38.3) | 858 (39.5) | 1336 (39.3) |
| >25 | 18 681 (63.7) | 11 438 (66.5) | 3960 (60.2) | 1289 (59.3) | 1994 (58.7) |
| Household disposable income | |||||
| Q1 (lowest) | 8253 (25) | 2823 (15) | 3091 (40) | 796 (32) | 1543 (39) |
| Q2 | 8253 (25) | 3987 (21) | 2315 (30) | 750 (30) | 1201 (30) |
| Q3 | 8253 (25) | 5347 (29) | 1531 (20) | 571 (23) | 804 (20) |
| Q4 (highest) | 8252 (25) | 6622 (35) | 839 (11) | 366 (15) | 425 (11) |
| Cardiac implantable electronic device | 710 (2.2) | 353 (1.9) | 223 (2.9) | 44 (1.8) | 90 (2.3) |
| Diabetes | 5934 (18) | 3009 (16) | 1547 (20) | 405 (16) | 973 (25) |
| Atrial fibrillation | 5628 (17) | 2551 (14) | 1848 (24) | 423 (17) | 806 (20) |
| Hypertension | 14 144 (43) | 9153 (49) | 2765 (36) | 846 (34) | 1380 (35) |
| Hyperlipidemia | 5689 (17) | 3856 (21) | 1006 (13) | 297 (12) | 530 (13) |
| Stroke | 3190 (9.7) | 1606 (8.6) | 938 (12) | 234 (9.4) | 412 (10) |
| Peripheral vascular disease | 4819 (15) | 3082 (16) | 1015 (13) | 279 (11) | 443 (11) |
| Chronic pulmonary disease | 2908 (8.8) | 1462 (7.8) | 743 (9.6) | 243 (9.8) | 460 (12) |
| Prior myocardial infarction | 4721 (14) | 2077 (11) | 1551 (20) | 404 (16) | 689 (17) |
| Prior percutaneous coronary intervention | 2575 (7.8) | 1426 (7.6) | 651 (8.4) | 187 (7.5) | 311 (7.8) |
| Prior major bleeding event | 2211 (6.7) | 1133 (6.0) | 538 (6.9) | 208 (8.4) | 332 (8.4) |
| Alcohol dependency | 723 (2.2) | 414 (2.2) | 150 (1.9) | 56 (2.3) | 103 (2.6) |
| Liver disease | 375 (1.1) | 182 (1.0) | 100 (1.3) | 24 (1.0) | 69 (1.7) |
| Cancer | 4122 (13) | 2315 (12) | 819 (11) | 538 (22) | 450 (11) |
| Estimated glomerular filtration rate (mL/min per 1.73 m2) | |||||
| >60 | 22 057 (73) | 14 873 (82) | 3716 (56) | 1457 (67) | 2011 (58) |
| 45–60 | 5565 (18) | 2344 (13) | 1844 (28) | 506 (23) | 871 (25) |
| 30–44 | 2177 (7.2) | 707 (3.9) | 857 (13) | 191 (8.7) | 422 (12) |
| <30 | 553 (1.8) | 138 (0.8) | 229 (3.4) | 31 (1.4) | 155 (4.5) |
| Dialysis | 264 (0.9) | 134 (0.8) | 64 (1.0) | 8 (0.4) | 58 (1.7) |
| Heart failure | 6942 (21) | 2840 (15) | 2427 (31) | 570 (23) | 1105 (28) |
| Left ventricular ejection fraction (%) | |||||
| >50 | 18 350 (74) | 13025 (77) | 2695 (63) | 1069 (70) | 1561 (68) |
| 30–49 | 5431 (22) | 3243 (19) | 1230 (29) | 373 (25) | 585 (26) |
| <30 | 1195 (4.8) | 650 (3.8) | 328 (7.7) | 77 (5.1) | 140 (6.1) |
| Biological valve prosthesis | 22 179 (67) | 11 947 (64) | 5588 (72) | 1735 (70) | 2909 (73) |
| Isolated aortic valve replacement | 17 243 (52) | 10 595 (56) | 3444 (44) | 1207 (49) | 1997 (50) |
| Concomitant coronary artery bypass grafting | 11 808 (36) | 5069 (27) | 3862 (50) | 1107 (45) | 1770 (45) |
| Concomitant surgery of the ascending aorta | 4807 (15) | 3613 (19) | 682 (8.8) | 221 (8.9) | 291 (7.3) |
| Year of surgery | |||||
| 1997–2002 | 8205 (25) | 1817 (9.7) | 3641 (47) | 992 (40) | 1755 (44) |
| 2003–2008 | 8610 (26) | 3831 (20) | 2558 (33) | 877 (35) | 1344 (34) |
| 2009–2013 | 8261 (25) | 5802 (31) | 1224 (16) | 504 (20) | 731 (18) |
| 2014–2018 | 7942 (24) | 7331 (39) | 355 (4.6) | 110 (4.4) | 146 (3.7) |
Data are n (%) unless otherwise noted.
Cause‐Specific Risk of Death According to Follow‐up Time, Sex, and Age
During a mean follow‐up time of 7.3 years (maximum 22.0 years), and a total follow‐up time of 242 068 patient‐years, 14 237 (43%) patients who underwent AVR died. Among them, 7778 (24%), 2483 (8%), and 3976 (12%) patients died because of cardiovascular, cancer‐related, and other causes, respectively, and 30‐day all‐cause mortality was 2.7%. The cumulative incidence of death from cardiovascular, cancer‐related, and other causes was 23.5%, 8.3%, and 11.6%, respectively, at 10 years and 42.8%, 12.8%, and 23.8%, respectively, at 20 years. The crude probability of death at 5, 10, 15, and 20 years after surgery according to cause of death, stratified by sex and age groups is shown in Table 2 and Figure S2 and S3, and stratified by valve type and surgical procedure in Figure S4 and Table S2. The probability of death according to different causes of death is shown in Figure 1, and the probability of death according to different causes of death, stratified by sex and age groups is shown in Figure 2.
Table 2.
Crude Probability of Death at 5, 10, 15, and 20 Years After Surgery According to Cause of Death by Age Group and Sex in 33 108 Patients Who Underwent Aortic Valve Replacement in Sweden Between 1997 and 2018
| Cardiovascular death, % (95% CI) | Cancer death, % (95% CI) | Other death, % (95% CI) | |
|---|---|---|---|
| 5 y after surgery | |||
| Total population | 10.2% (9.9%–10.5%) | 3.8% (3.6%–4.0%) | 4.3% (4.1%–4.5%) |
| Sex | |||
| Men | 9.5% (9.1%–9.8%) | 4.0% (3.8%–4.3%) | 4.0% (3.8%–4.2%) |
| Women | 11.4% (10.9%–11.9%) | 3.4% (3.1%–3.7%) | 4.8% (4.5%–5.1%) |
| Age groups, y | |||
| <50 | 1.8% (1.4%–2.1%) | 0.6% (0.4%–0.8%) | 1.0% (0.8%–1.3%) |
| 50–59 | 4.2% (3.8%–4.6%) | 1.9% (1.6%–2.2%) | 1.8% (1.5%–20.1%) |
| 60–69 | 7.2% (6.8%–7.6%) | 3.8% (3.5%–4.2%) | 3.2% (2.9%–3.4%) |
| 70–79 | 12.7% (12.2%–13.1%) | 4.8% (4.4%–5.1%) | 5.2% (4.8%–5.5%) |
| >80 | 15.8% (15.0%–16.5%) | 3.8% (3.4%–4.1%) | 5.3% (4.9%–5.7%) |
| 10 y after surgery | |||
| Total population | 23.5% (23.0%–24.0%) | 8.3% (7.9%–8.6%) | 11.6% (11.2%–12.0%) |
| Sex | |||
| Men | 21.9% (21.3%–22.5%) | 8.8% (8.3%–9.2%) | 10.8% (10.4%–11.3%) |
| Women | 26.0% (25.2%–26.8%) | 7.4% (6.9%–7.9%) | 12.9% (12.3%–13.5%) |
| Age groups, y | |||
| <50 | 4.4% (3.6%–5.3%) | 1.3% (0.8%–1.8%) | 3.0% (2.3%–3.7%) |
| 50–59 | 10.2% (9.3%–11.2%) | 4.1% (3.5%–4.8%) | 5.1% (4.4%–5.8%) |
| 60–69 | 17.2% (16.4%–18.1%) | 8.2% (7.6%–8.9%) | 9.0% (8.4%–9.7%) |
| 70–79 | 29.0% (28.2%–29.8%) | 10.3% (9.7%–10.8%) | 14.4% (13.8%–15.1%) |
| >80 | 35.4% (34.1%–36.7%) | 8.2% (7.4%–8.9%) | 14.8% (13.8%–15.7%) |
| 15 y after surgery | |||
| Total population | 34.9% (34.3%–35.6%) | 11.0% (10.6%–11.4%) | 18.8% (18.2%–19.3%) |
| Sex | |||
| Men | 32.7% (31.9%–33.5%) | 11.6% (11.1%–12.2%) | 17.6% (16.9%–18.2%) |
| Women | 38.4% (37.4%–39.4%) | 9.9% (9.3%–10.5%) | 20.7% (19.8%–21.6%) |
| Age groups, y | |||
| <50 | 7.1% (5.8%–8.3%) | 1.8% (1.1%–2.5%) | 5.0% (3.9%–6.1%) |
| 50–59 | 15.9% (14.5%–17.3%) | 5.6% (4.7%–6.4%) | 8.5% (7.4%–9.6%) |
| 60–69 | 25.9% (24.7%–27.1%) | 11.0% (10.1%–11.8%) | 14.6% (13.6%–15.5%) |
| 70–79 | 42.0% (41.0%–43.0%) | 13.6% (12.9%–14.3%) | 22.9% (22.1%–23.8%) |
| >80 | 49.5% (47.9%–51.0%) | 10.7% (9.8%–11.7%) | 23.1% (21.8%–24.4%) |
| 20 y after surgery | |||
| Total population | 42.8% (41.9%–43.7%) | 12.8% (12.2%–13.3%) | 23.8% (23.0%–24.5%) |
| Sex | |||
| Men | 40.3% (39.3%–41.3%) | 13.6% (12.9%–14.2%) | 22.2% (21.4%–23.1%) |
| Women | 46.7% (45.4%–47.9%) | 11.5% (10.8%–12.3%) | 26.1% (25.0%–27.2%) |
| Age groups, y | |||
| <50 | 9.2% (7.5%–10.8%) | 2.1% (1.3%–2.9%) | 6.5% (5.0%–7.9%) |
| 50–59 | 20.3% (18.6%–22.1%) | 6.5% (5.4%–7.5%) | 10.9% (9.5%–12.3%) |
| 60–69 | 32.3% (30.8%–33.7%) | 12.6% (11.6%–13.6%) | 18.4% (17.2%–19.7%) |
| 70–79 | 50.7% (49.6%–51.9%) | 15.6% (14.8%–16.4%) | 28.5% (27.5%–29.6%) |
| >80 | 56.3% (54.8%–57.9%) | 12.0% (11.0%–13.0%) | 27.2% (25.7%–28.6%) |
Figure 1. Crude probability of cause‐specific death.
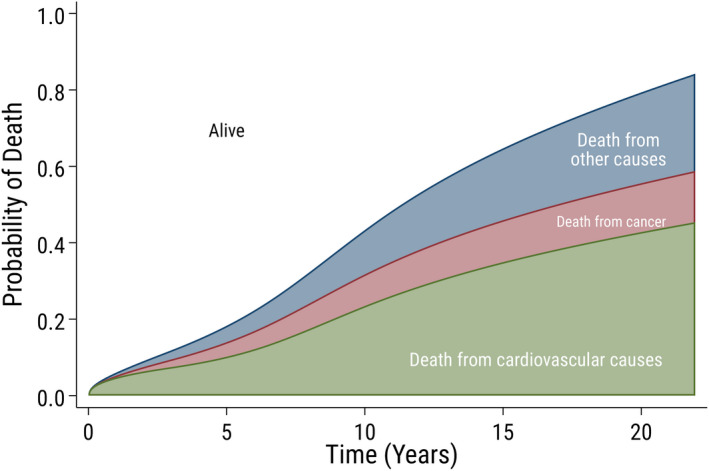
Crude probability of cause‐specific death over time since surgery in 33 108 patients who underwent aortic valve replacement in Sweden between 1997 and 2018. The white area shows the probability of being alive.
Figure 2. Crude probability of cause‐specific death according to sex and age.
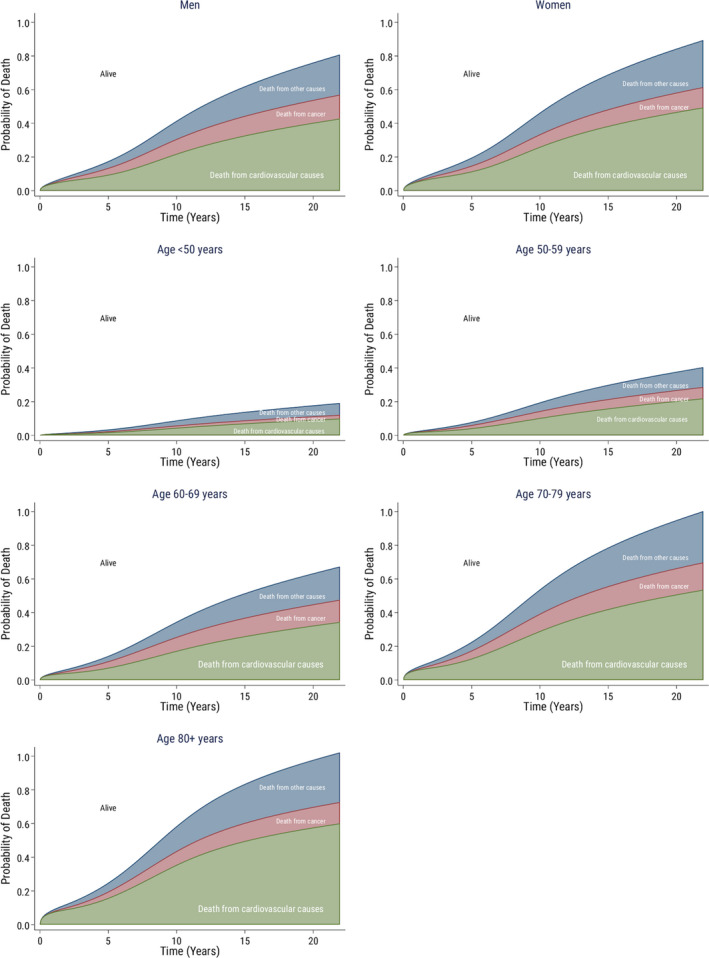
Crude probability of cause‐specific death over time since surgery according to sex and age in 33 108 patients who underwent aortic valve replacement in Sweden between 1997 and 2018. The white area shows the probability of being alive.
Relative Risk of Cause‐Specific Death
Standardized mortality ratios for cardiovascular, cancer‐related, and other causes of death were 1.79 (95% CI, 1.75–1.83), 1.00 (95% CI, 0.97–1.04), and 1.08 (95% CI, 1.05–1.12), respectively. In other words, the relative risks of cardiovascular and other causes of death were significantly higher in patients who underwent surgical AVR than in the general population. The relative risk of cardiovascular death was higher in younger patients. In patients aged 35 to 39 years, the standardized mortality ratio was 51.9 (95% CI, 27.9–96.4) compared with 1.27 (95% CI, 1.22–1.32) in patients >85 years old. The risk of death because of cancer was similar between those who underwent AVR and the general population. The risk of death from other causes was slightly higher in those who underwent AVR compared with the general population. The observed and expected deaths and standardized mortality ratios according to cause of death, stratified by age group and sex are shown in Table 3, and stratified by valve type and surgical procedure is shown in Table S3. Standardized mortality ratios for cardiovascular deaths according to age group are shown in Figure 3. Men and women had similar relative risks for both all‐cause mortality and cause‐specific mortality (Table 3). However, in younger age groups, the relative risk of cardiovascular death was higher in women than in men (Table S4 and Figure S5). The relative risk of cardiovascular death was higher in patients with mechanical compared with biological valve prostheses and in patients with combined procedures compared with isolated AVR. However, the relative risks of cardiovascular death was significantly higher with both mechanical and biological valves and with isolated AVR and combined procedures compared with the general population. In a sensitivity analysis excluding all patients who died during the first 90 postoperative days, the standardized mortality ratio for all‐cause, cardiovascular, cancer‐related, and other causes of death was 1.25 (95% CI, 1.22–1.27), 1.56 (95% CI, 1.52–1.59), 1.00 (95% CI, 0.96–1.04), and 1.04 (95% CI, 1.01–1.08), respectively (Table S5).
Table 3.
Observed and Expected Deaths and Standardized Mortality Ratios With 95% CIs for Different Causes of Deaths According to Sex and Age Groups in Patients Who Underwent Aortic Valve Replacement in Sweden Between 1997 and 2018
| All‐cause mortality n=14 237 (100%) | Cardiovascular death n=7778 (%) | Cancer death n=2483 (%) | Other death n=3976 (%) | |||||||||
|---|---|---|---|---|---|---|---|---|---|---|---|---|
| Observed | Expected | SMR (95% CI) | Observed | Expected | SMR (95% CI) | Observed | Expected | SMR (95% CI) | Observed | Expected | SMR (95% CI) | |
| Total population | 14 237 | 10 485.7 | 1.36 (1.34–1.38) | 7778 | 4346.8 | 1.79 (1.75–1.83) | 2483 | 2472.7 | 1.00 (0.97–1.04) | 3976 | 3666.3 | 1.08 (1.05–1.12) |
| Sex | ||||||||||||
| Men | 8391 | 6230.6 | 1.35 (1.32–1.38) | 4476 | 2538.0 | 1.76 (1.71–1.82) | 1631 | 1636.0 | 1.00 (0.95–1.05) | 2284 | 2056.6 | 1.11 (1.07–1.16) |
| Women | 5846 | 4255.1 | 1.37 (1.34–1.41) | 3302 | 1808.8 | 1.83 (1.76–1.89) | 852 | 836.7 | 1.02 (0.95–1.09) | 1692 | 1609.7 | 1.05 (1.00–1.10) |
| Age groups, y | ||||||||||||
| 20–24 | 0 | 0.25 | … | 0 | 0.01 | … | 0 | 0.02 | … | 0 | 0.22 | … |
| 25–29 | 3 | 0.54 | 5.59 (1.80–17.3) | 1 | 0.03 | 32.58 (4.59–231) | 0 | 0.05 | … | 2 | 0.46 | 4.39 (1.10–17.5) |
| 30–34 | 8 | 0.90 | 8.88 (4.44–17.8) | 3 | 0.06 | 46.69 (15.1–145) | 0 | 0.12 | … | 5 | 0.71 | 7.01 (2.92–16.8) |
| 35–39 | 20 | 1.7 | 11.66 (7.52–18.1) | 10 | 0.2 | 51.88 (27.9–96.4) | 2 | 0.3 | 5.82 (1.46–23.3) | 8 | 1.2 | 6.79 (3.39–13.6) |
| 40–44 | 23 | 3.9 | 5.90 (3.92–8.88) | 13 | 0.7 | 19.52 (11.3–33.6) | 2 | 0.9 | 2.11 (0.53–8.43) | 8 | 2.3 | 3.50 (1.75–7.00) |
| 45–49 | 54 | 9.4 | 5.73 (4.39–7.48) | 28 | 2.1 | 13.50 (9.32–19.6) | 7 | 2.6 | 2.66 (1.27–5.57) | 19 | 4.7 | 4.03 (2.57–6.32) |
| 50–54 | 89 | 24.1 | 3.69 (3.00–4.54) | 52 | 6.0 | 8.61 (6.56–11.3) | 10 | 7.9 | 1.27 (0.68–2.36) | 27 | 10.2 | 2.64 (1.81–3.86) |
| 55–59 | 215 | 64.7 | 3.32 (2.91–3.80) | 128 | 18.0 | 7.11 (5.98–8.45) | 37 | 24.3 | 1.52 (1.10–2.10) | 50 | 22.4 | 2.23 (1.69–2.94) |
| 60–64 | 428 | 169.2 | 2.53 (2.30–2.78) | 228 | 49.5 | 4.60 (4.04–5.24) | 96 | 68.8 | 1.40 (1.14–1.70) | 104 | 50.9 | 2.05 (1.69–2.48) |
| 65–69 | 837 | 389.7 | 2.15 (2.01–2.30) | 452 | 119.6 | 3.78 (3.45–4.15) | 187 | 161.0 | 1.16 (1.01–1.34) | 198 | 109.9 | 1.81 (1.58–2.09) |
| 70–74 | 1582 | 822.7 | 1.92 (1.83–2.02) | 835 | 271.5 | 3.08 (2.87–3.29) | 360 | 322.9 | 1.11 (1.01–1.24) | 387 | 228.3 | 1.70 (1.53–1.87) |
| 75–79 | 2499 | 1669.9 | 1.50 (1.44–1.56) | 1404 | 617.0 | 2.28 (2.16–2.40) | 525 | 550.0 | 0.95 (0.88–1.04) | 570 | 503.0 | 1.13 (1.04–1.23) |
| 80–84 | 3566 | 2743.8 | 1.30 (1.26–1.34) | 1909 | 1127.3 | 1.69 (1.62–1.77) | 685 | 687.2 | 1.00 (0.92–1.07) | 972 | 929.3 | 1.05 (0.98–1.11) |
| 85+ | 4913 | 4584.9 | 1.07 (1.04–1.10) | 2715 | 2134.8 | 1.27 (1.22–1.32) | 572 | 646.5 | 0.88 (0.82–0.96) | 1626 | 1803.6 | 0.90 (0.86–0.95) |
SMR indicates standardized mortality ratio.
Figure 3. Relative risk for cardiovascular mortality.
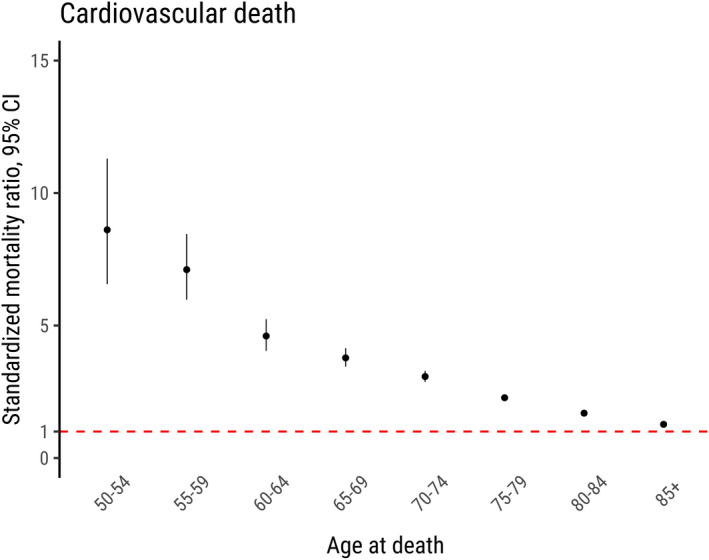
Standardized mortality ratios with 95% CIs for cardiovascular cause of death according to age (in years) in patients who underwent aortic valve replacement in Sweden between 1997 and 2018. The red dashed line marks a standardized mortality ratio of 1, that is, no difference in the risk of cardiovascular mortality between the study population and the general population.
Discussion
This study confirmed our previous finding that life expectancy following AVR is lower than in the general population. 1 Lower survival after AVR was explained by an increased relative risk of cardiovascular death. Compared with the general population, the risk of death from cardiovascular causes was higher in younger age groups, particularly in women. The risks of death from cancer‐related and other causes were similar to those in the general population.
McClure et al analyzed outcomes, including cause of death in 1701 consecutive patients aged <65 years who underwent surgical AVR between 1992 and 2011 and were followed‐up for maximum 18 years. 22 They studied late outcomes in patients who received biological and mechanical valve prostheses and found that 27% of all deaths were cardiac related. The most common cardiac cause of death was cardiac arrest and/or myocardial infarction. However, the cause of death was unknown in 43% of cases, and as indicated by the authors, it was therefore likely the percentage of cardiac‐related deaths was substantially higher than 27%. In the present study, the 15‐ and 20‐year cumulative risk of cardiovascular death was 35% and 43%, respectively, and are likely consistent with the results reported by McClure et al 22 when considering the large proportion of unknown cause of death in their study and the older age in ours.
Another trial, performed by Hammermeister et al, which reported outcomes up to 16 years in 394 men who underwent AVR between 1977 and 1982, found that 58% of all deaths were either prosthesis or cardiac related. 23 These observations suggest the existence of even higher proportions of cardiovascular deaths than in our study, although the patients included in the study by Hammermeister et al underwent surgery up to 4 decades ago, partially with prostheses no longer on the market, which limits generalizability to contemporary patient populations.
Theut et al analyzed the cause of death in all 617 patients who underwent transcatheter AVR at Rigshospitalet, Denmark, between 2007 and 2014, and compared the results with an age‐ and sex‐matched background population. 2 They found that cardiovascular deaths were more common in those who underwent transcatheter AVR compared with the general population during the first 90 postoperative days. After 90 days, an increased relative risk of death was present only in patients with low‐flow aortic stenosis and in those with high preoperative risk. In the study by Theut et al, the mean age of the study population was 80 years, compared with 69 years in ours. The age difference may explain the discrepancy in results regarding cardiovascular deaths over the long term, because in contrast to younger patients, patients >80 years old have a life expectancy similar to that of the general population. 1 It is therefore plausible that older patients also have a relative risk of cardiovascular death similar to that of the general population.
Our study provides robust data on the causes of death following surgical AVR in a nationwide, contemporary cohort including over 33 000 patients with long‐term follow‐up. Furthermore, this study provides a reliable estimation of the relative risk of cause‐specific death, which was possible because of the high quality of Swedish national registers.
The risk of death from cardiovascular causes was almost twice as high after undergoing AVR compared with the reference population and explains the reduced life expectancy observed following AVR. Prosthetic aortic valves pose an inevitable risk of complications, both over the short and long term, although our results also raise questions concerning the optimal timing of surgery in patients with aortic valve disease.
It is possible that the patients in our study had already experienced irreversible myocardial damage before surgery. 24 In such cases, the increased relative risk of cardiovascular death can hypothetically be reduced by undergoing surgery earlier. Considering the higher relative risk of cardiovascular death in younger patients (especially in women), undergoing surgery earlier may be particularly important in this patient population. However, further research is needed to confirm this hypothesis and to analyze the reasons for the higher relative risk of cardiovascular death in younger women. Although this finding is highly interesting, it must be interpreted with caution owing to the limited number of events in women below 60 years.
Another potential explanation for shorter life expectancy and increased risk of cardiovascular death following AVR is therapeutic inertia; that is, failure to initiate or intensify therapy when treatment goals are not met. 25 Poor guideline implementation and failure to integrate new knowledge into clinical practice contribute to therapeutic inertia, although the problem is multifactorial and includes clinician, patient, health care system, and policy factors. 25 Within the context of AVR, suboptimal postoperative follow‐up may include lack of structured follow‐up with annual visits 5 and the fact that it may take longer than necessary before possible complications are diagnosed and treated. Optimizing follow‐up after AVR remains an important area for future research.
Strengths and Limitations
We recognize that the quality of the cause of death register is dependent on the quality with which the physicians certify the cause of death. However, the limitations of the Swedish Cause of Death register have been well described, and the agreement between medical records and the death certificates for cardiovascular disease is almost 90%. 17 Notable strengths of our study include the nationwide and population‐based design, long‐term follow‐up period, and large number of patients, which increase its generalizability. Additionally, because of the accuracy of Swedish health‐data registries, data quality in this study was high and follow‐up was complete. The cause‐specific death rates in the study cohort were compared with an age‐, sex‐, and calendar‐year matched general population. However, it remains possible that other patient characteristics differed between the study and general populations. Furthermore, although it is noteworthy that we examined mortality and causes of death, we did not examine other aspects of health following AVR, such as quality of life and the rate of reoperations and repeat hospitalizations.
Conclusions
We found that life expectancy in patients who underwent AVR was lower than in the general population. Lower survival after AVR was explained by an increased relative risk of cardiovascular death. Compared with the general population, the risk of death from cardiovascular causes was higher in younger age groups. Future studies should focus on the role of earlier surgery in patients with asymptomatic aortic stenosis and optimizing treatment and follow‐up after AVR.
Sources of Funding
This work was supported by the Swedish Heart‐Lung Foundation (grant number 20190570 to NG, and grant numbers 20160522, 20160525, and 20180400 to US); the Swedish Society of Medicine (grant number SLS‐934749 to NG); a clinical postdoctoral appointment from Region Stockholm (grant number FoUI‐955489 to NG), a regional ALF agreement between Stockholm County Council and the Karolinska Institutet (grant number FoUI‐954783 to NG, and grant number 20180114 to US); Capio Research Foundation (grant number 2019‐3239 to NG); Eva and Oscar Ahrén Research Foundation (to NG); the Seraphim Hospital Foundation (to NG); the Åke Wiberg Foundation (grant number M18‐0016 to US); the Karolinska Institutet Foundations and Funds (grant number 2018‐01784 to US); and a donation from Mr Fredrik Lundberg (to AFC).
Disclosures
None.
Supporting information
Tables S1–S5
Figures S1–S5
Acknowledgments
We thank the SWEDEHEART steering committee for providing data for this study.
Supplementary Material for this article is available at https://www.ahajournals.org/doi/suppl/10.1161/JAHA.121.022627
For Sources of Funding and Disclosures, see pages 9 and 10.
References
- 1. Glaser N, Persson M, Jackson V, Holzmann MJ, Franco‐Cereceda A, Sartipy U. Loss in life expectancy after surgical aortic valve replacement: SWEDEHEART study. J Am Coll Cardiol. 2019;74:26–33. doi: 10.1016/j.jacc.2019.04.053 [DOI] [PubMed] [Google Scholar]
- 2. Theut M, Thygesen JB, De Backer O, Sondergaard L. Survival and cause of death after transcatheter aortic valve replacement as compared to an age‐ and sex‐matched background population. EuroIntervention. 2017;13:e1058–e1066. doi: 10.4244/EIJ-D-17-00147 [DOI] [PubMed] [Google Scholar]
- 3. Amrane H, Deeb GM, Popma JJ, Yakubov SJ, Gleason TG, Van Mieghem NM, Reardon MJ, Group STCoDW . Causes of death in intermediate‐risk patients: the randomized surgical replacement and transcatheter aortic valve implantation trial. J Thorac Cardiovasc Surg. 2019;158:718–728.e3. doi: 10.1016/j.jtcvs.2018.11.129 [DOI] [PubMed] [Google Scholar]
- 4. Otto CM, Nishimura RA, Bonow RO, Carabello BA, Erwin JP III, Gentile F, Jneid H, Krieger EV, Mack M, McLeod C, et al. 2020 ACC/AHA guideline for the management of patients with valvular heart disease: a report of the American College of Cardiology/American Heart Association joint committee on clinical practice guidelines. Circulation. 2021;143:e72–e227. doi: 10.1161/CIR.0000000000000923 [DOI] [PubMed] [Google Scholar]
- 5. Baumgartner H, Falk V, Bax JJ, De Bonis M, Hamm C, Holm PJ, Iung B, Lancellotti P, Lansac E, Rodriguez Munoz D, et al. 2017 ESC/EACTS guidelines for the management of valvular heart disease. Eur Heart J. 2017;38:2739–2791. doi: 10.1093/eurheartj/ehx391 [DOI] [PubMed] [Google Scholar]
- 6. Kang DH, Park SJ, Lee SA, Lee S, Kim DH, Kim HK, Yun SC, Hong GR, Song JM, Chung CH, et al. Early surgery or conservative care for asymptomatic aortic stenosis. N Engl J Med. 2020;382:111–119. doi: 10.1056/NEJMoa1912846 [DOI] [PubMed] [Google Scholar]
- 7. Durko AP, Kappetein AP. Long‐term survival after surgical aortic valve replacement: expectations and reality. J Am Coll Cardiol. 2019;74:34–35. doi: 10.1016/j.jacc.2019.05.008 [DOI] [PubMed] [Google Scholar]
- 8. Baumgartner H, Iung B, Otto CM. Timing of intervention in asymptomatic patients with valvular heart disease. Eur Heart J. 2020;41:4349–4356. doi: 10.1093/eurheartj/ehaa485 [DOI] [PubMed] [Google Scholar]
- 9. Crea F. Challenges in risk stratification of symptomatic and asymptomatic valvular heart disease: lessons from large observational studies. Eur Heart J. 2020;41:4289–4292. doi: 10.1093/eurheartj/ehaa951 [DOI] [PubMed] [Google Scholar]
- 10. Everett RJ, Tastet L, Clavel MA, Chin CWL, Capoulade R, Vassiliou VS, Kwiecinski J, Gomez M, van Beek EJR, White AC, et al. Progression of hypertrophy and myocardial fibrosis in aortic stenosis: a multicenter cardiac magnetic resonance study. Circ Cardiovasc Imaging. 2018;11:e007451. doi: 10.1161/CIRCIMAGING.117.007451 [DOI] [PMC free article] [PubMed] [Google Scholar]
- 11. Benchimol EI, Smeeth L, Guttmann A, Harron K, Moher D, Petersen I, Sorensen HT, von Elm E, Langan SM, Committee RW. The reporting of studies conducted using observational routinely‐collected health data (RECORD) statement. PLoS Medicine. 2015;12:e1001885. doi: 10.1371/journal.pmed.1001885 [DOI] [PMC free article] [PubMed] [Google Scholar]
- 12. von Elm E, Altman DG, Egger M, Pocock SJ, Gotzsche PC, Vandenbroucke JP, Initiative S. The strengthening the reporting of observational studies in epidemiology (STROBE) statement: guidelines for reporting observational studies. J Clin Epidemiol. 2008;61:344–349. doi: 10.1016/j.jclinepi.2007.11.008 [DOI] [PubMed] [Google Scholar]
- 13. Jernberg T, Attebring MF, Hambraeus K, Ivert T, James S, Jeppsson A, Lagerqvist B, Lindahl B, Stenestrand U, Wallentin L. The Swedish Web‐system for enhancement and development of evidence‐based care in heart disease evaluated according to recommended therapies (SWEDEHEART). Heart. 2010;96:1617–1621. doi: 10.1136/hrt.2010.198804 [DOI] [PubMed] [Google Scholar]
- 14. Vikholm P, Ivert T, Nilsson J, Holmgren A, Freter W, Ternstrom L, Ghaidan H, Sartipy U, Olsson C, Granfeldt H, et al. Validity of the Swedish cardiac surgery registry. Interact Cardiovasc Thorac Surg. 2018;27:67–74. doi: 10.1093/icvts/ivy030 [DOI] [PubMed] [Google Scholar]
- 15. Ludvigsson JF, Andersson E, Ekbom A, Feychting M, Kim JL, Reuterwall C, Heurgren M, Olausson PO. External review and validation of the Swedish national inpatient register. BMC Public Health. 2011;11:450. doi: 10.1186/1471-2458-11-450 [DOI] [PMC free article] [PubMed] [Google Scholar]
- 16. Ludvigsson JF, Svedberg P, Olen O, Bruze G, Neovius M. The longitudinal integrated database for health insurance and labour market studies (LISA) and its use in medical research. Eur J Epidemiol. 2019;34:423–437. doi: 10.1007/s10654-019-00511-8 [DOI] [PMC free article] [PubMed] [Google Scholar]
- 17. Brooke HL, Talback M, Hornblad J, Johansson LA, Ludvigsson JF, Druid H, Feychting M, Ljung R. The Swedish cause of death register. Eur J Epidemiol. 2017;32:765–773. doi: 10.1007/s10654-017-0316-1 [DOI] [PMC free article] [PubMed] [Google Scholar]
- 18. Ludvigsson JF, Otterblad‐Olausson P, Pettersson BU, Ekbom A. The Swedish personal identity number: possibilities and pitfalls in healthcare and medical research. Eur J Epidemiol. 2009;24:659–667. doi: 10.1007/s10654-009-9350-y [DOI] [PMC free article] [PubMed] [Google Scholar]
- 19. Glaser N, Jackson V, Holzmann MJ, Franco‐Cereceda A, Sartipy U. Aortic valve replacement with mechanical vs. biological prostheses in patients aged 50–69 years. Eur Heart J. 2016;37:2658–2667. doi: 10.1093/eurheartj/ehv580 [DOI] [PubMed] [Google Scholar]
- 20. The statistical database from the Swedish national board of health and welfare . https://www.socialstyrelsen.se/en/statistics‐and‐data/statistics/statistical‐databases/ Last accessed 12 October 2021
- 21. Mozumder SI, Rutherford MJ, Lambert PC. Stpm2cr: a flexible parametric competing risks model using a direct likelihood approach for the cause‐specific cumulative incidence function. Stata J. 2017;17:462–489. doi: 10.1177/1536867X1701700212 [DOI] [PMC free article] [PubMed] [Google Scholar]
- 22. McClure RS, McGurk S, Cevasco M, Maloney A, Gosev I, Wiegerinck EM, Salvio G, Tokmaji G, Borstlap W, Nauta F, et al. Late outcomes comparison of nonelderly patients with stented bioprosthetic and mechanical valves in the aortic position: a propensity‐matched analysis. J Thorac Cardiovasc Surg. 2014;148:1931–1939. doi: 10.1016/j.jtcvs.2013.12.042 [DOI] [PubMed] [Google Scholar]
- 23. Hammermeister K, Sethi GK, Henderson WG, Grover FL, Oprian C, Rahimtoola SH. Outcomes 15 years after valve replacement with a mechanical versus a bioprosthetic valve: final report of the veterans affairs randomized trial. J Am Coll Cardiol. 2000;36:1152–1158. doi: 10.1016/S0735-1097(00)00834-2 [DOI] [PubMed] [Google Scholar]
- 24. Tastet L, Tribouilloy C, Marechaux S, Vollema EM, Delgado V, Salaun E, Shen M, Capoulade R, Clavel MA, Arsenault M, et al. Staging cardiac damage in patients with asymptomatic aortic valve stenosis. J Am Coll Cardiol. 2019;74:550–563. doi: 10.1016/j.jacc.2019.04.065 [DOI] [PubMed] [Google Scholar]
- 25. Dixon DL, Sharma G, Sandesara PB, Yang E, Braun LT, Mensah GA, Sperling LS, Deedwania PC, Virani SS. Therapeutic inertia in cardiovascular disease prevention: time to move the bar. J Am Coll Cardiol. 2019;74:1728–1731. doi: 10.1016/j.jacc.2019.08.014 [DOI] [PubMed] [Google Scholar]
Associated Data
This section collects any data citations, data availability statements, or supplementary materials included in this article.
Supplementary Materials
Tables S1–S5
Figures S1–S5