

ABSTRACT
Trees associating with different mycorrhizas often differ in their effects on litter decomposition, nutrient cycling, soil organic matter (SOM) dynamics, and plant-soil interactions. For example, due to differences between arbuscular mycorrhizal (AM) and ectomycorrhizal (ECM) tree leaf and root traits, ECM-associated soil has lower rates of C and N cycling and lower N availability than AM-associated soil. These observations suggest that many groups of nonmycorrhizal fungi should be affected by the mycorrhizal associations of dominant trees through controls on nutrient availability. To test this overarching hypothesis, we explored the influence of predominant forest mycorrhizal type and mineral N availability on soil fungal communities using next-generation amplicon sequencing. Soils from four temperate hardwood forests in southern Indiana, United States, were studied; three forests formed a natural gradient of mycorrhizal dominance (100% AM tree basal area to 100% ECM basal area), while the fourth forest contained a factorial experiment testing long-term N addition in both dominant mycorrhizal types. We found that overall fungal diversity, as well as the diversity and relative abundance of plant pathogenic and saprotrophic fungi, increased with greater AM tree dominance. Additionally, tree community mycorrhizal associations explained more variation in fungal community composition than abiotic variables, including soil depth, SOM content, nitrification rate, and mineral N availability. Our findings suggest that tree mycorrhizal associations may be good predictors of the diversity, composition, and functional potential of soil fungal communities in temperate hardwood forests. These observations help explain differing biogeochemistry and community dynamics found in forest stands dominated by differing mycorrhizal types.
IMPORTANCE Our work explores how differing mycorrhizal associations of temperate hardwood trees (i.e., arbuscular [AM] versus ectomycorrhizal [ECM] associations) affect soil fungal communities by altering the diversity and relative abundance of saprotrophic and plant-pathogenic fungi along natural gradients of mycorrhizal dominance. Because temperate hardwood forests are predicted to become more AM dominant with climate change, studies examining soil communities along mycorrhizal gradients are necessary to understand how these global changes may alter future soil fungal communities and their functional potential. Ours, along with other recent studies, identify possible global trends in the frequency of specific fungal functional groups responsible for nutrient cycling and plant-soil interactions as they relate to mycorrhizal associations.
KEYWORDS: fungal functional diversity, mycorrhiza-associated nutrient economy, MANE, nitrogen deposition, plant-microbe interactions, temperate hardwood forests, spillover effects
INTRODUCTION
Mycorrhizal fungi are well known for their effects on plant-soil interactions, particularly through enhancing plant nutrient uptake from the soil. However, the type of mycorrhizal association of a plant may explain a much broader array of processes affecting soil biogeochemistry and plant community dynamics (1). In temperate forests, the decomposition of labile leaf litter from arbuscular mycorrhizal (AM) trees by saprotrophic fungi induces greater soil mineral nutrient availability (2, 3) and greater amounts of N-rich mineral-associated organic matter (4, 5) than lignin-rich, high-C:N leaf litter from ectomycorrhizal (ECM) trees (6, 7). The direction of plant-soil feedback is also structured by mycorrhizal type, with ECM trees experiencing positive feedback and AM trees experiencing negative feedback (8–10). These differences imply that the effects of the mycorrhizal type of dominant plants extend beyond mycorrhizal fungi alone to include saprotrophic and pathogenic fungi. As tree species’ ranges shift due to global change factors, temperate forests are expected to become more AM dominant (11, 12) and may therefore experience changes in these broad processes. Thus, there is a pressing need to study concomitant changes between mycorrhizal dominance and soil fungal communities if we are to understand the full impact that shifts in mycorrhizal dominance will have in temperate forests.
Soil fungal communities are likely influenced by mycorrhizal associations both through direct interactions between free-living and mycorrhizal fungi and through differences in leaf and root litter quality between AM and ECM trees. AM fungi have limited saprotrophic capabilities and primarily scavenge for mineral nutrients released from the decomposition of plant tissue by saprotrophic fungi (13, 14). Conversely, many ECM fungi have saprotrophic capabilities and produce extracellular enzymes that decompose plant tissue to acquire organic forms of nutrients (15, 16). Direct competition between ECM and saprotrophic fungi therefore has the potential to reduce saprotroph relative abundances and diversity, in addition to rates of litter decomposition (17–19). ECM fungi also likely provide a greater defensive benefit to host trees than AM fungi by covering the outer surface of roots with a protective sheath, weakening the effects of plant pathogens on ECM trees (20, 21).
Similarly, differences in leaf litter quality between AM and ECM tree species may indirectly affect fungal community composition. The breakdown of N-rich, labile AM leaf litter results in increased mineral N availability and changes soil organic matter (SOM) content relative to ECM soil (2, 3, 7). Higher available soil resources such as N can affect fungal diversity (22, 23) and biomass (24, 25), leading to notable increases in fungal species richness (26). Furthermore, a positive relationship has been observed between soil resource availability and plant disease severity, particularly for AM trees (27, 28), suggesting that labile AM leaf litter with increased N content may also lead to increased plant pathogen presence or diversity. When considered together, the direct and indirect interactions between mycorrhizas and soil fungi should lead to lower fungal diversity and decreased saprotroph and plant pathogen relative abundances in ECM soil than in AM soil, as recently observed in one study of Baltic temperate and boreal forests (29).
As described above, N availability is a major factor driving the hypothesized effects of dominant mycorrhizal type on soil fungal communities. Increasing the supply of N in an ectomycorrhizal system should facilitate saprotrophic activity on otherwise N-poor litter by alleviating competitive interactions between ECM and saprotrophic fungi (as well as necrotrophic fungal pathogens that live saprotrophically between hosts). While soil N availability is strongly influenced by leaf litter chemistry and microbial activity, anthropogenic N deposition is now an important source of available soil N, which may disrupt systems such as ECM symbioses that are adapted to low soil resource conditions. Nitrogen deposition has been associated with an increasing abundance of AM tree species (11) and also alters SOM content in different ways depending on dominant tree species (30, 31). Importantly, increased anthropogenic N deposition has been shown to alter soil fungal community composition (32, 33), leading to increased saprotroph diversity and decreased ECM fungal diversity in forest soil (34, 35). Furthermore, increases in soil N availability may increase plant pathogen diversity (26, 27). Thus, the effects of anthropogenic N deposition on fungal community composition may be particularly strong in ECM-dominated systems where elevated N can alleviate competitive interactions, reducing ECM fungal activity on leaf litter while increasing saprotrophic fungal activity. AM tree-associated fungal communities, on the other hand, may see little response to N deposition as a result of their already faster mineral N cycling and greater mineral N availability.
In this study, we explored how the taxonomic and functional composition of soil fungal communities differ in relation to AM or ECM tree species dominance and change in response to experimental mineral N addition in temperate hardwood forests. Our study employed two sampling designs to test our overarching hypothesis: one is a natural gradient consisting of plots ranging from 100% AM trees to 100% ECM trees across three temperate forests. The other sampling design is a complete factorial experiment in which forest plots of AM or ECM tree dominance have been subjected to a long-term mineral N addition experiment. Based on the above-mentioned influences on communities of free-living soil fungi within differing mycorrhizal systems, we tested the following two predictions: soil associated with forest stands dominated by AM trees will have greater fungal taxonomic diversity (prediction 1 [P1]) and higher relative abundances of plant-pathogenic and saprotrophic fungi (P2) than soil associated with ECM trees. We also tested a third prediction specific to N deposition (P3), i.e., that elevating available N will increase the relative abundances of plant-pathogenic and saprotrophic fungi and that this effect will be stronger in ECM-dominant forest stands.
RESULTS
Fungal community response to the gradient in mycorrhizal types.
For samples from the mycorrhizal gradient sites, 133,824 sequences (after rarefaction) representing 11,729 operational taxonomic units (OTUs) were assigned to 1,347 unique fungal taxa. All Hill numbers, 0D or OTU richness (R2 = 23.2%), 1D or exponential Shannon-Wiener diversity index (R2 = 21.6%), and 2D or inverse Simpson index (R2 = 16.2%), displayed a significant, positive trend with increasing AM tree dominance (df = 41; P < 0.005) (Fig. 1a to c), in agreement with our first prediction (fungal diversity is greater in AM soil). Examining the changes in diversity for each functional group revealed that biotrophic plant pathogen (R2 = 13.3%), necrotrophic plant pathogen (R2 = 15.6%), and primary saprotroph (R2 = 32.2%) OTU richness values significantly increased with AM tree dominance (P < 0.02) (Fig. 2a to c), while 1D and 2D were not significantly affected. Meanwhile, ectomycorrhizal fungal OTU richness showed the opposite trend, significantly decreasing with increasing AM tree dominance (P < 0.001; R2 = 24.7%) (Fig. 2d), while 1D and 2D were not significantly correlated.
FIG 1.
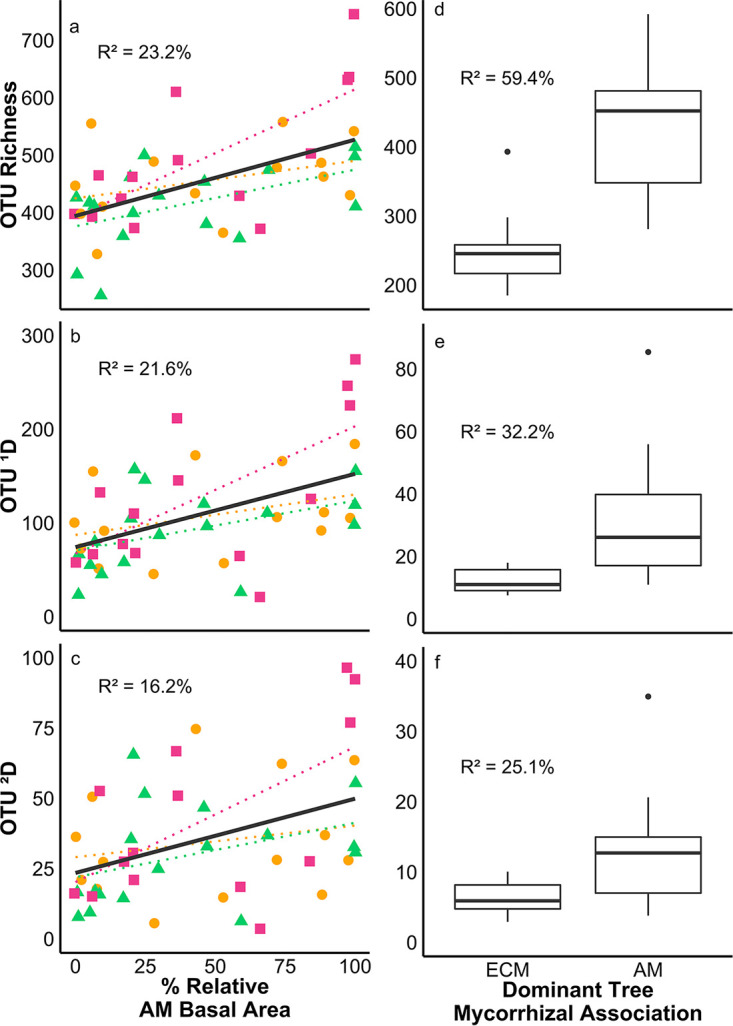
Overall fungal OTU richness (0D), 1D, and 2D from sites forming natural gradients of mycorrhizal dominance (circles, Griffy Woods; triangles, Lilly-Dickey Woods; squares, Morgan-Monroe State Forest) (a to c) and plots with >85% relative basal area of ECM or AM trees from Moores Creek (d to f). Colored regression lines correspond to each individual site, while the black regression line and reported R2 value correspond to the entire linear model conducted with site as a random effect.
FIG 2.

OTU richness (0D), 1D, and 2D for biotrophic pathogens, necrotrophic pathogens, primary saprotrophs, and ectomycorrhizal fungi from sites forming natural gradients of mycorrhizal dominance (circles, Griffy Woods; triangles, Lilly-Dickey Woods; squares, Morgan-Monroe State Forest) (a to d) and plots with >85% relative basal area of ECM or AM trees from Moores Creek (e to h). Colored regression lines correspond to each individual site, while the black regression line and reported R2 value correspond to the entire linear model conducted with site as a random effect. n.s., nonsignificant.
Redundancy analyses (RDAs) revealed that both AM tree dominance and site location affected fungal community composition at every taxonomic rank, explaining from 4.7% of the variation at the OTU rank up to 43.3% at the rank of phyla (P < 0.05) (Table 1). When analyzed separately, AM tree dominance explained approximately twice as much variance as site at all taxonomic ranks except species and OTU (Table 1). Results from the stepwise forward selection RDAs with abiotic data as explanatory variables indicated that for genera through phyla, nitrification was the only significant variable selected, whereas SOM and nitrification were both selected at the species and OTU ranks (Table 1). Significant abiotic variables (P < 0.05) explained a similar level of variation in fungal community composition as did AM tree dominance at every taxonomic rank. The nitrification rate was positively correlated with increasing AM tree dominance (P < 0.001; R2 = 50.0%).
TABLE 1.
Adjusted R2 values from RDAs conducted on fungal community composition in samples representing a gradient of mycorrhizal types expressed as percent of variance explaineda
| Explanatory variable(s) | % of variance |
|||||||
|---|---|---|---|---|---|---|---|---|
| Phylum | Class | Order | Family | Genus | Species | OTU | Functional group | |
| AM % + site | 43.3 | 30.0 | 18.7 | 16.8 | 13.9 | 8.5 | 4.7 | 33.3 |
| AM % | 27.1 | 19.5 | 11.6 | 11.5 | 9.2 | 4.5 | 2.6 | 26.6 |
| Site | 15.3 | 9.8 | 6.6 | 5.1 | 4.6 | 4.1 | 2.1 | 6.5 |
| Soil properties | 26.5b | 22.1b | 12.3b | 11.9b | 10.2b | 7.1c | 3.8c | n.s. |
Sites include Griffy Woods, Lilly-Dickey Woods, and Morgan-Monroe State Forest. A value displayed in the table indicates that the explanatory variable was significant (α = 0.05). n.s., not significant.
Nitrification identified as significant during the stepwise, forward selection RDA.
SOM and nitrification identified as significant during the stepwise, forward selection RDA.
Linear modeling of relative abundances of separate functional groups was used to test our second prediction (relative abundances of fungal plant pathogens and saprotrophs are greater in AM tree-dominant soil than ECM tree-dominant soil). Fungal biotrophic plant pathogen (R2 = 11.5%), necrotrophic plant pathogen (R2 = 14.9%), and primary saprotroph (R2 = 28.3%) relative abundances all significantly increased with increasing AM tree dominance, while ectomycorrhizal fungal (R2 = 39.6%) relative abundances decreased (P < 0.05) (Fig. 3a to d). According to the RDA, AM tree dominance and site location explained 33.3% of the variation in fungal functional group frequency (Table 1). No abiotic variables were selected as significant explanatory factors for fungal functional groups. Note that these functional group abundances were obtained from the lowest taxonomic level identified wherever possible, often genus or species. Table 2 displays relative abundances of fungal families with >1% average relative abundance in AM tree- or ECM tree-dominant soils along with the major functional groups assigned to various taxa found within each family. Ten out of 15 families containing plant biotrophic, plant necrotrophic, and saprotrophic members increased in relative abundance in AM-tree dominant soil. Notable exceptions include the Atheliaceae, Cortinariaceae, Thelephoraceae, and Tricholomataceae (all Basidiomycota), which decreased in relative abundance in AM tree-dominant soil but which also contain ectomycorrhizal taxa in addition to their saprotrophic members. Similarly, four families dominated by ectomycorrhizal members (Russulaceae, Amanitaceae, Clavulinaceae, and Boletaceae) decreased in relative abundance in AM tree-dominant soil, with the Russulaceae (Basidiomycota) demonstrating the largest change (a decrease) in relative abundance of 55.5%. On the other hand, the ectomycorrhizal families Inocybaceae (Basidiomycota), Sebacinaceae (Basidiomycota), and Tuberaceae (Ascomycota) increased in relative abundance in AM tree-dominant soil (although their variance explained was <3%).
FIG 3.

Percent relative abundances of biotrophic pathogens, necrotrophic pathogens, primary saprotrophs, and ectomycorrhizal fungi from sites forming natural gradients of mycorrhizal dominance (circles, Griffy Woods; triangles, Lilly-Dickey Woods; squares, Morgan-Monroe State Forest) (a to d) and plots with >85% relative basal area of ECM or AM trees from Moores Creek (e to h). Colored regression lines correspond to each individual site, while the black regression line and reported R2 value correspond to the entire linear model conducted with site as a random effect.
TABLE 2.
Fungal families with an average relative abundance of >1% from the mycorrhizal gradient across Griffy Woods, Lilly-Dickey Woods, and Morgan-Monroe State Forest
| Phylum | Family | Functional rolea | R 2 b | Relative abundance (%)b |
||
|---|---|---|---|---|---|---|
| AM tree-dominant soil | Intermediate soil | ECM tree-dominant soil | ||||
| Ascomycota | Tuberaceae | Ectomycorrhizal | 1.1 | 1.6 ± 3.51 | 0.69 ± 0.75 | 1.08 ± 1.39 |
| Nectriaceae | Necrotroph or primary saprotroph | 32.75 | 1.42 ± 0.78 | 0.5 ± 0.32 | 0.52 ± 1.05 | |
| Mycosphaerellaceae | Necrotroph or various | 21.34 | 2.57 ± 2.14 | 1.78 ± 2.3 | 1.05 ± 1.55 | |
| Helotiaceae | Necrotroph, primary or wood saprotroph, ectomycorrhizal, ericoid mycorrhizal, endophyte, or various | 12.41 | 3.91 ± 4.34 | 2.01 ± 0.97 | 1.92 ± 1.29 | |
| Herpotrichiellaceae | Necrotroph, primary or wood saprotroph, endophyte, or various | 3.2 | 1.31 ± 0.72 | 0.63 ± 0.31 | 1.09 ± 0.73 | |
| Helotiales (inc. sed.) | Necrotroph, primary saprotroph, ectomycorrhizal, endophyte, various, or unknown | 20.04 | 2.34 ± 1.75 | 1.82 ± 1.4 | 1.04 ± 0.96 | |
| Dermateaceae | Necrotroph, primary saprotroph, unknown, or various | 2.41 | 0.59 ± 0.39 | 1.9 ± 3.77 | 1.09 ± 1.51 | |
| Hyaloscyphaceae | Primary or wood saprotroph, endophyte, fungal parasite, or various | 2.08 | 1.55 ± 1.67 | 0.8 ± 0.55 | 0.89 ± 0.75 | |
| Clavicipitaceae | Primary saprotroph or fungal parasite | 30.02 | 1.24 ± 0.95 | 0.53 ± 0.29 | 0.48 ± 0.3 | |
| Basidiomycota | Hygrophoraceae | Biotroph, primary saprotroph, ectomycorrhizal, or various | 15.86 | 5.17 ± 6.96 | 1.22 ± 1.34 | 1.74 ± 2.5 |
| Russulaceae | Ectomycorrhizal | 22.26 | 17.5 ± 14.8 | 31.5 ± 14.5 | 31.5 ± 13.7 | |
| Inocybaceae | Ectomycorrhizal | 0.24 | 3.6 ± 4.61 | 3.16 ± 2.93 | 2.2 ± 2.49 | |
| Amanitaceae | Ectomycorrhizal | 12.53 | 0.15 ± 0.19 | 0.76 ± 1.13 | 1.29 ± 2.24 | |
| Sebacinaceae | Ectomycorrhizal or various | 2.77 | 5.64 ± 6.34 | 5.7 ± 4.25 | 3.11 ± 3.65 | |
| Clavulinaceae | Ectomycorrhizal or various | 1.81 | 0.68 ± 0.65 | 0.6 ± 0.88 | 1.79 ± 2.99 | |
| Boletaceae | Ectomycorrhizal or various | 3.26 | 0.73 ± 0.87 | 0.53 ± 0.54 | 1.59 ± 3.37 | |
| Trimorphomycetaceae | Fungal parasite or various | 11.96 | 1.11 ± 0.77 | 0.67 ± 0.56 | 0.65 ± 0.35 | |
| Atheliaceae | Necrotroph, primary saprotroph, ectomycorrhizal, or various | 18.07 | 1.16 ± 0.94 | 4.63 ± 5.3 | 10.5 ± 13.9 | |
| Cortinariaceae | Primary saprotroph or ectomycorrhizal | 8.43 | 0.49 ± 0.37 | 6.26 ± 13.9 | 5.92 ± 11.8 | |
| Clavariaceae | Primary saprotroph or various | 37.31 | 2.5 ± 2.39 | 1.07 ± 0.68 | 0.64 ± 1.14 | |
| Tricholomataceae | Primary saprotroph, ectomycorrhizal, or various | 4.22 | 0.49 ± 0.45 | 0.52 ± 0.76 | 3.04 ± 7.6 | |
| Thelephoraceae | Primary saprotroph, ectomycorrhizal, or various | 6.04 | 4.09 ± 3.5 | 5.69 ± 4.71 | 6.04 ± 3.58 | |
| Zygomycota | Mortierellaceae | Primary saprotroph | 21.69 | 17.9 ± 11.1 | 13.2 ± 12.1 | 7.45 ± 7.5 |
Functional role includes all taxa present in each family. “Biotroph” and “necrotroph” designations are specific to plant pathogens and do not include animal or fungal pathogens. The “various” designation was used for taxa within a family that were assigned multiple functional roles that remained unresolved after a thorough literature search.
Average relative abundances and standard deviations were obtained from plots with >65% relative basal area of one mycorrhizal type (AM or ECM dominant) and from plots with <60% relative basal area of both mycorrhizal types (“intermediate”). Adjusted R2 values reported are from the redundancy analysis performed at the family rank. Relative abundance values are displayed as percentages and include standard deviations.
Dominant mycorrhizal type × nitrogen amendment factorial experiment.
For samples from the nitrogen amendment experiment, 7,570,288 sequences (after rarefaction) representing 2,180 unique OTUs were assigned to 492 different taxa. Redundancy analysis indicated that dominant mycorrhizal type significantly affected fungal community composition, explaining from 9.7% of the variation at the OTU rank up to 42.7% of the variation at the rank of phyla (df = 29; P < 0.05) (Table 3). Additionally, depth was a significant factor for intermediate taxonomic ranks but explained only 2 to 3% of variation in community composition (Table 3). Nitrogen treatment and all interaction terms were not significant for any taxonomic rank (Table 3).
TABLE 3.
Adjusted R2 values from RDAs conducted on fungal community data from mycorrhizal type × N fertilization experiment at Moores Creeka
| Explanatory variable(s) | % of variance |
||||||
|---|---|---|---|---|---|---|---|
| Phylum | Class | Order | Family | Genus | OTU | Functional group | |
| Mycorrhizal type | 42.7 | 29.6 | 18.3 | 22.6 | 16.4 | 9.7 | 32.0 |
| Depth | n.s. | 3.3 | 2.2 | 2.1 | 2.2 | n.s. | n.s. |
| N treatment | n.s. | n.s. | n.s. | n.s. | n.s. | n.s. | n.s. |
| All interactions | n.s. | n.s. | n.s. | n.s. | n.s. | n.s. | n.s. |
A value displayed in the table indicates that the explanatory variable was significant (α = 0.05). n.s., not significant.
OTU richness was significantly higher in AM tree-dominant soil (P = 0.0001; R2 = 59.4%) (Fig. 1d) and significantly higher at a sampling depth of 0 to 5 cm (P = 0.0001; R2 = 18.9%). Additionally, there was no significant effect of N addition treatment or any significant interactions between dominant mycorrhizal type, depth, or treatment on OTU richness. Likewise, 1D (R2 = 32.2%) and 2D (R2 = 25.1%) were higher in AM tree-dominant soil (P < 0.008) (Fig. 1e and f), while depth, N addition treatment, and all interactions were not significant. Plant biotroph (R2 = 39.7%), plant necrotroph (R2 = 49.9%), and primary saprotroph (R2 = 51.2%) OTU richness values were all significantly higher in AM tree-dominant soil (P = 0.003) (Fig. 2e to g), while only primary saprotroph 1D (R2 = 68.5%) and 2D (R2 = 55.1%) were significantly higher in AM tree-dominant soil (P < 0.05). Additionally, plant necrotroph and primary saprotroph OTU richness values were significantly higher at a depth of 0 to 5 cm than at the 5- to 15-cm depth. A significant interaction between dominant mycorrhizal type and sampling depth for plant necrotroph OTU richness was also identified (P = 0.01; R2 = 76.6%), with AM tree-dominant soil having greater plant necrotroph OTU richness at a depth of 0 to 5 cm than at the 5- to 15-cm depth and ECM tree-dominant soil showing no differences between depths. Ectomycorrhizal fungal OTU richness was significantly higher in ECM plots than in AM plots only at a depth of 0 to 5 cm (P = 0.003; R2 = 33.1%), while ectomycorrhizal fungal 1D and 2D were not significantly affected by dominant plot mycorrhizal type, depth, N treatment, or any interactions.
Dominant mycorrhizal type explained 32% of the variation in relative abundance between functional groups, but depth was not significant (Table 3). Nitrogen treatment and interaction terms were also not significant for functional groups (Table 3). Similar to the results from our mycorrhizal gradient analyses, significant changes in fungal functional group composition at Moores Creek (MC) were the result of reduced ectomycorrhizal fungal (R2 = 36.3%) relative abundance and increased plant biotroph (R2 = 12.5%), plant necrotroph (R2 = 30.5%), and primary saprotroph (R2 = 34.6%) relative abundances in AM tree-dominant soil (P < 0.05) (Fig. 3e to h). Differences in the relative abundance of fungal families from MC with >1% average relative abundance in AM tree or ECM tree-dominated soil are reported in Table 4. Generally, families with biotrophic plant pathogen, necrotrophic plant pathogen, and saprotrophic members again increased in relative abundance in AM tree-dominant soil, while families containing ectomycorrhizal members decreased in relative abundance. The Elaphomycetaceae, a family in Ascomycota containing ectomycorrhizal taxa, and the Marasmiaceae, a family in Basidiomycota containing various saprotrophic and ectomycorrhizal taxa, however, both increased in relative abundance in AM tree-dominant soil. Additionally, 58% of fungal families with >1% average relative abundance overlapped between the MC and mycorrhizal gradient data sets, with 12 out of 14 of these shared families demonstrating similar responses to dominant tree mycorrhizal type. The two exceptions were both ectomycorrhizal families in Basidiomycota: the Boletaceae increased in relative abundance in AM tree-dominant soil at MC but decreased in the mycorrhizal gradient sites, while the trends for Sebacinaceae were the opposite.
TABLE 4.
Fungal families with average relative abundance of >1% from AM tree- and ECM tree-dominant plots at Moores Creek
| Phylum | Family | Functional rolea | R 2 b | Relative abundance (%)b |
|
|---|---|---|---|---|---|
| AM tree- dominant soil | ECM tree-dominant soil | ||||
| Ascomycota | Elaphomycetaceae | Ectomycorrhizal | 0.05 | 3.12 ± 9.5 | 0.95 ± 1.45 |
| Herpotrichiellaceae | Primary saprotroph, endophyte, or various | 31.27 | 2.46 ± 2.29 | 0.49 ± 0.41 | |
| Basidiomycota | Hygrophoraceae | Biotroph or ectomycorrhizal | 30.59 | 10.9 ± 15.9 | 0.22 ± 0.75 |
| Russulaceae | Ectomycorrhizal | 21.25 | 19.4 ± 18.9 | 35.8 ± 18.5 | |
| Amanitaceae | Ectomycorrhizal | 25.40 | 0.77 ± 1.48 | 8.99 ± 15.9 | |
| Boletaceae | Ectomycorrhizal | 15.19 | 6.05 ± 8.48 | 0.6 ± 1.14 | |
| Cortinariaceae | Ectomycorrhizal | 23.43 | 2.25 ± 7.95 | 5.35 ± 5.27 | |
| Hydnangiaceae | Ectomycorrhizal | 10.73 | 0.03 ± 0.08 | 1.93 ± 5.08 | |
| Sebacinaceae | Ectomycorrhizal | 5.14 | 2.51 ± 5.8 | 3 ± 3.04 | |
| Hydnaceae | Ectomycorrhizal or various | 16.68 | 0.05 ± 0.08 | 7.29 ± 12.9 | |
| Clavulinaceae | Ectomycorrhizal or various | 2.22 | 2.29 ± 5.4 | 6.37 ± 14.2 | |
| Ceratobasidiaceae | Necrotroph, ectomycorrhizal, or various | 52.45 | 2.02 ± 3.04 | 0 ± 0 | |
| Tricholomataceae | Necrotroph, primary saprotroph, or ectomycorrhizal | 25.13 | 0.3 ± 0.44 | 9.91 ± 17.4 | |
| Strophariaceae | Primary or wood saprotroph, or ectomycorrhizal | 38.23 | 3.41 ± 4.33 | 0.17 ± 0.61 | |
| Clavariaceae | Primary saprotroph | 50.06 | 5.38 ± 4.29 | 0.83 ± 2.01 | |
| Agaricaceae | Primary saprotroph | 44.48 | 1.83 ± 2.27 | 0.12 ± 0.14 | |
| Geminibasidiaceae | Primary saprotroph | 25.00 | 1.48 ± 2.13 | 0.09 ± 0.16 | |
| Entolomataceae | Primary saprotroph or ectomycorrhizal | 77.12 | 2.32 ± 1.76 | 0.03 ± 0.07 | |
| Marasmiaceae | Primary saprotroph or ectomycorrhizal | 0.31 | 0.66 ± 1.26 | 2.15 ± 8.01 | |
| Thelephoraceae | Primary saprotroph or ectomycorrhizal | 0.41 | 2.19 ± 2.32 | 2.36 ± 2.46 | |
| Atheliaceae | Primary saprotroph, ectomycorrhizal, or various | 30.24 | 0.19 ± 0.49 | 3.65 ± 6.22 | |
| Inocybaceae | Wood saprotroph or ectomycorrhizal | 18.09 | 4.19 ± 5.3 | 0.66 ± 1.11 | |
| Mucoromycota | Umbelopsidaceae | Primary saprotroph | 4.65 | 5.22 ± 8.15 | 5.12 ± 1.93 |
| Zygomycota | Mortierellaceae | Primary saprotroph | 59.69 | 14.3 ± 12 | 1.33 ± 2.72 |
Functional role includes all taxa present in each family. “Biotroph” and “necrotroph” designations are specific to plant pathogens and do not include animal or fungal pathogens. The “various” designation was used for taxa within a family that were assigned multiple functional roles that remained unresolved after a thorough literature search.
Average relative abundances and standard deviations were obtained from plots with >85% relative basal area of one mycorrhizal type (AM or ECM dominant). Adjusted R2 values reported are from the redundancy analysis performed at the family rank. Relative abundance values are displayed as percentages and include standard deviations.
DISCUSSION
Dominance of different mycorrhizal tree types affects fungal functional group relative abundances and overall fungal species diversity.
In this study, we found that AM and ECM tree communities affect soil fungal communities in distinct ways, consistent with our overarching hypothesis that many groups of nonmycorrhizal fungi are affected by the mycorrhizal associations of dominant trees through controls on nutrient availability, which likely have important consequences for forest community dynamics and ecosystem processes. Within all four forests, areas with increased AM tree dominance were associated with increased fungal diversity and increased relative abundances of biotrophic plant pathogens, necrotrophic plant pathogens, and primary saprotrophs (Fig. 1 to 3). Additionally, the percentage of AM tree basal area consistently explained as much or more variation in fungal community composition as soil properties, such as SOM content and nitrification rate, sampling depth, and mineral N availability (Table 1). Mycorrhizal type is increasingly viewed as a key trait with cascading effects that go well beyond nutrient acquisition, potentially affecting global patterns in soil biogeochemistry and plant-soil feedbacks (1, 3, 36). Such broad effects imply that tree mycorrhizal types must consistently influence nonmycorrhizal fungi, as demonstrated here across four forest stands. Indeed, our findings are similar to those of Bahram et al. (29), who demonstrated comparable patterns in relative abundance of plant pathogens and saprotrophs in Baltic temperate forests based on mycorrhizal dominance, and support the ideas offered by Netherway et al. (37) regarding differences in plant pathogen and saprotroph abundances between AM- and ECM-dominant systems.
Plant-soil feedbacks tend to be more negative for AM trees than ECM trees (8, 28), including at Lilly-Dickey Woods (LDW) (38), and this pattern has recently been associated with greater accumulation of potentially pathogenic fungi on AM tree roots than on ECM tree roots (10, 21). Our data on bulk soil fungal communities suggest that this effect on biotrophic and necrotrophic plant pathogen abundances may create a “mycorrhizal spillover” effect that influences the fungal functional groups responsible for plant-soil feedback encountered by other trees within the community (9). Due to the increased diversity of plant biotrophs and necrotrophs in AM tree-dominated stands, both heterospecific and conspecific plants may experience a greater likelihood of encountering a pathogenic fungal strain capable of causing an infection. Increased relative abundances of fungal biotrophic and necrotrophic plant pathogens also suggest that infectious populations encountered may be a larger fraction of the community, increasing the likelihood of plant disease (39). Hence, these patterns should result in more negative plant-soil feedback in AM-dominated stands, helping to explain how juvenile tree recruitment, regardless of the juvenile species mycorrhizal type, can be strongly influenced by the mycorrhizal type of surrounding dominant trees (9, 21, 38).
Plant pathogen relative abundances may be greater in AM-dominant soil because of the greater association of pathogens with AM roots as noted above, but other factors are likely to drive increased primary saprotroph relative abundance and diversity, as well as contribute to specialized necrotrophic plant pathogens that are facultatively saprotrophic (37). ECM-dominant tree communities are known to induce lower rates of nutrient and SOM cycling than AM-dominant tree communities (2, 5, 40, 41), which may be explained by the lower primary saprotroph relative abundances observed in our study. AM leaf litter also tends to be more labile than ECM leaf litter due to increased nutrient and polyphenol contents (3, 7, 42), creating more favorable conditions for fungal plant pathogens and saprotrophs that rely on plant litter for carbon and energy (22, 23). Increased labile carbon and energy availability may also drive enhanced saprotrophic fungal diversity (23, 43), which may be tied to plant diversity through controls on available types of leaf litter (i.e., labile versus recalcitrant). Furthermore, reduced saprotroph relative abundance (and necrotrophic plant pathogen relative abundance) in ECM-dominant tree communities may also be a consequence of competitive interactions with ECM fungi (19, 44). Although ECM fungi obtain most of their carbon from their host tree, they compete with free-living fungi for nitrogen and other resources, including access to leaf litter.
While dominant mycorrhizal types have emerged as a convenient framework by which to classify forests, shifts in fungal community composition have also been attributed to many other factors, such as soil organic matter (45) or the species identity of dominant trees (46), which may be confounded with mycorrhizal associations in these systems. Trees that do not conform to trait predictions under the mycorrhiza-associated nutrient economy (MANE) framework, such as AM trees with recalcitrant leaf litter (e.g., Platanus occidentalis) or ECM trees with labile leaf litter (e.g., Carya ovata; personal observations) may induce weaker effects on soil carbon and nutrient cycling and could potentially drive patterns in local fungal community composition opposite to those observed in our study. Likewise, tree species that are dual mycorrhizal, such as members of Alnus, Populus, and Salix (47), may also drive different relationships between soil microbial communities and soil nutrient dynamics. Dual mycorrhizal relationships and their effects on soil in comparison to AM or ECM associations are currently an underexplored area warranting further research (47). Finally, variation among broad controls on decomposition caused by geographic factors, such as temperature and precipitation, may override mycorrhiza-associated patterns in nutrient cycling and fungal community composition. It is therefore critical to continue testing the hypotheses presented here in forests of differing tree species composition and geographical range before drawing ultimate conclusions about the role mycorrhizas play in structuring soil community dynamics.
Mineral N addition and soil depth do not influence fungal communities as much as forest mycorrhizal dominance.
Soil sampling depth has been shown to affect the community composition of root-associated fungi (48), with depth interacting with tree mycorrhizal dominance to influence the relative abundances of saprotrophic and mycorrhizal fungi (49). While sampling depth explained some variation in OTU richness of our various functional groups in our experimental plots, we found this depth × mycorrhizal type interaction to be significant only for plant necrotroph OTU richness. This appears to suggest that plant necrotroph diversity is primarily associated with the more organic horizons of AM soil, but further work is needed to fully explain the drivers behind this result. Additionally, sampling depth did not significantly affect fungal relative abundances, either as a main effect or as an interaction with dominant mycorrhizal type. Dominant mycorrhizal type consistently explained more than twice as much variation in plant biotroph, plant necrotroph, and primary saprotroph OTU richness than did sampling depth, demonstrating the strong influence different mycorrhizal associations have on soil fungal communities.
Contrary to our third prediction, mineral N addition did not increase the relative abundances of plant-pathogenic and saprotrophic soil fungi in our study. Neither the relative abundance of fungal taxa and functional groups nor fungal OTU richness was affected by the 6 years of inorganic N addition at Moores Creek. Only plant necrotroph OTU evenness appeared to be weakly influenced by a mycorrhizal dominance × mineral N treatment interaction (P = 0.07), with N treatment slightly increasing necrotroph OTU evenness in ECM soil while having no effect in AM soil. While some studies on the effects of simulated mineral N deposition on temperate hardwood forest soils have demonstrated changes to overall fungal community composition (50–52), other studies have shown that fungi may instead alter the expression of extracellular enzyme genes when community composition remains unchanged (32, 33, 53, 54). Additionally, in relation to dominant mycorrhizal associations, extracellular enzyme production has been documented to shift from C-degrading to N-degrading enzymes with increasing ECM dominance (55). These variable responses of soil fungi to changes in mineral N availability suggest that our fungal communities may have altered their activity instead of composition, as seen in ECM-dominant plots reported by Midgley and Phillips (56). Alternatively, larger amounts of N than those applied at Moores Creek can induce changes in fungal community composition, as observed at Harvard Forest (52, 57). It is also possible that our plots may be limited by resources other than N or colimited by multiple nutrients (58, 59). For example, DeForest et al. (58) documented microbial community composition changes in response to P addition in unglaciated forest soils in southern Ohio but not in glaciated northern Ohio soils.
While mineral N addition can elicit differing responses in soil fungal communities, the form or quality of N added can also affect fungal community composition and function. For example, Cline et al. (22) found that saprotrophic and ECM fungal species richness responded negatively to organic N addition, indicating that inorganic versus organic N availability is an important consideration when studying fungal community responses to N addition. Similarly, Beidler et al. (60) found that high-quality substrates, represented by fungal tissue with low melanin and high N content, decomposed much more rapidly than low-quality substrates. They also demonstrated variable responses in fungal community composition to substrate quality depending on dominant mycorrhizal associations, with low-substrate-quality, AM-associated communities having overall higher relative abundances of pathogens and saprotrophs (60). Both of these studies suggest that the addition of bioavailable mineral N may bypass important metabolic barriers that would otherwise alter the representation of specific fungi in soil communities of varying mycorrhizal dominance. It would therefore be worthwhile to examine whether fungal enzyme activity or gene expression changes on the basis of inorganic versus organic N addition in forests of different dominant mycorrhizal types.
Conclusions.
Our study and those from Bahram et al. (29) and Netherway et al. (37) suggest that there are widespread patterns in the distribution of fungal functional groups based on tree mycorrhizal types present in forest ecosystems. Additional research in other forests is required to confirm that these patterns in functional groups are ubiquitous or if these patterns are instead driven by other factors such as specific dominant tree species, specific fungal taxa, or geography. The effect of mycorrhizal dominance on the diversity and relative abundance of saprotrophic and plant-pathogenic fungi is closely related to important differences in nutrient and SOM cycling (2, 61) and plant-soil feedback (8, 9). Future work should address the relative importance of these mechanisms as drivers of carbon storage and community dynamics in ecosystems of differing mycorrhizal compositions, while also examining how widespread these phenomena are globally. With temperate forests expected to become more AM tree dominant under global change factors (11, 12), understanding these patterns of cooccurrence between tree mycorrhizal associations and soil microbial communities is vital if we are to understand the full effects of global change on temperate forests.
MATERIALS AND METHODS
Site descriptions. (i) Natural mycorrhizal gradients.
Five soil cores (0- to 5-cm depth, 5-cm diameter) were collected in August 2014 from 48 experimental plots in three mixed deciduous forests in southern Indiana, United States. Within each forest, study plots represent a gradient of mycorrhizal dominance ranging from 0% AM basal area (ECM trees dominant) to 100% AM basal area (AM trees dominant). The mycorrhizal dominance of each plot was calculated by summing the basal areas of all tree species of a particular mycorrhizal type and dividing by the total basal area of the plot.
The three sites included in the gradient represent a range of forest conditions in the region. Soil types at Griffy Woods (GW; 15 study plots; 39°11′N, 86°30′W) and Morgan-Monroe State Forest (MMSF; 15 study plots; 39°19′N, 86°25′W) are loamy-skeletal, mixed, active, mesic Typic Dystrudepts and Hapludults in the Brownstown-Gilwood complex, while the third site at Lilly-Dickey Woods (LDW; 18 study plots; 39°14′N, 86°13′W) has loamy-skeletal, mixed, active, mesic Typic Dystrudepts, Ultic Hapludalfs, and Typic Hapludults in the Berks-Trevlac-Wellston complex. All three sites are broadleaf hardwood forests with similar tree communities that differ in which species are dominant (i.e., abundant) and are part of Indiana University’s Research and Teaching Preserve. At Griffy Woods, the dominant AM trees are sugar maple (Acer saccharum), yellow poplar (Liriodendron tulipifera), and black cherry (Prunus serotina), whereas dominant ECM trees are Northern red oak (Quercus rubra), white oak (Quercus alba), and American beech (Fagus grandifolia). Canopy trees at Griffy Woods are ∼90 years old, and the forest has little understory due to high deer densities and the presence of invasive plant species (62). Morgan-Monroe State Forest is the same age as Griffy Woods and has similar overstory tree species, as well as dominant AM trees such as sassafras (Sassafras albidum) and ECM trees such as black oak (Quercus velutina), shagbark hickory (Carya ovata), and pignut hickory (C. glabra) (63). Here, deer densities are much lower than in Griffy Woods, resulting in a dense understory. Lilly-Dickey Woods is the oldest site, resembling an old-growth forest, with many trees exceeding 150 years old due to forest succession following agricultural abandonment. It contains many of the same tree species as the other sites, but the dominant ECM species is chestnut oak (Quercus montana). This site is also free of invasive species (38). Trees were assigned a mycorrhizal type based on information from Brundrett (64) and Maherali et al. (65).
(ii) Mycorrhizal type × nitrogen fertilization experiment.
Moores Creek (MC) is also part of the IU Research and Teaching Preserve and is located in southern Indiana a few kilometers away from the other study sites (39°05′N, 86°28′W). It contains a tree species composition similar to that of GW, LDW, and MMSF and has loamy, mixed, semiactive, mesic Typic Dystrudepts and Hapludults in the Brownstown-Gilwood complex. Here, sixteen 20-by 20-m2 paired plots were located across eight forest stands. Four stands with eight plots were dominated by AM tree species, while the other four stands with eight plots were dominated by ECM species (dominance indicates >85% of the basal area of the stand). One plot in each pair was treated with (NH4)2SO4 and NaNO3 granular fertilizer monthly (May to October) beginning in 2011 for a total of 50 kg N ha−1 year−1. The mass ratio of N from ammonium and nitrate was equivalent for each monthly fertilizer application (56, 66). Five soil cores 5 cm in diameter from each plot were sampled to a depth of 15 cm and separated by approximate horizon (organic = 0 to 5 cm; mineral = 5 to 15 cm) in August 2017 before being pooled for DNA extraction and analysis.
DNA sequencing and taxonomic assignments.
All soil samples were passed through a 2-mm sieve for homogenization and processed to remove fine roots and other nonsoil particulates. Once homogenized, a subsample of soil was stored at −80°C for DNA extraction, which was carried out within a month of sampling, while the remaining soil was used to measure abiotic soil properties (see “Abiotic soil property measurements”). For samples from the mycorrhizal gradient sites, DNA was extracted from soil samples using a PowerSoil DNA isolation kit (MOBIO Laboratories, Inc, Carlsbad, CA, USA) in accordance with the manufacturer’s guidelines. PCR amplification of the ITS1 region of fungi (67) was achieved using barcode-labeled primers ITS1F (5′-CTT GGT CAT TTA GAG GAA GTA A) and ITS2 (5′ GCT GCG TTC TTC ATC ATC GAT GC) by following the methods of Buée et al. (68) using a Bio-Rad C1000 touch thermal cycler (Bio-Rad Laboratories, Hercules, CA, USA). Briefly, 2 μL of dilute DNA template was amplified in four, 25-μL PCRs. Cycle numbers varied between 28 and 35 cycles for each sample to achieve similar band intensities on an agarose gel, with negative controls included to verify lack of contamination. One hundred microliters of amplified PCR product was purified using an Agencourt AMPure XP magnetic bead cleanup kit (Beckman Coulter Life Sciences, Indianapolis, IN, USA) by following the manufacturer’s instructions. Purified PCR products from all 48 samples were then combined in equimolar concentrations (values were obtained via fluorometric assay using an AccuClear ultra-high-sensitivity dsDNA quantitation kit from Biotium [Biotium, Inc., Fremont, CA, USA] and a BioTek Synergy 2 microplate reader [BioTek Instruments, Winooski, VT, USA] by following Biotium’s supplied protocol) and submitted for single-lane, paired-end 2 × 300 bp MiSeq Illumina sequencing at the Ohio State University’s Molecular and Cellular Imaging Center (Wooster, OH, USA). Resulting sequence data (approximately 2 million reads) were analyzed with the bioinformatics platform Qiime (69) by clustering sequences into operational taxonomic units (OTUs) based on a 97% sequence similarity threshold using the UCLUST algorithm (70). Chimeric sequences were removed, and OTUs representing <10 total sequences across all samples were discarded prior to analysis. Taxonomic information was assigned to representative OTU sequences using the UNITE database v.7.2 (71) and a Naive Bayesian classifier with a confidence threshold of >80%. Community composition data were rarified to 2,788 sequences for each of the 48 sampled plots.
For samples from the nitrogen fertilizer experiment, DNA was extracted using a DNeasy PowerSoil DNA isolation kit (Qiagen, Hilden, Germany) by following the manufacturer’s guidelines. PCR amplification and sequencing were performed by the DOE Joint Genome Institute (Walnut Creek, CA, USA). PCR amplification of the ITS2 region (67) was achieved using the primers ITS9F (5′- GAA CGC AGC RAA IIG YGA) and ITS4R (5′- TCC TCC GCT TAT TGA TAT GC) in accordance with the protocol from Ihrmark et al. (72) prior to single-lane, paired-end 2 × 300 bp MiSeq Illumina sequencing. Resulting amplicon reads were quality controlled, clustered, aligned, and assigned taxonomy using iTagger v2.2 (73) (https://bitbucket.org/berkeleylab/jgi_itagger). Samples were rarified to 473,143 sequences per sample.
For all samples, the functional role (e.g., primary saprotroph, ectomycorrhizal, etc.) of each taxon was assigned using the FUNguild database from Nguyen et al. (74). Taxa with multiple or unknown functional assignments were checked against a thorough literature review, and corrections were made when applicable, with plant pathogens being further categorized as biotrophic or necrotrophic plant pathogens. Pathogens of animals and fungi were excluded from our functional analyses, as they were low abundance and unrelated to our hypotheses. Taxa with multiple assignments that remained unresolved were grouped into a “various” category, while those with no known function were placed into an “unknown” category. Taxa in both of these categories were excluded from our functional group analyses but were retained during the taxonomic level analyses. Due to the specific nature of our hypotheses, we limited our analyses on functional groups to these groups of interest: primary saprotrophs (non-wood-degrading saprotrophs), biotrophic plant pathogens, necrotrophic plant pathogens, and ectomycorrhizal fungi. Arbuscular mycorrhizal fungi were excluded from our analyses due to their overall low relative abundances, as shown previously by Tedersoo et al. (75) regardless of primer choice.
Abiotic soil property measurements.
Abiotic soil properties (moisture, pH, organic matter, soil organic matter content, total C and N, nitrification, and N mineralization) were measured for the mycorrhizal gradient samples. Methods used to measure soil properties are described briefly here, with additional details provided previously by Midgley and Phillips (56). Soil moisture was measured gravimetrically, and SOM content was measured by ashing soils in a muffle furnace at 450°C for 16 h. Soil pH was measured using an Orion pH meter (ThermoFisher Scientific, Waltham, MA, USA) in a 1:2 solution of air-dried soil and 0.01 M CaCl2. Total soil C and N were measured by drying a 10-g aliquot of sieved soil at 60°C for 48 h and using a mortar and pestle to pulverize the sample before analysis on a Costech ECS 4010 elemental analyzer (Costech Analytical Technologies, Inc.). Nitrification and N mineralization rates were determined by quantifying changes in 2 M KCl-extractable pools of NH4+-N + NO3−-N on 4.5 g of soil after a 21-day incubation period at 23°C using a Lachat QuikChem 8000 flow injection analyzer (Lachat Instruments, Loveland, CO, USA).
Statistical analysis.
All analyses were performed in R v.3.3.0 (R Development Core Team 2017). Sequence data from three samples from our mycorrhizal gradient were discarded before analysis due to low numbers of reads. OTUs that did not receive a taxonomy assignment or those that were only assigned to “Fungi” were removed prior to analysis (∼2% of all sequences). OTU abundance data were rarified and Hellinger transformed before analysis using the vegan package (76). We performed redundancy analysis (RDA) to examine how fungal community composition changed in response to our mycorrhizal dominance gradient. RDAs were performed for each taxonomic rank (phyla through OTUs), as well as for functional group composition. Significance of predictor variables was assessed using 999 random permutations of sample identity. Percent AM basal area (0% to 100%) and location (GW, LDW, or MMSF) were supplied as predictor variables. The goodness() command in vegan was used to obtain R2 values for changes in fungal family relative abundances related to the mycorrhizal gradient. Additionally, these same community data were analyzed by stepwise, forward selection RDAs using the vegan ordiR2step command to determine their response to abiotic predictor variables, selecting only those that were both significant (P < 0.05) and resulted in an increase in adjusted R2 value (77). Thus, soil moisture, soil organic matter, soil pH, and nitrification rate were tested as abiotic predictor variables. Other abiotic variables were eliminated before the analysis using a variance inflation factor cutoff of <10 to detect confounded predictor variables (78) through the vegan command vif.cca(). The adjusted R2 values from the RDAs with mycorrhizal percent and the stepwise RDAs were used to assess the fit of significant models (79).
Our first prediction, that AM soil will have greater fungal taxonomic diversity than ECM soil (P1), was tested using the full community as well as separately for each functional group of interest. For each plot, OTUs were used to calculate the first three Hill numbers (80), representing a gradient of emphasis on evenness: 0D or richness, 1D or the exponentiated Shannon-Wiener diversity index, and 2D or the inverse Simpson index. To test for an effect of mycorrhizal dominance on these diversity measures, we performed mixed-effects linear modeling using the nlme package (81) after testing for normality. Forest site (GW, LDW, and MMSF) was used as a random factor, while percent AM basal area (0% to 100%) was tested as the predictor. In order to test our second prediction that AM soil has higher relative abundances of pathogenic and saprotrophic fungal taxa than ECM soil (P2), we again used linear modeling. For each functional group of interest (biotrophs, necrotrophs, and primary saprotrophs), relative abundances were used as the response variable, percent AM basal area of the plots was used as the predictor variable, and location was used as a random effect. R2 values were used to assess the fit of each linear model for each taxonomic and functional group of interest and were obtained using the MuMIn package (82).
In addition to testing P1 and P2, samples from the nitrogen fertilization experiment were used to test our third prediction, i.e., that chronic inorganic N addition will increase the relative abundances of nonmycorrhizal soil fungi and have a larger impact on fungal communities associated with ECM-dominant forests (P3). First, RDAs were performed as described above for each taxonomic rank (phylum through genus), as well as for functional group composition. Dominant tree mycorrhizal type (AM or ECM), sampling depth (0 to 5 or 5 to 15 cm), and N treatment were included (with interactions) as predictor variables. Next, linear modeling was used to evaluate the responses of biotroph, necrotroph, and primary saprotroph relative abundances, as well as the first three Hill numbers, to the same predictor variables.
Data availability.
Sequence data for GW, LDW, and MMSF have been deposited in the Sequence Read Archive (accession no. SRR13120641), while sequence data for MC have been deposited in the Joint Genome Institute Genome Portal (project ID 1182214) (83). GW, LDW, and MMSF data are available in reference 55. MC data are available in reference 56.
ACKNOWLEDGMENTS
Project funding was provided by grants from the U.S. National Science Foundation (DEB-1834241) and U.S. Department of Energy (DE-SC0004335).
Additionally, we thank Meghan Midgley for establishing the plots and long-term N deposition experiment at MC and Edward Brzostek for establishing the plots at GW, LDW, and MMSF. We also thank Laura Podzikowski, Elizabeth Huenupi, and Mark Sheehan for maintaining the N deposition experiment at MC and Michael Chitwood, manager of Indiana University’s Research and Teaching Preserve, for maintaining those properties.
C.B.B., R.P.P., and K.A.S. designed the study. A.C.E., R.M.M., and A.L.H. collected the data, with A.C.E. and A.L.H. handling samples from GW, LDW, and MMSF and R.M.M. handling samples from MC. A.C.E. performed the bioinformatic and statistical analyses. A.C.E. and C.B.B. wrote the manuscript with input from all authors.
Contributor Information
Andrew C. Eagar, Email: aeagar@kent.edu.
Irina S. Druzhinina, Nanjing Agricultural University
REFERENCES
- 1.Tedersoo L, Bahram M, Zobel M. 2020. How mycorrhizal associations drive plant population and community biology. Science 367:eaba1223. 10.1126/science.aba1223. [DOI] [PubMed] [Google Scholar]
- 2.Phillips RP, Brzostek E, Midgley MG. 2013. The mycorrhizal‐associated nutrient economy: a new framework for predicting carbon–nutrient couplings in temperate forests. New Phytol 199:41–51. 10.1111/nph.12221. [DOI] [PubMed] [Google Scholar]
- 3.Lin G, McCormack ML, Ma C, Guo D. 2017. Similar below‐ground carbon cycling dynamics but contrasting modes of nitrogen cycling between arbuscular mycorrhizal and ectomycorrhizal forests. New Phytol 213:1440–1451. 10.1111/nph.14206. [DOI] [PubMed] [Google Scholar]
- 4.Cotrufo MF, Wallenstein MD, Boot CM, Denef K, Paul E. 2013. The microbial efficiency‐matrix stabilization (MEMS) framework integrates plant litter decomposition with soil organic matter stabilization: do labile plant inputs form stable soil organic matter? Glob Chang Biol 19:988–995. 10.1111/gcb.12113. [DOI] [PubMed] [Google Scholar]
- 5.Craig ME, Turner BL, Liang C, Clay K, Johnson DJ, Phillips RP. 2018. Tree mycorrhizal type predicts within‐site variability in the storage and distribution of soil organic matter. Glob Chang Biol 24:3317–3330. 10.1111/gcb.14132. [DOI] [PubMed] [Google Scholar]
- 6.Wurzburger N, Hendrick RL. 2009. Plant litter chemistry and mycorrhizal roots promote a nitrogen feedback in a temperate forest. J Ecol 97:528–536. 10.1111/j.1365-2745.2009.01487.x. [DOI] [Google Scholar]
- 7.Keller AB, Phillips RP. 2019. Leaf litter decay rates differ between mycorrhizal groups in temperate, but not tropical, forests. New Phytol 222:556–564. 10.1111/nph.15524. [DOI] [PubMed] [Google Scholar]
- 8.Bennett JA, Maherali H, Reinhart KO, Lekberg Y, Hart MM, Klironomos J. 2017. Plant-soil feedbacks and mycorrhizal type influence temperate forest population dynamics. Science 355:181–184. 10.1126/science.aai8212. [DOI] [PubMed] [Google Scholar]
- 9.Eagar AC, Cosgrove CR, Kershner MW, Blackwood CB. 2020. Dominant community mycorrhizal types influence local spatial structure between adult and juvenile temperate forest tree communities. Funct Ecol 34:2571–2583. 10.1111/1365-2435.13674. [DOI] [Google Scholar]
- 10.Liang M, Johnson D, Burslem DF, Yu S, Fang M, Taylor JD, Taylor AF, Helgason T, Liu X. 2020. Soil fungal networks maintain local dominance of ectomycorrhizal trees. Nat Commun 11:2636. 10.1038/s41467-020-16507-y. [DOI] [PMC free article] [PubMed] [Google Scholar]
- 11.Jo I, Fei S, Oswalt CM, Domke GM, Phillips RP. 2019. Shifts in dominant tree mycorrhizal associations in response to anthropogenic impacts. Sci Adv 5:eaav6358. 10.1126/sciadv.aav6358. [DOI] [PMC free article] [PubMed] [Google Scholar]
- 12.Steidinger BS, Crowther TW, Liang J, Van Nuland ME, Werner GDA, Reich PB, Nabuurs GJ, de-Miguel S, Zhou M, Picard N, Herault B, Zhao X, Zhang C, Routh D, Peay KG, GFBI Consortium. 2019. Climatic controls of decomposition drive the global biogeography of forest-tree symbioses. Nature 569:404–408. 10.1038/s41586-019-1128-0. [DOI] [PubMed] [Google Scholar]
- 13.Smith SE, Smith FA. 2011. Roles of arbuscular mycorrhizas in plant nutrition and growth: new paradigms from cellular to ecosystem scales. Annu Rev Plant Biol 62:227–250. 10.1146/annurev-arplant-042110-103846. [DOI] [PubMed] [Google Scholar]
- 14.Whiteside MD, Digman MA, Gratton E, Treseder KK. 2012. Organic nitrogen uptake by arbuscular mycorrhizal fungi in a boreal forest. Soil Biol Biochem 55:7–13. 10.1016/j.soilbio.2012.06.001. [DOI] [PMC free article] [PubMed] [Google Scholar]
- 15.Read DJ, Perez‐Moreno J. 2003. Mycorrhizas and nutrient cycling in ecosystems—a journey towards relevance? New Phytologist 157:475–492. 10.1046/j.1469-8137.2003.00704.x. [DOI] [PubMed] [Google Scholar]
- 16.Lindahl BD, Tunlid A. 2015. Ectomycorrhizal fungi—potential organic matter decomposers, yet not saprotrophs. New Phytol 205:1443–1447. 10.1111/nph.13201. [DOI] [PubMed] [Google Scholar]
- 17.Gadgil RL, Gadgil PD. 1971. Mycorrhiza and litter decomposition. Nature 233:133. 10.1038/233133a0. [DOI] [PubMed] [Google Scholar]
- 18.Averill C, Turner BL, Finzi AC. 2014. Mycorrhiza-mediated competition between plants and decomposers drives soil carbon storage. Nature 505:543–545. 10.1038/nature12901. [DOI] [PubMed] [Google Scholar]
- 19.Averill C, Hawkes CV. 2016. Ectomycorrhizal fungi slow soil carbon cycling. Ecol Lett 19:937–947. 10.1111/ele.12631. [DOI] [PubMed] [Google Scholar]
- 20.Teste FP, Kardol P, Turner BL, Wardle DA, Zemunik G, Renton M, Laliberté E. 2017. Plant-soil feedback and the maintenance of diversity in Mediterranean-climate shrublands. Science 355:173–176. 10.1126/science.aai8291. [DOI] [PubMed] [Google Scholar]
- 21.Chen L, Xiang W, Wu H, Ouyang S, Zhou B, Zeng Y, Chen Y, Kuzyakov Y. 2019. Tree species identity surpasses richness in affecting soil microbial richness and community composition in subtropical forests. Soil Biol Biochem 130:113–121. 10.1016/j.soilbio.2018.12.008. [DOI] [Google Scholar]
- 22.Cline LC, Huggins JA, Hobbie SE, Kennedy PG. 2018. Organic nitrogen addition suppresses fungal richness and alters community composition in temperate forest soils. Soil Biol Biochem 125:222–230. 10.1016/j.soilbio.2018.07.008. [DOI] [Google Scholar]
- 23.Bai Z, Wu X, Lin JJ, Xie HT, Yuan HS, Liang C. 2019. Litter-, soil- and C:N-stoichiometry-associated shifts in fungal communities along a subtropical forest succession. Catena 178:350–358. 10.1016/j.catena.2019.03.037. [DOI] [Google Scholar]
- 24.Smolander A, Kurka A, Kitunen V, Mälkönen E. 1994. Microbial biomass C and N, and respiratory activity in soil of repeatedly limed and N-and P-fertilized Norway spruce stands. Soil Biol Biochem 26:957–962. 10.1016/0038-0717(94)90109-0. [DOI] [Google Scholar]
- 25.Frey SD, Knorr M, Parrent JL, Simpson RT. 2004. Chronic nitrogen enrichment affects the structure and function of the soil microbial community in temperate hardwood and pine forests. For Ecol Manage 196:159–171. 10.1016/j.foreco.2004.03.018. [DOI] [Google Scholar]
- 26.Castaño C, Dejene T, Mediavilla O, Geml J, Oria-de-Rueda JA, Martín-Pinto P. 2019. Changes in fungal diversity and composition along a chronosequence of Eucalyptus grandis plantations in Ethiopia. Fungal Ecol 39:328–335. 10.1016/j.funeco.2019.02.003. [DOI] [Google Scholar]
- 27.LaManna JA, Walton ML, Turner BL, Myers JA. 2016. Negative density dependence is stronger in resource‐rich environments and diversifies communities when stronger for common but not rare species. Ecol Lett 19:657–667. 10.1111/ele.12603. [DOI] [PubMed] [Google Scholar]
- 28.Segnitz RM, Russo SE, Davies SJ, Peay KG. 2020. Ectomycorrhizal fungi drive positive phylogenetic plant-soil feedbacks in a regionally dominant tropical plant family. Ecology 101:e03083. 10.1002/ecy.3083. [DOI] [PubMed] [Google Scholar]
- 29.Bahram M, Netherway T, Hildebrand F, Pritsch K, Drenkhan R, Loit K, Anslan S, Bork P, Tedersoo L. 2020. Plant nutrient‐acquisition strategies drive topsoil microbiome structure and function. New Phytol 227:1189–1199. 10.1111/nph.16598. [DOI] [PubMed] [Google Scholar]
- 30.Waldrop MP, Zak DR, Sinsabaugh RL, Gallo M, Lauber C. 2004. Nitrogen deposition modifies soil carbon storage through changes in microbial enzymatic activity. Ecol Appl 14:1172–1177. 10.1890/03-5120. [DOI] [Google Scholar]
- 31.Janssens IA, Dieleman W, Luyssaert S, Subke J-A, Reichstein M, Ceulemans R, Ciais P, Dolman AJ, Grace J, Matteucci G, Papale D, Piao SL, Schulze E-D, Tang J, Law BE. 2010. Reduction of forest soil respiration in response to nitrogen deposition. Nat Geosci 3:315–322. 10.1038/ngeo844. [DOI] [Google Scholar]
- 32.Entwistle EM, Zak DR, Edwards IP. 2013. Long-term experimental nitrogen deposition alters the composition of the active fungal community in the forest floor. Soil Sci Soc Am J 77:1648–1658. 10.2136/sssaj2013.05.0179. [DOI] [Google Scholar]
- 33.Freedman ZB, Romanowicz KJ, Upchurch RA, Zak DR. 2015. Differential responses of total and active soil microbial communities to long-term experimental N deposition. Soil Biol Biochem 90:275–282. 10.1016/j.soilbio.2015.08.014. [DOI] [Google Scholar]
- 34.Kjøller R, Nilsson LO, Hansen K, Schmidt IK, Vesterdal L, Gundersen P. 2012. Dramatic changes in ectomycorrhizal community composition, root tip abundance and mycelial production along a stand‐scale nitrogen deposition gradient. New Phytol 194:278–286. 10.1111/j.1469-8137.2011.04041.x. [DOI] [PubMed] [Google Scholar]
- 35.van Strien AJ, Boomsluiter M, Noordeloos ME, Verweij RJ, Kuyper TW. 2018. Woodland ectomycorrhizal fungi benefit from large‐scale reduction in nitrogen deposition in the Netherlands. J Appl Ecol 55:290–298. 10.1111/1365-2664.12944. [DOI] [Google Scholar]
- 36.Jiang F, Lutz JA, Guo Q, Hao Z, Wang X, Gilbert GS, Mao Z, Orwig DA, Parker GG, Sang W, Liu Y, Tian S, Cadotte MW, Jin G. 2021. Mycorrhizal type influences plant density dependence and species richness across 15 temperate forests. Ecology 102:e03259. 10.1002/ecy.3259. [DOI] [PubMed] [Google Scholar]
- 37.Netherway T, Bengtsson J, Krab EJ, Bahram M. 2021. Biotic interactions with mycorrhizal systems as extended nutrient acquisition strategies shaping forest soil communities and functions. Basic Appl Ecol 50:25–42. 10.1016/j.baae.2020.10.002. [DOI] [Google Scholar]
- 38.Johnson DJ, Clay K, Phillips RP. 2018. Mycorrhizal associations and the spatial structure of an old-growth forest community. Oecologia 186:195–204. 10.1007/s00442-017-3987-0. [DOI] [PubMed] [Google Scholar]
- 39.Liu Y, He F. 2019. Incorporating the disease triangle framework for testing the effect of soil‐borne pathogens on tree species diversity. Funct Ecol 33:1211–1222. 10.1111/1365-2435.13345. [DOI] [Google Scholar]
- 40.Talbot JM, Finzi AC. 2008. Differential effects of sugar maple, red oak, and hemlock tannins on carbon and nitrogen cycling in temperate forest soils. Oecologia 155:583–592. 10.1007/s00442-007-0940-7. [DOI] [PubMed] [Google Scholar]
- 41.Tatsumi C, Taniguchi T, Du S, Yamanaka N, Tateno R. 2020. Soil nitrogen cycling is determined by the competition between mycorrhiza and ammonia‐oxidizing prokaryotes. Ecology 101:e02963. 10.1002/ecy.2963. [DOI] [PubMed] [Google Scholar]
- 42.Averill C, Bhatnagar JM, Dietze MC, Pearse WD, Kivlin SN. 2019. Global imprint of mycorrhizal fungi on whole-plant nutrient economics. Proc Natl Acad Sci USA 116:23163–23168. 10.1073/pnas.1906655116. [DOI] [PMC free article] [PubMed] [Google Scholar]
- 43.Feinstein LM, Blackwood CB. 2012. Taxa-area relationship and neutral dynamics influence the diversity of fungal communities on senesced tree leaves. Environ Microbiol 14:1488–1499. 10.1111/j.1462-2920.2012.02737.x. [DOI] [PubMed] [Google Scholar]
- 44.McGuire KL, Zak DR, Edwards IP, Blackwood CB, Upchurch R. 2010. Slowed decomposition is biotically mediated in an ectomycorrhizal, tropical rain forest. Oecologia 164:785–795. 10.1007/s00442-010-1686-1. [DOI] [PubMed] [Google Scholar]
- 45.Tedersoo L, Anslan S, Bahram M, Drenkhan R, Pritsch K, Buegger F, Padari A, Hagh-Doust N, Mikryukov V, Gohar D, Amiri R, Hiiesalu I, Lutter R, Rosenvald R, Rähn E, Adamson K, Drenkhan T, Tullus H, Jürimaa K, Sibul I, Otsing E, Põlme S, Metslaid M, Loit K, Agan A, Puusepp R, Varik I, Kõljalg U, Abarenkov K. 2020. Regional-scale in-depth analysis of soil fungal diversity reveals strong pH and plant species effects in Northern Europe. Front Microbiol 11:1953. 10.3389/fmicb.2020.01953. [DOI] [PMC free article] [PubMed] [Google Scholar]
- 46.Prescott CE, Grayston SJ. 2013. Tree species influence on microbial communities in litter and soil: current knowledge and research needs. For Ecol Manage 309:19–27. 10.1016/j.foreco.2013.02.034. [DOI] [Google Scholar]
- 47.Teste FP, Jones MD, Dickie IA. 2020. Dual‐mycorrhizal plants: their ecology and relevance. New Phytol 225:1835–1851. 10.1111/nph.16190. [DOI] [PubMed] [Google Scholar]
- 48.Clemmensen KE, Finlay RD, Dahlberg A, Stenlid J, Wardle DA, Lindahl BD. 2015. Carbon sequestration is related to mycorrhizal fungal community shifts during long‐term succession in boreal forests. New Phytol 205:1525–1536. 10.1111/nph.13208. [DOI] [PubMed] [Google Scholar]
- 49.Carteron A, Beigas M, Joly S, Turner BL, Laliberté E. 2021. Temperate forests dominated by arbuscular or ectomycorrhizal fungi are characterized by strong shifts from saprotrophic to mycorrhizal fungi with increasing soil depth. Microb Ecol 82:377–390. 10.1007/s00248-020-01540-7. [DOI] [PubMed] [Google Scholar]
- 50.Pregitzer KS, Burton AJ, Zak DR, Talhelm AF. 2008. Simulated chronic nitrogen deposition increases carbon storage in Northern Temperate forests. Glob Change Biol 14:142–153. 10.1111/j.1365-2486.2007.01465.x. [DOI] [Google Scholar]
- 51.Edwards IP, Zak DR, Kellner H, Eisenlord SD, Pregitzer KS. 2011. Simulated atmospheric N deposition alters fungal community composition and suppresses ligninolytic gene expression in a northern hardwood forest. PLoS One 6:e20421. 10.1371/journal.pone.0020421. [DOI] [PMC free article] [PubMed] [Google Scholar]
- 52.Morrison EW, Frey SD, Sadowsky JJ, van Diepen LT, Thomas WK, Pringle A. 2016. Chronic nitrogen additions fundamentally restructure the soil fungal community in a temperate forest. Fungal Ecol 23:48–57. 10.1016/j.funeco.2016.05.011. [DOI] [Google Scholar]
- 53.Hesse CN, Mueller RC, Vuyisich M, Gallegos-Graves LV, Gleasner CD, Zak DR, Kuske CR. 2015. Forest floor community metatranscriptomes identify fungal and bacterial responses to N deposition in two maple forests. Front Microbiol 6:337. 10.3389/fmicb.2015.00337. [DOI] [PMC free article] [PubMed] [Google Scholar]
- 54.Zak DR, Argiroff WA, Freedman ZB, Upchurch RA, Entwistle EM, Romanowicz KJ. 2019. Anthropogenic N deposition, fungal gene expression, and an increasing soil carbon sink in the Northern Hemisphere. Ecology 100:e02804. 10.1002/ecy.2804. [DOI] [PubMed] [Google Scholar]
- 55.Cheeke TE, Phillips RP, Kuhn A, Rosling A, Fransson P. 2021. Variation in hyphal production rather than turnover regulates standing fungal biomass in temperate hardwood forests. Ecology 102:e03260. 10.1002/ecy.3260. [DOI] [PMC free article] [PubMed] [Google Scholar]
- 56.Midgley MG, Phillips RP. 2016. Resource stoichiometry and the biogeochemical consequences of nitrogen deposition in a mixed deciduous forest. Ecology 97:3369–3378. 10.1002/ecy.1595. [DOI] [PubMed] [Google Scholar]
- 57.Morrison EW, Pringle A, van Diepen LT, Frey SD. 2018. Simulated nitrogen deposition favors stress-tolerant fungi with low potential for decomposition. Soil Biol Biochem 125:75–85. 10.1016/j.soilbio.2018.06.027. [DOI] [Google Scholar]
- 58.DeForest JL, Smemo KA, Burke DJ, Elliott HL, Becker JC. 2012. Soil microbial responses to elevated phosphorus and pH in acidic temperate deciduous forests. Biogeochemistry 109:189–202. 10.1007/s10533-011-9619-6. [DOI] [Google Scholar]
- 59.Rosling A, Midgley MG, Cheeke T, Urbina H, Fransson P, Phillips RP. 2016. Phosphorus cycling in deciduous forest soil differs between stands dominated by ecto‐and arbuscular mycorrhizal trees. New Phytol 209:1184–1195. 10.1111/nph.13720. [DOI] [PubMed] [Google Scholar]
- 60.Beidler KV, Phillips RP, Andrews E, Maillard F, Mushinski RM, Kennedy PG. 2020. Substrate quality drives fungal necromass decay and decomposer community structure under contrasting vegetation types. J Ecol 108:1845–1859. 10.1111/1365-2745.13385. [DOI] [Google Scholar]
- 61.Frey SD. 2019. Mycorrhizal fungi as mediators of soil organic matter dynamics. Annu Rev Ecol Evol Syst 50:237–259. 10.1146/annurev-ecolsys-110617-062331. [DOI] [Google Scholar]
- 62.Midgley MG, Brzostek E, Phillips RP. 2015. Decay rates of leaf litters from arbuscular mycorrhizal trees are more sensitive to soil effects than litters from ectomycorrhizal trees. J Ecol 103:1454–1463. 10.1111/1365-2745.12467. [DOI] [Google Scholar]
- 63.Schmid HP, Grimmond CSB, Cropley F, Offerle B, Su HB. 2000. Measurements of CO2 and energy fluxes over a mixed hardwood forest in the mid-western United States. Agric For Meteorol 103:357–374. 10.1016/S0168-1923(00)00140-4. [DOI] [Google Scholar]
- 64.Brundrett MC. 2009. Mycorrhizal associations and other means of nutrition of vascular plants: understanding the global diversity of host plants by resolving conflicting information and developing reliable means of diagnosis. Plant Soil 320:37–77. 10.1007/s11104-008-9877-9. [DOI] [Google Scholar]
- 65.Maherali H, Oberle B, Stevens PF, Cornwell WK, McGlinn DJ. 2016. Mutualism persistence and abandonment during the evolution of the mycorrhizal symbiosis. Am Nat 188:E113–E125. 10.1086/688675. [DOI] [PubMed] [Google Scholar]
- 66.Mushinski RM, Phillips RP, Payne ZC, Abney RB, Jo I, Fei S, Pusede SE, White JR, Rusch DB, Raff JD. 2019. Microbial mechanisms and ecosystem flux estimation for aerobic NOy emissions from deciduous forest soils. Proc Natl Acad Sci USA 116:2138–2145. 10.1073/pnas.1814632116. [DOI] [PMC free article] [PubMed] [Google Scholar]
- 67.White TJ, Bruns T, Lee SJWT, Taylor J. 1990. Amplification and direct sequencing of fungal ribosomal RNA genes for phylogenetics, p 315–322. In Innis MA, Gelfand DH, Sninsky JJ, White TJ (ed), PCR protocols: a guide to methods and applications. Academic Press, Inc., New York, NY. [Google Scholar]
- 68.Buée M, Reich M, Murat C, Morin E, Nilsson RH, Uroz S, Martin F. 2009. 454 Pyrosequencing analyses of forest soils reveal an unexpectedly high fungal diversity. New Phytol 184:449–456. 10.1111/j.1469-8137.2009.03003.x. [DOI] [PubMed] [Google Scholar]
- 69.Caporaso JG, Kuczynski J, Stombaugh J, Bittinger K, Bushman FD, Costello EK, Fierer N, Peña AG, Goodrich JK, Gordon JI, Huttley GA, Kelley ST, Knights D, Koenig JE, Ley RE, Lozupone CA, McDonald D, Muegge BD, Pirrung M, Reeder J, Sevinsky JR, Turnbaugh PJ, Walters WA, Widmann J, Yatsunenko T, Zaneveld J, Knight R. 2010. QIIME allows analysis of high-throughput community sequencing data. Nat Methods 7:335–336. 10.1038/nmeth.f.303. [DOI] [PMC free article] [PubMed] [Google Scholar]
- 70.Edgar RC. 2010. Search and clustering orders of magnitude faster than BLAST. Bioinformatics 26:2460–2461. 10.1093/bioinformatics/btq461. [DOI] [PubMed] [Google Scholar]
- 71.UNITE Community. 2017. UNITE QIIME release. Version 01.12.2017. 10.15156/BIO/587481. [DOI]
- 72.Ihrmark K, Bödeker I, Cruz-Martinez K, Friberg H, Kubartova A, Schenck J, Strid Y, Stenlid J, Brandström-Durling M, Clemmensen KE, Lindahl BD. 2012. New primers to amplify the fungal ITS2 region—evaluation by 454-sequencing of artificial and natural communities. FEMS Microbiol Ecol 82:666–677. 10.1111/j.1574-6941.2012.01437.x. [DOI] [PubMed] [Google Scholar]
- 73.Tremblay J, Singh K, Fern A, Kirton ES, He S, Woyke T, Lee J, Chen F, Dangl JL, Tringe SG. 2015. Primer and platform effects on 16S rRNA tag sequencing. Front Microbiol 6:771. 10.3389/fmicb.2015.00771. [DOI] [PMC free article] [PubMed] [Google Scholar]
- 74.Nguyen NH, Song Z, Bates ST, Branco S, Tedersoo L, Menke J, Schilling JS, Kennedy PG. 2016. FUNGuild: an open annotation tool for parsing fungal community datasets by ecological guild. Fungal Ecol 20:241–248. 10.1016/j.funeco.2015.06.006. [DOI] [Google Scholar]
- 75.Tedersoo L, Bahram M, Põlme S, Anslan S, Riit T, Kõljalg U, Nilsson RH, Hildebrand F, Abarenkov K. 2015. Response to comment on “Global diversity and geography of soil fungi.” Science 349:936–936. 10.1126/science.aaa5594. [DOI] [PubMed] [Google Scholar]
- 76.Oksanen J, Kindt R, Legendre P, O’Hara B, Stevens MHH, Oksanen MJ. 2007. The vegan package. Community ecology package, vol 10. R Foundation for Statistical Computing, Vienna, Austria. [Google Scholar]
- 77.Blanchet FG, Legendre P, Borcard D. 2008. Forward selection of explanatory variables. Ecology 89:2623–2632. 10.1890/07-0986.1. [DOI] [PubMed] [Google Scholar]
- 78.Borcard D, Gillet F, Legendre P. 2018. Numerical ecology with R. Springer, New York, NY. [Google Scholar]
- 79.Peres-Neto PR, Legendre P, Dray S, Borcard D. 2006. Variation partitioning of species data matrices: estimation and comparison of fractions. Ecology 87:2614–2625.2.0.CO;2] 10.1890/0012-9658(2006)87[2614:VPOSDM]2.0.CO;2. [DOI] [PubMed] [Google Scholar]
- 80.Chao A, Gotelli NJ, Hsieh TC, Sander EL, Ma KH, Colwell RK, Ellison AM. 2014. Rarefaction and extrapolation with Hill numbers: a framework for sampling and estimation in species diversity studies. Ecol Monogr 84:45–67. 10.1890/13-0133.1. [DOI] [Google Scholar]
- 81.Pinheiro J, Bates D, DebRoy S, Sarkar D, Heisterkamp S, Van Willigen B, R Core Team. 2017. Package ‘nlme’. Linear and nonlinear mixed effects models. R Foundation for Statistical Computing, Vienna, Austria. [Google Scholar]
- 82.Barton K. 2009. MuMIn: multi-model inference. R package version 1. 0. 0. https://r-forge.r-project.org/projects/mumin/.
- 83.Raff J. 2017. Combined flux chamber and genomics approach to understanding soil emissions of reactive nitrogen oxides in a forested environment. https://genome.jgi.doe.gov/portal/BiosouiTagplate1_FD/BiosouiTagplate1_FD.info.html.
Associated Data
This section collects any data citations, data availability statements, or supplementary materials included in this article.
Data Availability Statement
Sequence data for GW, LDW, and MMSF have been deposited in the Sequence Read Archive (accession no. SRR13120641), while sequence data for MC have been deposited in the Joint Genome Institute Genome Portal (project ID 1182214) (83). GW, LDW, and MMSF data are available in reference 55. MC data are available in reference 56.