Abstract
In the current world, the disorders occurring in dermatological images are among the foremost widespread diseases. Despite being common, its identification is tremendously hard because of the complexities like skin tone and color variation due to the presence of hair regions. Therefore the type of skin disease prediction is not accurately achieved in many pieces of research. To deal with mentioned concerns, a novel optimal probability-based deep neural network is proposed to assist medical professionals in appropriately diagnosing the type of skin disease. Initially, the input dataset is fed into the pre-processing stage, which helps to remove unwanted contents in the image. Afterward, features extracted for all the pre-processed images are subjected to the proposed Optimal Probability-Based Deep Neural Network (OP-DNN) for the training process. This classification algorithm classifies incoming clinical images as different skin diseases with the help of probability values. While learning OP-DNN, it is essential to determine the optimal weight values for reducing the training error. For optimizing weight in OP-DNN structure, an optimization approach is implemented in this research. For that, whale optimization is utilized because it works faster than other methods. The proposed multi-type skin disease prediction model is implemented in MatLab software and achieved 95% of accuracy, 0.97 of specificity, and 0.91 of sensitivity. This exposes the superiority of the proposed multi-type skin disease prediction model using an effective OP-DNN based feature extraction approach to attain a high accuracy rate and also it predict several kinds of skin disease than the previous models, which can protect the patients survives as well as can assist the physicians in making a decision certainly.
Keywords: Multi-type skin diseases prediction, Optimal probability-based deep neural network, Whale optimization algorithm (WOA)
Introduction
The biggest organ in a person’s body is the skin which can suffer from many factors like sun radiation, smoking, lifestyle, tanning, liquor use, viruses, physical action, and the workplace. These elements contain their integrity and enclose a significant, devastating impact on its well-being [14]. Infections straightforwardly affecting the skin are the most incessant reason for every human illness, influencing almost every third of the total populace in turn of 1.9 billion individuals. If skin sicknesses are not treated at a prior stage, it can prompt complications in the body, including the spread of disease starting with one individual then onto the next. Hence, skin infections can be prevented by examining the influenced zone at the beginning [8]. The characteristic of the skin images is broadened to provoke a job to devise a productive and robust technique for automatically detecting the skin disease and its severity. Therefore, early identification of skin illness is a significant undertaking to decrease mortality. Numerous scientists have utilized AI approaches for skin injury location at an early stage, which might be gainful for timely healing of skin infection. For the past two years, researchers have made an effort to provide intelligent diagnostic methods for the automatic classification of dermatological disorders to aid dermatologists, first and foremost in the early classification of skin cancer [19]. Four often seen skin diseases like basal cell carcinoma (BCC), seborrheic keratosis (SK), Melanoma (MM), and Squamous cell carcinoma(SCC) are selected for the study.
Basal cell carcinomas are the utmost familiar human skin cancers, particularly affected for an elderly person. Affording to epidemiological revisions, BCC occurrence is growing yearly, and the occurrence in young individuals displays a gradual upward trend. Basal-cell cancer propagates gradually and is able to injury the tissue around it although, it is unlikely to spread to far-away regions or to consequence in death. Risk factors embrace exposure to radiation therapy, ultraviolet light, long-term exposure to arsenic, having lighter skin, and poor immune system function. Exposure to UV light throughout childhood is principally injurious.
Seborrheic keratosis is instigated by postponed maturation of benign epidermal cells. It typically seems black, brown, or pale, which grows on the shoulders, face, or chest. SK inclines to act from middle-age onwards. It is otherwise called basal cell papilloma.
Melanoma is the utmost serious arrangement of cancer in the skin. It is also known as malignant melanoma. It seems like a mole which is existent in the body has erratically shaped edges, irregular shapes, and numerous colors. A mole that has altered color or gotten more prominent over time. Changes in a mole area can designate melanoma, including increased size, skin breakdown, irregular edges or itchiness, and color change. The primary reason for melanoma is ultraviolet light (UV) exposure in those with low levels of skin pigment.
Squamous cell carcinoma frequently happens in regions exposed to UV radiation, such as the face, ears, and back of the hand. The presence of this disease is identified by a Scaly, reddish patch of skin that progresses to an outstretched bump that remains to grow.
These sicknesses significantly affect the patient’s well-being and even emotional well-being. Subsequently, analysis of these sicknesses is constantly one of the foci of dermatological research [21]. It is significant to note down that the treatment completely varies for these four skin diseases. When the diagnosis is not made at an appropriate time, or even no treatment is done, it may lead to serious issues in human life. Therefore, an affected person only gets a cure if the proper treatment in a timely manner is provided to patients. If artificial intelligence strategies are involved in identifying any skin disease, the curability of that disease is also possible. These AI techniques can characterize the analyzed four illness occurred in the skin by providing benefits to patients [12]. By these mechanisms, the diseases are identified in a proficient and precise manner. In recent years integrating the purpose of machine vision and image processing techniques for the diverse practice of medical imaging is expanding exponentially. The prevalence of skin illnesses reveals itself in a variety of forms, there is a scarcity and misdistribution of skilled dermatologists, and the requirement for prompt and accurate diagnosis necessitates data-driven diagnostics. Skin infections may now be diagnosed much more rapidly and correctly because of advances in laser and photonics-based medical technologies. The cost of such a diagnostic is currently expensive and limited. Deep learning models perform the categorization process using images and data more efficiently than other models. Deep learning models are flexible to changes in the considered problem and can solve key difficulties by automatically detecting input data features. With even modest computational models, deep learning models will acquire the inferred data to find and investigate the characteristics in the unexposed data patterns, resulting in significant efficiency.
In medical institutions and modern hospitals, medical-related information becomes larger, which may lead to difficulties in extracting relevant or most important information for a decision support system due to these complexities, errors, and time consumed for a single process for a dermatologist to diagnose the internal infections utilizing such long reports, particularly in skin since of its severe influence on people’s lives and health. So skin related diseases are treatable only detected at the earlier stage. But most of the time, it may lead to death without concerning the seriousness of skin disease. In addition to this, many dermatologists initiated automatic ways for finding skin disease, but it could not provide an efficient outcome. Since the techniques that exist till now do not identify or predict the type of skin disease accurately. Hence the current methodologies have lots of trouble in classifying the type of skin disease accurately. Also, researchers focus on the recognition of the singular type of skin disease. But it is essential to progress automatic techniques for increasing the accuracy of diagnosis of multi-type skin disease. The solution to these problems is to introduce deep learning algorithms that explicitly retrieve information and automatically extract features from the data using feature extraction techniques. Those techniques can solve traditional feature extraction difficulties and provide accurate diagnostic results. This has prompted the scientists to consider using a deep learning model to categorize the skin disease category based on the image of the affected region.
Thus, the speed of the diagnosis process is increased, and human errors get minimized while employing these strategies. For example, ongoing research has demonstrated that skin-related disease recognition from dermatological imagery is conceivable through supervised methods, such as fuzzy systems (Fuzzy c-means clustering) and artificial neural networks (ANN) combined with feature extraction strategies. In addition to this, k-nearest neighbors (k − NN) is another supervised classification technique to group pixels dependent on their similarities in each feature image which can be utilized to classify the normal/abnormal images [5, 7]. But these techniques lead to inappropriate diagnosis results by achieving a poor prediction rate. As a result, image processing becomes an option for early detection of skin cancer, as it is a non-expensive technique too. The multi-type skin disease is detected based on the following three phases: pre-processing, feature extraction, and classification. Pre-processing is done by using median filter, HE, and Morphological operations. Then, features are extracted based on color and textures, after selected features, given to the classifiers to detect multi-type skin disease. In following, sections will elaborately explain the proposed model for multi-type skin disease prediction. The contributions of the proposed research are illustrated as follows:
To design the Multi-type skin diseases prediction model using OP-DNN based feature extraction approach.
To design an improved medical image feature selection approach is performed using the median filter, HE, Morphological operations for hair removal.
To adapts OP-DNN classifier to achieve better multi-type skin disease prediction to assist physicians.
To enhance the classification accuracy and reduce error is performed using optimizing the weight parameters.
To generate weight values in the classification technique is optimized via WOA.
The manuscript is prepared as follows: section II describes reviews of works related to skin disease identification. We have described all parameters utilized in the entire paper as mentioned in Table 1; this can be helpful in easy understanding of the readers. Section III demonstrates the problem definition and motivation of the research work. The next section details the proposed methodology. Dataset description and experimental results are elaborated in Section V. Conclusion, and future scopes are provided in the final section.
Table 1.
Parameters used in the proposed model
| Parameters | Description |
|---|---|
|
I(a, b) w N pij Ei σi si (j − k) H(j, k) F1 F2
σy F3 F4 bx M and wqp m
s
|
The output of the median filter the width of the input image total number of the pixels image pixel Mean Standard deviation Skewness the grey level variance among adjacent pixels the distribution probability of grey level variance among adjacent pixels contrast correlation value of the mean of elements sum in every column in the square the mean value of elements summation in each row the sum of the standard deviation of elements entropy rate the energy value bias with a constant value amount of input and hidden neurons in the foremost hidden layer the weight interconnected at ythhidden layer the shape of logarithmic spiral the sequence of repetitions linearly the supposed to take value from [−1, 1] the current position |
Literature review
This section details the review of existing literature in skin disease identification based on various feature extraction and classification algorithms. Among several pieces of research, some of the latest works are illustrated as follows:
In 2015, S. Ra et al. [18] have introduced the identification of lesion areas in the skin using a segmentation and classification approach. For that purpose, skin images are initially fed into a filtering process to eliminate unnecessary noise and hair portions that are then segmented. The segmentation was done via the region growing technique which automatically set seed points for extracting the lesion area in the skin. Consequently, the lesion area which is extracted is marked by color and texture features. Then, for disease classification, integration of Support Vector Machine along with k-nearest neighbor classifiers was utilized. In future years, Z. Wu et al. [20] have presented face-related skin disease identification through the convolutional neural network technique. For this purpose, a larger clinical skin-related dataset named China’s skin image dataset was taken for analysis from Xiangya-Derm, which consists of 2656 face images. These input images depend on three serious skin diseases, namely BCC, SCC, SK, and other common skin diseases such as lupus erythematosus (LE), rosacea (ROS), and actinic keratosis (AK) for analysis. To classify these diseases in a dataset, the authors developed five mainstream network algorithms. Likewise, X. Fan et al. [6] have presented a deep CNN-based Inception-v3. They developed an approach for finding out the noise in the image. And after eliminating those noisy contents, the classification of skin lesion regions was done. Here impulse noise, Gaussian noise, and noise comprised with the compound of the two are applied to the input dataset images, namely Dermofit Image Library from the University of Edinburgh for removing the noise elements. After the noise gets removed, the classifier works to classify the skin disease.
For further improvement, N. Zhang et al. [23] have utilized a convolution neural network (CNN) for detecting skin cancer, and its network parameters are optimized via an improved whale optimization algorithm. Thus the integration of the presented classifier along with the optimization algorithm helps to improve the performance measure. But it still lags while maintaining its computational time. Also, the existing reviewed classifier performance has reasonable in a few diseases, although the overall performance has yet to be improved, is considered as the major drawback identified. In the same year, MQ. Khan et al. [10] have exhibited a prediction model to detect and distinguish melanoma from nevus with the help of image processing methods. At the initial stage, a Gaussian filter was applied to eliminate noise contained in the input skin lesion images. Then segmentation process was carried out to perform the identification affected region. For that, improved K-mean clustering was developed. Then a distinctive hybrid super feature vector was applied to carry out the texture and color-based region extraction from the lesion area.
At last, SVM (support vector machine) was employed for categorizing the skin cancer region into melanoma and nevus. To extend these works, P. Kharazmi et al. [11] developed segmentation and detection of cutaneous vasculature from skin-based dermoscopy images. For performing this, features like vascular are extracted for identifying skin cancer. At first, input images are segmented to find out the vascular structures by means of independent component examination for classifying hemoglobin components and melanin. This technique helps to remove pigmentation on the blood vessels. With the help of the k-means clustering algorithm, component relates hemoglobin is grouped as pigmented, normal, and erythema area. Also, in BCC, they extracted and defined the vascular features toward lesion diagnosis. Same as this, automatic segmentation of dermoscopy images on skin lesions was developed by G. Zhang et al. [22] because of challenges like low contrast among the skin cancer area, blur lesion border, typical tissue background, and a variety of sizes of cancer area. Hence they focused on implementing DSM-Network (deep supervised multi-scale network) to segment skin cancer outcomes. Furthermore, the contour refinement strategy is espoused for post-processing by a conditional random field strategy.
Rostami et al. [15] introduced a new feature selection method for measuring the pairwise constraints uncertainly. This article mainly concentrates on select features to reduce the ambiguity range of value when classifying the data. Initially, collect the similarity values for each pair and then estimate the average interval for each pair. After that, the estimated values are split into intervals for determining the number of pairs in the range. Based on these, a new method of feature selection approaches utilizing the similarity matrices and strength. Rostami et al. [16] had presented a genetic algorithm that depends on community detection for feature selection. The developed model has performed the feature selection based on utilizing three phases. The beginning phase was responsible for an estimate the similarities in the features. The second phase is utilizing the community detection algorithm for classifying the features into clusters. In the final phase, a novel community-based repair operation was performed by picked the genetic algorithm. Here, there are nine classification issues investigated for the performance evaluation. Rostami et al. [17] had performed a general categorization of different feature selection approach and a comparative investigation of diverse feature selection techniques. The goal of the feature selection approach is to choose a subset of characteristics with the least inner similarity and the most relevance to the target class. It decreases the data’s dimensionality by removing irrelevant, redundant, or noisy information.
Miodrag et al. [24] had developed a diagnosis model based on a hybrid machine learning and beetle antennae search approach for predicting the COVID-19 cases. The metrics of an adaptive neuro-fuzzy inference system were estimated using the improved beetle antenna search approach. The improved beetle antenna search optimization that tackles the problems arries in the existing techniques. The enhanced algorithm was evaluated and validated against a larger range of benchmark functions, demonstrating that it significantly outperformed the original implementation. Following that, the suggested hybrid technique for COVID-19 case prediction was tested using official data from the World Health Organization on the COVID-19 outbreak in China. Nebojsa et al. [1] introduced a modified firefly algorithm of a metaheuristics method for automatically finding the near-optimal values of convolutional neural network hyperparameters and developed a system for automatic automaticity picture classification of glioma brain tumor grades using magnetic resonance imaging. Initially, researchers compared the performance of the proposed modified algorithm to that of the original algorithm and other modified variants on a set of standard unconstrained benchmark functions. After confirming the efficacy of the suggested approach in general, it is used to optimize the convolutional neural network’s hyperparameters. Kongtao et al. [2] had introduced the Convolutional Networks with Structured Model Pruning on Tensor Processing Units. This research was mainly focusing on estimate the effective accuracy trade-off for different networks in a pruning method. A structured model pruning library for TensorFlow2 was designed to modify models in place To estimate the actual performance of the framework. It demonstrates that systematic model pruning on TPUs can considerably reduce model memory usage and speed without sacrificing accuracy, especially for small datasets. Azam and Nadia [13] had introduced a novel algorithm using two strategies as a crucial solution for gathering a wide range of skin appearance cues. For skin rendering, the goal is to capture these two qualities. The first is texture generation, which evolved as a result of visual perception. The second is the representation of skin texture. These techniques replicate skin noise texture and address skin noise modeling based on human perception theory.
The above-related works have done noteworthy accomplishments on the identification of skin illnesses. Though, the presented strategies focus on recognizing singular skin diseases, which formulates them hard to concern with the exact identification of multi-type skins. Something else, the current methods accomplish a lesser prediction rate. Therefore, in this manuscript, a method based on OP-DNN is planned to identify four various types of skin diseases.
Ketch of the proposed methodology
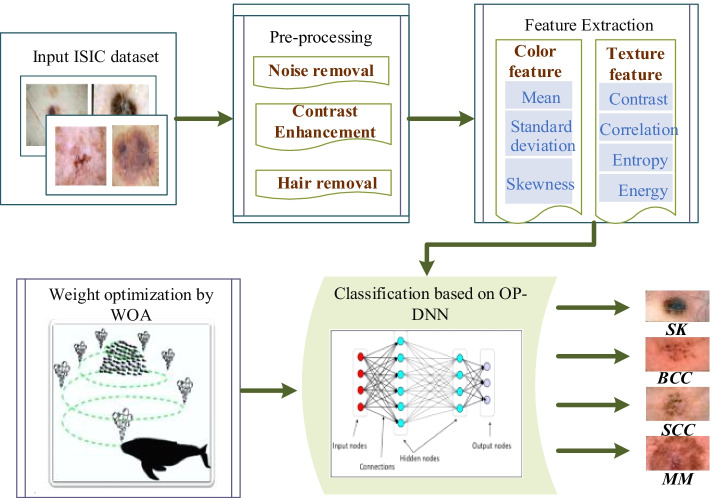
Four serious types of skin diseases, such as basal cell carcinoma (BCC), seborrheic keratosis (SK), Squamous cell carcinoma (SCC), and Melanoma (MM), will be identified by the proposed prediction model. The workflow of proposed skin disease identification is depicted as in below Fig. 1.
Fig. 1.
Overall architecture of proposed research
The proposed architecture contains three phases for performing the multi-type skin disease prediction. In the initial phases, pre-processing– Initially, the input database images are collected and fed into the pre-processing phase, where noise removal, contrast enhancement, and hair removal are carried out to get the qualified image. The second phase is Feature extraction; here, color and texture-based features are extracted for the obtained pre-processed image. Colour features are extracted based on statistical measures like mean, standard deviation, and skewness. Likewise, for extracting texture features, a gray-level co-occurrence matrix (GLCM) is utilized to discover mathematical factors like correlation, contrast, energy, and entropy. Those features are subjected to a classification stage for further processing. The final phase is the classification of multi-type skin disease- This step is the pillar of the proposed methodology, where training and testing the model is done with the help of a novel optimal probability-based deep neural network (OP-DNN). The weight values generated in the classification technique are optimized via WOA.
Pre-processing
Noise removal using a median filter
The presence of noisy content in the image leads the algorithm towards an inappropriate outcome. So it is required to obtain quality imageries without any form of noise for achieving the exact outcome. Hence it becomes essential to de-noise the input skin images. There are numerous ways accessible to denoise an image, and the best de-noising method will remove noises present in the images without degrading the edges. The most efficient method for de-noising the image is a median filter which substitutes the value of pixels by the median of all pixels in the neighborhood. The evaluation of the median filter is done by sorting all the pixels from the nearby neighborhood into arithmetical order. At once, the pixel value in a particular position is replaced with the middle value of pixels. The below equation mathematically formulates the median filter process of the image,
| 1 |
Where, w can be described as the square window coordinates,(a, b)ϵ(1, 2, …, h) × (1, 2, …., w)h can be described as the height of the image and w can be described as the width of the image, I(a, b)represents the output of the median filtered image. After applying the median filter, the input image keeps only the useful information by smoothen the images and preserving the edges.
Contrast enhancement by means of HE
Next to the noise removal step, the contrast of the image is particularly enhanced utilizing histogram equalization. It involves spreading out the values of intensity and total range of values for attaining a high level of contrast image. This method is advantageous at the point when an image is nearer to contrast. For instance, images in both the foreground and background area are bright simultaneously, or, more than likely, they are darker at the same time. Thus, it improves the local contrast of the noise removed image I(a, b)and results in better quality for visualization. The mapping functionalities are done in this method which maps grey level ‘a’ to another grey level ‘b’, which tends to determine the distribution of ‘b’ is uniform. Thus the range of grey levels is expanded, or the contrast is stretched more after the mapping function is done near to the histogram maxima. For most image pixels, its contrast is improved, and this transformation enhances the detectability of several image features. For pixel intensity level ‘I(a, b)’, the probability density function is mathematically written as:
| 2 |
Note that there is a high contrast when the image has an enormous change in the intensity among the levels of high and low intensity of an image. After enhancing image contrast, the images were subjected to hair removal process.
Morphological operations for hair removal
In the research undertaken, it has been exposed in what way mathematical morphology can be utilized as a tool for the removal of hairs (image artifacts) from dermoscopic images. For doing morphological operations, the proper selection of structuring element (SE) is the major task, and it has to be selected depending on the shape of the imagePDFI(I(a, b)). The structuring element taken is the fraction of the image, and it is a smaller binary image (every pixel with a value 0 or 1) or a small matrix of pixels. The developed hair removal process based morphological operation applies structuring elements to a contrast-enhanced PDFI(I(a, b)) image, generating an output image of similar size. Hence to reduce the effects of the disturbing artifacts, morphological operations such as dilation and erosion are carried out here. Here, binarization is performed at first to do the hair removal process.
Binarization: In binarization, the enhanced image will be converted to a binary image (i.e., pixel value with 0’s and 1’s). Each pixel of the image will be assigned with a new pixel value (0/1) based on the threshold range, which is selected manually based on the image characteristics. The binarization process can be mathematically defined as
| 3 |
Based on the threshold, the image will be binary converted. Then, the morphological operations will be carried out. When the image is binarized, the desired components can be easily extracted from the image. For this, mathematical morphology is utilized. There are two essential operations to be specific, dilation and erosion. Moreover, the representation of dilation and erosion is given in the below sections.
Dilation: Dilation performs transformation of the image, which results in the same shape as the original image by achieving different sizes. With the help of dilation, the width of maximum regions is enlarged to eliminate negative impulsive noises. Usually, this operation consists of convoluting an image A with some kernel Bmight be any shape or size. The dilation of A by structuring element B is mathematically termed as. If B has a center on the origin, as earlier, then the dilation of A by Bcan be understood as the locus of the points enclosed by B when the center of B moves inside A.
Erosion: The erosion operation executes either shrinking or thinning of the object. Simply, erosion expands the width of the tiniest regions. Accordingly, it can eliminate positive noises but affect negative impulsive noises. The degree of this operation is choosing by the structuring element. Erosion unites two sets by means of vector subtraction of set elements. The mathematical operation of erosion can also be inscribed as follows
| 4 |
Finally, hair artifacts or dark regions are successfully removed in the enhanced skin images.
Feature extraction based on color and texture
The feature extraction process is carried out to get the minimized, important and non-repetitive representation of images. Since the performance of a classifier technique depends directly upon the choice or selection of feature extraction approach employed on images. This is attained by eliminating irrelevant and redundant data present in the skin images. It is proved that a classifier containing important and smaller features will provide better accuracy measures and less memory consumption space. Other than this, the feature extraction phase also enhances the computational speed of the proposed classifier. Here, the procedure of feature extraction will be completed to identify the different forms of skin disease. To get such characteristics, the color and texture feature extraction process is exploited. The explanation behind picking these kinds of features is a result of the way that texture and color are the main properties dominating the disease area.
Three low order color statistic features
The color features are extracted employing color statistics as a compact representation. It is proved that the maximum time the color distribution information is captured by the three low-order statistics. It comprises the mean (first-order), standard deviation (second-order), and skewness (third-order) which are the effective and efficient representations of color distribution of images. These three low-order statistics features are extracted for each pre-processed image using the following mathematical formulation:
If the value of the ithcolor channel at jth image pixel is pij, then the color statistics features is defined as follows
| 5 |
Here N is the total amount of pixels in the pre-processed output image.
Standard deviation -It is calculated as the square root of distribution of its variance. It is determined by utilizing the following statics
| 6 |
Skewness -It gives the proportion of the level of asymmetry in the distribution. It is determined utilizing the following equation
| 7 |
These obtained color features are the compact representation representing skin images that obtain three numerical values of color features.
Four texture-based GLCM features
For obtaining the characterization of images, texture-based features are frequently utilized. Significant texture quality is the repetition of a pattern over a region in a pre-processed image. Texture encompasses significant information about the basic arrangement of the surface. The texture feature also describes the physical composition of the surface. GLCM is an effective tool as compared with other techniques for analyzing the features of texture. There are 22 texture features explained in GLCM and of which four features perform the best, and it has been taken into consideration for the proposed system.
| 8 |
Here (j − k) is the grey level variance among adjacent pixels, H(j, k) is the distribution probability of grey level variance among adjacent pixels, and F1 refers contrast. It is mostly utilized to define the degree of depth of image textile grooves. When the contrast value attains in the higher range, the grooves get deeper otherwise, vice versa. Through experimentation, the texture parameter of contrast for four diseases is obtained.
| 9 |
Where F2refers to correlation, is the value of the mean of elements sum in every column in a square, be the mean value of elements summation in each row, σy refers to the sum of the standard deviation of elements in each row. It is generally utilized to define the appropriate elements feature in every column and row in the progression of vertical image segmentation.
| 10 |
Where F3 refers entropy rate helps to measure the quantity of information contained in an input image and is changed by way of dissimilar textures. When F3increases, the texture of speck would be organized sparsely and vice versa. At the point when the entropy becomes 0, there is no surface or texture.
| 11 |
Where F4 refers to the energy value, and it is practically applicable to label the texture thickness, which is the quadratic sum of elements of GLCM in the horizontal and vertical directions.
These reduced feature sets should then be capable of summarizing the utmost of the information contained in the original feature set. The proposed classifier utilizes this set of seven features to classify disease types. Depending on an extracted feature, first, there are ranges for individual skin disease, and its probability values are determined at the time of initialization of the optimization algorithm. The obtained probability value will be considered as the target input for optimization.
Multi-type skin disease prediction model based on OP-DNN
The extracted features are subjected to the proposed OP-DNN structure for classifying four serious skin diseases. Generally, DNN is the same as a neural network (NN), but the only difference is that it contains numerous hidden layers between input and output layers. Deep learning-based techniques are highly effective when the number of available image samples amid the training stage is vast. Therefore, the proposed skin disease prediction model is defined with a deep learning approach. Likewise, at the time of training conventional DNN, the network weight of each neuron is refreshed in every cycle till the error between input and output is not inside tolerance. This leads to time-consuming. To enhance traditional DNN, a novel optimal probability-based DNN is discovered for predicting the type of skin disease based on input features taken. In OP-DNN, an optimization technique is used to acquire the set of optimal weights in the interconnection links.
The working procedure of the proposed OP-DNN for predicting skin disease model is categorized into two phases. Like traditional DNN’s, the proposed OP-DNN also involves the training process in the first phase and the testing process in the second phase.
Generally, the training process is repeated until the proposed classifier is trained with 80% of the data provided. As said earlier, in OP-DNN, the training process is speeded up with the aid of an optimization algorithm; also, the generated probability values obtain the output. The WOA is used here to effectively setting the probability values and offer interconnection weights selection process optimally between the links connecting the neurons of DNN to enable faster training of the classifier network.
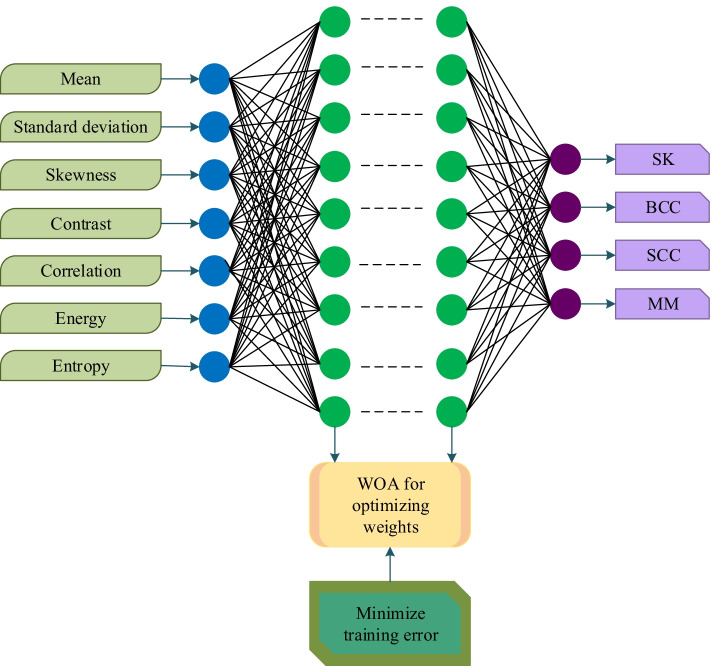
The design of the Proposed Deep Neural Network Architecture is given in Fig. 2.
Fig. 2.
Proposed OP based Deep Neural Network Architecture
Consider input as[Rm] Where 1 ≤ m ≤ MandC defines the output. Here, the input [Rm]is feature extracted data of skin images of any set(n)th. Output, C is the skin disease prediction model(n + 1)th.
Assume C as the output of the entire network and CH As the hidden layer’s output, generally, there are a larger number of hidden layers in DNN where the individual input of each neuron is multiplied by the neuron weight of the first defined hidden layer. Same like that, the first hidden layer weight elements are multiplied by the weights of the second hidden layer, and the process continues until the structure is defined. Here, only two hidden layers are taken for classification.
The weighted value of the input is subjected to the summing function with the neuron bias in the first hidden layer, which is mathematically represented as follows:
| 12 |
Where, bx acts as bias with a constant value, wxm be the interconnection weight among the input and hidden layer with M and K demonstrates the amount of input and hidden neurons in the foremost hidden layer. For the foremost hidden layer, the activation function is considered as output function and is represented as follows:
| 13 |
Here, F(.) is the activation function of sigmoid.
Consequently, the operation of yth the hidden layer is defined as,
| 14 |
Where bpbe the bias function of pthhidden node; wpz is the interconnection weight amongst(y − 1)thhidden layer and yth hidden layer with K number of hidden nodes.
The activation function output of yth the hidden layer is given as,
| 15 |
In the output layer, ythoutput hidden layer is overmultiplied with the weight between the ythhidden layer and output layer and summed up with bias bq as
| 16 |
Where wqpsignifies the weight interconnected at ythhidden layer and output layer containing pth and qth nodes correspondingly. The activation function at the output layer performs as the output of the entire structure.
Presently, the output of the network is computed from the difference between actual and predicted probability values. It is calculated based on the measure of mean square error. Till error gets minimized, the network weights are refreshed for attaining the exact range of probability values. The calculation of error is given in the upcoming equation:
| 17 |
Where, Predicted(Cm)is estimated output and Actual(Cm) is the actual output. The error needs to be minimized for attaining optimal network structure. Therefore, weight values must be adjusted till the attained error value becomes reduced at every iteration.
Here, for optimizing the weight values in OP-DNN, a WOA optimization algorithm is exhibited, which works based on the working principle of the whale for its food. Also, for achieving the best performance measure of OP-DNN, these training errors are optimized as well as probability values are generated based on the feature extracted values. This leads to the lightweight proposed OP-DNN, which shows the structure designed for skin disease classification. The weight optimization using WOA is elaborated in the upcoming sections:
Optimizing network weight via whale optimization algorithm (WOA)
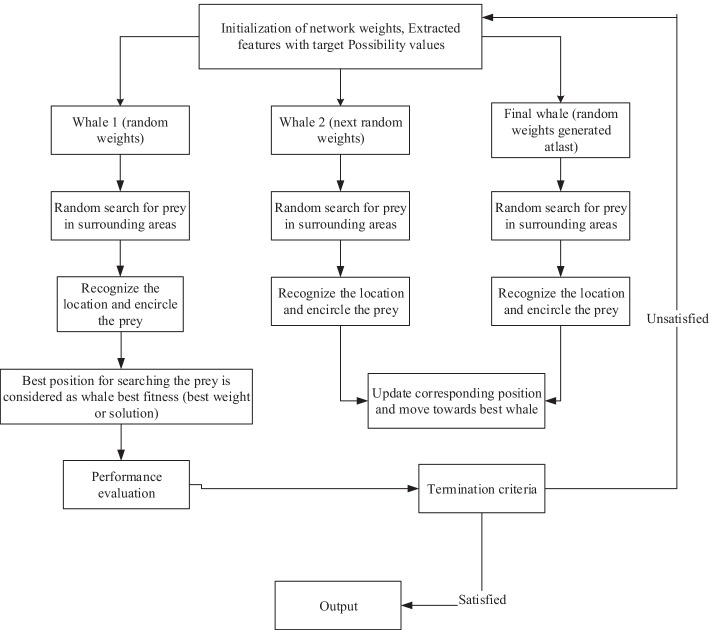
In this study, WOA is utilized to optimize the OP-DNN weights. The planned optimization technique helps enhance the training procedure’s speed using optimally selecting the weight value. WOA works under the principle of hunting behavior of humpback whales. It is the largest whale among the baleen whales family. The working principle of the whale optimization technique is that the humpback whales hunt the prey by means of three operators, namely, searching the prey, encircling the prey, and forming a bubble net for the hunting process. The overall process of the whale optimization algorithm is clearly figured below (Fig. 3):
Fig. 3.
Layout of the proposed optimization algorithm
Mathematical modeling
The arithmetical representation of encircling the prey, spiral bubble-net feeding activities, and searching for prey are demonstrated in the upcoming sections.
Step 1: Initialization- For the optimal selection of DNN weights, the WOA algorithm generates the initial solution randomly. The initialization phase creates an arbitrary population of the solution equal to the size of the weights required. To identify the optimal solution quickly, ten solutions will be created randomly during every iteration, and it is compared with the previous best solution (weight). Among all solutions, an optimal solution is selected and stored if it is better than other solutions. Here, the weight of input to the first hidden layer, the weight of the hidden layer to the hidden layer, and the weight of the hidden layer to the output layer is initialized. Moreover, seven extracted features and their target disease by setting probability values are also initialized randomly. Based on the input and target data, the training process is done using OP-DNN. The initialization is represented as follows:
| 18 |
Here E defines the original population of the whale at h represents the number of interconnection layers to optimize.i defines the number of terms considered for initialization. Here two hidden layers are considered for further processing. The generated probability values (target) is summarized as follows:
| 19 |
The disease class is defined by setting probability values at the initialization step while running the optimization algorithm.
Step 2: Fitness calculation- For automatic skin disease identification, the fitness function is generated to achieve the best classification measure by minimizing the training error, and it is evaluated based on the below expression:
| 20 |
Fitness function is the essential step for becoming the finest OP-DNN structure. When error value attained is minimum, the network has been effectively trained to predict input skin images. The best solution is chosen by means of obtaining a minimum error measure.
Step 3: Update the position of the current solution- Encircling the prey.
In this step, while noticing the position of prey, the hunting process is started by whales, and then it will encircle the prey. Afterward, the best whale (solution) is found out, which is fixed as the finest whale. After updating their position, the other whales will move on towards that best whale. The update procedure of the whales is depicted by the underneath equations:
| 21 |
| 22 |
Where udefines the current iteration,represents the best solution, be the current position, and are a coefficient vector, ||defines the absolute point. In addition to this, the coefficient vectors are scientifically represented are follows: and . Where is a sequence of repetitions linearly from 2 to 0, for both the exploration and exploitation phases.
Exploitation phase : This type of exploitation phase is also said to be a Bubble-net attacking technique. There are two mechanisms which are described below,
The shrinking encircling mechanism is mathematically given by:, as said previously, its value is diminished to reach this performance. Here is applied for the reduction of different ranges of . Else, it is stated that in the interval ranges from [−c, c], is an accidental point where c is decreased from 2 to 0. The finding agent’s new location can be different wherever for .
Spiral updation position is measured between the prey and the position of the whale, which is derived mathematically by:
| 23 |
Where . It means that the distance between yth whale and prey is denoted as the best solution achieved till now, s is supposed to take value from [−1, 1], m is defined as the shape of logarithmic spiral. While performing optimization, the location of the whale having the probability of 50 percentage by selecting any of the shrinking or spiral encircling models, and it is mathematical given as:
| 24 |
Where P ∈ [0, 1] thus, the humpback whales randomly finding the prey to form a bubble net.
Exploration phase: It is also called searching the prey. The subsequent equation explains the scientific form of the exploration phase.
| 25 |
| 26 |
The arbitrary position of the current population is symbolized as . During the updating process of each solution, the fitness calculation is evaluated to find the most excellent solution among them.
Based on the obtained best solution, a set of novel solutions will be found, and the fitness function is calculated for continuing the above solution updating process.
Step 4: Termination criteria -Atlast, it satisfies the finest weight of OP-DNN by the hunting behavior of whales. As a result of finding the optimal solution or best fitness function, the prediction model is qualified, which means after training OP-DNN structure, undertaken four skin disease was identified. Since the objective function is to minimize the error of training data, once the finest weight is obtained, the OP-DNN is trained and can be generalized to predict the type of skin disease for newer dataset images.
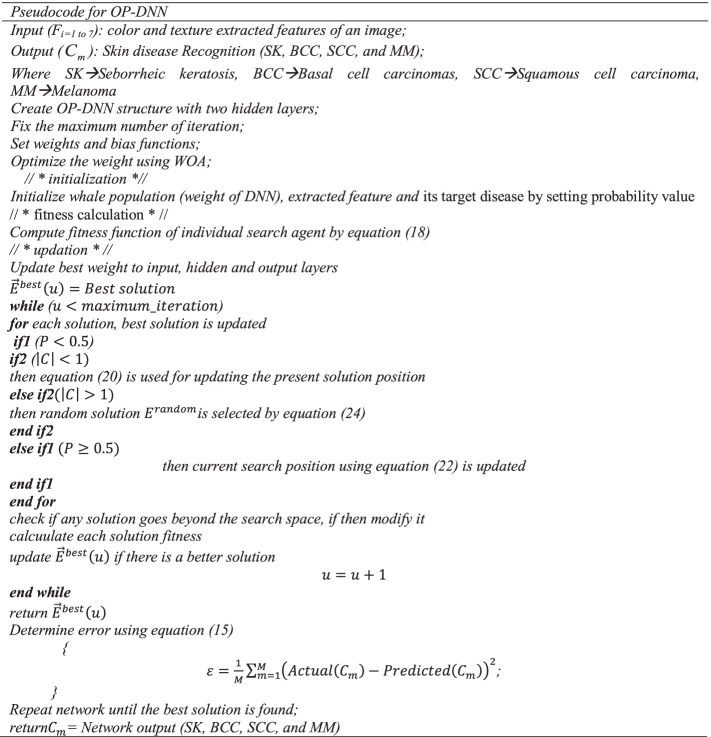
The pseudo-code of the proposed method is presented below,
Testing phase
During the testing process, test images are given to the classifier, and the classifier uses the knowledge gained at the time of the training phase to categorize the test image. The steps will be repeated until the image is scanned.
Result and discussion
In this segment, implementation outcomes of the developed technique are verified. The experimental results in this section validate the achievability and effectiveness of the proposed methodology. The proposed methodology is implemented in the working platform of MATLAB, and its system description is detailed as follows:
System description
Processor- Intel i3
RAM -8GB
Operating System - Windows 10
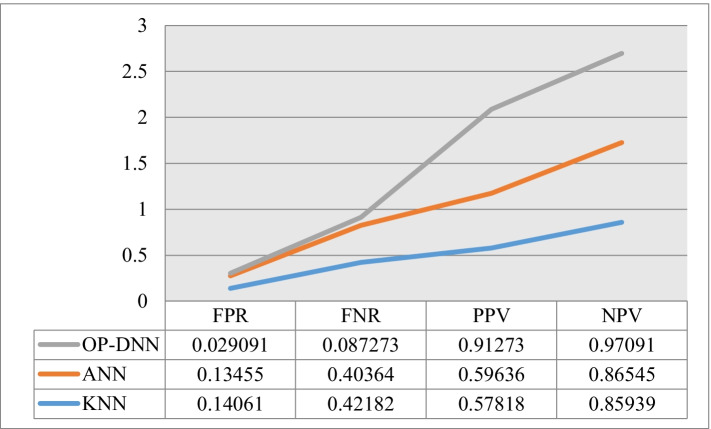
The implementation helps to show the superiority of the proposed research. For classifying four serious skin diseases, initially, the input dataset images are carried out to pre-processing phase. Here the noisy content present in the input images is eliminated, and its brightness gets improved. Then morphological operations are performed to remove the hair elements in the enhanced images. In the next phase, color and texture features are extracted, which are fed into the proposed OP-DNN classifier to classify multi-type skin disease. For analyzing the performance of the proposed research, several performance measures like Positive Predictive Value (PPV), Negative Predictive Value (NPV), False Positive Rate (FPR), and False Negative Rate (FNR) are computed. Additionally, to justify the effectiveness of the proposed algorithm, it is compared with the existing techniques such as ANN and KNN. The execution parameters of the developed method are presented in Table 2.
Table 2.
Execution parameters of the proposed method
| No | Algorithm | Parameters | Value |
|---|---|---|---|
| 1 | WOA | Population Size | 50 |
| 2 | Iteration | 100 | |
| 3 | Dimension | 1 | |
| 4 | Probability Function | 0.5 | |
| 5 | Exection time (second) | 75 |
Dataset description
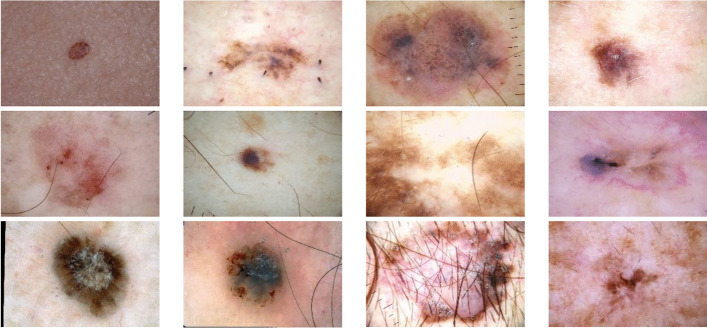
The analysis is performed on ISIC database images (https://www.kaggle.com/umairshahab/dermnet-skin-diesease-images) with different classes. ISIC (International Skin Imaging Collaboration) is an emerging standard to report the technologies, strategies, and terminology utilized in skin imaging. Similarly, ISIC has made and is emerging an open-source, public access archive of skin dermatological images to examine and endorse the planned automated diagnostic systems. The general goal of the ISIC Melanoma Project is to help endeavors to diminish melanoma-related death rate and unnecessary biopsies by improving the accuracy and viability of melanoma early identification. Totally, 23,906 images are presented in the dataset. From that dataset, four diseases were taken for analysis, and its count is 3400images which are divided into two divisions for training (80%) and testing phase (remaining 20%) of OPNN (Fig. 4).
Fig. 4.
Sample input images
The above figure shows the sample input test images which are taken for the identification of multi-type skin diseases.
Evaluation metrics
the evaluation measures such as sensitivity, specificity, accuracy, FPR, FNR, PPV, and NPV definition and its mathematical notations refered from [9] and demonstrated as follows:
Sensitivity- The ratio of the number of true positives to the sum of true positive and false negative is called sensitivity.
| 27 |
Specificity- This measure defines the ratio of a count of true negatives generated to the total of true negatives and false positives obtained.
| 28 |
Accuracy- It can be computed using the measures of specificity and sensitivity. It is mathematically represented as follows,
| 29 |
Positive Predictive Value- It is the probability that subjects with a positive screening test truly have the disease.
| 30 |
Negative Predictive Value -It is the probability that subjects with a negative screening test truly don’t have the disease.
| 31 |
False Positive Rate - It is the proportion of all negatives that still yield positive test outcomes.
| 32 |
False Negative Rate-It is the proportion of positives that yield negative test outcomes with the test.
| 33 |
Performance analysis
The performance analysis of the proposed OP-DNN and existing techniques like KNN and ANN are compared in this section to show the effectiveness of the proposed methodology.
From the analysis of Table 3, it is clear that the predictive values are much higher, whereas the error rates are reduced for the proposed method compared with existing methodologies. For instance, the accuracy attained for KNN is 0.57818, ANN is 0.59636, and OP-DNN is 0.91273. Whereas the metric sensitivity acquired for the proposed methodology is 0.91273and specificity obtained is 0.97091, which are higher than the existing technique. Likewise, FPR, FNR, PPV, and NPV metrics also achieved an efficient value as compared with the other existing algorithms.
Table 3.
Overall comparison table for proposed and existing techniques with different measures
| Measures | Existing KNN classifier | Existing ANN classifier | Proposed OP-DNN Classifier |
|---|---|---|---|
| Sensitivity | 0.57818 | 0.59636 | 0.91273 |
| Specificity | 0.85939 | 0.86545 | 0.97091 |
| Accuracy | 0.78909 | 0.79818 | 0.95636 |
| FPR | 0.14061 | 0.13455 | 0.029091 |
| FNR | 0.42182 | 0.40364 | 0.087273 |
| PPV | 0.57818 | 0.59636 | 0.91273 |
| NPV | 0.85939 | 0.86545 | 0.97091 |
The comparison plots are plotted in the upcoming figures for the clarity of the proposed research work (Figs. 5, 6, and 7).
Fig. 5.
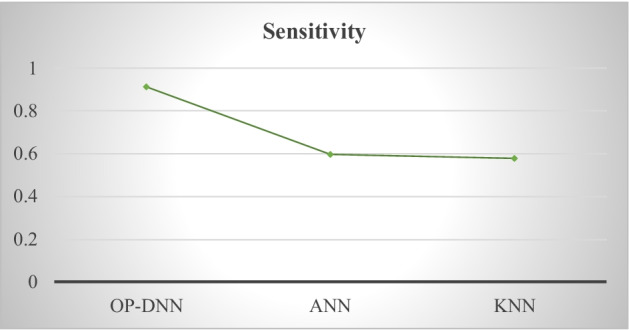
Sensitivity acquired for proposed and existing techniques
Fig. 6.
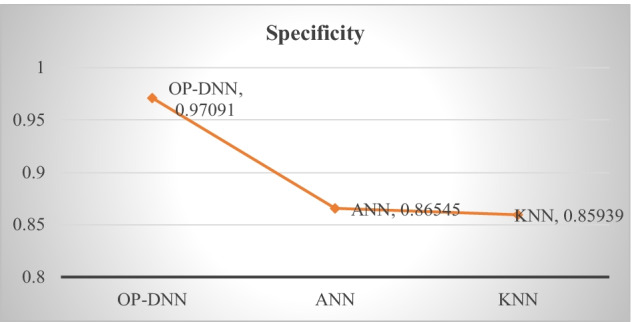
Comparison plot for specificity measure
Fig. 7.
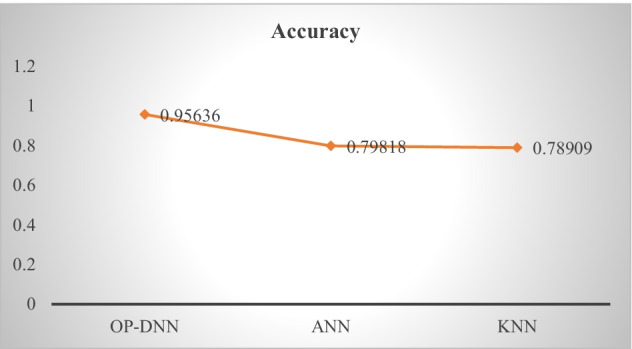
Obtained accuracy for proposed and existing algorithms
From the above comparison plot, the proposed OP-DNN method is more reliable than any other existing technique. When equating sensitivity, specificity, and accuracy, the proposed method demonstrates 0.95636 accuracy and the existing techniques where ANN achieves 0.79818 and KNN achieves 0.78909. Therefore from the detailed analysis, it is clear that the proposed methodology attains better performance with higher accuracy when compared to other classifier algorithms (Fig. 8).
Fig. 8.
Outcome for other measures
The experiment results show that the PPV and NPV values are high for the proposed technique when compared with the existing techniques. Likewise, FPR and FNR measures attain a minimum value with efficient outcomes than other approaches.
Figure 9 shows the comparison graph of the error rate achieved between the anticipated and traditional skin disease classification techniques. From that, the error rate attained for the proposed technique is 0.087273, whereas it is 0.40364 for ANN and 0.42182 for KNN. Therefore from the overall analysis, it is clear that the anticipated method has given a better performance than the conventional techniques.
Fig. 9.
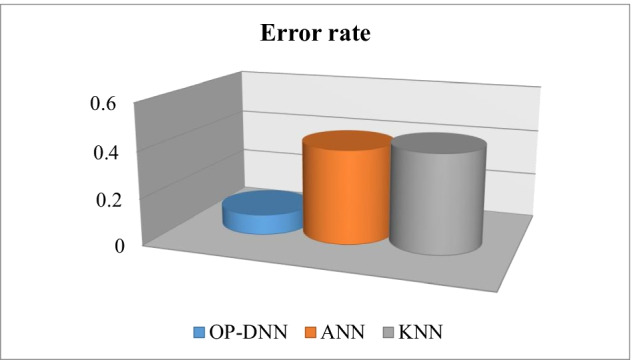
Error rate achieved by proposed and existing techniques
Table 4 demonstrates the comparison analysis of performance metrics among the proposed and the existing techniques such as KNN, Naïve Bayes, Random Forest (RF), MLP, CNN, and LSTM [4]. Compared to other techniques, the proposed technique attained high accuracy of 95%, precision 92, and recall 93. The existing Naïve Bayes comprise accuracy of 78 %, precision 65.3, and recall 67.5. The existing Random Forest (RF) comprises accuracy of 84.8%, precision 82.4, and recall 84.8. The existing MLP comprise accuracy of 91.6%, precision 86.9, and recall 91.6. The existing CNN comprise accuracy of 93.8%, precision 90.2, and recall 92.6. The existing LSTM contains accuracy of 89.3%, precision 87.6, and recall 88.5.
Table 4.
Comparison of performance metrics between the proposed and existing techniques
| Techniques | Accuracy | Precision | Recall |
|---|---|---|---|
| OP-DNN (Proposed) | 95 | 92 | 93 |
| KNN | 78 | 82.6 | 85.7 |
| Naive Bayes | 67.6 | 65.3 | 67.5 |
| Random Forest (RF) | 84.8 | 82.4 | 84.8 |
| MLP | 91.6 | 86.9 | 91.6 |
| CNN | 93.8 | 90.2 | 92.2 |
| LSTM | 89.3 | 87.6 | 88.5 |
Figure 10 Convergence Graph among the Proposed and the Existing Techniques. The proposed optimization algorithms achieved a better performance among other techniques [13]. Table 5 illustrates the comparison execution time between the proposed and the existing techniques such as Adam, Rmsprop, and Sgd. The proposed model takes 90 s to execute the trained dataset, which is less than other existing models. Adam technique takes 102 s for the execution of the trained dataset, Rmsprop takes 108 s for the execution of the trained dataset, and Sgd takes 114 s. This shows the proposed technique achieves better performance compared to existing techniques.
Fig. 10.
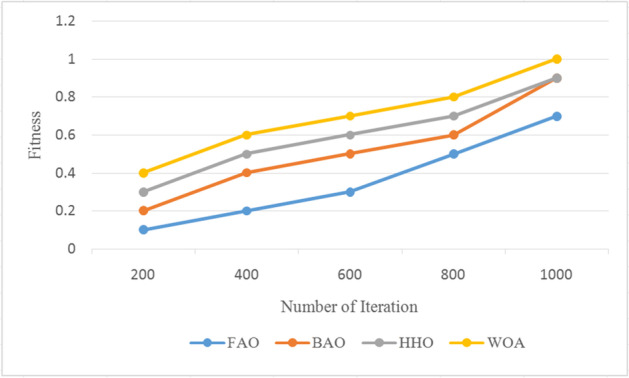
Convergence Graph among the Proposed and the Existing Techniques
Table 5.
Comparison of Execution Time for Trained datasets between the proposed and existing techniques
| Optimizations techniques | Execution Time for Trained Datasets (seconds) |
|---|---|
| Adam | 102 |
| Rmsprop | 108 |
| Sgd | 114 |
| Traditional Back propagation | 100 |
| firefly algorithm | 107 |
| Bat algorithm | 132 |
| Harris Hawks Optimization | 120 |
| Proposed (WOA) | 75 |
Conclusion
The computer-aided system is designed in this manuscript for the identification of skin disease. Initially, the database images are collected and pre-processed using the suggested methods. Then the features like color and texture are extracted for those pre-processed images. The disease classification is performed using OP-DNN, and the optimal weight is selected using WOA. The analysis of the proposed method is compared with existing algorithms to prove the efficiency of the proposed approach. From the overall analysis, the proposed methodology shows 95% accuracy in skin disease identification. To show the effectiveness of the proposed methodology, the error rate calculations are performed, and the obtained error value for the proposed method is 0.087, which is very low than other existing approaches. This work can be extended by improving the efficiency of the approach with varied parameters such as throughput ratio, misdetection rate, etc. In the future, our work will concentrate on training the suggested scheme using large training datasets to avoid possible overfitting in training, pursuing end-to-end training using GPUs with high internal memory, and including MCI cases in the proposed scheme which could be clinically significant.
Declarations
Conflict of interest
There is no conflict of Interest between the authors regarding the manuscript preparation and submission.
Ethical approval
This article does not contain any studies with human participants or animals performed by any of the authors.
Informal consent
Informed consent was obtained from all individual participants included in the study.
Footnotes
Publisher’s note
Springer Nature remains neutral with regard to jurisdictional claims in published maps and institutional affiliations.
References
- 1.Bacanin N, Bezdan T, Venkatachalam K, Al-Turjman F (2021) Optimized convolutional neural network by firefly algorithm for magnetic resonance image classification of glioma brain tumor grade. J Real Time Image Process: 1–14
- 2.Bastanfard A, Magnenat-Thalmann N. GRAPP. 2006. Skin modeling and rendering based on visual perception; pp. 313–318. [Google Scholar]
- 3.Bastanfard A, Bastanfard O, Takahashi H, Nakajima M. Toward anthropometrics simulation of face rejuvenation and skin cosmetic. Comput Animat Virtual Worlds. 2004;15(3-4):347–352. doi: 10.1002/cav.38. [DOI] [Google Scholar]
- 4.Chen K, Franko K, Sang R. Structured model pruning of convolutional networks on tensor processing units. 2021. [Google Scholar]
- 5.Elgamal M. Automatic skin cancer images classification. (IJACSA) Int J Adv Comput Sci Appl. 2013;4(3):287–294. [Google Scholar]
- 6.Fan X, Dai M, Liu C, Wu F, Yan X, Feng Y, Feng Y, Baiquan S. Effect of image noise on the classification of skin lesions using deep convolutional neural networks. Tsinghua Sci Technol. 2019;25(3):425–434. doi: 10.26599/TST.2019.9010029. [DOI] [Google Scholar]
- 7.Gerhana YA, Zulfikar WB, Ramdani AH, Ramdhani MA. IOP Conference Series: Materials Science and Engineering. IOP Publishing; 2018. Implementation of Nearest Neighbor using HSV to Identify Skin Disease; p. 012153. [Google Scholar]
- 8.Hameed N, Shabut AM, Ghosh MK, Hossain MA. Multi-class multi-level classification algorithm for skin lesions classification using machine learning techniques. Expert Syst Appl. 2020;141:112961. doi: 10.1016/j.eswa.2019.112961. [DOI] [Google Scholar]
- 9.Jain PK, Pamula R, Srivastava G. A systematic literature review on machine learning applications for consumer sentiment analysis using online reviews. Comput Sci Rev. 2021;41:100413. doi: 10.1016/j.cosrev.2021.100413. [DOI] [Google Scholar]
- 10.Khan MQ, Hussain A, Rehman SU, Khan U, Maqsood M, Mehmood K, Khan MA. Classification of melanoma and nevus in digital images for diagnosis of skin cancer. IEEE Access. 2019;7:90132–90144. doi: 10.1109/ACCESS.2019.2926837. [DOI] [Google Scholar]
- 11.Kharazmi P, AlJasser MI, Lui H, Wang ZJ, Lee TK. Automated detection and segmentation of vascular structures of skin lesions seen in Dermoscopy, with an application to basal cell carcinoma classification. IEEE J Biomedi Health Informat. 2016;21(6):1675–1684. doi: 10.1109/JBHI.2016.2637342. [DOI] [PubMed] [Google Scholar]
- 12.Liu Y, Jain A, Eng C, Way DH, Lee K, Bui P, Kanada K, et al. A deep learning system for differential diagnosis of skin diseases. Nat Med. 2020;26(6):900–908. doi: 10.1038/s41591-020-0842-3. [DOI] [PubMed] [Google Scholar]
- 13.Modhej N, Bastanfard A, Teshnehlab M, Raiesdana S. Pattern separation network based on the hippocampus activity for handwritten recognition. IEEE Access. 2020;8:212803–212817. doi: 10.1109/ACCESS.2020.3040298. [DOI] [Google Scholar]
- 14.Premaladha J, Ravichandran KS. Novel approaches for diagnosing melanoma skin lesions through supervised and deep learning algorithms. J Med Syst. 2016;40(4):1–12. doi: 10.1007/s10916-016-0460-2. [DOI] [PubMed] [Google Scholar]
- 15.Rostami M, Berahmand K, Forouzandeh S. A novel method of constrained feature selection by the measurement of pairwise constraints uncertainty. J Big Data. 2020;7(1):1–21. doi: 10.1186/s40537-020-00352-3. [DOI] [Google Scholar]
- 16.Rostami M, Berahmand K, Forouzandeh S. A novel community detection based genetic algorithm for feature selection. J Big Data. 2021;8(1):1–27. doi: 10.1186/s40537-020-00398-3. [DOI] [Google Scholar]
- 17.Rostami M, Berahmand K, Nasiri E, Forouzande S. Review of swarm intelligence-based feature selection methods. Eng Appl Artif Intell. 2021;100:104210. doi: 10.1016/j.engappai.2021.104210. [DOI] [Google Scholar]
- 18.Sumithra R, Suhil M, Guru DS. Segmentation and classification of skin lesions for disease diagnosis. Proc Comput Sci. 2015;45:76–85. doi: 10.1016/j.procs.2015.03.090. [DOI] [Google Scholar]
- 19.Tan TY, Zhang L, Lim CP. Intelligent skin cancer diagnosis using improved particle swarm optimization and deep learning models. Appl Soft Comput. 2019;84:105725. doi: 10.1016/j.asoc.2019.105725. [DOI] [Google Scholar]
- 20.Wu Z, Zhao S, Peng Y, He X, Zhao X, Huang K, Wu X, et al. Studies on different CNN algorithms for face skin disease classification based on clinical images. IEEE Access. 2019;7:66505–66511. doi: 10.1109/ACCESS.2019.2918221. [DOI] [Google Scholar]
- 21.Zhang X, Wang S, Liu J, Tao C. Towards improving diagnosis of skin diseases by combining deep neural network and human knowledge. BMC Med Informat Decis Making. 2018;18(2):69–76. doi: 10.1186/s12911-018-0631-9. [DOI] [PMC free article] [PubMed] [Google Scholar]
- 22.Zhang G, Shen X, Chen S, Liang L, Luo Y, Yu J, Jianwei L. DSM: a deep supervised multi-scale network learning for skin cancer segmentation. IEEE Access. 2019;7:140936–140945. doi: 10.1109/ACCESS.2019.2943628. [DOI] [Google Scholar]
- 23.Zhang N, Cai Y-X, Wang Y-Y, Tian Y-T, Wang X-L, Badami B. Skin cancer diagnosis based on optimized convolutional neural network. Artif Intell Med. 2020;102:101756. doi: 10.1016/j.artmed.2019.101756. [DOI] [PubMed] [Google Scholar]
- 24.Zivkovic M, Bacanin Nebojsa, Venkatachalam K, Nayyar Anand, Djordjevic Aleksandar, Strumberger Ivana, Al-Turjman Fadi. COVID-19 cases prediction by using hybrid machine learning and beetle antennae search approach. Sustain Cities Soc. 2021;66:102669. doi: 10.1016/j.scs.2020.102669. [DOI] [PMC free article] [PubMed] [Google Scholar]


