

Abstract
Introduction:
Early systemic and central nervous system viral replication and inflammation may impact brain integrity in people with HIV (PWH), leading to chronic cognitive symptoms not fully reversed by antiretroviral therapy (ART). This study examined associations between cognitive performance and markers of CNS injury associated with acute HIV infection and ART.
Methods:
HIV-infected MSM and transgender women (average age: 27 and education: 13 years) enrolled within 100 days from estimated date of detectable infection [EDDI]. A cognitive performance (NP) protocol was administered at enrollment (before ART initiation) and every 24 weeks until week 192. An overall index of cognitive performance (NPZ) was created using local normative data. Blood (n=87) and cerebrospinal fluid (CSF; n=29) biomarkers of inflammation and neuronal injury were examined before ART initiation. Regression analyses assessed relationships between time since EDDI, pre-ART biomarkers, and NPZ.
Results:
Adjusting for multiple comparisons, shorter time since EDDI was associated with higher pre-ART VL and multiple biomarkers in plasma and CSF. NPZ scores were within the normative range at baseline (NPZ=.52) and at each follow-up visit, with a modest increase through week 192. Plasma or CSF biomarkers were not correlated with NP scores at baseline or after ART.
Conclusions:
Biomarkers of CNS inflammation, immune activation and neuronal injury peak early and then decline during acute HIV infection, confirming and extending results of other studies. Neither plasma nor CSF biomarkers during acute infection corresponded to NP scores before or after sustained ART in this cohort with few psychosocial risk factors for cognitive impairment.
Keywords: Human Immunodeficiency Virus (HIV), Antiretroviral therapy (ART), HIV-associated Neurocognitive Disorder (HAND), Biomarkers, men who have sex with men, transgender women
Introduction
Although HIV-related morbidity and mortality have decreased due to improved access to antiretroviral therapy (ART), people with HIV (PWH) remain at risk for a number of conditions, including cognitive complications.1-6. Among individuals with chronic infection on ART, sustained viral suppression does not fully reverse the cognitive symptoms of HIV. These observations have prompted interest about whether diagnosis and treatment during the earliest stages of HIV infection could prevent development of cognitive symptoms.
Unfortunately, early disease dynamics and development of HIV-related brain injury have been difficult to study. Three recent studies revealed mixed outcomes. Two studies, one in the US (n=16) and one in Thailand (n=36), reported NP impairment rates of 61% and 25% respectively. Interestingly, in the Thai study of acute HIV, CSF viral load (VL) prior to ART predicted NP impairment 6 months after achieving sustained viral suppression during ART, which was initiated within 30 days of infection.7 In contrast, a third cross-sectional study found no difference between a sample of highly educated, treatment-naïve adults with early HIV infection and HIV-uninfected controls.8
The present study was conducted to examine CNS biomarkers of HIV and cognitive status during the first weeks after HIV acquisition and after prolonged viral suppression by ART. To accomplish these goals, we leveraged the unique study design of the Sabes (“Do you know” in Spanish) study, which followed HIV-uninfected men who have sex with men (MSM) and transgender women (TW) in Lima, Peru with monthly HIV testing. Participants with incident infection were enrolled within three months of HIV acquisition and randomized to begin ART immediately or 24 weeks later. We examined relationships between plasma and CSF biomarkers and NP at baseline (pre-ART) and at follow-up assessments during the first year after infection. Finally, we examined the relationship of biomarkers measured at the time of ART initiation and NP scores measured through week 192.
Methods
Study population and procedures
Eighty-seven participants in the Sabes study were included in this analysis.9 Sabes was designed as an expanded treatment-as-prevention strategy in Lima, Peru, starting in 2013. The study was approved by the Ethics Committees of the Fred Hutchinson Cancer Center and the Impacta study sites in Lima; all participants provided written informed consent.
The Sabes study eligibility criteria and procedures were described previously.9 In brief, HIV-negative MSM and TW who were ≥18 years old and reported high risk behaviors for HIV were tested monthly for HIV. Participants with incident HIV infection diagnosed within 3 months of acquisition were eligible for a study of timing of ART initiation and were randomized to initiate ART immediately or to defer for 24 weeks. First line ART regimens were either EFV/FTC/TDF or EVG/cobi/FTC/TDF; participants were switched to EVG/cobi/FTC/TAF upon entry into the extended follow-up protocol (1-4 years after enrollment).10
When funding for neurologic studies was obtained, we initiated NP testing and CSF collection. Ninety-one percent of Sabes participants enrolled after this date joined the neurologic sub-study (conducted from 3/2015 to 10/2016); the demographic profile of sub-study participants did not differ from other Sabes study participants (data not shown). Participants (N=87) underwent NP testing at study enrollment (week 0, prior to ART initiation) and at weeks 12, 24, 48, 72, 96, 120, 144, 168, and 192. Analysis of blood (n=87) and CSF (n=29) samples from the enrollment visit, week 24 and 48 are included in the analyses.
Participants were excluded if they 1) had received an HIV vaccine, cytotoxic, nephrotoxic, or immunosuppressive medications, or feminizing hormones, or 2) reported a history of traumatic brain injury or severe neurological disease. Operational definitions of acute and recent infection were used to establish eligibility for the study of timing of ART initiation. However, because we had detailed histories of HIV testing, including date, type and result of test, we were able to more precisely estimate the date of HIV acquisition for analysis. The Estimated Date of Detectable Infection (EDDI), defined for each individual as the day of their first detectable HIV viremia, was calculated using an established algorithm.11
NP Testing
Participants completed a NP battery that had been previously translated into Spanish and validated for use in Peru.12,13 Tests were administered by psychologists following training and certification. The battery included tests from the following cognitive domains: Gross Motor: Timed Gait; Fine Motor Speed: Grooved Pegboard and Finger Tapping (dominant and nondominant hands); Psychomotor/Executive Function: Color Trails 1 and 2, Stroop Color Word Interference Test; Language: Animal Fluency, Verbal Learning and Memory: Hopkins Verbal Learning Test-Revised (HVLT-R). Performances were converted to age- and education-adjusted z scores using local normative data.12,13 Scores were averaged across tests to derive an overall NP score (NPZ).
Laboratory Methods
We used custom multiplex plate-based chemiluminescent immunoassay panels (MSD U-PLEX, Meso Scale Diagnostics, Rockville, MD) to quantify plasma and CSF levels of tumor necrosis factors (TNF-α, TNF-β), stromal-derived factor 1/Chemokine ligand-12 (SDF-1α/CXCL-12), macrophage inflammatory proteins (MIP-1α/CCL-3 and MIP-1β/CCL-4), monocyte chemoattractant protein-1 (MCP-1/CCL-2), Interleukins (IL-1α, IL-1β, IL-2, IL-4, IL-6, IL-7, IL-8, IL-10, IL-12p70, IL-16, IL-23p40), Interferons (IFN-γ, IFN-α2a), and Interferon-responsive Protein-10 (IP-10). Luminex multiplex assays (Luminex Millipore, Burlington, MA), were used to evaluate plasma and CSF levels of MMP-2, MMP-9 (Millipore map Human MMP Magnetic Bead Panel 2), amyloid β – 40, amyloid β – 42, and total Tau protein (Human Amyloid Beta and Tau multiplex) and VCAM-1, Osteopontin, TIMP-1, YKL-40, (R&D Systems, Human Magnetic Luminex Assay, Minneapolis, MN). For the MSD and Luminex assays, we followed manufacturer instructions.14 We also quantified soluble CD163 (sCD163), S100B, neopterin, and neurofilament light chain (NFL) in CSF and plasma, and plasma soluble CD14 (sCD14) using an enzyme linked immunosorbent assay (Quantikine ELISA, R&D Systems Inc, Minneapolis, MN).
Plasma was additionally analyzed for high-sensitivity C-reactive protein (hsCRP) (Siemens Healthcare Diagnostics Inc., Newark, DE) and D-dimer with Diazyme reagents (San Diego, CA) in the same samples. Blood was tested for CD4+ and CD8+ T cells (cells/mm3), and for syphilis using the Venereal Disease Research Laboratory Test.15 CSF samples were analyzed for glucose, HIV VL, red blood cell (RBC), leukocyte count and differential, and total protein. Several biomarkers were selected a priori as primary variables of interest based on prior research, including plasma and CSF MCP-1, neopterin, neurofilament light chain, soluble CD14 and CD163, and IP-10.
Statistical Analysis
We first analyzed time since EDDI as a predictor of plasma and CSF VL, and inflammatory marker levels. We used the Loess method to generate smoothed curves for CSF and plasma VL as a function of EDDI, plotting time from EDDI to enrollment on the X axis and the corresponding VL on the Y axis. Participants contributed plasma and CSF VL at a single timepoint (the enrollment visit) indexed to their time since EDDI. Linear regression was then used to estimate changes in VL and biomarkers over time since EDDI, again using data only from the enrollment visit.
Biomarkers were measured at baseline (prior to ART for all participants), at 24 weeks (after 24 weeks of ART for immediate arm participants, prior to ART for deferred arm participants) and at 48 weeks (for deferred arm participants only, after 24 weeks of ART). Linear regression was used to evaluate cross-sectional associations between biomarkers in plasma or CSF, and NP scores measured at the same timepoint (enrollment, weeks 24 and 48). Finally, we used simple linear regression with the biomarker levels in plasma and CSF at the time of ART initiation (either week 0 or week 24) as predictors of NP scores during follow-up through week 192. An exploratory analysis was conducted using linear mixed models to assess the effect of biomarker levels at ART initiation on NP scores over time. Analyses used log10-transformed concentrations of the biomarkers listed above, except for plasma D-dimer and CRP, in accordance with convention. Analyses were conducted separately for individuals randomized to the immediate vs. the deferred arms. Multiple comparisons were controlled using Benjamin-Hochberg (BH) corrected p-values.16
Results
Participant Characteristics
Study participants had a median age of 27 years (range: 21– 30) and 13 years of education (range: 11 – 14; Tab). Only 3 participants had PEth levels (>112 ng/mL),17 consistent with high level alcohol use. Although AUDIT scores ≥15 were recorded at the screening visit for 22 participants, their NP scores did not differ from those with scores <15 ([p=0.65], data not shown). Few participants reported marijuana and cocaine use; none reported opioid or methamphetamine use. Baseline NP scores for MSM and transgender women did not differ (p=0.38); the two groups were combined for analysis.
At enrollment, the median number of days from EDDI was 42 (range: 25-57) and all participants were ART naïve. At this visit, the median log10 plasma VL was 5.8 (4.9-6.5), and the median log10 CSF VL was 2.5 (1.3-3.2). Demographic characteristics and time from EDDI did not differ between individuals who did vs. did not undergo lumbar puncture (LP) (for all comparisons, p > .05). Mean plasma VL was significantly lower in those who completed the LP (p < .05), although the difference was less than one log and medians did not differ. Comorbid syphilis was present in three participants. VL, IL-8, IL-10, CD-163, and VCAM-1 in plasma were lower in participants with vs. without syphilis but baseline CSF biomarkers and NP were similar.
Associations of EDDI with VL and Biomarkers in Plasma and CSF During Early HIV Infection
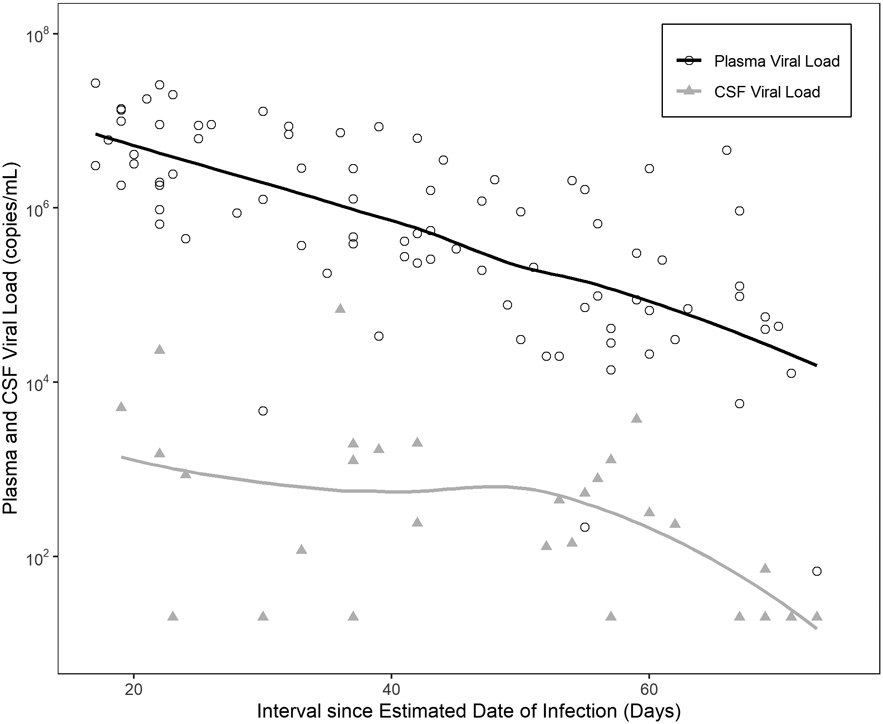
Shorter time since EDDI was associated with higher plasma (n=87) and CSF (n=29) VL measured 16 to 99 days after estimated time of HIV acquisition (Figure 1); plasma β-coefficient = −0.28 log10 copies/mL/week of infection (p-value <0.0001) and CSF β-coefficient = −0.13 log10 copies/mL/week of infection (p-value .03).
We observed significant relationships between time since EDDI and multiple inflammatory biomarkers. Plasma biomarkers that decreased over time since EDDI (before ART) included IFN-γ, IL-10, VCAM-1, MCP-1, S100B, and neopterin. Plasma MMP9, YKL-40 and sCD163 increased significantly over time since EDDI prior to ART initiation. CSF inflammatory biomarkers that decreased over time since EDDI included MIP-1α, sCD-163, VCAM-1, IL-6, neopterin, IFN-γ, IL2, TNF-α, and IL-23 (Table 2). NFL, a biomarker of active neuronal injury, also decreased over time since EDDI.
Table 2. Association of Biomarkers with Time from Estimated Date of HIV Infection.
Linear regression coefficients of baseline biomarker levels significantly associated with time since EDDI, (p≤ .05 following BH correction).
| Biomarker Name | B-coefficient (change in log10 ug/ml/analyte/week of infection) |
P-value | Benjamini- Hochberg adjusted p-value |
|---|---|---|---|
| Negatively Associated Plasma Biomarkers | |||
| Plasma IFN-γ | −0.01 | <0.001 | <0.001 |
| Plasma IL-10 | −0.008 | <0.001 | <0.001 |
| Plasma VCAM | −0.006 | <0.001 | <0.001 |
| Plasma Viral Load | −0.038 | <0.001 | <0.001 |
| Plasma MCP-1 | −0.003 | 0.005 | 0.026 |
| Plasma S100B | −0.005 | 0.011 | 0.041 |
| Plasma Neopterin | −0.004 | 0.011 | 0.041 |
| Plasma IP-10 | −0.005 | 0.018 | 0.061 |
| Plasma IFN-α2a | −0.014 | 0.037 | 0.105 |
| Negatively Associated CSF Biomarkers | |||
| CSF MIP-1α | −0.007 | <0.001 | <0.001 |
| CSF CD163 | −0.006 | <0.001 | <0.001 |
| CSF VCAM-1 | −0.006 | <0.001 | <0.001 |
| CSF IL-6 | −0.01 | 0.001 | 0.007 |
| CSF Neopterin | −0.009 | 0.001 | 0.007 |
| CSF IFN-γ | −0.015 | 0.003 | 0.017 |
| CSF IL-2 | −0.005 | 0.009 | 0.038 |
| CSF TNF-α | −0.005 | 0.01 | 0.038 |
| CSF Neurofilament Light Chain | −0.007 | 0.01 | 0.038 |
| CSF IL-23 | −0.014 | 0.013 | 0.044 |
| CSF Viral Load | −0.027 | 0.015 | 0.046 |
| CSF IL-10 | −0.012 | 0.027 | 0.076 |
| CSF IL-7 | −0.004 | 0.031 | 0.081 |
| CSF S100B | −0.008 | 0.036 | 0.087 |
| CSF YKL40 | −0.006 | 0.044 | 0.098 |
| CSF IL-16 | −0.004 | 0.046 | 0.098 |
| Positively Associated Plasma Biomarkers | |||
| Plasma MMP9 | 0.006 | <0.001 | <0.001 |
| Plasma YKL40 | 0.005 | 0.002 | 0.012 |
| Plasma CD163 | 0.004 | 0.008 | 0.037 |
| Plasma IL-1b | 0.014 | 0.032 | 0.099 |
Cross Sectional Analysis of Biomarkers and Neurocognitive Performance
At baseline, the distribution of NPZ scores was bimodal, with peaks at −0.5 and +0.5. The mean z score was centered at ~0. During the study, NPZ scores increased steadily after ART, from a mean of 0.04 at baseline to 0.74 (Immediate) or 0.64 (Deferred) at week 192 (Table 3). At baseline in all participants, higher plasma IL-1α and IL-12 and lower CSF MIP-1α were associated with higher NP, but these relationships were not significant after BH adjustment. A trend was observed between baseline levels of CSF neopterin, one of the markers selected a priori, and NPZ (B-coefficient −0.528, p-value .069).
Table 3.
Overall NPZ scores over time reported separately for the immediate and deferred arm participants
| Weeks after ART Initiation |
Week 0 |
Week 12 |
Week 24 |
Week 48 |
Week 72 |
Week 96 |
Week 120 |
Week 144 |
Week 168 |
Week 192 |
|---|---|---|---|---|---|---|---|---|---|---|
| Immediate Arm | ||||||||||
| Mean | 0.04 | 0.26 | 0.37 | 0.45 | 0.51 | 0.54 | 0.68 | 0.63 | 0.71 | 0.74 |
| Median | 0.03 | 0.27 | 0.43 | 0.5 | 0.55 | 0.52 | 0.67 | 0.7 | 0.82 | 0.84 |
| SD | 0.45 | 0.42 | 0.45 | 0.47 | 0.46 | 0.46 | 0.48 | 0.49 | 0.51 | 0.46 |
| Deferred Arm | ||||||||||
| Mean | 0.04 | 0.19 | 0.32 | 0.34 | 0.44 | 0.54 | 0.48 | 0.55 | 0.62 | 0.64 |
| Median | −0.03 | 0.31 | 0.41 | 0.43 | 0.54 | 0.66 | 0.52 | 0.53 | 0.66 | 0.65 |
| SD | 0.42 | 0.45 | 0.48 | 0.5 | 0.42 | 0.46 | 0.49 | 0.45 | 0.41 | 0.34 |
In unadjusted analyses, higher plasma sCD163 and IL-16, and CSF IL-23 were associated with lower NPZ in the immediate arm at 24 weeks. In the deferred arm, higher plasma levels of neopterin, IL-23 and CSF levels of IL-10, IL-1α, TNFα, sCD163, IL-2 and neopterin were associated with higher NP score at 24 weeks, though these relationships were not significant after BH correction. No significant associations were seen at 48 weeks (measured only in the deferred arm after 24 weeks of ART).
Baseline Biomarkers as Predictors of Neurocognitive Performance over Time
Levels of the 36 plasma and the 33 CSF biomarkers at the time of ART initiation (week 0 in the immediate arm and week 24 in the deferred arm) were not associated with NPZ scores at any point during follow-up, after BH correction. In participants who began ART immediately, only one biomarker selected a priori, plasma sCD163, was correlated with subsequent NPZ scores in unadjusted analysis: linear regression coefficient = −0.68 at week 120 and −0.683 at week168 (p=0.019 and 0.023, respectively). Both were non-significant after BH correction (p=0.68 and 0.83, respectively). In the deferred group, unadjusted analyses for markers selected a priori revealed associations between pre-ART plasma sCD14 and NPZ scores at weeks 72 and 120 (linear regression coefficient = 2.74 and 2.95, p=0.019 and 0.028, respectively). Pre-ART CSF MCP-1 showed an association to NPZ at weeks 72 and 120 (linear regression coefficient = 1.29 and 1.44, p=0.049 and 0.04, respectively). However, the relationships for both biomarkers were non-significant after BH correction (sCD14: p=0.68 and 0.65) and (MCP=1: p=.57 and .68, respectively).
In LME models including interaction terms to assess association of biomarker levels at ART initiation with change in NP scores over time, no significant effects were found for CSF after BH correction. Plasma TNFα, MIP-1α and IL-1α were negatively associated with change in NP scores in both arms (data not shown).
To examine the potential impact of EFV on NP test results, we compared NPZ scores at the last timepoint on EFV to scores 24 weeks later when the participant was on a non-EFV regimen. Total NPZ scores increased modestly after the switch (Mean +/− SD: 0.526 +/− 0.471 vs. 0.416 +/− 0.504). The difference in NPZ was statistically significant, but the magnitude of change is very small (~ 0.2 SD) and unlikely to be clinically relevant. This is supported by the observation that the NPZ scores at both timepoints were in the average range.
Discussion
In this study we examined the dynamics of HIV viral load and markers of inflammation and neuronal damage during primary HIV infection, as well as their relation to NP function at concurrent and subsequent timepoints. Using the baseline VL and the estimated time since HIV acquisition for each participant, we re-constructed the course of plasma and CSF VL during primary infection, prior to ART initiation. Among these ART-naïve participants, levels of HIV RNA in both the plasma and CSF were highest at the earliest post-infection timepoints, reflecting a peak ~2 weeks after EDDI in both compartments. The magnitude of difference between blood and CSF VL (higher levels in blood) was consistent with previous studies of acute HIV infection.18-20 For the first time, this study showed that prior to ART onset, CSF VL decreases over the first 100 days of infection in parallel to changes observed in blood. Our findings also build on prior studies reporting elevated plasma and CSF inflammatory biomarkers during acute HIV infection in ART-naiïve individuals.21-23 In a separate cohort of ART-naïve individuals enrolled in primary, but not acute, infection (median 77 days post infection) concentrations of HIV RNA, WBC, CCL2 and CXCL10 in CSF were similar to levels seen in participants with chronic infection.24 Levels of neopterin were higher in participants in primary, as compared to chronic, HIV infection with highest levels recorded among participants sampled in the earliest stages of infection.24 These results are consistent with our findings, which suggest decreasing neopterin levels during the first 100 days of untreated HIV. A longitudinal study of ART-naïve PWH enrolled an average of 100 days after infection showed increasing levels of CSF neopterin, over an average of 421 days from infection.25 Our findings suggest that mechanisms of innate immune control begin to impact viral replication in the absence of ART during the first 100 days of infection, although there was no evidence of complete suppression prior to treatment onset.
The present study confirms and extends previous studies of early HIV infection detailing elevated levels of inflammatory mediators in blood and CSF.26,27 Unlike previous studies, however, we were able to model time-varying changes in CSF levels of inflammatory markers (e.g., neopterin, MCP-10), which demonstrated a progressive reduction over the first 100 days of infection, prior to ART initiation. By using an extended array of biomarkers, we demonstrated that the acute inflammatory response in the CNS is extremely broad. Our study findings describe concomitant elevations (followed by declines) in markers of early macrophage activation (neopterin), macrophage/microglia activation (VCAM-1, sCD163), pro-inflammatory cytokines and chemokines (TNF α, IL-6, IFN-γ, MIP 1α), and IL-2. The observation of declining levels of these biomarkers prior to the onset of ART underscores the evolving interplay between viral and host immune mechanisms during initial infection.
Like viral load, inflammatory biomarkers did not appear to normalize completely in the absence of ART. Nevertheless, biomarker levels did not predict NP test performance at baseline or any subsequent time point after treatment onset. Adjusted analyses showed a negative association of pre-ART plasma levels of TNFα, MIP-1α and IL-1α and rate of change in NP scores which were overall within the normal range, consistent with influences on NP outcomes beyond practice effects. While the mean performance increased during follow-up, the magnitude of change was modest, and most likely a reflection of practice effects from repeat testing. These findings align with results reported by Moore et al., which demonstrated worse NP test performance in chronic HIV, but normative performance among individuals with acute/primary HIV infection.8 While one study reported NP impairment in small number of Thai adults with acute HIV, a more recent paper describing extended follow-up of the same cohort revealed normalization of NP test performance after sustained viral control with ART.28. Our test protocol was more comprehensive than that used in other studies of acute infection,23,25 however, a more extensive test protocol may allow deeper cognitive phenotyping to examine associations with biomarkers.
Overall, our findings are consistent with published studies on acute infection in Thailand, which demonstrated CNS viral invasion and inflammation within the first 8 days of infection but normative NP test performance after sustained ART.28 These observations do not contradict the extensive evidence linking CSF biomarkers to NP dysfunction among individuals with chronic infection. Elevated biomarkers in untreated chronic HIV infection likely represent the accrued effects of persistent viral replication and inflammation. It is also important to note that our study participants had few psychosocial risk factors for cognitive impairment in PWH (e.g., substance use disorders).26,29 Additionally, the sample had high-level educational attainment, which is associated with protection from cognitive impairment among PWH.27,30,31 Finally, despite deferral of ART initiation for some participants, all participants began ART in early or late primary infection, a factor that may have contributed to the cognitive health of the study population.
Limitations of the study include the small number of participants with CSF biomarkers and the young participant age, which limits generalizability to older populations. Study regimens at some visits contained efavirenz, but NP scores for participants on efavirenz, while lower, differed by only a small amount (~0.2 SD). In addition, although we analyzed the association between biomarker levels at the time of ART initiation (0 or 24 weeks) and NP scores during follow-up, we did not combine results for immediate and deferred arm participants because 1) the predictive value of the week 0 and week 24 biomarker levels likely differs by arm (e.g., the deferred arm experiences the impact of inflammatory markers from 0 to 24 weeks prior to ART initiation) and 2) deferred arm participants had undergone NP testing at baseline (week 0) and at week 12, and thus benefited from the practice effect (which the immediate arm did not experience) before initiating ART. Thus, the trajectory of NP scores after ART initiation are expected to differ in the two arms.
Finally, prospective normative data for HIV-uninfected MSM and TW in Lima followed for the same time period as study participants were not available, as only a single measurement was collected. We believe this does not significantly impact our findings because our central focus was on longitudinal associations between cognitive performance and biomarkers, rather than estimates of cognitive impairment at each time point. In addition, an analysis of associations between biomarkers and the raw NP scores yielded the same results as the analyses using the available normative data (data not shown).
Our study had a number of strengths. First, the unique design of the study that included frequent HIV testing of uninfected individuals, allowed us to identify cases in the earliest phase of acute infection. Use of an infection dating algorithm incorporating all serial test results allowed us to describe variation over time during the first several months of infection (mean time from EDDI to enrollment of 42 days, range 16 - 99 days) and to more precisely model disease dynamics during this critical phase of acute infection. Second, the young participant age, low rates of substance use and neurologic confounding factors, and precisely estimated dates of HIV acquisition allowed analysis of NP test performance in the absence of non-HIV-related etiological mechanisms, a common problem in studies of HAND. Third, longitudinal assessment of NP status using a battery of tests previously validated in Peru allowed reliable measurement of neurocognitive performance over an extended period. Finally, our study made use of state-of-the art immunoassays to quantify 33 CSF and 36 plasma biomarkers in baseline samples before ART initiation, providing a detailed view of immune responses during early HIV infection.
In summary, we found that plasma and CSF VL, and soluble biomarkers declined during the first 100 days after HIV acquisition. NP impairment was rare in our cohort before and after ART, and NP scores were not significantly associated with pre-ART biomarkers related to viral replication, neuroinflammation, or adaptive immunity.
Table 1:
Cohort Characteristics
| Median (IQR) | Total Participants |
Participants providing CSF and plasma samples |
Participants that provided only plasma samples |
P-value |
|---|---|---|---|---|
| N | 87 | 29 | 58 | |
| Time from EDDI (days) | 42 (25 - 57) | 52 (36 - 59) | 41.5 (23 - 55) | 0.12 |
| Age (years) | 27 (21 - 30) | 24 (21 - 30) | 27 (21 - 31) | 0.6 |
| Years of Education^ | 13 (11 - 14) | 13 (11 - 15) | 13 (11 - 14) | 0.63 |
| Monthly Income (Soles) | 750 (375 - 1000) | 720 (400 - 1100) | 750 (300 - 950) | 0.98 |
| Baseline Lab Values: | ||||
| Log10 plasma VL | 5.8 (4.9 −6.5) | 5.0 (4.5 - 6.1) | 6.1 (5.4 - 6.7) | 0.003 |
| Blood CD4+ Count | 510 (384 - 661) | 511 (423 −622) | 506.5 (382 - 683) | 0.97 |
| Log10 CSF VL | 2.5 (1.3 – 3.2) | |||
| CSF WBC count (cells/mm3) | 5 (2.5 - 8) | |||
| CSF Glucose (mg/dL) | 55 (52 - 59) | |||
| CSF Total Protein | 29.8 (23.6 - 34.5) | |||
| Syphilis Screening | 0.02 | |||
| Active Syphilis | 3 | 3 (100%) | 0 | |
| Probable Treated Syphilis | 15 | 3 (20%) | 12 (80%) | |
| No Syphilis | 68 | 22 (32%) | 46 (68%) | |
| NA | 1 | 1 (100%) | 0 | |
| Sexual orientation | 1.0 | |||
| Transgender Woman | 9 | 3 (33%) | 6 (67%) | |
| Cis-MSM | 78 | 26 (33%) | 52 (67%) | |
| Alcohol and Substance Use | ||||
| Alcohol use (PEth)* | 3 | 0 | 3 | 0.22 |
| Marijuana use** | 9 | 1 | 8 | 0.12 |
| Cocaine use** | 4 | 2 | 2 | 0.51 |
| Randomization Arm | ||||
| Immediate Arm | 43 | 13 (30%) | 30 (70%) | 0.54 |
| Deferred Arm | 44 | 16 (36%) | 28 (64%) | |
Study Demographics presented as Median (IQR)
Reflects academic and vocational training
high level (>112ng/mL), data available for 73 participants
in past 30 days, data available for 84 participants
Acknowledgements:
We acknowledge the late Dr. Kevin Robertson, PhD, professor of neurology and director of the AIDS Neurological Center at the University of North Carolina at Chapel Hill for his guidance and essential contributions to this study.
We thank Sabes and MERLIN study teams.
We thank Merck & Co. and Gilead Sciences Inc for ART donation.
The study was supported by NIH/NIDA R01 DA032106 and NIH/NIDA R01 DA040532 (PI: A Duerr) and NIH/ACTG-NIDA: The Effects of Alcohol on Acute HIV Associated Neurocognitive Disorders, (PI: JR Lama).
References:
- 1.Simioni S, Cavassini M, Annoni JM, et al. Cognitive dysfunction in HIV patients despite long-standing suppression of viremia. AIDS 2010;24:1243–50. [DOI] [PubMed] [Google Scholar]
- 2.Sacktor N, Skolasky RL, Seaberg E, et al. Prevalence of HIV-associated neurocognitive disorders in the Multicenter AIDS Cohort Study. Neurology 2016;86:334–40. [DOI] [PMC free article] [PubMed] [Google Scholar]
- 3.Rubin LH, Saylor D, Nakigozi G, et al. Heterogeneity in neurocognitive change trajectories among people with HIV starting antiretroviral therapy in Rakai, Uganda. J Neurovirol 2019;25:800–13. [DOI] [PMC free article] [PubMed] [Google Scholar]
- 4.Heaton RK, Clifford DB, Franklin DR Jr., et al. HIV-associated neurocognitive disorders persist in the era of potent antiretroviral therapy: CHARTER Study. Neurology 2010;75:2087–96. [DOI] [PMC free article] [PubMed] [Google Scholar]
- 5.Eggers C, Arendt G, Hahn K, et al. HIV-1-associated neurocognitive disorder: epidemiology, pathogenesis, diagnosis, and treatment. J Neurol 2017;264:1715–27. [DOI] [PMC free article] [PubMed] [Google Scholar]
- 6.Antinori A, Arendt G, Becker JT, et al. Updated research nosology for HIV-associated neurocognitive disorders. Neurology 2007;69:1789–99. [DOI] [PMC free article] [PubMed] [Google Scholar]
- 7.Kore I, Ananworanich J, Valcour V, et al. Neuropsychological Impairment in Acute HIV and the Effect of Immediate Antiretroviral Therapy. J Acquir Immune Defic Syndr 2015;70:393–9. [DOI] [PMC free article] [PubMed] [Google Scholar]
- 8.Moore DJ, Letendre SL, Morris S, et al. Neurocognitive functioning in acute or early HIV infection. J Neurovirol 2011;17:50–7. [DOI] [PMC free article] [PubMed] [Google Scholar]
- 9.Lama JR, Brezak A, Dobbins JG, et al. Design Strategy of the Sabes Study: Diagnosis and Treatment of Early HIV Infection Among Men Who Have Sex With Men and Transgender Women in Lima, Peru, 2013-2017. Am J Epidemiol 2018;187:1577–85. [DOI] [PMC free article] [PubMed] [Google Scholar]
- 10.Massanella M, Bender Ignacio R, Lama JR, et al. Long-term effects of early antiretroviral initiation on HIV reservoir markers: a longitudinal analysis of the MERLIN clinical study. The Lancet Microbe 2021;2:E198–E209. [DOI] [PubMed] [Google Scholar]
- 11.Grebe E, Facente SN, Bingham J, et al. Interpreting HIV diagnostic histories into infection time estimates: analytical framework and online tool. BMC Infect Dis 2019;19:894. [DOI] [PMC free article] [PubMed] [Google Scholar]
- 12.Robertson K, Jiang H, Evans SR, et al. International neurocognitive normative study: neurocognitive comparison data in diverse resource-limited settings: AIDS Clinical Trials Group A5271. J Neurovirol 2016;22:472–8. [DOI] [PMC free article] [PubMed] [Google Scholar]
- 13.Robertson K, Kumwenda J, Supparatpinyo K, et al. A multinational study of neurological performance in antiretroviral therapy-naive HIV-1-infected persons in diverse resource-constrained settings. J Neurovirol 2011;17:438–47. [DOI] [PMC free article] [PubMed] [Google Scholar]
- 14.Chowdhury F, Williams A, Johnson P. Validation and comparison of two multiplex technologies, Luminex and Mesoscale Discovery, for human cytokine profiling. J Immunol Methods 2009;340:55–64. [DOI] [PubMed] [Google Scholar]
- 15.Nayak S, Acharjya B. VDRL test and its interpretation. Indian J Dermatol 2012;57:3–8. [DOI] [PMC free article] [PubMed] [Google Scholar]
- 16.Ferreira JA. The Benjamini-Hochberg method in the case of discrete test statistics. Int J Biostat 2007;3: Article 11. [DOI] [PubMed] [Google Scholar]
- 17.Schrock A, Wurst FM, Thon N, Weinmann W. Assessing phosphatidylethanol (PEth) levels reflecting different drinking habits in comparison to the alcohol use disorders identification test - C (AUDIT-C). Drug Alcohol Depend 2017;178:80–6. [DOI] [PubMed] [Google Scholar]
- 18.Chan P, Patel P, Hellmuth J, et al. Distribution of Human Immunodeficiency Virus (HIV) Ribonucleic Acid in Cerebrospinal Fluid and Blood Is Linked to CD4/CD8 Ratio During Acute HIV. J Infect Dis 2018;218:937–45. [DOI] [PMC free article] [PubMed] [Google Scholar]
- 19.Lindback S, Karlsson AC, Mittler J, et al. Viral dynamics in primary HIV-1 infection. Karolinska Institutet Primary HIV Infection Study Group. AIDS 2000;14:2283–91. [DOI] [PubMed] [Google Scholar]
- 20.Robertson K, Fiscus S, Kapoor C, et al. CSF, plasma viral load and HIV associated dementia. J Neurovirol 1998;4:90–4. [DOI] [PubMed] [Google Scholar]
- 21.Hellmuth J, Slike BM, Sacdalan C, et al. Very Early Initiation of Antiretroviral Therapy During Acute HIV Infection Is Associated With Normalized Levels of Immune Activation Markers in Cerebrospinal Fluid but Not in Plasma. J Infect Dis 2019;220:1885–91. [DOI] [PMC free article] [PubMed] [Google Scholar]
- 22.Sereti I, Krebs SJ, Phanuphak N, et al. Persistent, Albeit Reduced, Chronic Inflammation in Persons Starting Antiretroviral Therapy in Acute HIV Infection. Clin Infect Dis 2017;64:124–31. [DOI] [PMC free article] [PubMed] [Google Scholar]
- 23.Teigler JE, Leyre L, Chomont N, et al. Distinct biomarker signatures in HIV acute infection associate with viral dynamics and reservoir size. JCI Insight 2018;3. [DOI] [PMC free article] [PubMed] [Google Scholar]
- 24.Spudich S, Gisslen M, Hagberg L, et al. Central nervous system immune activation characterizes primary human immunodeficiency virus 1 infection even in participants with minimal cerebrospinal fluid viral burden. J Infect Dis 2011;204:753–60. [DOI] [PMC free article] [PubMed] [Google Scholar]
- 25.Suh J, Sinclair E, Peterson J, et al. Progressive increase in central nervous system immune activation in untreated primary HIV-1 infection. J Neuroinflammation 2014;11:199. [DOI] [PMC free article] [PubMed] [Google Scholar]
- 26.Byrd DA, Fellows RP, Morgello S, et al. Neurocognitive impact of substance use in HIV infection. J Acquir Immune Defic Syndr 2011;58:154–62. [DOI] [PMC free article] [PubMed] [Google Scholar]
- 27.Kabuba N, Menon JA, Franklin DR, Lydersen S, Heaton RK, Hestad KA. Effect of age and level of education on neurocognitive impairment in HIV positive Zambian adults. Neuropsychology 2018;32:519–28. [DOI] [PMC free article] [PubMed] [Google Scholar]
- 28.Chan P, Kerr SJ, Kroon E, et al. Cognitive trajectories after treatment in acute HIV infection. AIDS 2021;35:883–8. [DOI] [PubMed] [Google Scholar]
- 29.Kennedy CA, Zerbo E. HIV-Related Neurocognitive Disorders and Drugs of Abuse: Mired in Confound, Surrounded by Risk. Current Addiction Reports 2014;1:229–26. [Google Scholar]
- 30.Morgan EE, Woods SP, Smith C, et al. Lower cognitive reserve among individuals with syndromic HIV-associated neurocognitive disorders (HAND). AIDS Behav 2012;16:2279–85. [DOI] [PMC free article] [PubMed] [Google Scholar]
- 31.Stern RA, Silva SG, Chaisson N, Evans DL. Influence of cognitive reserve on neuropsychological functioning in asymptomatic human immunodeficiency virus-1 infection. Arch Neurol 1996;53:148–53. [DOI] [PubMed] [Google Scholar]