Abstract
Background and Purpose
Super‐resolutionreconstruction (SRR) can be used to reconstruct 3‐dimensional (3D) high‐resolution (HR) volume from several 2‐dimensional (2D) low‐resolution (LR) stacks of MRI slices. The purpose is to compare lengthy 2D T2‐weighted HR image acquisition of neonatal subjects with 3D SRR from several LR stacks in terms of image quality for clinical and morphometric assessments.
Methods
LR brain images were acquired from neonatal subjects to reconstruct isotropic 3D HR volumes by using SRR algorithm. Quality assessments were done by an experienced pediatric radiologist using scoring criteria adapted to newborn anatomical landmarks. The Wilcoxon signed‐rank test was used to compare scoring results between HR and SRR images. For quantitative assessments, morphology‐based segmentation was performed on both HR and SRR images and Dice coefficients between the results were computed. Additionally, simple linear regression was performed to compare the tissue volumes.
Results
No statistical difference was found between HR and SRR structural scores using Wilcoxon signed‐rank test (p = .63, Z = .48). Regarding segmentation results, R 2 values for the volumes of gray matter, white matter, cerebrospinal fluid, basal ganglia, cerebellum, and total brain volume including brain stem ranged between .95 and .99. Dice coefficients between the segmented regions from HR and SRR ranged between .83 ± .04 and .96 ± .01.
Conclusion
Qualitative and quantitative assessments showed that 3D SRR of several LR images produces images that are of comparable quality to standard 2D HR image acquisition for healthy neonatal imaging without loss of anatomical details with similar edge definition allowing the detection of fine anatomical structures and permitting comparable morphometric measurement.
Keywords: mitigate motion, neonatal brain MRI, segmentation, super‐resolution, T2‐weighted
INTRODUCTION
Prematurity and neonatal brain injuries are important risk factors for developmental abnormalities 1 that might result in long‐term neurodevelopmental impairments with an impact in both childhood and adulthood. 2 , 3 MRI is commonly used for clinical diagnostic purposes and is suitable for the assessment of early brain development in pediatric imaging. 4 The analysis and characterization of early brain development using MRI have increased over the years. 5 , 6 , 7 In newborn imaging, T2‐weighted (T2w) high‐resolution (HR) MRI is typically used, because it provides the best gray‐white matter (WM) contrast in the pre‐myelinated neonatal brain for clinical diagnosis and morphometric purposes, such as brain segmentation, whereas T1‐weighted (T1w) imaging is mainly used to visualize the myelination process. 8
Subject motion is a limitation for acquiring good contrast and high‐quality images, which is especially challenging for uncooperative subjects like infants. In clinics, sedation or general anesthesia can be used to circumvent motion; however, in research settings it is not possible due to ethical considerations. Therefore, there is a strong need for new techniques to circumvent motion in order to improve image quality and prevent unnecessary reacquisition of motion‐corrupted images. Several methods have been developed to overcome the subject motion problem including parallel imaging and robust k‐space sampling. 9 , 10
One approach is to split the lengthy HR acquisitions into several fast low‐resolution (LR) scans and to combine the images to reconstruct a final 3‐dimensional (3D) volume using super‐resolution (SR) algorithms. 11 The main advantage of this approach is the avoidance of additional hardware requirements, in contrast to the other existing techniques, and the minimization of the reacquisition time in the case of a corrupted scan.
Super‐resolution reconstruction (SRR) has been widely used in image processing 12 and recently adapted to MRI taking advantage of the capability of controlling slice thickness, acquisition speed, and orientation, in order to achieve the desired image resolution. 13 , 14 In SRR, to improve the resolution efficiently, new information needs to be added, which is generally done by subpixel translation or rotation. In MRI, this can be achieved by either acquiring anisotropic voxels in a different orientation or by shifting the field‐of‐view. Among recent studies of SRR on fetal and neonatal MRI, 11 , 15 , 16 , 17 , 18 , 19 , 20 Rousseau et al. proposed an algorithm where three orthogonal MRI volumes were acquired and slice‐to‐volume registration was applied before reconstructing the HR volume. 16 Later, Gholipour et al. proposed an explicit model of MR image formation, and showed how multiple observations could be used to determine the unobserved HR data using a forward model of the observed LR data. 17 They applied their model to pediatric and fetal MR images. The acquisition of thick slices has led to a reduction of the image acquisition time and thus reduces the risk of motion artifacts.
In this study, we used an SRR method for obtaining 3D HR MRI volumes with good contrast and sharp edges from healthy neonatal infant brains. SRR volumes were reconstructed using a multiscale gradient field prior from several orthogonal 2‐dimensional (2D) T2w LR MR stacks based on the recent work by Sui et al. 21 We assessed the quality of the final SRR compared to the standard HR image in two ways: (1) comparison of the segmentation results from both images and (2) fine structures visibility scoring by a pediatric radiologist. The selected structures are considered to play an important role in the assessment of early brain development.
METHODS
Subjects
The population assessed in this study has been recruited at the neonatal and maternity units from 2017 to 2020, as part of a research study that aims to assess the impact of prematurity on early brain development. Full‐term (FT) newborns (n = 23), with a gestational age (GA) at birth between 37 and 41 weeks, were scanned 2–3 days after birth (between 39 and 41 weeks GA). Preterm infants (n = 45), born between 24 and 32 weeks GA, were scanned twice: soon after birth, namely, preterm at birth (PTB) between 33 and 34 weeks GA, and at term equivalent age (TEA), between 39 and 41 weeks GA. Research Ethics Committee approval was granted for the study and written parental consent was obtained prior to infants’ participation in the study.
Imaging protocol
All examinations were performed on a 3T MRI scanner (Prisma, Siemens, Erlangen, Germany) with a 16‐channel receiver neonatal head coil (LMT medical systems, Lübeck, Germany). None of the newborns received sedation or general anesthesia during the examination. Subject motions were limited by wrapping babies and using air pillows. For the standard HR 2D T2w image, the turbo spin echo (TSE) sequence was used (coronal slices covering the whole brain, repetition time [TR] = 4990 ms, echo time [TE] = 160 ms, echo train length [ETL] = 15, flip angle [FA] = 150°, concatenation [number of stacks] = 6, acquisition time [TA] = 5 minutes, and spatial resolution = 0.8 × 0.8 × 1.2 mm3).
For SRR, three orthogonal (coronal, sagittal, and axial) low‐resolution 2D T2w TSE images were acquired from 35 neonatal subjects including FT (n = 5), PTB (n = 10), and TEA (n = 20). LR images of 28 subjects were acquired with the following parameters: TR = 7470 ms, TE = 157 ms, ETL = 9, TA = 1.14 minutes for single LR acquisition, yielding total TA = 3.42 minutes, FA = 150°, concatenation = 1, with in‐plane resolution of 0.8 × 0.8 mm2 and through‐plane resolution of 3 mm. LR images of seven subjects were acquired with following parameters: TR = 10,000 ms, TE = 92 ms, ETL = 9, TA = 1.20 minutes, FA = 150°, concatenation = 1, with in‐plane resolution of 0.6 × 0.6 mm2 and through‐plane resolution of 2 mm. A phantom dataset was acquired from an ACR phantom using the TSE sequence with the same imaging and reconstruction protocols for the validation of the SRR algorithm. LR images of the phantom were acquired with in‐plane resolution 0.8 × 0.8 mm2 and through‐plane resolution of 3 mm.
Theory
SRR algorithms can be classified either as forward‐based or as learning‐based method. In the present work, we used a forward‐based model SRR, which relies on the physics of the image acquisition system. 12 In MRI, it is based on a linear acquisition model, where is LR stacks (through‐plane resolution is often lower than in‐plane), N is the number of LR stacks, is the down‐sampling operator (through‐plane direction), P is the point spread function (PSF), is a geometric transformation between the stacks, and denotes the SR volume to be estimated from LR images. Because SRR is an ill‐posed problem, regularization is often incorporated to isolate the desired solution from indefinitely many feasible solutions. A maximum a posteriori (MAP) approach is thus leveraged to solve the SRR, where denotes the prior that is implemented as the regularization and is a balancing parameter between the data fidelity and regularization. L2 norm minimizes the error, whereas the regularization improves the edges in the reconstructed SR image. In this study, a multiscale gradient field prior, as proposed previously, 21 was used to guide both spatial smoothness and edge preservation in multiple scales during the iterations of the optimization.
The multiscale gradient field prior can be formulated as where function (see definition in Figure 1) enhances the sharpness of large edges, while penalizing gradient perturbations (thus imposing smoothness), and is a (nonnegative) constant that balances gradient enhancement and smoothing of perturbations. Note that, the blurring operator (P) from the data fidelity results in inaccurate edge localization; therefore, to improve edge definition, gradients need to be computed at multiple scales and update the SR estimation during the optimization.
FIGURE 1.
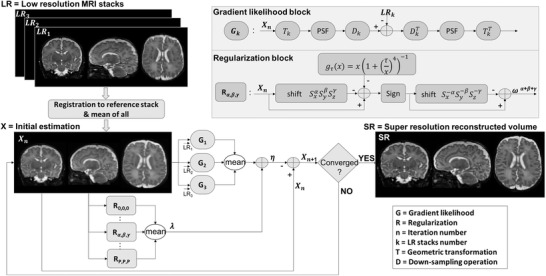
Flowchart of the super‐resolution reconstruction algorithm (PSF, point spread function)
SRR implementation
Multiscale gradient prior regularization combined with SR algorithm was used to reconstruct a HR volume from three mutually orthogonal LR images of each neonatal subject (n = 35 subjects). All the steps in SR reconstruction were implemented using MATLAB, version R2017a (MathWorks, Natick, MA). SRR procedure took about 10 minutes per subject using MacBook Pro, 2017 (Processor: 2.9 GHz Intel Core i7, Memory: 16 GB).
PSF in the through‐plane direction can be inferred from slice‐select excitation profile. 22 Therefore, the slice profile used in this algorithm was measured from a phantom by modifying the TSE sequence such that the readout is placed in the slice direction. 23 The slice profile measured was a Gaussian function as confirmed in literature 15 , 16 , 17 , 18 , 19 , 20 , 21 with a full width half maximum equal to the slice thickness that was chosen as PSF throughout the processing.
The geometrical transformation matrix (Tk ) for each LR stack was obtained using the image orientation and image position patient information from the DICOM metadata. Each LR stack was rigidly registered to the reference stack to correct for intervolume displacements using mutual information‐based registration method. 24 The average of the registered images provided the initial estimation of the reconstructed SR volume. The iteration process is illustrated with a flowchart in Figure 1.
The gradient likelihood block () represents the comparison of each acquired LR image () versus the geometrically transformed (), convolved with PSF and down‐sampled () current estimation of the SR volume (). According to the least squares solution of L2 norm, was updated by applying the adjoint operators to the gradient image.
The regularization block (R α , β , γ ) compares the nth iteration of the SR estimate () with the multiscale gradient prior shifted of itself ( voxels in x, y, and z directions, respectively). The following parameters were chosen to finalize the reconstruction: is the adaptive step size, which varies between [0.8, 0.01] according to iteration process, whereas = 0.05, = 0.065, = 0.6, and p = 2 are fixed as suggested in previous work. 21 Gradient descent optimization was used to find the final HR image, SRR, with a convergence criterion (root mean square error between two iterations <1 × 10⁻⁶).
Segmentation
The neonatal brain has different MRI tissue contrasts compared to the adult brain due to the ongoing myelination process. Therefore, automatic segmentation tools for adult brains are not suitable for neonatal brain images. Existing neonatal brain segmentation tools rely on either manual interaction or the use of atlases. In this study, an automatic segmentation method based on mathematical morphology was used, which does not rely on any manual interaction or the use of an atlas or template. 8 The method was used to segment both SRR and HR images on a subset of subjects having good‐quality images in both acquisitions (n = 10). The following brain tissues/structures were segmented: gray matter (GM), white matter (WM), cerebrospinal fluid (CSF), basal ganglia (BG), cerebellum (Crb), and brainstem (BS).
Quality assessments of standard HR images
Image quality assessment was done visually by considering the criteria of image continuity on orthogonal reconstruction. Figure 2 displays three examples of T2w HR images: severe (top row) and mild (middle row) motion corrupted, and lastly no motion artifact (bottom row) images. Statistics on quality assessment were done on the total HR data (n = 113 images). In the case of subject motion, HR sequence acquisitions could be repeated once or twice. Therefore, success rates of getting good‐quality HR image at multiple scans were included in the statistics.
FIGURE 2.
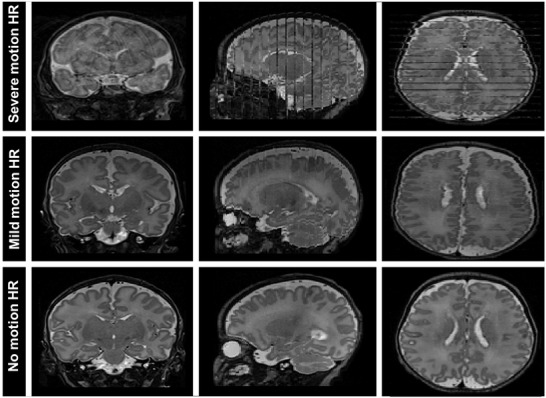
Two‐dimensional T2‐weighted high‐resolution (HR) MR images of three neonatal subjects. In the top row, there are severe motion artifacts on the images, whereas in the second row, that subject has only mild motion. The bottom row is an example of a high‐quality standard HR image
Visibility of fine anatomical structures on HR and SRR images
In order to score the diagnostic value of SRR in comparison to standard HR images, an experienced pediatric radiologist was blinded toward the image (HR vs. SRR) that was being reviewed (n = 18, subjects with severe motion artifacts were discarded). The landmarks chosen to be scored are part of the scoring systems regarding cerebral maturation validated in the literature, visible on T2w sequences, and present both in preterm at TEA and in FT infants. These landmarks are described in detail by Pittet et al., 25 and include the periventricular bands of migration, germinal matrix over the head of the caudate nucleus, crossroads 2 and 5, von Monakow segments II, and linear subplate compartment along the Sylvian scissure (Figure 3). Each of them was rated with a 3‐point scale value: 0 (non‐visible), 1 (visible but with limitation), and 2 (well visible) on a coronal plane. Furthermore, to assess the visibility of cortical folding, we scored with the same criteria the hippocampus aspect on the coronal view (Figure 3, e, e*). To score the visibility of myelination, we evaluated the posterior limb of the internal capsule (PLIC), which is a milestone of cerebral maturation for both preterm at TEA and FT newborns and should be viewed as a hypointense linear structure on T2w axial planes. Figure 3 displays the fine structures denoted with arrows on the standard HR (Figure 3A) and SRR (Figure 3B) images. The arrows indicate (a, a*) crossroad areas 2 (green), band of migrating glial and neuronal cells (red), germinal matrix (orange), (b, b*) crossroad areas 5, (c, c*) von Monakow II segment, (d, d*) PLIC myelin (yellow), (e, e*) hippocampus, and (f, f*) subplate compartments.
FIGURE 3.
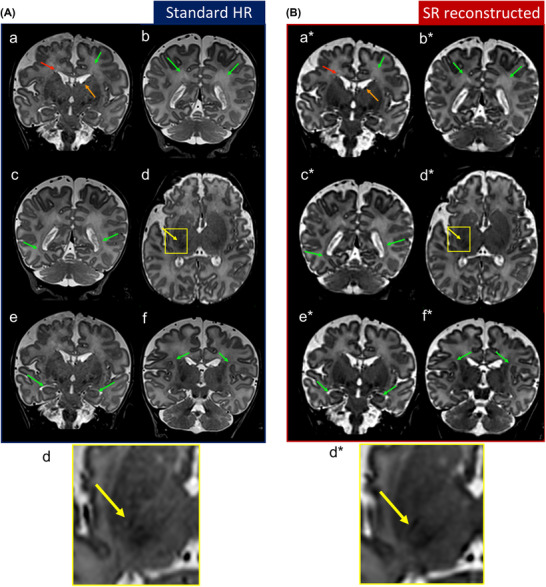
Anatomical landmarks visibility comparison between high‐resolution (HR) scans (Figure 3A) and super‐resolution (SR) reconstructed images (Figure. 3B). The arrows indicate (a, a*) crossroad areas 2 (green), band of migrating glial and neuronal cells (red), germinal matrix (orange), (b, b*) crossroad areas 5, (c, c*) von Monakow II segments, (d, d*) posterior limb of the internal capsule myelin (yellow), (e, e*) hippocampus, and (f, f*) subplate compartments according to Pittet et al. 25 These slices were chosen to best show structures of a newborn. Only the figures on (d, d*) displayed in axial view, the rest were shown in coronal view
Statistical analysis
A simple linear regression model was used to explain the relationship between standard HR images and reconstructed SR images. The variables were the volumes of the segmented structures. Furthermore, Dice similarity coefficients were computed between HR and SRR for each segmented brain region. A Wilcoxon signed‐rank test was performed to compare fine structure visibility scores between standard HR and reconstructed SR images. All the statistical analyses were done on MATLAB.
RESULTS
According to the quality assessments of standard T2w HR images (Table 1), across subjects’ scans (n = 113), 48% (54/113) of HR images were of good quality, 22% (25/113) were of medium quality, and 30% (34/113) were of poor quality (severely motion corrupted). The success rate to obtain a good‐quality HR image in the single scan was 39% (44/113) (FT = 7% [8/113], PTB = 11% [12/113], TEA = 21% [24/113]) and in the second trial was 9% (10/113). A total of 48% (11/23) of FT, 33% (15/45) of PTB, and 62% (28/45) of TEA had good quality of HR images. Additionally, statistics of obtaining good quality of SRR images were 74% (26/35), 6% (2/35) medium, and 20% (7/35) poor.
TABLE 1.
The table shows image quality assessments on standard 2‐dimensional T2‐weighted high‐resolution images and success rates on single scan and reacquisitions for each group of subjects (full‐term, preterm at birth and term equivalent age)
| Quality assesment of HR images (%) | Success rate for good quality acquisition (%) | |||||
|---|---|---|---|---|---|---|
| Subjects | n | Good | Medium | Poor | Single scan | Second repeat |
| FT | 23 | 48 | 39 | 13 | 35 | 13 |
| PTB | 45 | 33 | 29 | 38 | 26 | 7 |
| TEA | 45 | 62 | 7 | 31 | 53 | 9 |
| Total | 113 | 48 | 22 | 30 | 39 | 9 |
Abbreviations: FT, full‐term; HR, high‐resolution; n, number of scans; PTB, preterm at birth; TEA,term equivalent age.
The phantom experiment showed a similarity structure index of SSIM = 0.91 between HR and SRR images. Figures 4 and 5 show the comparisons of LR images and reconstructed SR volumes of two neonatal subjects in orthogonal views. The red squares indicate coronal, sagittal, and axial acquired LR data in the first three columns. The last two columns show the initial estimation, which is the average of all registered LR images and SRR of the orthogonal acquired LR images. In Figure 4, spatial resolution of LR was 0.6 × 0.6 × 2 mm3 and SRR was 0.6 mm3 isotropic, whereas in Figure 5 spatial resolution of LR was 0.8 × 0.8 × 3 mm3 and SRR was 0.8 mm3 isotropic. The squares below the figures show magnified areas. The edges and lines are sharper and enhanced compared to the initial estimation.
FIGURE 4.
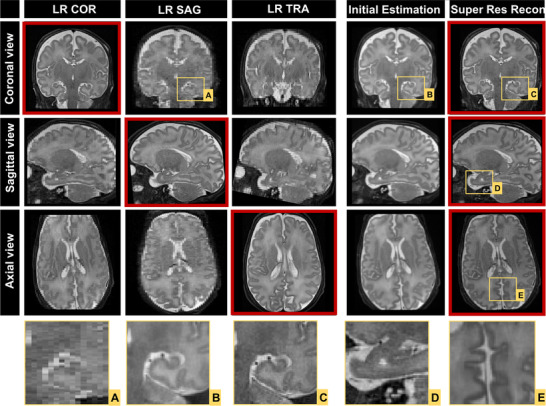
Acquired low‐resolution (LR) images compared with super‐resolution reconstructed volume from three LR images that is yielding 0.6 mm3 isotropic spatial resolution (COR, coronal; SAG, sagittal; TRA, transversal view; Res, resolution)
FIGURE 5.
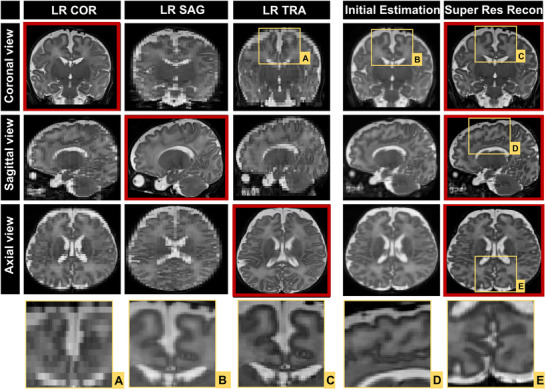
Acquired low‐resolution (LR) images compared with super‐resolution reconstructed volume from three LR images that is yielding 0.8 mm3 isotropic spatial resolution (COR, coronal; SAG, sagittal; TRA, transversal view; Res, resolution)
In Figure 6, reconstructed SR and standard HR are represented for one subject. The hippocampus is well visible in both images. However, in the standard HR image, there are minor artifacts such as lines in the forehead and around corpus callosum (pointed by arrows) due to small movements. Figure 7A shows histogram of the fine structure visibility scores of SRR and HR images (n = 18 subjects, eight structures). Fine structures of crossroad areas 2 and 5, Von Monakow, band of migrating glial and neuronal cells, germinal matrix, and subplate compartments were mostly well visible on both HR and SRR images. Hippocampus had better score in HR, whereas PLIC myelin had better scoring in SRR. Paired differences between SRR and HR scores (Figure 7B) show that the vast majority of the structures are viewed identically (bar b). The better performance of HR (bar a) is due to a better visibility of the hippocampus, whereas the better performance of SRR (bar c) is due to an improved visibility of PLIC in SRR. Wilcoxon signed‐rank test result was p = .63, Z = .48. Therefore, the difference between HR and SRR images was not large enough to be statistically significant.
FIGURE 6.
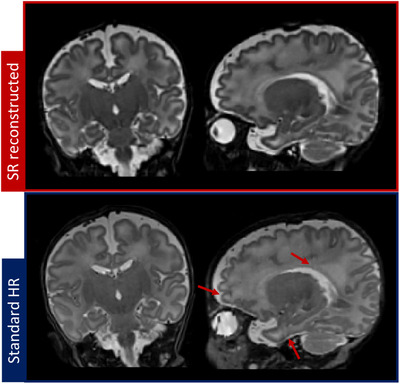
Standard high‐resolution (HR) versus super‐resolution reconstructed image of one subject. The arrows point minor artifacts on HR image
FIGURE 7.
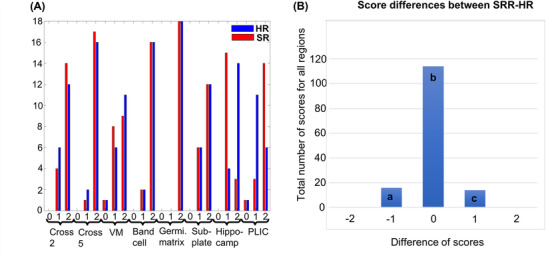
Panel A shows the visibility scores (0 not visible, 1 visible with limitation, 2 is well visible) of the fine structures in super‐resolution reconstructed (SRR, labeled in red) and high‐resolution (HR, labeled in blue) images of each neonate (18 subjects, eight structures) and panel B shows the paired differences of the scores between SRR and HR images (SRR–HR, all regions included). Hippocampus for instance is better visible in HR, whereas PLIC is better visible in SRR images. These differences correspond to bar a and c, respectively (VM, von Monakow II; PLIC, posterior limb of the internal capsule)
Figure 8 shows the comparison of morphology‐based segmentation applied to standard HR image versus the reconstructed SR volume of one neonatal subject (red label, WM; gray label, GM; blue label, CSF; white label, BG; green label, brain stem; yellow label, Crb). Figure 9 represents the linear regression plots of segmented HR and SRR volumes for each brain region. R 2 values for GM, WM, CSF, BG, Crb, and total volume including brain stem were .963, .973, .965, .970, .957, and .998, respectively. The average Dice similarity coefficients for GM, WM, CSF, BG, Crb, and BS brain regions were .85 ± .02, .88 ± .02, .83 ± .04, .96 ± .01, .91 ± .02, and .92 ± .01, respectively.
FIGURE 8.
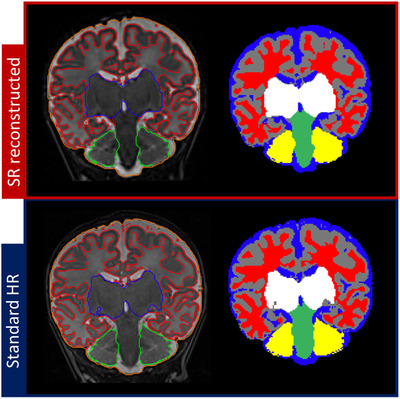
Compared segmentations of standard 2‐dimensional high‐resolution image versus super‐resolution reconstructed 3‐dimensional volume of one subject (labels in red, white matter; gray, gray matter; blue, cerebrospinal fluid; white, basal ganglia; green, brain stem; yellow, cerebellum)
FIGURE 9.
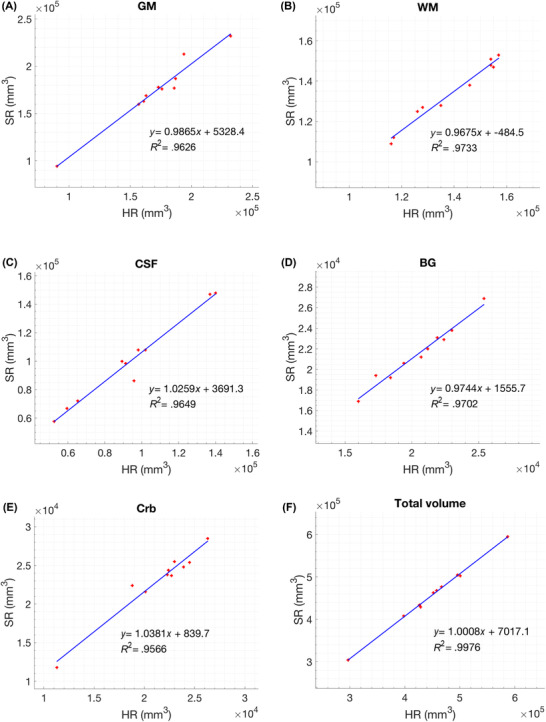
Linear regression plots for segmented super‐resolution reconstruction and high‐resolution images of each region (GM, gray matter; WM, white matter; CSF, cerebrospinal fluid; BG, basal ganglia; Crb, cerebellum) and total brain volume including brain stem
DISCUSSION
We compared SRR method to standard T2w HR MRI for neonatal brain imaging. Acquiring HR images that are of both good contrast and high quality is quite challenging in infants. Due to the fact that MRI is highly sensitive to motion, long acquisition times increase the likelihood of image degradation. In clinical settings, sedation (or general anesthesia) is commonly used to circumvent motion issues. In the research setting, sedation (or general anesthesia) is not an option due to ethical considerations. Supportive air pillows are often used to limit subject's motion but cannot fully eliminate baby's movements. Usually when the images have unacceptable motion artifacts, the sequence is reacquired, thus doubling the scan time.
The reacquisition of a motion‐corrupted scan does not guarantee a good‐quality image. In our study, we found that the success rate for obtaining a motion‐free HR image in a single scan was 39% across all subjects; often subjects with severe motion artifacts were scanned two to three times to obtain good‐quality HR image (TA = 5 minutes). However, the success rate of obtaining good HR at the second trial was only 9% in total. In other words, 5–15 minutes of scan time is consumed to obtain an adequate structural image, with very limited chance of success. Considering the HR image quality success rates, 48% of the total subjects had good‐quality images. These findings are close to the reports of previous studies: a similar study found that no motion was evident on the T2w TSE images of 53% of the infants (n = 132), 26 whereas another study on unsedated neonatal subjects reported that image quality of 52% was excellent, 46% acceptable, and 2% poor or unacceptable (n = 155). 27 In most of the trials where sedation or anesthesia is not given to the subject, most of the images have motion artifacts. These findings support the need of an alternative method to increase the success rate in newborn imaging.
Instead of lengthy 2D HR image acquisition, we can acquire several fast LR images in different orientations and thicknesses (TA < 1 min) and reconstruct them in 3D using SR algorithms. In the case of subject motion, reacquisition time is short and even without any repetition, the rate of obtaining good quality of SRR image was improved (74%). The SRR method is efficient when applied to the thick LR slices, in order to reduce the anisotropy of the voxels. LR stacks can be acquired in two ways: through‐plane LR shift and multiple orientation. However, our previous research has shown that multiple orientation acquisitions yield better SR reconstructions compared to through‐plane shift acquisitions. SR reconstruction promises better resolution than standard HR image acquisition when SNR limitations and total scan time are considered. 13
In this study, we reconstructed SR volumes from mutually orthogonal and rapidly acquired LR 2D T2w neonatal MR images using multiscale gradient field prior in combination with a MAP approach. Standard HR and reconstructed SR images from neonatal subjects (n = 10, both high‐quality HR and SRR) were segmented with a morphology‐based segmentation method. Visual inspection and quantitative assessments showed very similar results for segmented volumes. Simple linear regression analysis indicated that there is a high correlation between standard HR acquisition and SR reconstruction. Each brain region volume had correlation results close to 1, in spite the fact that GM, WM, and CSF are especially challenging to segment in the neonatal brain due to thin cortical thicknesses and the ongoing myelination process. Dice similarity coefficients for each brain region were computed to quantify the overlap between the segmentations of the two datasets. Dice coefficients for brain regions averaged from .83 ± .04 (CSF) to .96 ± .01 (BG), which are well above a value of .7 that considered as good overlap. 28 Overall, these results show that the SR reconstructed volume can equally be used for morphometrical purposes, without bias.
One of the key issues of SR reconstruction is the preservation of the contrast and edges that are critical for the assessment of cerebral maturation. We reviewed the detectability of fine structural landmarks whose visibility depends on the quality of the images in terms of resolution and contrast. These structures, namely, periventricular bands of migration, germinal matrix over the head of the caudate nucleus, crossroads 2 and 5, von Monakow segments II, linear subplate compartment along the Sylvian scissure, hippocampus, and PLIC, are all visible in both FT and preterm infants. There was no sufficiently marked difference between HR and SRR image scorings to be statistically significant. Furthermore, these structures could be equally well detected in SRR and HR images, except for the hippocampus and PLIC. The hippocampus was better visible on HR image (Figure 7B, bar a) due to the fact that HR was acquired in coronal plane, which is the best plane for visualizing the folding of the hippocampus. The PLIC was best detected in SRR image (Figure 7B, bar c) thanks to the gain of resolution in the axial plane, which corresponds to the orientation that best visualizes PLIC bundle. The limitation of our study is the small number of subjects. It is challenging to obtain good‐quality SRR and HR datasets for comparison, in the constraint of total acquisition time.
As a conclusion, acquisition of multiple 2D T2w LR images reduced the risk of motion artifacts. SR reconstruction of LR images resulted in good‐quality HR volumes. SRR as presented in the results provided images with comparable structural information in terms of morphometry and diagnostic assessments compared to the standard T2w HR image.
ACKNOWLEDGMENTS AND DISCLOSURE
We would like to thank all the radiology technicians and neonatologists who helped us during data acquisition in University Hospitals of Geneva. We would like to acknowledge that authors have no financial conflicts‐of‐interest to disclosure. Conference abstract related the study: Askin NC, Gui Levy L, SaDeAlmeida J, Kocher M, Huppi P, Lazeyras F. Super‐resolution reconstruction applied to neonatal MRI: orthogonal vs through‐plane slice shift MRI acquisition and segmentation. In proceedings of 27th Annual Meeting of ISMRM. Montreal, QC, Canada2019:423.
Open Access Funding provided by Universite de Geneve.
Askin Incebacak NC, Sui Y, Gui Levy L, Merlini L, Sa de Almeida S, Courvoisier S, et al. Super‐resolution reconstruction of T2‐weighted thick slice neonatal brain MRI scans. J Neuroimaging. 2022;32:68–79. 10.1111/jon.12929
FUNDING INFORMATION N.C.A.I. is supported by SNF Doc. Mobility Grant number P1GEP2_184160. S.K.W., O.A., T.E.W., and Y.S. are supported by NIH funding from R01 EB019483.
REFERENCES
- 1. Huppi PS, Warfield S, Kikinis R, et al. Quantitative magnetic resonance imaging of brain development in premature and mature newborns. Ann Neurol 1998;43:224‐35. [DOI] [PubMed] [Google Scholar]
- 2. Ferriero DM. Neonatal brain injury. N Engl J Med 2004;351:1985‐95. [DOI] [PubMed] [Google Scholar]
- 3. Miller SP, Ferriero DM, Leonard C, et al. Early brain injury in premature newborns detected with magnetic resonance imaging is associated with adverse early neurodevelopmental outcome. J Pediatr 2005;147:609‐16. [DOI] [PubMed] [Google Scholar]
- 4. Huppi PS, Inder TE. Magnetic resonance techniques in the evaluation of the perinatal brain: recent advances and future directions. Semin Neonatol 2001;6:195‐210. [DOI] [PubMed] [Google Scholar]
- 5. Prayer D, Kasprian G, Krampl E, et al. MRI of normal fetal brain development. Eur J Radiol 2006;57:199‐216. [DOI] [PubMed] [Google Scholar]
- 6. Judas M, Rados M, Jovanov‐Milosevic N, et al. Structural, immunocytochemical, and mr imaging properties of periventricular crossroads of growing cortical pathways in preterm infants. AJNR Am J Neuroradiol 2005;26:2671‐84. [PMC free article] [PubMed] [Google Scholar]
- 7. Sadeghi N, Prastawa M, Fletcher PT, et al. Regional characterization of longitudinal DT‐MRI to study white matter maturation of the early developing brain. Neuroimage 2013;68:236‐47. [DOI] [PMC free article] [PubMed] [Google Scholar]
- 8. Gui L, Lisowski R, Faundez T, et al. Morphology‐driven automatic segmentation of MR images of the neonatal brain. Med Image Anal 2012;16:1565‐79. [DOI] [PubMed] [Google Scholar]
- 9. Hennig J. K‐space sampling strategies. Eur Radiol 1999;9:1020‐31. [DOI] [PubMed] [Google Scholar]
- 10. Hamilton J, Franson D, Seiberlich N. Recent advances in parallel imaging for MRI. Prog Nucl Magn Reson Spectrosc 2017;101:71‐95. [DOI] [PMC free article] [PubMed] [Google Scholar]
- 11. Kim K, Habas PA, Rousseau F, et al. Intersection based motion correction of multislice MRI for 3‐D in utero fetal brain image formation. IEEE Trans Med Imaging 2010;29:146‐58. [DOI] [PMC free article] [PubMed] [Google Scholar]
- 12. Park SC, Park MK, Kang MG. Super‐resolution image reconstruction: a technical overview. IEEE Signal Process Mag 2003;20:21‐36. [Google Scholar]
- 13. Van Reeth E, Tham IWK, Tan CH, et al. Super‐resolution in magnetic resonance imaging: a review. Concepts Magn Reson A 2012;40A:306‐25. [Google Scholar]
- 14. Plenge E, Poot DHJ, Bernsen M, et al. Super‐resolution methods in MRI: can they improve the trade‐off between resolution, signal‐to‐noise ratio, and acquisition time? Magn Reson Med 2012;68:1983‐93. [DOI] [PubMed] [Google Scholar]
- 15. Jiang S, Xue H, Glover A, et al. MRI of moving subjects using multislice snapshot images with volume reconstruction (SVR): application to fetal, neonatal, and adult brain studies. IEEE Trans Med Imaging 2007;26:967‐80. [DOI] [PubMed] [Google Scholar]
- 16. Rousseau F, Glenn O, Iordanova B, et al. A novel approach to high resolution fetal brain MR imaging. Med Image Comput Comput Assist Interv 2005;8:548‐55. [DOI] [PubMed] [Google Scholar]
- 17. Gholipour A, Estroff JA, Sahin M, et al. Maximum a posteriori estimation of isotropic high‐resolution volumetric MRI from orthogonal thick‐slice scans. Med Image Comput Comput Assist Interv 2010;13:109‐16. [DOI] [PMC free article] [PubMed] [Google Scholar]
- 18. Gholipour A, Estroff JA, Warfield SK. Robust super‐resolution volume reconstruction from slice acquisitions: application to fetal brain MRI. IEEE Trans Med Imaging 2010;29:1739‐58. [DOI] [PMC free article] [PubMed] [Google Scholar]
- 19. Kuklisova‐Murgasova M, Quaghebeur G, Rutherford MA, et al. Reconstruction of fetal brain MRI with intensity matching and complete outlier removal. Med Image Anal 2012;16:1550‐64. [DOI] [PMC free article] [PubMed] [Google Scholar]
- 20. Tourbier S, Bresson X, Hagmann P, et al. An efficient total variation algorithm for super‐resolution in fetal brain MRI with adaptive regularization. Neuroimage 2015;118:584‐97. [DOI] [PubMed] [Google Scholar]
- 21. Sui Y, Afacan O, Gholipour A, et al. Isotropic MRI super‐resolution reconstruction with multi‐scale gradient field prior. In: Shen D, ed. Medical Image Computing and Computer Assisted Intervention – MICCAI 2019. Springer; 2019:3‐11. [DOI] [PMC free article] [PubMed] [Google Scholar]
- 22. Greenspan H, Oz G, Kiryati N, et al. MRI inter‐slice reconstruction using super‐resolution. Magn Reson Imaging 2002;20:437‐46. [DOI] [PubMed] [Google Scholar]
- 23. Akhondi‐Asl A, Afacan O, Balasubramanian M, et al. Fast myelin water fraction estimation using 2D multislice CPMG. Magn Reson Med 2016;76:1301‐13. [DOI] [PMC free article] [PubMed] [Google Scholar]
- 24. Mattes D, Haynor D, Vesselle H, et al. Nonrigid Multimodality Image Registration . SPIE; 2001. [Google Scholar]
- 25. Pittet MP, Vasung L, Huppi PS, et al. Newborns and preterm infants at term equivalent age: a semi‐quantitative assessment of cerebral maturity. Neuroimage Clin 2019;24:102014. [DOI] [PMC free article] [PubMed] [Google Scholar]
- 26. Hughes EJ, Winchman T, Padormo F, et al. A dedicated neonatal brain imaging system. Magn Reson Med 2017;78:794‐804. [DOI] [PMC free article] [PubMed] [Google Scholar]
- 27. Haney B, Reavey D, Atchison L, et al. Magnetic resonance imaging studies without sedation in the neonatal intensive care unit: safe and efficient. J Perinat Neonatal Nurs 2010;24:256‐66. [DOI] [PubMed] [Google Scholar]
- 28. Zijdenbos AP, Dawant BM, Margolin RA, et al. Morphometric analysis of white‐matter lesions in MR‐images ‐ method and validation. IEEE Trans Med Imaging 1994;13:716‐24. [DOI] [PubMed] [Google Scholar]


