Abstract
Background and Purpose:
Ischemic diffusion-weighted imaging-fluid-attenuated inversion recovery (DWI-FLAIR) mismatch may be useful in guiding acute stroke treatment decisions given its relationship to onset time and parenchymal viability; however, it relies on subjective grading. Radiomics is an emerging image quantification methodology that may objectively represent continuous image characteristics. We propose a novel radiomics approach to characterize DWI-FLAIR mismatch.
Methods:
Ischemic lesions were visually graded for FLAIR positivity (absent, subtle, obvious) among consecutive large vessel occlusion stroke patients with hyperacute MRI. Radiomic features were extracted from within the lesions on DWI and FLAIR. The DWI-FLAIR mismatch radiomics signature was built with features systematically selected by a cross-validated ElasticNet linear regression model of mismatch.
Results:
We identified 103 patients with mean age 68±16 years; 63% were female. FLAIR hyperintensity was absent in 25%, subtle in 55%, and obvious in 20%. Inter-rater agreement for visual grading was moderate (Κ=0.58). The radiomics signature of DWI-FLAIR mismatch included native FLAIR histogram kurtosis and Local Binary Pattern filtered FLAIR Gray Level Cluster Shade; both correlated with visual grading (ρ=−0.42, p<0.001; ρ=0.40, p<0.001, respectively).
Conclusions:
Radiomics can describe DWI-FLAIR mismatch and may provide objective, continuous biomarkers for infarct evolution using clinical-grade images. These novel biomarkers may prove useful for treatment decisions and future research.
Keywords: DWI-FLAIR mismatch, radiomics, acute ischemic stroke, large vessel occlusion, neuroimaging, MRI
Introduction:
In the era of image-guided reperfusion stroke therapies, there is growing interest in diffusion-weighted imaging-fluid-attenuated inversion recovery (DWI-FLAIR) mismatch. DWI-FLAIR mismatch is often used as a proxy for the time since onset of ischemia as FLAIR hyperintensity may reflect vasogenic edema that does not occur until 4–6 hours.1 FLAIR hyperintensity may also represent tissue that is destined for necrosis, while a tissue signature with DWI-FLAIR mismatch may not be so definitive.2 Randomized trials have shown that FLAIR characterization allows treatment selection for thrombolytic therapy, and MRI selection for endovascular therapy (EVT) is well-described.1,3
In routine clinical practice, DWI-FLAIR mismatch is graded visually and suffers from poor inter-reader agreement.4 Moreover, infarction is a continuous process that cannot be perfectly captured on a discrete scale. Radiomics are emerging image quantification methodologies that objectively represent continuous image characteristics by describing the spatial distribution of signal intensities and pixel interrelationships to enhance clinical decision-making.5 We propose a novel radiomics approach to describe DWI-FLAIR mismatch.
Methods:
This study was compliant with the Health Insurance Portability and Accountability Act and was approved by the local institutional review board. Informed consent was waived based on minimal patient risk and practical inability to perform the study without the waiver. The data that support the findings of this study will be made available from the corresponding author upon reasonable request and pending approval of local institutional review board.
Consecutive anterior circulation large vessel occlusion (LVO) stroke patients who underwent pre-EVT DWI and FLAIR imaging were selected for this analysis given the hyperacute timing of MRI, likelihood of large DWI lesions, and translatable results. They were identified from a prospectively-maintained database at a referral center from 2011 to 2019.6 Demographics, history, presentations, and treatments were recorded.7
MRIs were obtained on a Siemens 3T MRI or a GE 1.5T MRI. DWI sequences had echo time 60–120 ms, repetition time 5300–5600 ms, b-values of 1000, and slice thickness 5 mm with a 1 mm gap. FLAIR sequences had median echo time 145 ms, repetition time 10 s, and slice thickness 5 mm with 1 mm gap.
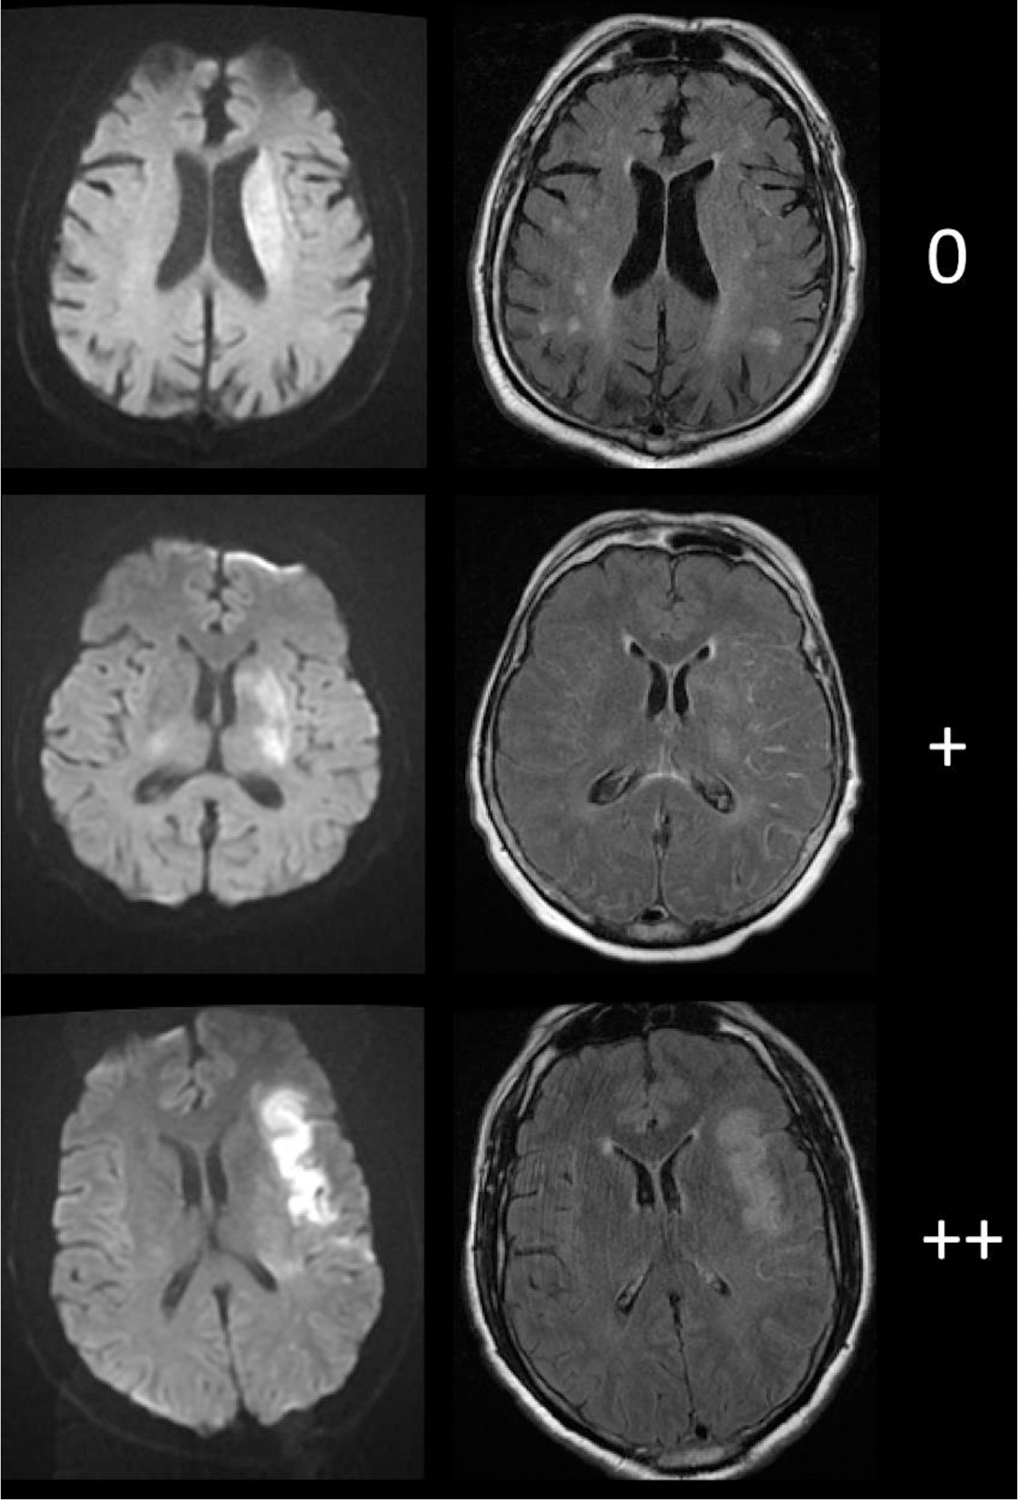
Infarct lesion masks were manually traced on DWI using Slicer 4.8.1.8 DWI and infarct masks were linearly co-registered to FLAIR (SPM12, http://www.fil.ion.ucl.ac.uk/spm/; Matlab, The Mathworks 2019b). Images were visually inspected for appropriate registration and artifacts (26 patients excluded). DWI-FLAIR mismatch was graded by two independent fellowship-trained neuroradiologists trained on a training set until 100% accuracy was achieved. Intralesional FLAIR signal was defined as absent (0), subtle (+), or obvious (++) (Figure 1). Inter-reader agreement was calculated using Cohen’s Κ. Readers achieved consensus in discordant cases.
Figure 1:

Diffusion-weighted imaging (left) and fluid-attenuated inversion recovery imaging(right) examples of visual gradings.
Intralesional fluid-attenuated inversion recovery hyperintensities were graded as: absent (0), subtle (+), or obvious (++).
Radiomic features were extracted using PyRadiomics 2.2.0 from DWI and FLAIR images within the infarct masks.5 The same parameters were used for the extraction of radiomics from DWI and FLAIR images. The full parameter file is available at: https://github.com/MBretzner/Radiomics/blob/main/extraction_params_DWI_FLAIR.yaml. Briefly, all features were extracted on axial plane from resampled 1×1×6 mm images, image intensities were normalized. Radiomic features were extracted from native images and prefiltered images. Filters included Laplacian of Gaussian with sigmas of 1, 2 and 3, wavelet decompositions, and local binary patterns (LBD). As a result, 1487 rotation invariant radiomics were extracted.
Prediction of the consensual DWI-FLAIR mismatch was done using an ElasticNet linear regressor. Radiomics-based prediction of the DWI-FLAIR mismatch was performed in a 100-times repeated five-fold nested cross-validation scheme. The radiomic signature of the DWI-FLAIR mismatch was built with the features that were consistently selected across all repetitions. Correlations of the signature’s radiomics with the consensual visual grading was assessed using Spearman correlation.
Results:
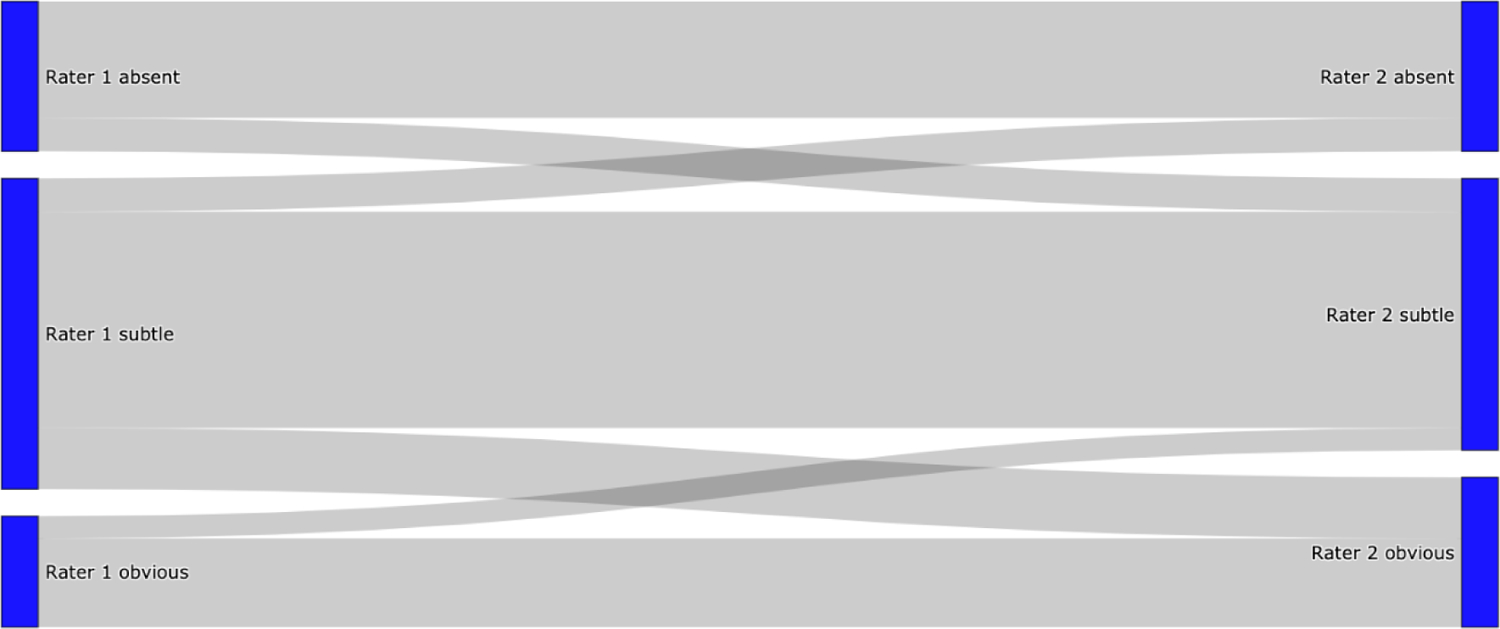
We identified 103 patients with mean age 68±16 years; 63% were female. Median admission NIHSS was 16 (Interquartile Range 12–19). Mean infarct volume was 29 ±30 cc. FLAIR hyperintensity was absent in 25%, subtle in 55%, and obvious in 20%. Inter-rater agreement was moderate with Cohen’s Κ=0.58; raters did not disagree on obvious versus absent (Figure 2). Interestingly, agreement was better for patients with Last Known Well (LKW) < 6h (n=66, K=0.65) than for patient with LKW > 6h (n=37, K=0.46). Demographic and clinical information are shown (Table 1).
Figure 2:

Flow diagram of inter-rater agreement for visual grading.
There was no disagreement between absent and obvious fluid-attenuated inversion recovery hyperintensity within infarcted areas between rater 1 and rater 2. All disagreement affected subtle hyperintensity and either absent or obvious hyperintensity.
Table 1:
Clinical and imaging characteristics (n=103).
| Age, years | 68 ± 16 |
| Female | 63% |
| Pre-stroke mRS, median (IQR) | 0 (0–1) |
| Hypertension | 74% |
| Atrial fibrillation | 34% |
| Diabetes | 20% |
| Coronary disease | 20% |
| Transient ischemic attack | 16% |
| Smoking | 17% |
| Presenting NIHSS, median (IQR) | 16 (12–19) |
| Intravenous alteplase | 48% |
| LKW-to-MRI, min | 369 ± 277 |
| Infarct volume | 29 ± 30 |
| Infarct FLAIR hyperintensity | |
| Absent | 25% |
| Subtle | 55% |
| Obvious | 20% |
All the data represent mean ± standard deviation unless otherwise indicated. IQR interquartile range, mRS modified Rankin Scale, NIHSS National Institutes of Health Stroke Scale, LKW last known well.
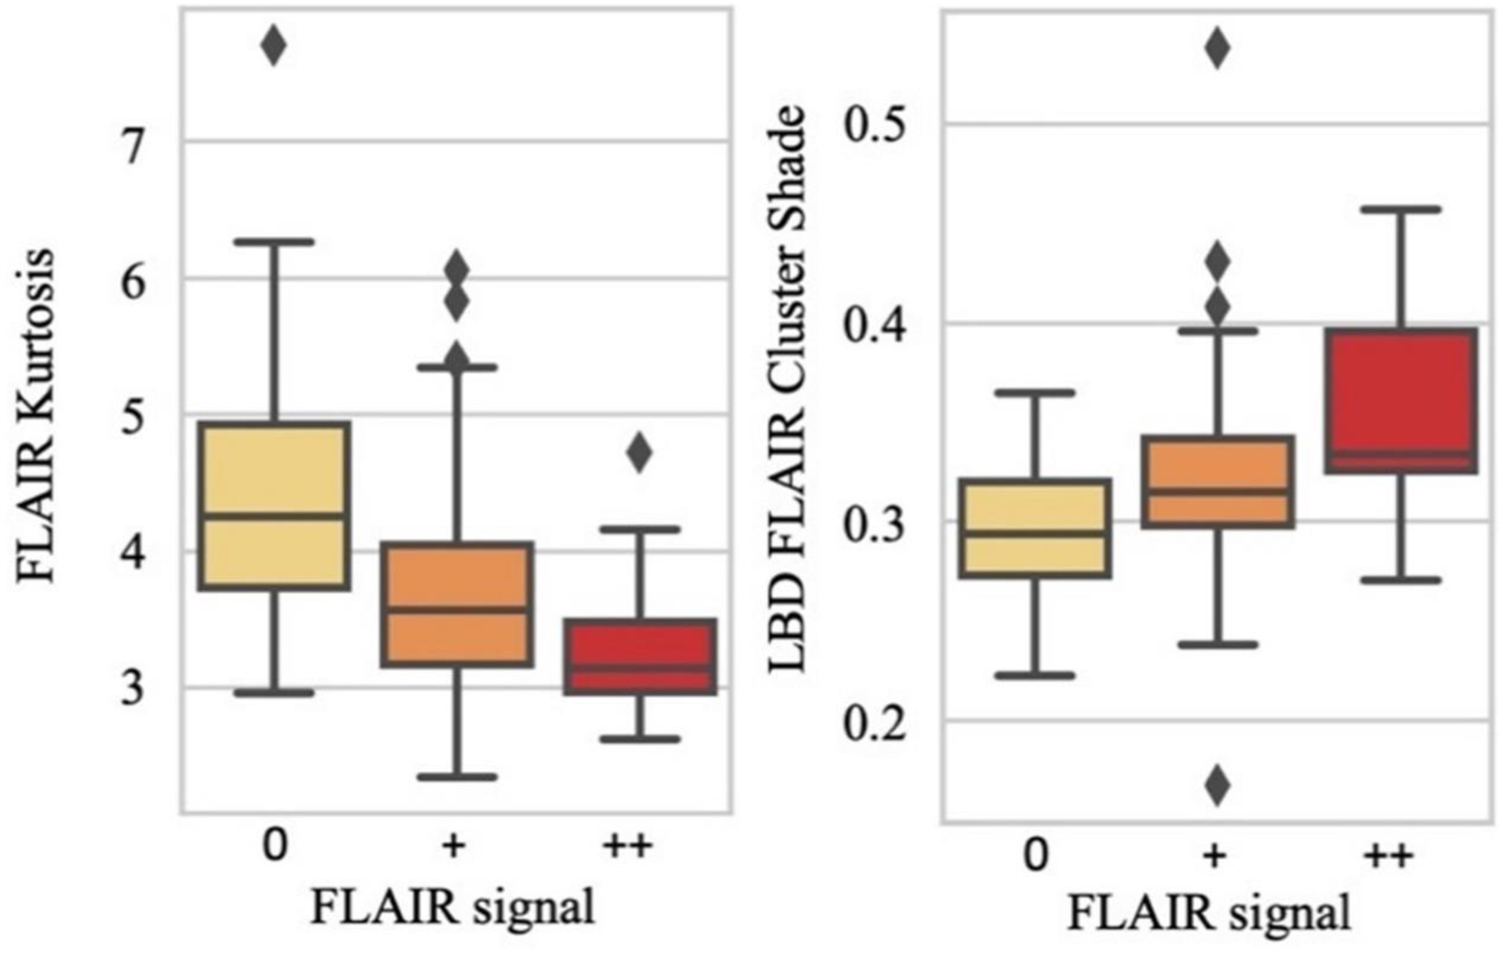
The coefficient of determination for the repeated out-of-sample cross-validated predictions for DWI-FLAIR mismatch was R2=0.20 (95% Confidence Interval: 0.12–0.27), with an average of 33.8 ±8.6 features selected per repetition. The radiomic signature of DWI-FLAIR mismatch included two systematically selected radiomic features: FLAIR histogram kurtosis and Local Binary Pattern (LBP)-FLAIR gray level cluster shade. No DWI feature characteristics were retained. Both correlated with visual grading (ρ=−0.42, p<0.001; ρ=0.40, p<0.001, respectively) (Figure 3).
Figure 3:

Correlation box plots of the diffusion-weighted imaging-fluid-attenuated inversion recovery (DWI-FLAIR) mismatch radiomic signature vs consensual FLAIR gradings.
LBD Local Binary Pattern.
Discussion:
In a cohort of LVO stroke patients, we have developed a novel radiomics approach to quantify DWI-FLAIR mismatch on hyperacute pre-EVT MRI. Two radiomic features, FLAIR histogram kurtosis and LBP-FLAIR gray level cluster shade, describe infarct FLAIR hyperintensity in an objective and continuous fashion from clinical-grade images.
A major strength of this approach is its objectivity, providing a potential solution to settle ambiguous cases. By relying on consensual agreement between readers, radiomics were selected in a robust way, mimicking clinical practice where images are adjudicated by neuroradiologists, neurologists, and neurointerventionalists. Our cohort was composed of patients with large ischemic lesions demonstrating a broad spectrum of infarct FLAIR signal. It was, therefore, well-suited for the identification of textural descriptors of the range of infarct progression on FLAIR.
This radiomics approach offers several advantages for quantifying DWI-FLAIR mismatch compared to other tools, such as the signal intensity ratio.3 The signal intensity ratio is calculated by dividing the mean signal intensity from a region within the lesion’s most intense FLAIR signal by that from a region in normal-appearing contralateral tissue.9 While this ratio describes the most progressed region of infarct, which may best estimate time from symptom onset, it fails to capture information about the entire infarct in the case of heterogenous lesions and relies on manual, subjective placement of regions of interests both within the infarct and contralateral parenchyma. While its creators caution the inclusion of chronic infarction, leukoaraiosis, and cerebrospinal fluid in regions of interest,9 these distinctions can be difficult to establish even when limiting FLAIR evaluation to DWI hyperintense tissue. Others used this method to analyze images from the WAKE-UP trial but failed to identify a relevant cutoff as FLAIR hyperintensity within the lesion was an exclusion criterion.10
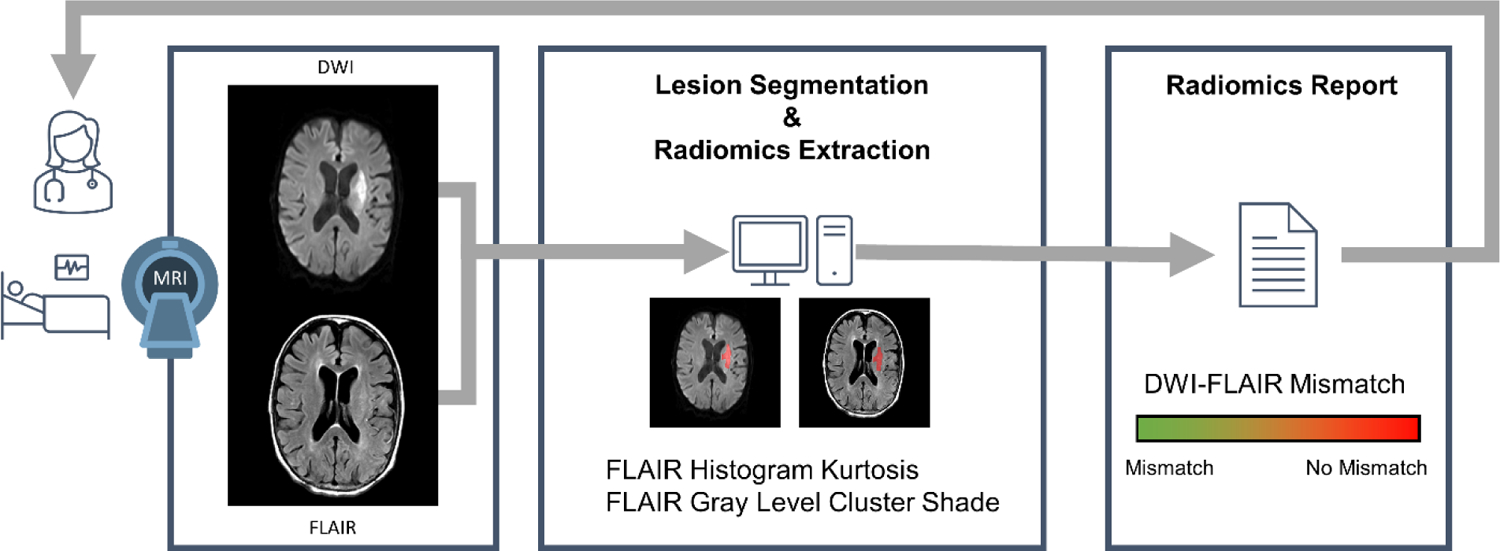
Furthermore, an important advantage and goal of radiomics is automation. Our technique can be integrated into a computerized radiology pathway that provides output data within seconds to minutes. This is critical for clinical translation given the acute nature of stroke and need to make rapid clinical decisions (Figure 4).
Figure 4.

Conceptual framework outlining a proposed imaging ang processing workflow for acute stroke clinical care.
A stroke patient is evaluated emergently and undergoes MRI. DWI and FLAIR sequences are obtained. Software allows the automatic lesion segmentation and radiomics extraction. A report is produced in seconds to minutes that can aid acute clinical decision making. DWI diffusion-weighted imaging, FLAIR fluid-attenuated inversion recovery.
We identified FLAIR histogram kurtosis and LBD-FLAIR gray level cluster shade as key radiomic features quantifying DWI-FLAIR mismatch. The kurtosis of a distribution describes aggregation around the mean. We showed that FLAIR kurtosis was inversely correlated with intralesional FLAIR hyperintensity. A high kurtosis distribution has a peak around the mean with heavy tails. This describes a lesion without FLAIR hyperintensity as most voxels have normal intensity values distributed around the mean. In contrast, a low kurtosis distribution has a flat top with light tails; a uniform distribution is the extreme case. A lesion with frank FLAIR hyperintensity is composed of voxels with varying intensity values, flattening the distribution and thus reducing kurtosis.
Interpretation of the gray level cluster shade of the LBD filtered FLAIR image is more challenging. Gray level cluster shade is a second-order textural descriptor of skewness and uniformity of the gray level co-occurrence matrix. A higher-cluster shade implies a greater asymmetry in the image. LBP is a gray level- and rotation-invariant filter that is performant for describing uniform patterns. It may detect a bright uniform hyperintensity skirted by normal appearing parenchyma.
Interestingly, no DWI textural features were selected within the radiomic signature of DWI-FLAIR mismatch. This corroborates with our methods, as readers only identified the presence of FLAIR hyperintensity within the infarcted area. Furthermore, this approach corresponds to the routine assessment of strokes where DWI identifies ischemic lesions and FLAIR better characterizes their parenchyma.
As stated above, other radiomics features describing more subtle textural patterns were not predictive of DWI-FLAIR mismatch visual gradings in our cohort. Exploring larger cohorts with our method could potentially uncover more detailed textural aspects specific of the infarction process. It stands to reason that FLAIR kurtosis was most robustly predictive. Intuitively, DWI-FLAIR mismatch may be represented solely by the mean intensity of the FLAIR lesion. However, since MRI signal is relative, normal cerebral and lesion intensities may vary from one patient to another. Kurtosis describes the fourth moment of a distribution and is independent from the mean. Therefore, it represents an appropriate metric to describe MRI signal since it is robust to its relative characteristic.
Our study presents several limitations. First, all limitations inherent to single-center and retrospective studies apply. Future studies could assess the robustness of radiomic features across other scanners and imaging protocols. As only 8 MRIs were acquired with a 3T coil in our study, we did not stratify groups by scanner a priori. Furthermore, our method was developed utilizing LVO stroke patients eligible for EVT given availability of hyperacute MRI and relatively large infarct volumes (mean 29 mL). A potential pitfall could exist when extrapolating these data to smaller infarcts, such as those occurring with lacunar stroke.11 Also, as with any imaging-based technique, its performance might be influenced by image quality such as the presence of major motion artifacts. Future studies could include replication of this analysis utilizing patients with other stroke etiologies and patients with motions artifacts. Ultimately, the DWI-FLAIR mismatch radiomic signature could be evaluated in a clinical trial to select stroke patients for reperfusion therapies. In addition, our inter-rater agreement was only moderate albeit consistent with previously-published performances.4 Interestingly, it was slightly worse for LKW >6h; this may be related to our limited sample size. In any case, this further highlights the need for an objective method and subsequent radiomic signature analyses were based on consensus agreement. Lastly, in this exploratory work, we present two candidate MRI biomarkers to quantify DWI-FLAIR mismatch, although the nature of our cohort prevented the suggestion of clear cut-off values for selecting patients for reperfusion therapy. Further work analyzing data on late presenting or wake-up stroke patients is warranted to validate our results and identify cut-off values.
In conclusion, radiomics can describe ischemic DWI-FLAIR mismatch and may provide an objective, continuous biomarker for infarct evolution using clinical-grade images. The novel imaging biomarkers of FLAIR histogram kurtosis and LBP-FLAIR gray level cluster shade may prove useful for acute treatment decisions and future research, particularly when time of stroke onset is unknown.
Acknowledgements
Joyce McIntyre maintained the stroke database. There are no relevant competing interests. RWR and MB conceived the idea, collected the data, led the analyses, and drafted the manuscript. NSR and TLM conceived the idea, provided oversight, and made critical revisions to the manuscript.
Funding: The National Institute of Neurological Disorders and Stroke supported RWR (R25NS065743) and NSR (R01NS086905, R01NS082285, U19NS115388). The ISITE-ULNE Fundation, Sociétés Françaises de Neuroradiologie et de Radiologie, and Planiol Fundation supported MB.
Footnotes
Disclosure
All authors made significant contributions and have read and approved the submitted manuscript.
References:
- 1.Thomalla G, Simonsen CZ, Boutitie F, et al. MRI-guided thrombolysis for stroke with unknown time of onset. N Engl J Med 2018;379:611–22. [DOI] [PubMed] [Google Scholar]
- 2.Welch KMA, Windham J, Knight RA, et al. A model to predict the histopathology of human stroke using diffusion and t sub 2-weighted magnetic resonance imaging. Stroke 1995;26:1983–9. [DOI] [PubMed] [Google Scholar]
- 3.Schwamm LH, Wu O, Song SS, et al. Intravenous thrombolysis in unwitnessed stroke onset: MR WITNESS trial results. Ann Neurol 2018;83:980–93. [DOI] [PMC free article] [PubMed] [Google Scholar]
- 4.Thomalla G, Cheng B, Ebinger M, et al. DWI-FLAIR mismatch for the identification of patients with acute ischaemic stroke within 4·5 h of symptom onset (PRE-FLAIR): A multicentre observational study. Lancet Neurol 2011;10:978–86. [DOI] [PubMed] [Google Scholar]
- 5.Van Griethuysen JJM, Fedorov A, Parmar C, et al. Computational radiomics system to decode the radiographic phenotype. Cancer Res 2017;77:e104–7. [DOI] [PMC free article] [PubMed] [Google Scholar]
- 6.Regenhardt RW, Etherton MR, Das AS, et al. White matter acute infarct volume after thrombectomy for anterior circulation large vessel occlusion stroke is associated with long term outcomes. J Stroke Cerebrovasc Dis 2021;30:105567. [DOI] [PMC free article] [PubMed] [Google Scholar]
- 7.Regenhardt RW, Young MJ, Etherton MR, et al. Toward a more inclusive paradigm: thrombectomy for stroke patients with pre-existing disabilities. J Neurointerv Surg 2020;neurintsurg-2020–016783 (Epub ahead of print) [DOI] [PMC free article] [PubMed] [Google Scholar]
- 8.Regenhardt RW, Etherton MR, Das AS, et al. Infarct growth despite endovascular thrombectomy recanalization in large vessel occlusive stroke. J Neuroimaging 2020;31:155–64. [DOI] [PMC free article] [PubMed] [Google Scholar]
- 9.Song SS, Latour LL, Ritter CH, et al. A pragmatic approach using magnetic resonance imaging to treat ischemic strokes of unknown onset time in a thrombolytic trial. Stroke 2012;43:2331–5. [DOI] [PMC free article] [PubMed] [Google Scholar]
- 10.Cheng B, Boutitie F, Nickel A, et al. Quantitative signal intensity in fluid-attenuated inversion recovery and treatment effect in the WAKE-UP trial. Stroke 2020;51:209–15. [DOI] [PubMed] [Google Scholar]
- 11.Regenhardt RW, Das AS, Ohtomo R, et al. Pathophysiology of lacunar stroke: history’s mysteries and modern interpretations. J Stroke Cerebrovasc Dis 2019;28:2079–97. [DOI] [PMC free article] [PubMed] [Google Scholar]


