

Abstract
Functional images of the resting brain can be empirically parsed into intrinsic connectivity networks (ICNs) which closely resemble patterns of evoked task-based brain activity and which have a biological and genetic basis. Recently, ICNs have become popular for investigating brain functioning and brain-behavior relationships. However, the replicability and neurometrics of these networks are only beginning to be reported. Using a meta-level independent component analysis (ICA), we produced ICNs from three data sets collected from two samples of healthy adults. The ICNs from our data sets demonstrated robust and independent replication of 12 intrinsic networks that reflected 17 canonical, task-based, brain networks. We found within-subject reliability of ICNs was modest overall, but ranged from poor to good, and that voxels with the highest measured connectivity rarely had the highest reliability. Networks associated with executive functions, visuospatial reasoning, motor coordination, speech and audition, default mode, vision, and interoception showed moderate to high group-level reproducibility and replicability. However, only the first four of these networks also showed fair or better within-subject reliability over time. Our findings highlight the replicability of ICN’s across data sets, the range of within-subject neurometrics across different networks, and the shared characteristics between resting and task-based networks.
Keywords: Intrinsic connectivity, fMRI, ICA, reliability, reproducibility, BrainMap
Introduction
Intrinsic connectivity networks (ICNs), revealed through functional magnetic resonance imaging (fMRI) are thought to represent the fundamental functional architecture of the brain (Smith et al., 2009; Biswal et al., 2010). Intrinsic connectivity, also referred to as resting-state connectivity, was first demonstrated when correlated temporal dynamics of the blood oxygen level dependent response were observed across sensorimotor cortex voxels (Biswal et al., 1995, 1997). ICNs have since been found in the brains of adults (Kiviniemi et al., 2003; Beckmann et al., 2005), pre-term infants (Doria et al., 2010; Smyser et al., 2010), and non-human primates (Margulies et al., 2009). ICNs have been used to investigate group differences (Ma et al., 2010; Chai et al., 2011; Zhang et al., 2011), and to examine associations with personality (Adelstein et al., 2011; Kunisato et al., 2011), psychiatric symptoms (Repovs et al., 2011; Zhu et al., 2012), and cognition (Hampson et al., 2006; Kelly et al., 2008). The extent to which ICN’s map to interpretable cognition-related networks was illustrated by a foundational report that showed ICN’s corresponded to meta-analytic, task-based activation maps (Smith et al., 2009). Furthermore, ICNs have also been found to have moderate to high voxel-wise retest-reliability in an examination using a related procedure (Zuo et al., 2010b). This cumulative evidence suggests ICNs may provide a meaningful way to measure multiple brain systems simultaneously. However, for ICN measurements to be useful for the study of individual and group differences additional work is needed to corroborate these findings, examine the internal validity of the procedure, and establish end-point metrics. With this in mind, the present study completed a multi-sample replication of the correspondence between ICNs and descriptively enriched meta-analytic task-based activation maps (Laird et al., 2011), investigated the replicability, reproducibility, and reliability of ICNs using multiple metrics, and examined the robustness of procedures aimed to minimize variability in the analysis.
Providing background for the approach is a mass of neuroscientific and computational modeling evidence, including work suggesting ICN’s can be conceptualized as functional-structural priors which constrain task-based activity and are modulated rather than determined by behavioral states and sensory information (Deco et al., 2009; Deco and Corbetta, 2011). This predicts a close relationship between on-task and at-rest brain functioning, such as that reported in a foundational study that used a data-driven method on both resting-state fMRI data and over 7000 functional task-based activation contrast maps from the BrainMap database (Smith et al., 2009). Using independent component analysis (ICA) (McKeown and Sejnowski, 1998; Kiviniemi et al., 2003), 10 networks derived from resting-state closely mirrored 10 networks derived from meta-analytic task-based maps spanning a variety of cognitive domains (Smith et al., 2009). In doing so, Smith et al. (2009) illustrated the correspondence between ICNs and task-based contrast maps across diverse networks linked to particular cognitive domains characterized by meta-data. These findings have not been directly replicated to test whether 10 ICNs are consistent both across samples and regarding correspondence to task-based networks. Furthermore, the usefulness of such ICNs for studying individual differences such as psychopathology or ability will be limited unless the metrics derived from those ICNs are reliable over time, given that validity presupposes reliability (Meehl, 1986). More generally, the replicability and reproducibility of ICNs needs to be quantified, the retest reliability of ICN metrics examined, and the robustness of the procedures tested before further application. These four properties, taken together, are collected under the term ‘neurometrics’ in the present study. Introduced only recently (Carter et al., 2012), the term is rooted in psychometrics, and differs only in the use of neural instead of psychological measurements.
Several groups have begun to undertake the study of neurometrics of ICN’s. Data-driven ICNs have been consistent across subjects (Kiviniemi et al., 2003; Beckmann et al., 2005) and appear to be spatially-consistent when repeatedly assessed over several days (Damoiseaux et al., 2006; Meindl et al., 2010; Jeong et al., 2012). Across major methodologies (e.g. independent component, seed-based, and graph theoretical), within-subject test-retest reliability of selected resting-state networks has ranged from low to high, but shown overall modest within-subject reliability (Shehzad et al., 2009; Van Dijk et al., 2010; Zuo et al., 2010a, 2010b, 2012; Tomasi and Volkow, 2011; Wang et al., 2011; Braun et al., 2012; Chou et al., 2012; Guo et al., 2012). However, only one of these studies used methods akin to Smith et al. (2009) by completing an ICA of brain connectivity using probabilistic ICA (Beckmann and Smith, 2004), and examined the test-retest reliability of a range of ICNs (Zuo et al., 2010b). This study reported promising reliability estimates and completed reproducibility analyses regarding the presence of group-level ICNs at the individual subject-level. This second foundational study provided insight into the neurometric properties of ICNs to build upon, particularly since it used a standard ICA approach. Recently however, the issue and impact of ICN variability has come into focus and approaches have been developed to estimate or overcome the variability introduced by starting conditions (subject order and initial value effects) and resulting problems of local minima (Himberg et al., 2004; Yang et al., 2008; Ylipaavalniemi and Vigário, 2008; Ylipaavalniemi and Soppela, 2009; Zhang et al., 2010). In order to realize the current ‘best estimates’ of reliability for a set of data, it is reasonable that such variability would first need to be minimized.
To address these topics, the present study used three sets of fMRI data from two independent samples to perform a full test-retest and cross-validation analysis of ICN reliability, reproducibility, and replicability using a meta-ICA approach to obtain a robust estimate of ICNs (Smith et al., 2009; Biswal et al., 2010). This approach randomizes starting conditions of the analysis by running many probabilistic ICAs and integrating them in a final meta-level ICA; it differs from previous approaches in that averaging or hierarchical clustering of preliminary components does not occur, rather probabilistic ICA is completed on the preliminary components. This is a complementary approach to other methods for dealing with ICN variability (Himberg et al., 2004; Yang et al., 2008; Ylipaavalniemi and Vigário, 2008; Ylipaavalniemi and Soppela, 2009; Zhang et al., 2010), and has not been employed in the context of test-retest reliability. As such, this paper examined the internal consistency and robustness of the method. ICNs generated from this procedure were then tested for correspondence with descriptively and quantitatively enriched canonical task-based maps from BrainMap meta-analyses (Laird et al., 2011). In doing so, the present study was able to replicate Smith et al. (2009) by testing how data-derived resting-state ICNs, across different data sets, correspond to the enriched meta-analytic task-based maps. Thus, a functional interpretation for each ICN could also be inferred. Additionally, the present study assessed multiple reliability metrics to examine the convergence of ICN measurement properties and provide guidance for future analyses; this included group-level ICN spatial replicability and reproducibility across samples and time, as well as within-subject retest reliability of ICNs at the voxel- and network- level directly applicable to the study of individual differences. With this measure the present study was able to examine whether the signal from many voxels may be more reliable, a question that which has not been clearly addressed in the ICN literature. Finally, the study tested the intuition that the most highly connected voxels would also be the most reliable voxels in order to provide insight regarding the ability to identify reliably connected voxels in the brain from a single time point of data collection.
In summary, the overarching aims of the present study were threefold: 1) to demonstrate the internal validity and robustness of the meta-level ICA approach; 2) to replicate findings from two foundational studies regarding the nature of ICNs using a meta-level ICA approach; 3) to quantify the properties of ICNs using a multifaceted measurement approach. In doing so we focused on providing the field with convergent information regarding the usefulness of ICN measurements for studies of individual differences, as well as their current limitations, in order for readers to determine whether they are appropriate for their own applications.
Materials & Methods
2.1. Participants
Reference and Retest Sample: 33 healthy individuals between the ages of 18 and 60 were scanned at multiple time points, approximately nine months apart (Camchong et al., 2011a). Six participants were excluded due to changes in the scanner or incomplete data across time-points and none were removed due to excessive head movement (estimated mean displacement < 1.0 mm, no displacement above 1.5 mm) during one of two fMRI scans used in the present study. The final data set for this study consisted of 54 scans from 27 participants (mean age 25 ± 6.7 at scan 1; 70.4 % males). On average, the scan at the second time point was completed 9.8 ± 1.01 months after the scan completed at the first time point.
Cross-Validation Sample: A second non-overlapping sample of 34 healthy individuals between the ages of 18 and 46 was also scanned (Camchong et al., 2011b). Three participants were excluded due to excessive head movement. The final data set for this study consisted of 31 scans, one from each participant (mean age 38 ± 7.8; 77.4% males). Participants from both samples reported no history of psychiatric or neurological illness. All participants provided written informed consent. The studies were approved by the institutional review board of the University of Minnesota.
2.2. Procedures & ICN classification analyses
2.2.1. Image acquisition & preprocessing
Resting-state scans (eyes closed but awake) were acquired in the same Siemens Trio 3T scanner (Erlangen, Germany) for both samples. Sequence parameters for both samples included: gradient-echo echo-planar imaging of 180 volumes, repetition time =2 s; echo time = 30 ms; flip angle = 90°, 34 contiguous anterior commissure-posterior commissure aligned axial slices, voxel size = 3.4 × 3.4 × 4.0 mm, matrix = 64 × 64 × 34. Some Reference-Retest Sample participants completed longer resting-state scans; for these scans the first 180 volumes were used for the analyses. Participants verbally confirmed that they did not sleep during the scan. A field map acquisition was collected in the same registration to correct the fMRI data for geometric distortion caused by magnetic field inhomogeneities (repetition time = 300 ms, echo time = 1.94 ms/4.40 ms, flip angle = 55°). A high-resolution T1-weighted anatomical image was acquired using a magnetization prepared rapid gradient-echo sequence.
Data preprocessing was completed using FMRIB Software Library (FSL v. 4.1.8; www.fmrbid.ox.ac.uk/fsl) as follows: slice-timing correction for interleaved slice acquisition; motion correction (Jenkinson et al., 2002); brain extraction (Smith, 2002); grand-mean intensity normalization of the 4D data set (all volumes) by the same multiplicative factor; high-pass temporal filtering set at 100 s; B0 field unwarping; scans were smoothed using a 6 mm FWHM Gaussian kernel. Spatial normalization and registration of the functional images to respective high-resolution structural images used linear registration (Jenkinson et al., 2002) and registration to MNI152 space used linear and non-linear registration (Andersson et al., 2008).
2.2.2. Generation of ICNs
For each of the three data sets separately (Reference Sample, Retest Sample, and Cross-Validation Sample), a meta-level approach was employed to generate the most consistent and naturally occurring ICNs. This approach, illustrated in Figure 1, minimized the variability introduced by subject order and initial random value (Zhang et al., 2010), while maximizing the consistency of group ICNs (Smith et al., 2009; Biswal et al., 2010). It required 50 temporal concatenation group-level probabilistic ICA analyses, each implemented using the MELODIC (Multivariate Exploratory Linear Optimized Decomposition into Independent Components (Beckmann and Smith, 2004; Beckmann et al., 2005)) package within the FSL software suite (http://www.fmrib.ox.ac.uk/fsl/melodic/index.html). Each MELODIC was set to derive 20 ICNs from the fMRI data, and each employed a unique, randomly generated subject order. The resulting 20 ICNs from each MELODIC were concatenated into a single file (50 MELODICs x 20 ICNs = 1000 ICNs), which was then used in a single meta-level MELODIC (meta-ICA) to generate the 20 most consistent ICNs, which were the focus of all subsequent analyses.
Figure 1.
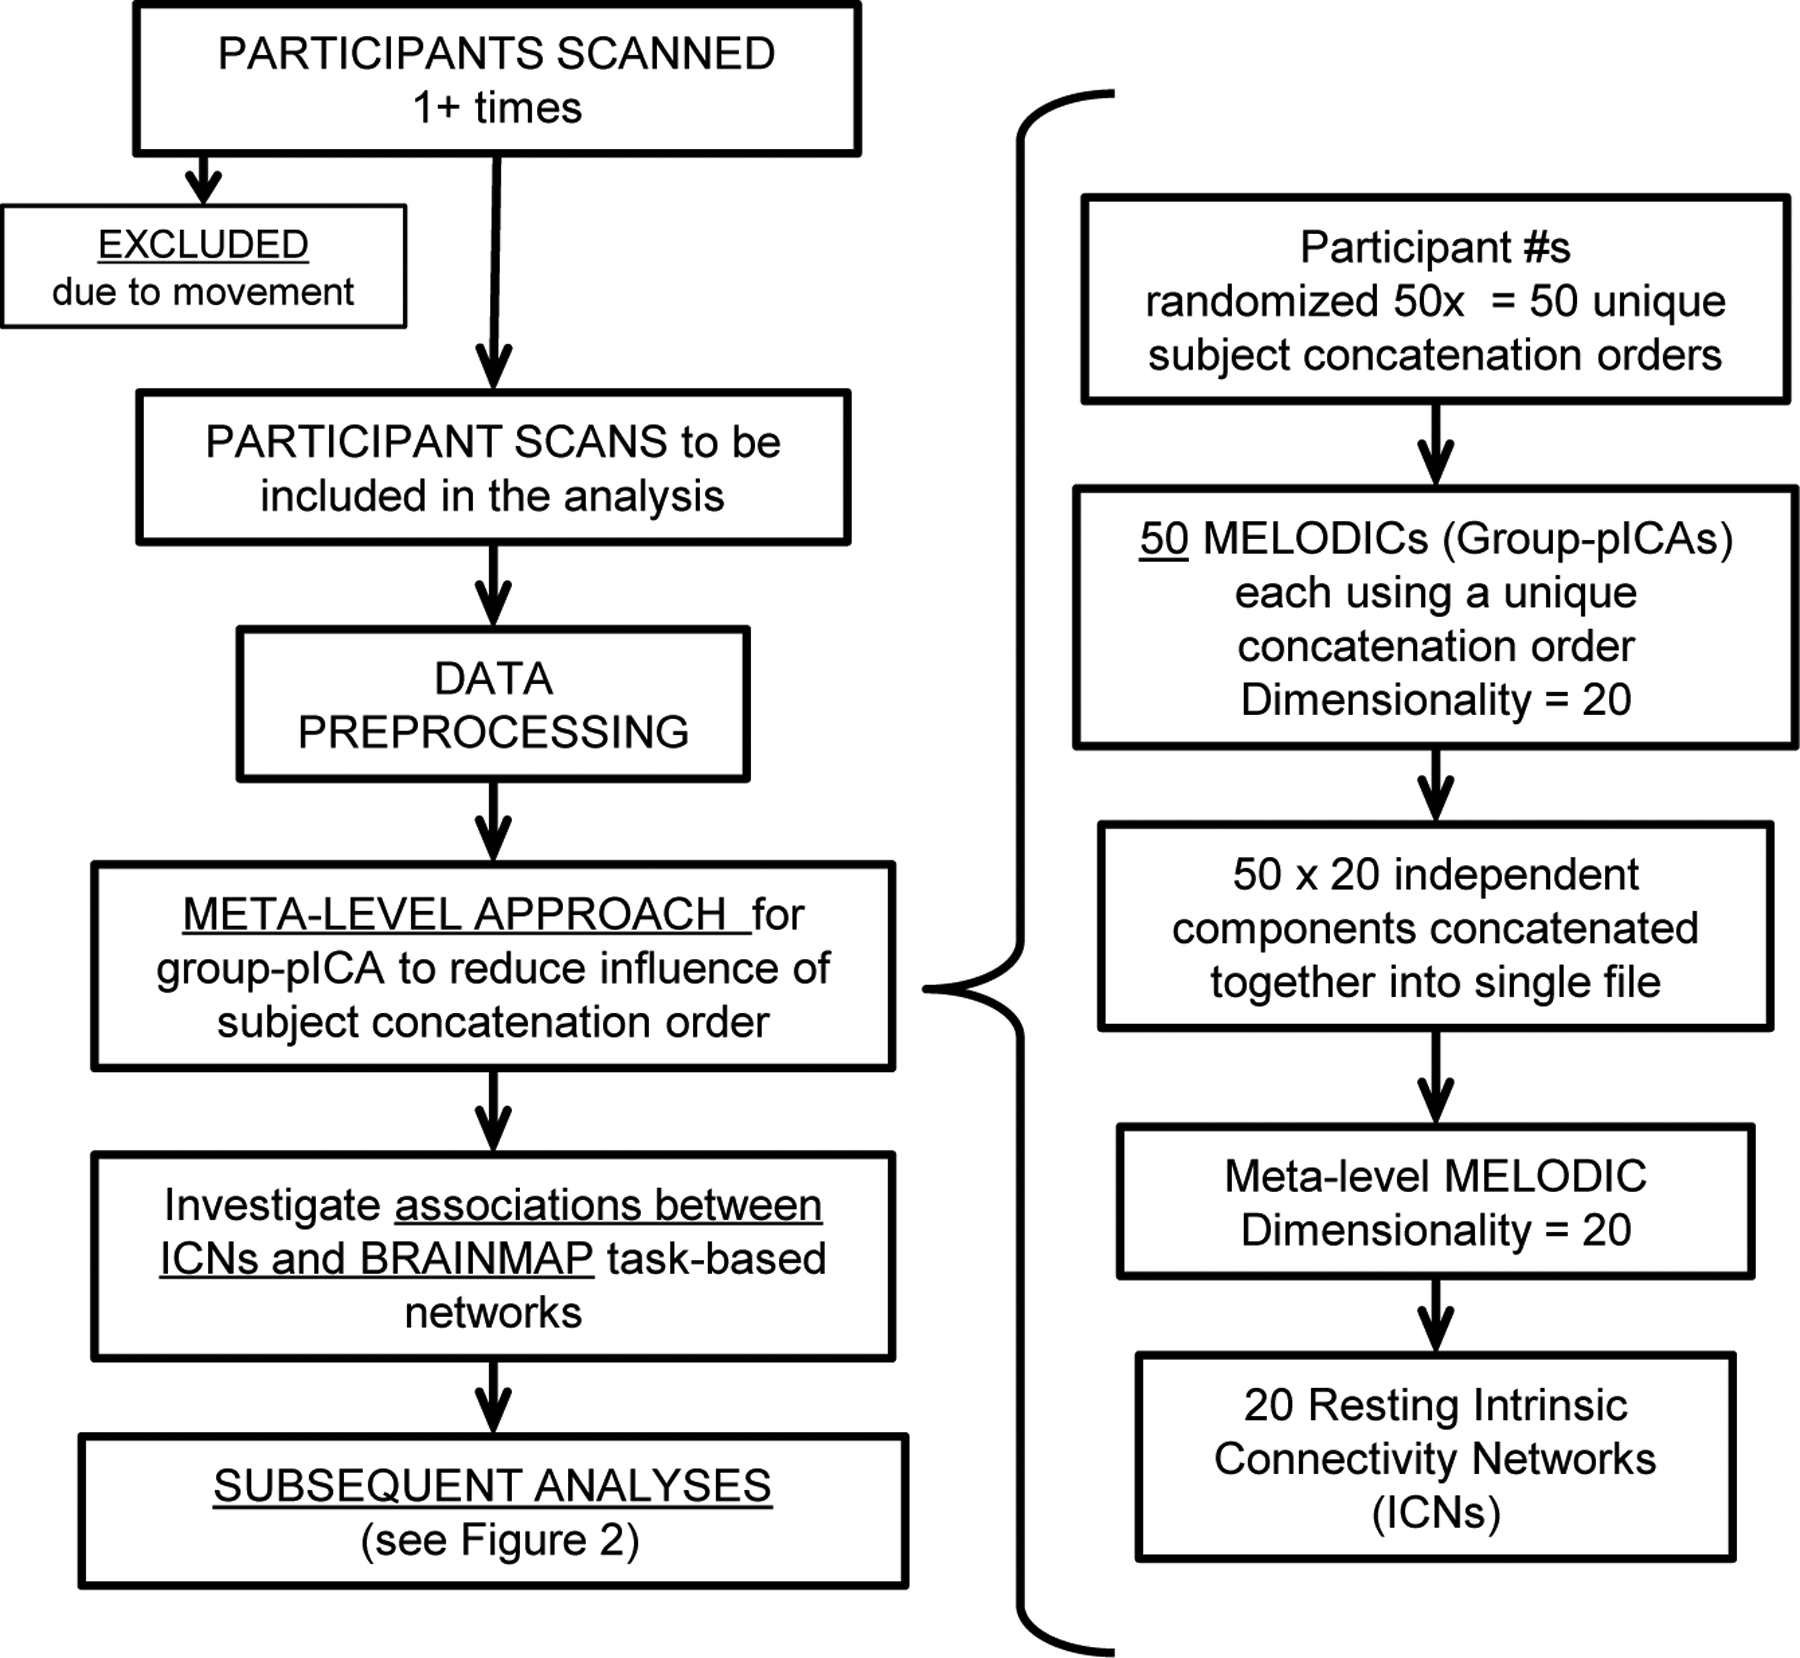
Flowchart overview of procedures of meta-level MELODIC to develop and test the intrinsic connectivity networks (ICNs). Preprocessing and meta-MELODIC procedures completed for Reference Sample, Retest Sample, and Cross-validation Sample scans separately.
2.2.3. Robustness assessment for validation of the meta-ICA procedure
In order to quantify improvement in ICN consistency in the present study, the meta-ICA approach was compared to single ICA calculations. A test set comprising 50 sets of 20 ICNs each was generated from the Reference Sample data using three different methods which permitted testing the effect of variability at the meta-level: 1) 50 single (typical) group-level ICAs referred to as the “Single ICAs” in the results, 2) 50 meta-ICAs each completed on randomly concatenated results from 50 different single ICAs referred to as the “Random Order Metas” , and 3) 50 meta-ICAs each completed on the randomly concatenated results from 50 single ICAs randomly selected from a total of 100 different single ICAs referred to as the “Random Order & Selection Metas”. For this proof-of-principle, none of the meta-ICAs included in the test sets incorporated the 20 meta-level ICNs from the Reference Sample to which they were being compared. To quantify the variability of each test set all ICNs were assessed for spatial similarity to the Reference Sample meta-level ICNs. Binarized versions of all ICN maps were used to calculate the Dice Similarity Index (SID; (Dice, 1945; Zijdenbos et al., 1994. This evaluated the spatial overlap in a manner akin to kappa, and represented twice the value of the intersection over the sum of the cardinalities for each map X and Y:
The mean SID, with respect to each of the Reference Sample meta-level ICNs, was calculated for each of the three methods for testing ICN generation consistency.
2.2.4. Classification of ICNs
BrainMap probabilistic ICA-derived task-based activation networks with accompanying behavioral classification data (Laird et al., 2011) were used for functional interpretation of ICNs generated from the Reference Sample, Retest Sample, and Cross-Validation Sample. ICNs were correlated with BrainMap networks for each data set separately in order to obtain unique ICN characterization, employ a consistent interpretative mechanism across the ICN sets, and facilitate an evaluation of the consistency of correspondence. Spearman’s correlations (ρ) masked to include only brain voxels were employed for this purpose, and ICNs were thresholded at z ≥ 6 for the correlations with BrainMap networks and for all subsequent analyses. Maps for correlations were not binarized. Artifacts were identified visually and subsequently removed; these included signals due to cardiac or respiratory sources, and those located in periphery regions and thus likely due to movement or non-neural physiological fluctuations (Smith et al., 2009; Kelly et al., 2010). The behavioral domains for the 18 non-artifactual BrainMap (BM) task-based networks were summarized from the work of Laird et al. (2011) as follows: Emotion (BM 01), Reward1 (BM 02), Reward2 (BM 03), Emo/Exec (BM 04), Interoception (BM 05), Visumotor (BM 06), Visuospatial (BM 07), Arm/Hand (BM08), Coordination (BM 09), Vision1 (BM 10), Vision2 (BM 11), Vision3 (BM 12), SocCog/Default Mode (BM 13), Autonomic (BM 14), Right-Exec (BM 15), Audition (BM 16), Speech (BM 17), and Left-Exec (BM 18). Corresponding ICNs were identified as those with Spearman correlations of at least 0.30; lower correlations were taken to indicate the BrainMap networks were poorly reflected in the ICNs. Binarized versions of the ICN maps were used to calculate a spatial similarity index termed the Dice coefficient (SID) as described above. The Spearman’s correlations also assessed spatial similarity, but weighted the z-score connectivity values of individual voxels above the threshold. Additionally, the proportion of grey matter voxels encompassed by the ICNs for the Reference Sample was calculated.
2.3. Statistical analyses of reproducibility, replicability and reliability
2.3.1. Group-level reproducibility and replicability of ICNs
Network group-level reproducibility and replicability between data set ICNs were assessed using i) Spearman’s correlations (ρ) masked to include only brain voxels, and ii) Dice spatial similarity index (SID). In order to examine network group-level reproducibility, Spearman’s correlations were calculated between ICNs from the Reference Sample and ICNs from the Retest sample (Figure 2.A1). Subsequently, each Reference Sample ICN was paired with the Retest Sample ICN showing the highest pair-wise correlation; pairs of ICNs were then binarized and used to calculate the SID (Figure 2.A2). To investigate network group-level replicability across independent data sets, the reproducibility analysis was repeated using the Cross-Validation Sample. Spearman’s correlations were calculated between ICNs from the Reference Sample and ICNs from the Cross-Validation sample (Figure 2.A3). ICNs were paired based on the highest Spearman correlation; paired ICNs were binarized to calculate the SID across the ICNs (Figure 2.A4).
Figure 2.
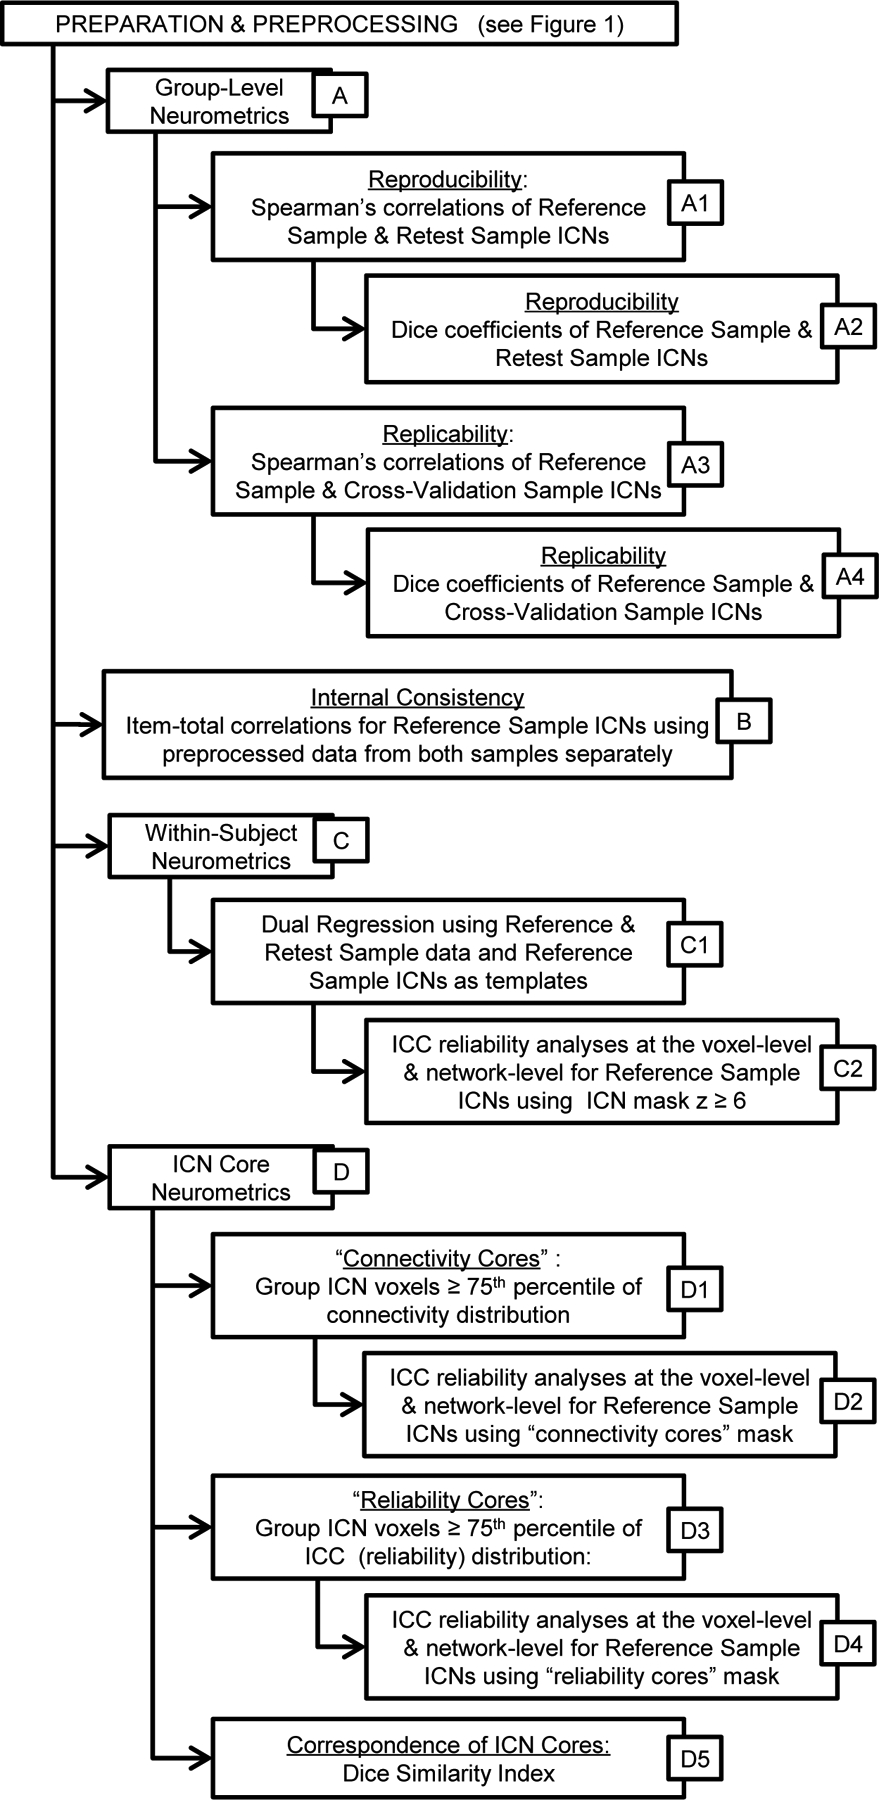
Flowchart overview of analytic procedures to test group-level reliability, internal consistency, within-subject reliability, cross-validation of group-level ICNs, and analyses of ICN “cores”. All dual regression analyses employed Reference Sample ICNs (unthresholded) as the template in the procedure to make the individual level maps.
2.3.2. Internal consistency across time points
Internal consistency across voxels within an ICN was estimated using an alternative form of Cronbach’s alpha in which each voxel was used as an item and the total blood oxygen level dependent signal across the ICN for each volume as the score for the test calculated for each subject. This metric approached a ceiling for all ICN’s (greater than 0.9994), giving a clear indication of inflation from the number of items (voxels) involved in the calculation for each ICN (typically about 20000 voxels). This metric therefore was not appropriate to measure ICN internal consistency. Therefore, to assess internal consistency the item-total correlation was computed for each ICN in the Reference and Retest Samples separately (Figure 2.B). The Pearson correlation between the blood oxygen level dependent timeseries for each voxel and the mean timeseries across all voxels in the ICN was calculated by applying ICN masks from the Reference Sample, thresholded at z ≥ 6, to the preprocessed data from the Reference and Retest Sample. Mean item-total correlations across voxels within the mask were calculated for each ICN for each subject; the mean across subjects was then calculated to summarize the findings for the Reference & Retest Samples separately.
2.3.3. Individual level network generation and within-subject test-retest reliability
The reliability of ICNs within individuals was evaluated with intraclass correlation coefficients (ICC; (Shrout and Fleiss, 1979)) using the data from the Reference Sample and Retest Sample to solve for ρu. ρu was defined as
and the ICCu was defined as
where was the variance across subjects, was the variance across sessions, and was error variance. Two levels of analyses were completed with this equation: 1) within-subject voxel-level reliability for each ICN, 2) within-subject network-level reliability for each ICN.
Subject- and scan-specific connectivity maps based on the ICNs were required for the ICC calculations. A dual regression procedure was employed for this purpose (Beckmann et al., 2009; Filippini et al., 2009; Zuo et al., 2010b), which produced subject- scan- and ICN-specific connectivity maps based on the group-level maps provided as templates. This procedure was completed for the Reference Sample and the Retest Sample data simultaneously using the respective individual-level data and the unthresholded Reference Sample ICNs as the templates for both data sets (Figure 2.C1). The advantage of this procedure over one that completes the dual regression on the time 1 and time 2 data using separate ICN templates is that it removes the need for, and confounds associated with, a template matching procedure shown to be non-optimal due to inaccuracy (Zuo et al., 2010b). Instead, the current procedure established that the connectivity metrics across data sets would be based on consistent brain regions. To examine within-subject voxel-level reliability for the ICNs from the Reference Sample, the 54 (two scans from 27 participants) subject- and session-specific 4D data sets based on the Reference Sample group-level ICNs were used to calculate the ICCs for every voxel, producing a group-level image of the voxel-level ICC scores for each ICN (Figure 2.C2). To generate summary statistics, voxel-level ICC maps included voxels where group-level Reference Sample ICN connectivity strength was z ≥ 6. To report distributional characteristics of the ICN’s, the coordinates of the maximum ICC were identified and the maximum ICC, the mean ICC, as well as the 75th, 50th, and 25th percentiles were calculated.
To examine within-subject network-level reliability for each ICN, an alternative procedure was used to calculate ICCs. First, for each participant, mean connectivity scores were calculated across all voxels within the individual subject- and session-specific image data sets when masked by the Reference Sample ICNs, thresholded at z ≥ 6. The resulting two sets of connectivity scores (one for each time point) were measurements of the mean connectivity strengths (as parameter estimates) for each ICN for each subject: larger connectivity scores indicated more integrated activation dynamics across all voxels in the ICN, whereas lower connectivity scores reflected more disparate activation dynamics. Normality of the distributions of these mean connectivity scores was tested using the Shapiro-Wilk test (Shapiro and Wilk, 1965). Connectivity scores from nearly all ICNs were negatively skewed to a significant degree. Logarithmic transformations were applied to improve the distributions in order to comply with normality assumptions implicit in the subsequent analyses. The properties of the log transformed connectivity scores were assessed by calculating the first four statistical moments. The two sets of connectivity scores were then used to complete the network-level ICC calculation to produce a single network-level ICC score for each Reference Sample ICN (Figure 2.C2).
2.3.4. Intrinsic connectivity cores and correspondence of methods
To limit the analysis to voxels that appear to form the “core” of each connectivity network and reexamine the within-subject reliability metrics, the masks from the full ICNs (z ≥ 6) were rethresholded to only include voxels above the 75th percentile in the connectivity strength distributions for each Reference Sample ICN separately (Figure 2.D1). A second iteration of the mean connectivity scores for all Reference Sample ICNs and both time-points was then generated for participants using the constrained masks, referred to as the “connectivity cores.” The first four statistical moments, as well as network-level ICCs were generated from this second set of scores; additionally, the voxel-level ICC maps were masked with the “connectivity cores” and the mean ICC of those voxels was calculated (Figure 2.D2). Given significance does not necessarily equate to reliability, the masks from the full ICNs (z ≥ 6) were rethresholded again to only include voxels above the 75th percentile in the ICC distributions for each Reference Sample ICN separately (Figure 2.D3). A third iteration of the mean connectivity scores for all Reference Sample ICNs and both time-points was then generated for participants using this other set of constrained masks, referred to as the “reliability cores,” and network-level ICCs were generated from these scores. Additionally, the voxel-level ICC maps were masked with the “reliability cores” and the mean ICC of those voxels was calculated (Figure 2.D4). To quantify the degree of spatial correspondence between the connectivity cores and the reliability cores, that is the overlap between the types of masks, pairs of these masks for each ICN were used to calculate the Dice similarity index (SID) (Figure 2.D5).
Results
3.1. Robustness assessment for validation of the meta-ICA procedure
Three tests were completed to assess the improvement inconsistency obtained from the meta-ICA procedures and any impact of order effects at this level. The mean SID, with respect to each of the Reference Sample meta-level ICNs, was calculated for each of the three methods employed for testing ICN consistency. Across all 12 Reference Sample ICNs, the mean and standard error values for the Single ICAs were 0.69 ± 0.01, for the Random Order Metas were 0.76 ± 0.01, and for the Random Order & Selection Metas were 0.76 ± 0.01 (see Supplementary Figure 1).
3.2. Functional interpretation of ICNs: Reference & Retest data sets
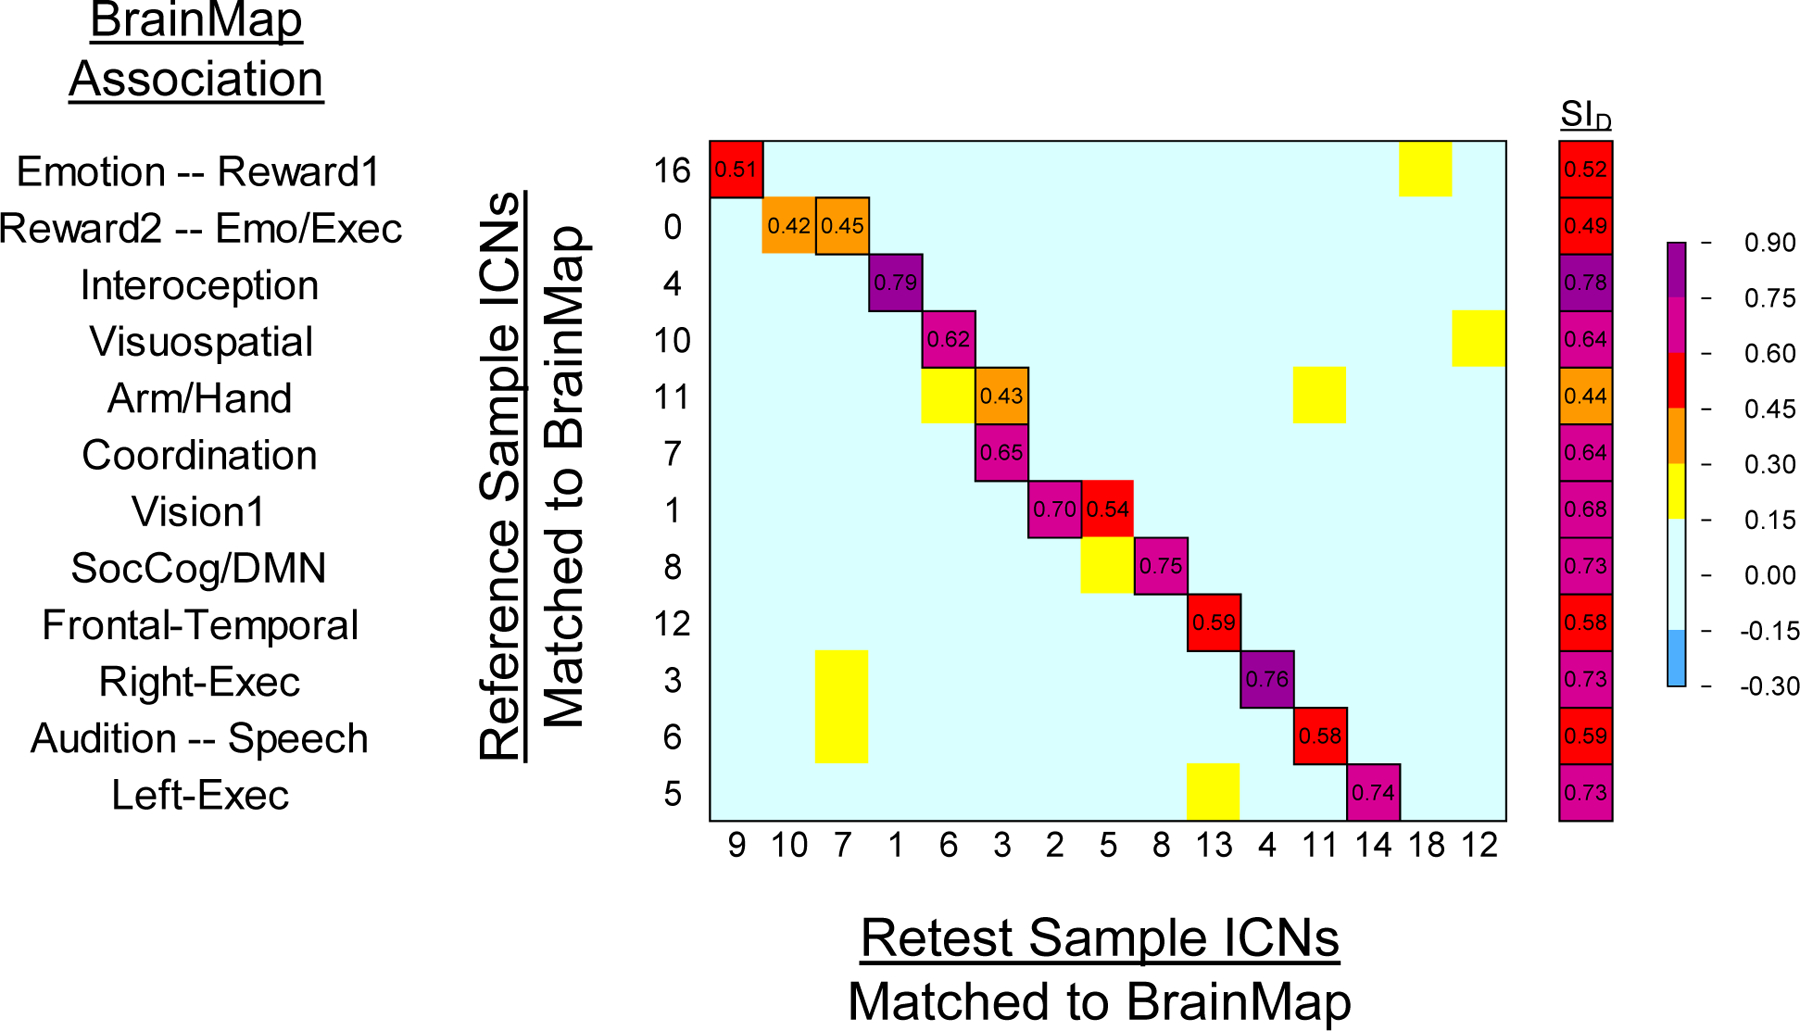
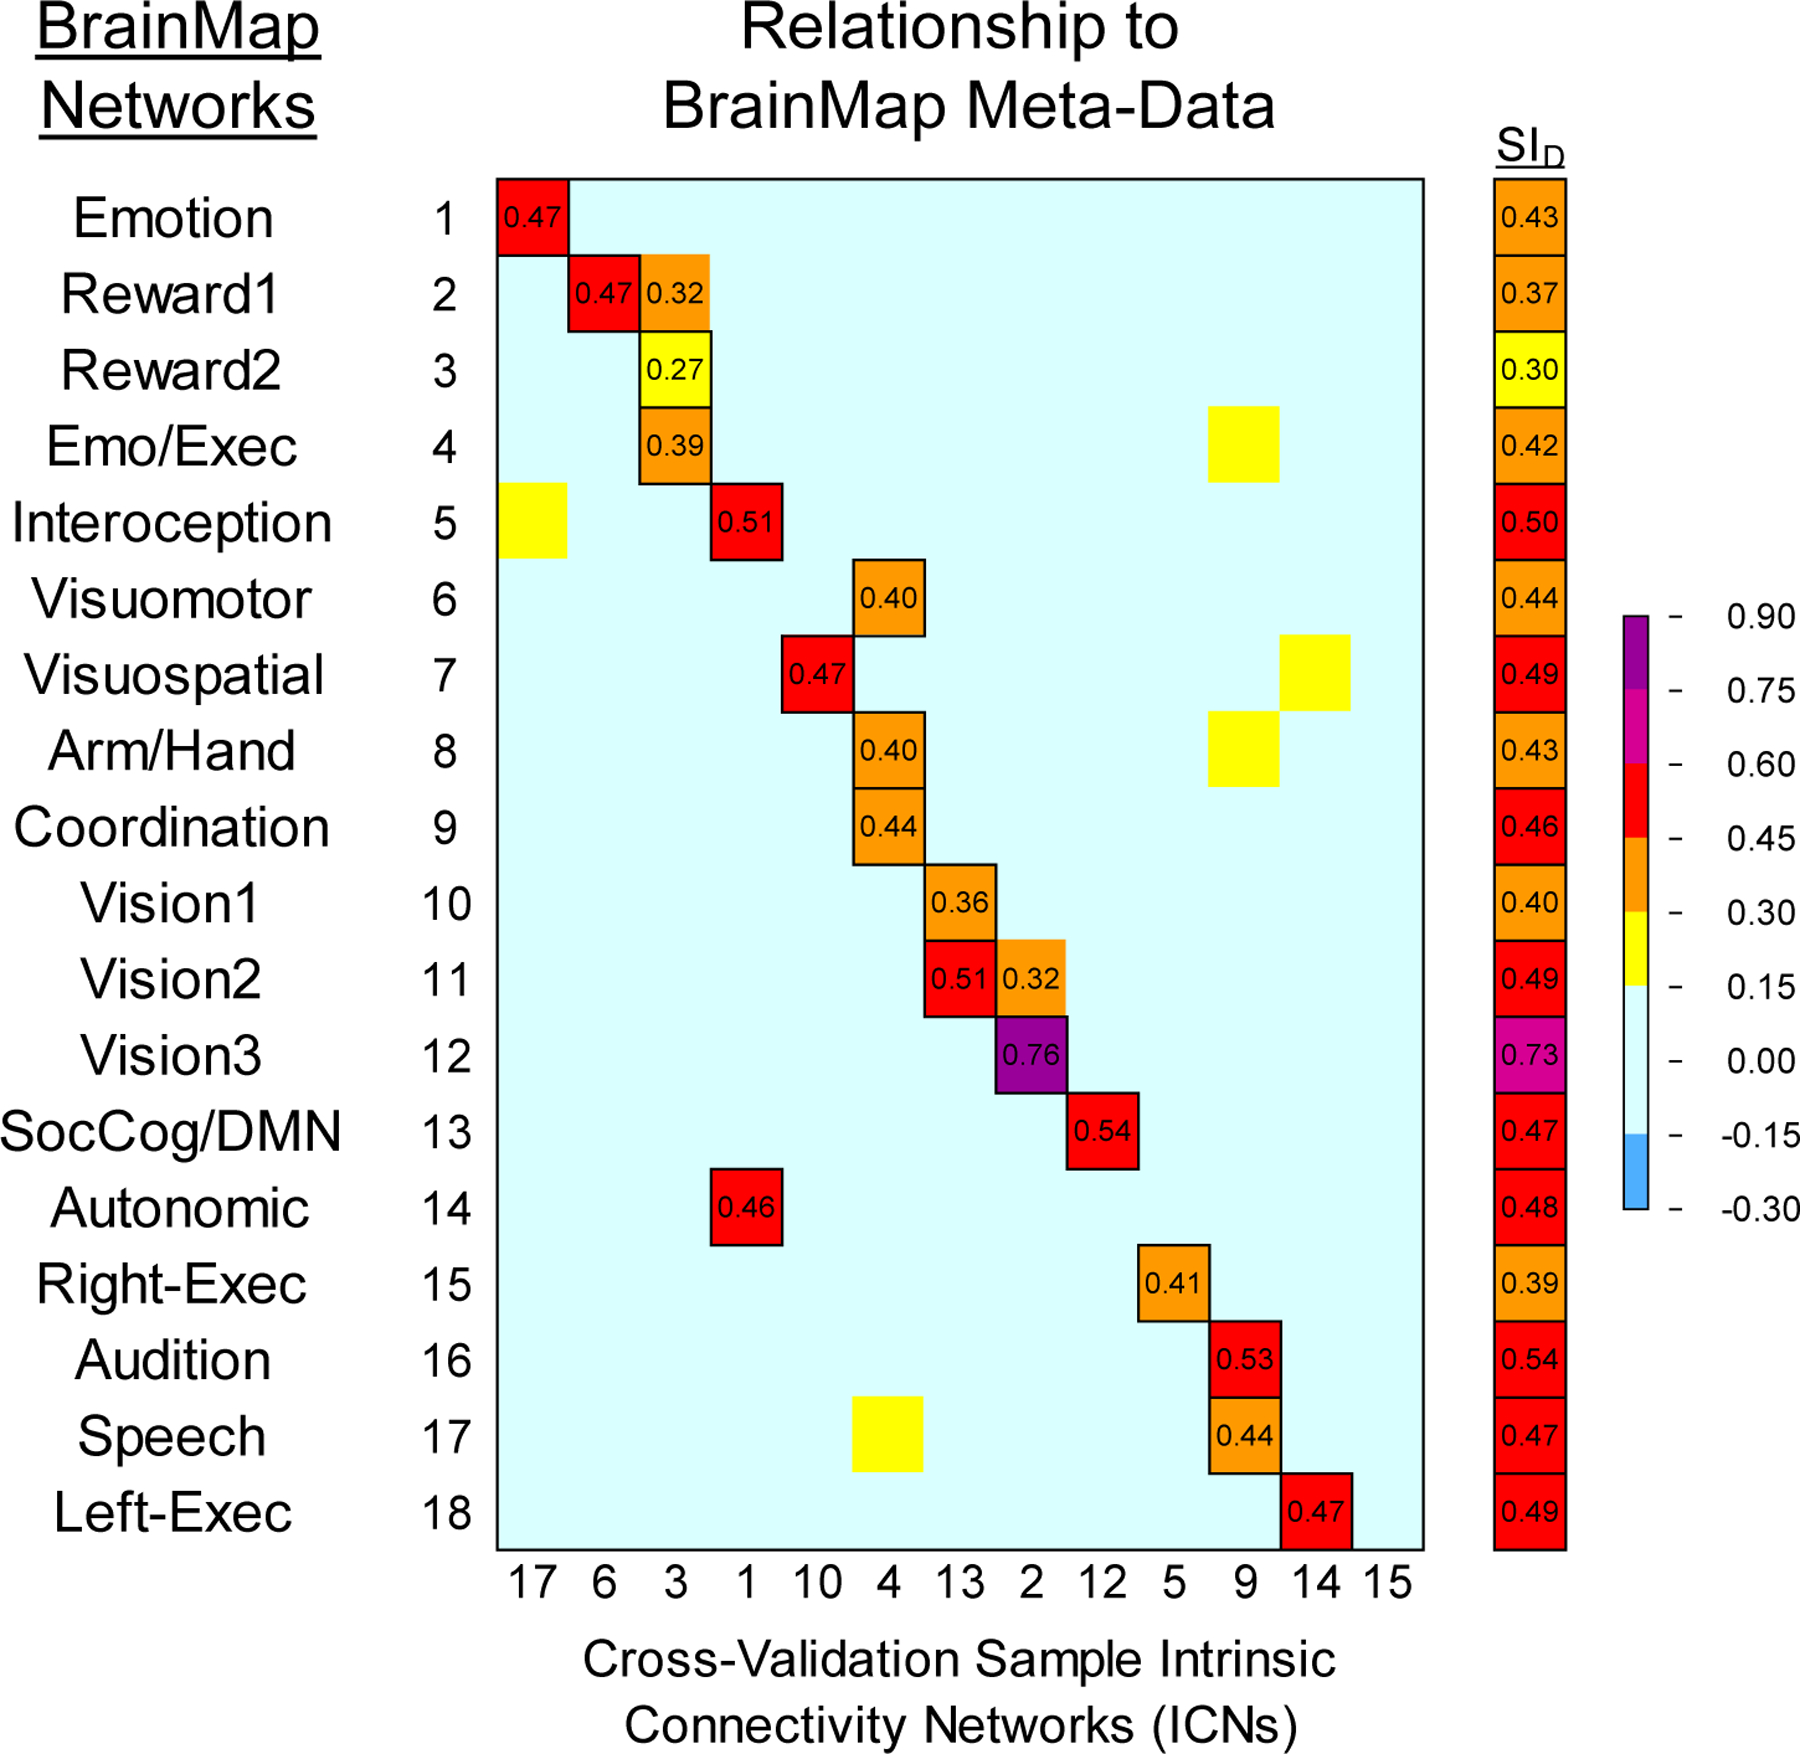
The meta-ICA procedure derived a total of 12 non-artifact ICNs from the Reference Sample data (8 ICNs were artifacts or clearly white matter components) which reflected 17 of the 18 non-artifact BrainMap (BM) networks (ρ ≥ 0.30 with any ICN) as some ICNs loaded on multiple BrainMap networks. The visuomotor network was not well represented in this sample (ρ < 0.30 with BM06). Figure 3A shows the correlations and SID values between the BrainMap and the Reference Sample networks. Across the 18 pairs of networks derived from the correlations, the mean SID was 0.47. Seven of the 12 Reference Sample ICNs showed at least moderate correlations (ρ ≥ 0.50) with BrainMap networks. The greatest correspondence was observed for networks associated with vision (ρ=0.67 with BM 12), coordination (ρ=0.59 with BM 09), and left-lateralized executive functions (ρ=0.57 with BM 18). The weakest correspondence was observed for networks associated with viewing complex images (ρ=0.31 with BM 10) and autonomic functions (ρ=0.30 with BM 14). Axial slices of the non-artifact ICNs from the Reference Sample are shown in Figure 4 alongside the matched BrainMap network. Our analysis revealed two non-artifact ICNs that did not resemble BrainMap networks; one bilateral frontal-temporal network which loaded on the social cognition/default mode, executive functions, and audition networks, and one component indicative of white matter which was not included in subsequent analyses. These are shown in Figure 4.
Figure 3.
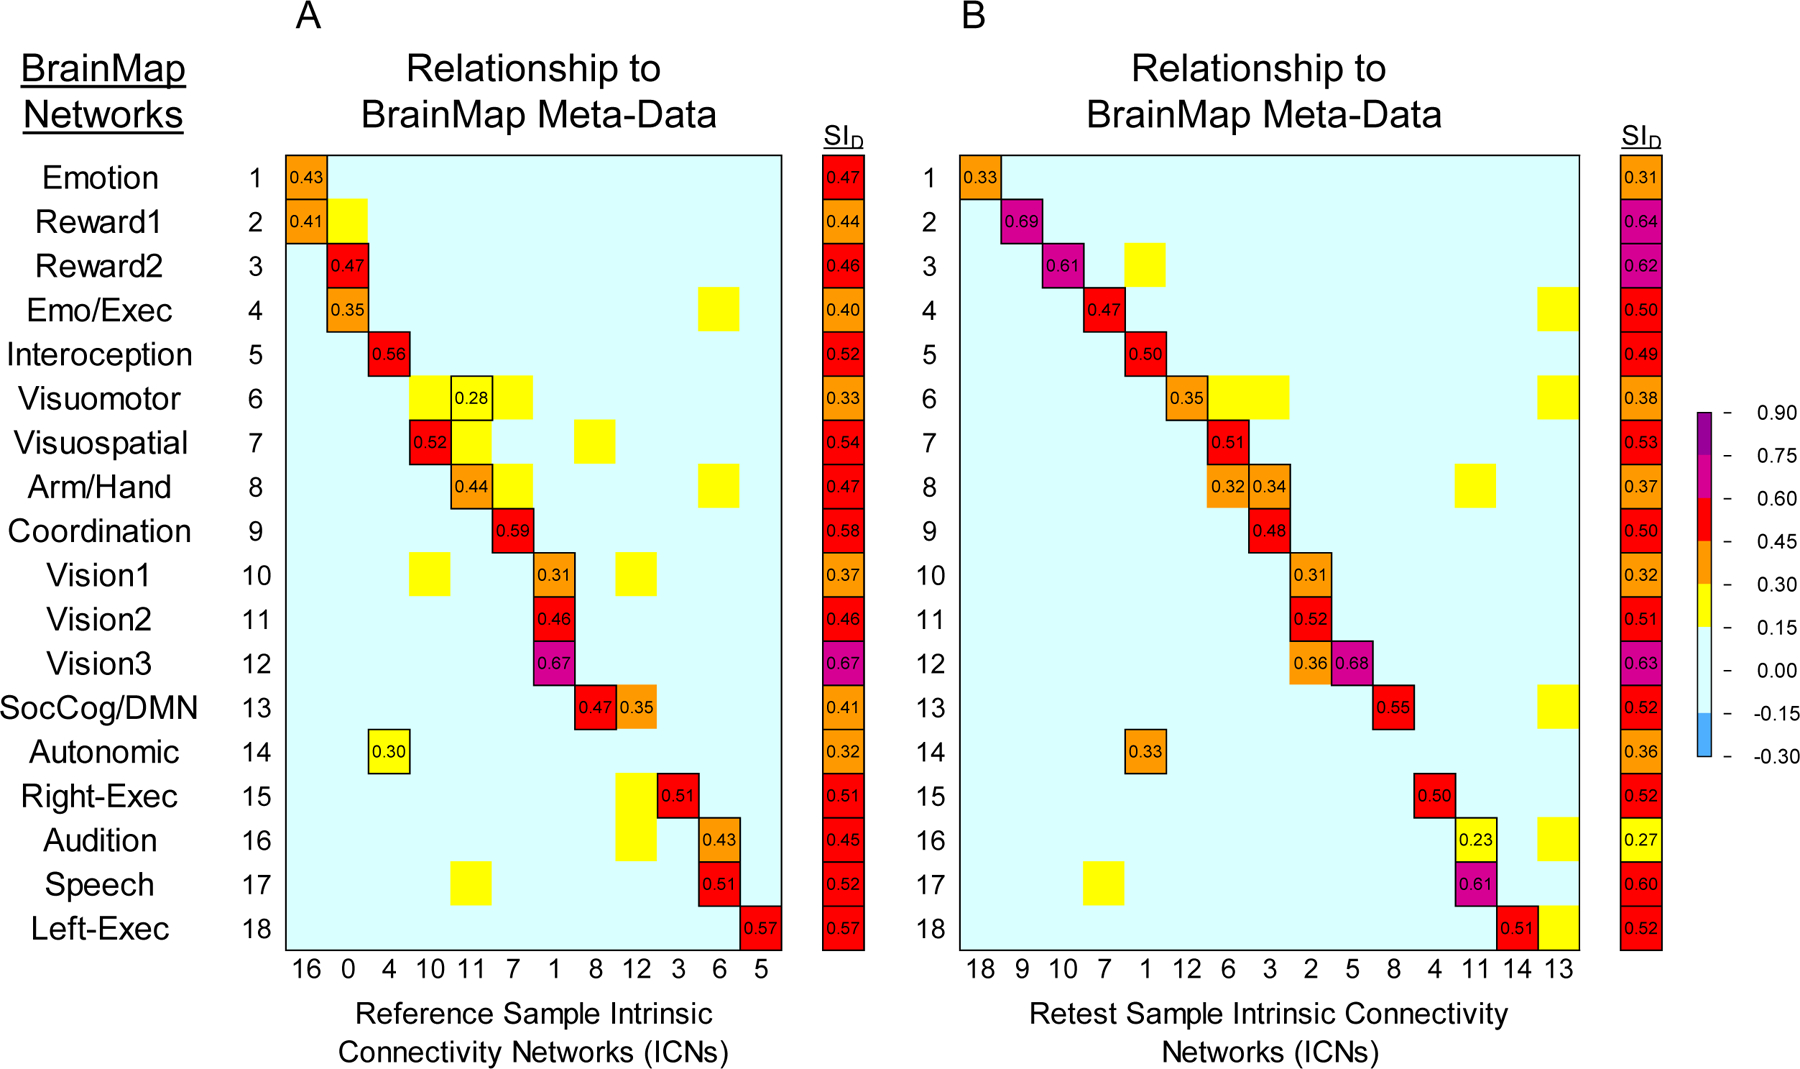
Heat map matrices comparing BrainMap meta-analytic networks (Laird et al., 2011) with ICNs from the Reference & Retest datasets using Spearman’s correlations. To the right is the Dice Similarity Index for matched volumes from the two sets; outlined cells indicate paired ICNs used in the Dice Similarity Index. A) Relationships between BrainMap and the Reference Sample (12 non-artifact ICNs). B) Relationships between BrainMap and the Retest Sample (15 non-artifact ICNs).
Figure 4.
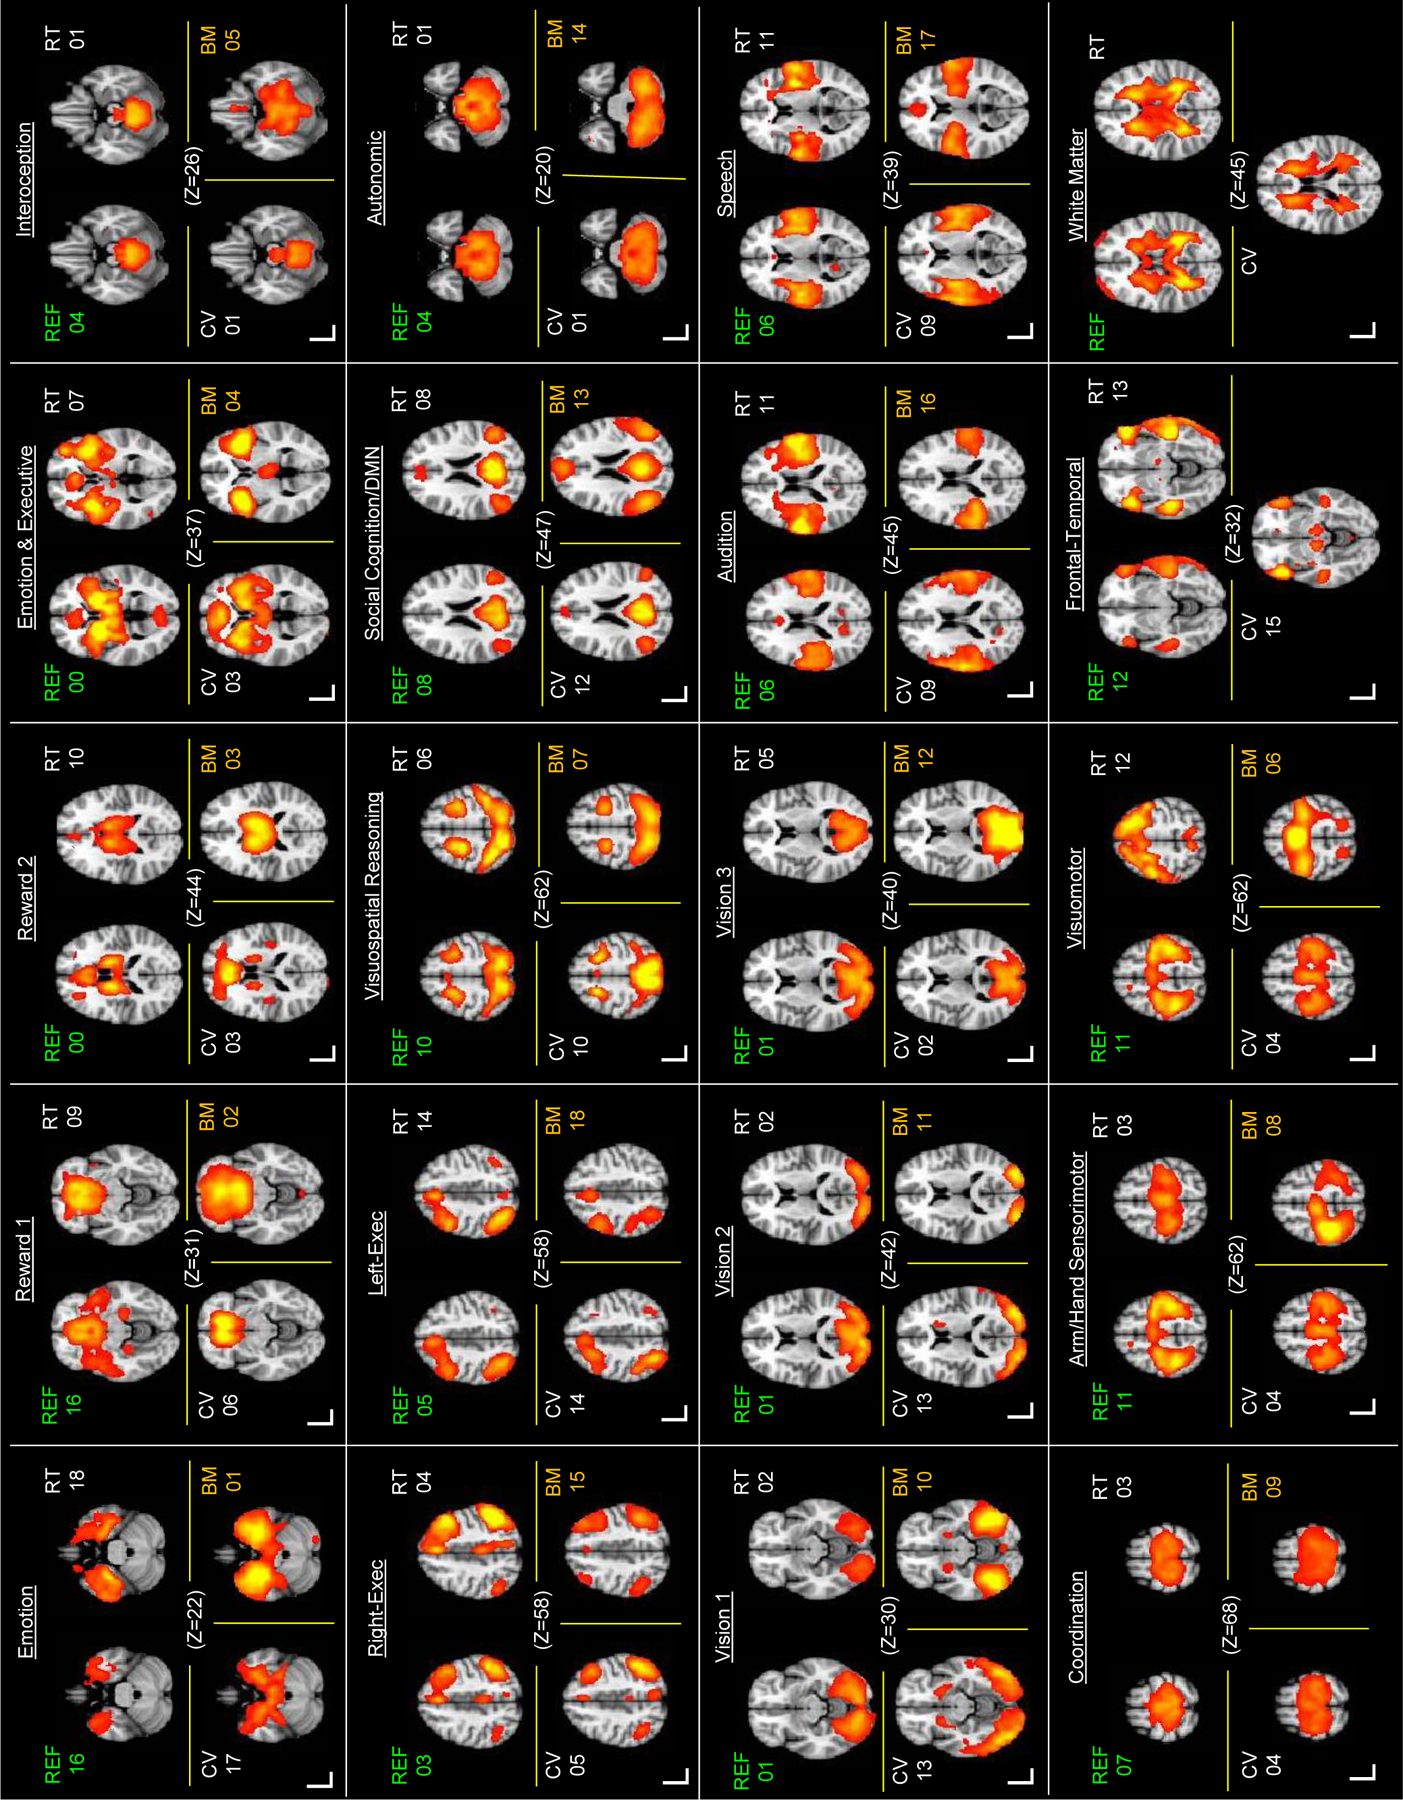
Axial slices of ICNs derived from Reference Sample (REF), Retest Sample (RT), Cross-validation Sample (CV) separately, and the matched BrainMap Task-based network derived from contrast images (BM; Laird et al. 2011). Connectivity intensity was thresholded at Z ≥ 6. Note, some ICNs were associated with multiple BrainMap components; accordingly they appear in multiple instances in the figure. Two components were present in the three independent samples which were not present in the BrainMap data (see lower right corner): one was a bilateral frontal-temporal ICN (REF 12) which weakly loaded on social cognition, executive, and audition BrainMap networks; the other was a white matter component and as such was not included in the subsequent analyses.
On a side note, the non-artifact Reference Sample ICNs, thresholded at z ≥ 6 and binarized, were combined in a single mask to calculate the proportion of grey matter encompassed by ICNs. This combined mask included 165149 voxels; a probabilistic grey matter mask included 200874 voxels. The overlap of the two masks encompassed 14560 voxels, indicating 88% of the voxels encompassed grey matter. The two masks and their overlap are shown in Supplemental Figure 2, where additional information is provided.
The meta-ICA procedure derived 15 non-artifactual ICNs from the Retest Sample data (5 ICNs were artifacts or white matter components) which reflected 17 of the 18 non-artifact BrainMap (BM) networks (ρ ≥ 0.30 with any ICN) as some ICNs loaded on multiple BrainMap networks. The audition network was not well represented in this sample (ρ < 0.30 with BM16). Figure 3B shows the correlations and SID values between the BrainMap and the Retest Sample networks. Across the 18 pairs of networks derived from the correlations, the mean SID was 0.48. Ten of the 15 Retest Sample ICNs showed at least moderate correlations (ρ ≥ 0.50) with BrainMap networks. The greatest correspondence was observed for two networks associated with reward (ρ=0.69 with BM 02; ρ=0.61 with BM 03), a network associated with vision (ρ=0.68 with BM 12) and one associated with speech (ρ=0.61 with BM 17). The weakest correspondence was observed for networks associated with emotion (ρ=0.33 with BM 1), autonomic functions (ρ=0.33 with BM 14), and viewing complex images (ρ=0.31 with BM 10); the latter two being those which also showed the lowest correspondence in the Reference Sample. Although the magnitude of the relationships with BrainMap networks changed from time 1 (Reference Sample) to time 2 (Retest Sample), this change was generally within a narrow range, and the overall 1:1 or 1:2 correspondence with BrainMap networks remained. Axial slices of the non-artifact ICNs for the Retest sample, including a frontal-temporal network and white matter component, are shown in Figure 4 alongside the matched BrainMap network.
3.3. Reproducibility and reliability of ICNs
Reliability of Reference ICNs was evaluated five ways: item-total correlations were used to assess internal consistency, Spearman’s correlations as well as the Dice Similarity Index were used to assess group-level reproducibility, and intraclass correlation coefficients were used to assess within-subject reliability of voxel-level connectivity and network-level connectivity.
3.3.1. Internal consistency of ICNs
The internal consistency of connectivity based on the Reference Sample ICNs was calculated across subjects separately for the Reference Sample data and Retest Sample data based on mean item-total correlations. Mean item-total correlations were greater than 0.50 for all ICNs irrespective of data set (see Figure 5). Reference Sample ICNs with the highest internal consistency included ICNs associated with vision (Reference Sample internal consistency > 0.70, Retest Sample internal consistency > 0.68), coordination (Reference Sample internal consistency > 0.68, Retest Sample internal consistency > 0.67), and the default mode network (Reference Sample internal consistency > 0.66, Retest Sample internal consistency > 0.64).
Figure 5.
Heat map matrix illustrating the internal consistency of the Reference Sample ICNs. Item-total correlations were computed for each ICN for both samples separately by applying ICN masks from the Reference Sample to the preprocessed data from the Reference and Retest Sample. Mean item-total correlations across voxels within the mask was calculated for each ICN for each subject; the mean across subjects was then calculated to summarize the findings at the separate time points. See Figure 3 or 4 for the Reference Sample (REF) ICN identifiers.
3.3.2. Group-level reproducibility of ICNs: Reference & Retest data sets
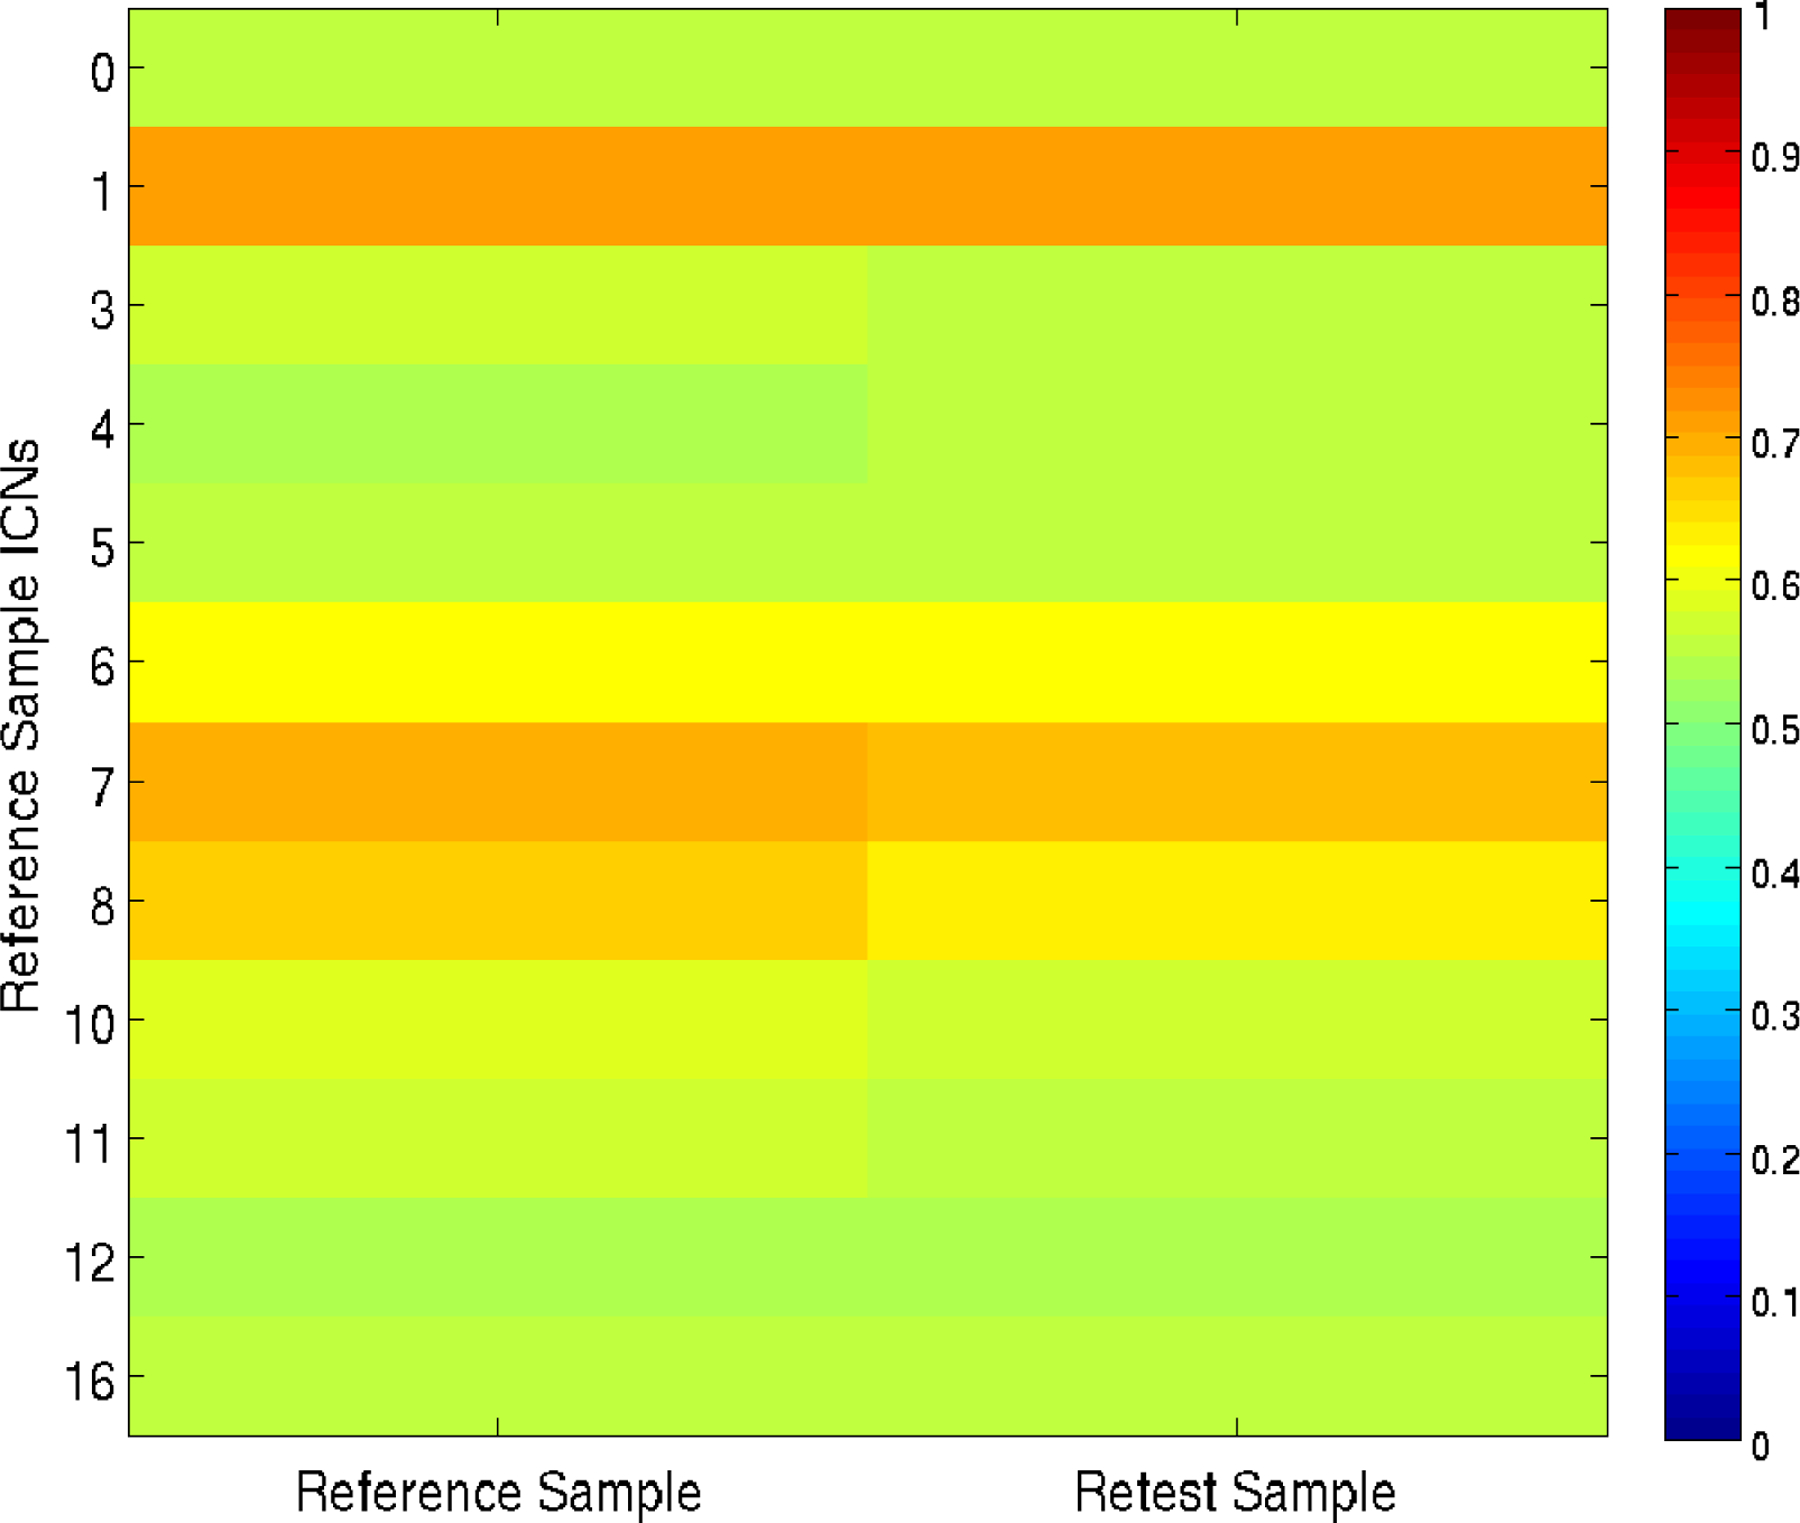
Spearman’s correlations (ρ) and the Dice Similarity Index (SID) were calculated for ICNs from the Reference Sample and Retest Sample to examine group-level reproducibility of ICNs. Figure 6 shows the correlations and SID values between those ICNs. Across the 12 pairs of networks derived from the correlations, the mean SID was 0.63. Overall, the ICNs from Reference Sample showed a high degree of correspondence with the Retest Sample ICNs, with most networks showing a 1:1 relationship across the data sets. Ten of the 12 Reference Sample ICNs showed at least moderate correlations (ρ ≥ 0.50) with the Retest Sample ICNs. The greatest correspondence was observed for networks associated with interoception and autonomic functions (ρ=0.79), right-lateralized executive functions (ρ=0.76), social cognition and the default mode (ρ=0.75), left-lateralized executive functions (ρ=0.74), and vision (ρ=0.70). The Reference Sample ICNs that demonstrated the weakest relationships to Retest Sample ICNs included networks associated with reward and executive control of emotion (ρ=0.42; ρ=0.45) and sensorimotor of the arm and hand (ρ=0.43).
Figure 6.
Heat map matrices correlating Reference Sample ICNs with Retest Sample ICNs to indicate reliability using Spearman’s correlations across brain voxels for each ICN. To the right is the Dice Similarity Index for matched volumes from the two samples; outlined cells indicate paired ICNs used in the Dice Similarity Index. BrainMap domain labels on the y-axis were determined by the associations revealed by Reference Sample and BrainMap network correlations.
3.3.3. Within-subject reliability of ICNs: Reference & Retest data sets
ICN specific voxel-level ICC maps, derived from individual level connectivity maps for both time points, were used with corresponding Reference Sample ICN masks to calculate ICC summary statistics, including ICC quartiles (see Table 1). At the first quartile (25th percentile) only the network associated with right-lateralized executive functions showed a voxel-level ICC equal to or above 0.40, indicating a ‘fair’ level of agreement over time (Cicchetti and Sparrow, 1981). At the second quartile (50th percentile) six ICNs showed a voxel-level ICC equal to or above 0.40. At the third quartile (75th percentile) 11 ICNs showed a voxel-level ICC above 0.40; only the network associated with reward and executive control of emotion showed ICCs below 0.40. Next, considering the entire range of voxels within the full ICN masks, the mean voxel-level ICCs (ICCvox) ranged from 0.24 to 0.53 across the 12 ICNs (see Table 2). Six ICNs showed an ICCvox equal to or above 0.40, indicating a ‘fair’ level of reliability; these included networks associated with right-lateralized executive functions (ICCvox = 0.53), left-lateralized executive functions (ICCvox = 0.46), visuospatial processing (ICCvox = 0.45), social cognition and the default mode (ICCvox = 0.44), audition and speech (ICCvox = 0.40), and coordination (ICCvox = 0.40). Notably, four ICNs that previously showed at least moderate group-level reproducibility (ρ ≥ 0.50) now showed ‘poor’ within-subject reliability at the voxel level (ICCvox < 0.40, (Cicchetti and Sparrow, 1981)); these included networks associated with interoception and autonomic functions, vision, emotion and reward, and the frontal-temporal network. The network associated with reward and executive control of emotion (ICCvox = 0.24) and the frontal-temporal network (ICCvox = 0.30) demonstrated the lowest ICCvox values. Moreover, across all 12 ICNs the level of reproducibility (SID) was moderately, but not significantly, predictive of voxel-level within-subject reliability, ρ (10) = 0.56, p = 0.06.
Table 1.
Within-subject reliability statistics for the Reference Sample ICNs at the voxel-level for the full ICN
| ICNS IN ANALYSIS | VOXEL-LEVEL STATISTICS | ||||
|---|---|---|---|---|---|
| REF ICNs | xyz of maximum ICC voxel in full ICN | maximum ICC value in full ICN | 75th percentile ICC value in full ICN | 50th percentile ICC value in full ICN | 25th percentile ICC value in full ICN |
| Emotion-Reward 1 (16) | 63 74 33 | 0.85 | 0.43 | 0.32 | 0.20 |
| Reward 2-Emo/Exec (00) | 47 89 41 | 0.78 | 0.38 | 0.25 | 0.10 |
| Interoception/Autonomic (04) | 49 56 15 | 0.82 | 0.45 | 0.33 | 0.19 |
| Visuospatial (10) | 66 62 52 | 0.94 | 0.60 | 0.47 | 0.32 |
| Arm/Hand (11) | 22 48 69 | 0.94 | 0.46 | 0.34 | 0.19 |
| Coordination (07) | 31 46 62 | 0.85 | 0.51 | 0.41 | 0.30 |
| Vision (01) | 29 16 48 | 0.91 | 0.48 | 0.38 | 0.27 |
| Social Cog/Default Mode (08) | 42 34 40 | 0.89 | 0.55 | 0.45 | 0.34 |
| Frontal-Temporal (12) | 22 49 38 | 0.86 | 0.44 | 0.31 | 0.16 |
| Right-Executive (03) | 30 76 62 | 0.93 | 0.66 | 0.55 | 0.43 |
| Audition/Speech (06) | 11 57 50 | 0.91 | 0.56 | 0.42 | 0.27 |
| Left-Executive (05) | 56 79 62 | 0.93 | 0.59 | 0.48 | 0.36 |
ICN, Intrinsic Connectivity Network; ICC, intraclass correlation coefficient; REF, Reference Sample; xyz, voxel coordinates in standard space. Voxel-level ICC statistics were derived after generating whole-brain voxel-wise ICC maps for each group-level Reference Sample ICN. An ICC lower than 0.40 is considered ‘poor’, 0.40 – 0.58 is considered a ‘fair’ level of agreement, 0.59 – 0.75 is considered ‘good’ agreement, 0.76 and above is considered ‘excellent’ agreement (Cicchetti & Sparrow, 1981). Bold values indicate statistic greater than or equal to 0.40.
Table 2.
Within-subject reliability for Reference Sample ICNs: three subsets of measurements
| REF ICNs | # non-zero voxels in mask |
Voxel-Level mean of ICCs across voxels in mask |
Network-Level ICC of mean connectivity across voxels in mask |
|---|---|---|---|
| ICNS IN ANALYSIS | FULL ICN ICCs | ||
| Emotion-Reward 1 (16) | 20155 | 0.31 | 0.34 |
| Reward 2-Emo/Exec (00) | 23471 | 0.24 | 0.34 |
| Interoception/Autonomic (04) | 13119 | 0.31 | 0.29 |
| Visuospatial (10) | 23938 | 0.45 | 0.51 |
| Arm/Hand (11) | 24188 | 0.32 | 0.51 |
| Coordination (07) | 8399 | 0.40 | 0.49 |
| Vision (01) | 20996 | 0.37 | 0.31 |
| Social Cog/Default Mode (08) | 11842 | 0.44 | 0.30 |
| Frontal-Temporal (12) | 20432 | 0.30 | 0.31 |
| Right-Executive (03) | 20509 | 0.53 | 0.58 |
| Audition/Speech (06) | 20623 | 0.40 | 0.69 |
| Left-Executive (05) | 18661 | 0.46 | 0.33 |
| ICNS IN ANALYSIS | CONNECTIVITY CORE ICCs | ||
| Emotion-Reward 1 (16) | 5039 | 0.31 | 0.33 |
| Reward 2-Emo/Exec (00) | 5868 | 0.29 | 0.42 |
| Interoception/Autonomic (04) | 3280 | 0.27 | 0.29 |
| Visuospatial (10) | 5985 | 0.55 | 0.49 |
| Arm/Hand (11) | 6047 | 0.42 | 0.59 |
| Coordination (07) | 2100 | 0.47 | 0.53 |
| Vision (01) | 5249 | 0.37 | 0.30 |
| Social Cog/Default Mode (08) | 2961 | 0.41 | 0.23 |
| Frontal-Temporal (12) | 5108 | 0.31 | 0.31 |
| Right-Executive (03) | 5129 | 0.55 | 0.53 |
| Audition/Speech (06) | 5156 | 0.52 | 0.74 |
| Left-Executive (05) | 4666 | 0.49 | 0.38 |
| ICNS IN ANALYSIS | RELIABILITY CORE ICCs | ||
| Emotion-Reward 1 (16) | 5024 | 0.52 | 0.66 |
| Reward 2-Emo/Exec (00) | 5868 | 0.48 | 0.66 |
| Interoception/Autonomic (04) | 3279 | 0.54 | 0.67 |
| Visuospatial (10) | 5985 | 0.68 | 0.70 |
| Arm/Hand (11) | 6046 | 0.57 | 0.71 |
| Coordination (07) | 2100 | 0.59 | 0.61 |
| Vision (01) | 5240 | 0.57 | 0.46 |
| Social Cog/Default Mode (08) | 2960 | 0.63 | 0.53 |
| Frontal-Temporal (12) | 5106 | 0.54 | 0.63 |
| Right-Executive (03) | 5118 | 0.73 | 0.74 |
| Audition/Speech (06) | 5155 | 0.65 | 0.85 |
| Left-Executive (05) | 4652 | 0.67 | 0.60 |
ICN, Intrinsic Connectivity Network; ICC, intraclass correlation coefficient; REF, Reference Sample; three Reference Sample masks were used for ICCs and summary statistics. 1) full ICN mask represented the group-level ICN connectivity map z ≥ 6. 2) “Connectivity Cores”: full ICN mask was rethresholded to only included voxels above the 75th connectivity percentile within original map z ≥ 6. 3) “Reliability Cores”: full ICN mask was rethresholded to only included voxels above the 75th ICC percentile within the original map z ≥ 6. ICC lower than 0.40 is considered ‘poor’, 0.40 – 0.58 is considered a ‘fair’ level of agreement, 0.59 – 0.75 is considered ‘good’ agreement, 0.76 and above is considered ‘excellent’ agreement (Cicchetti & Sparrow, 1981). Bold values indicate statistic greater than or equal to 0.40.
ICN specific network-level mean connectivity scores for both time points were log-transformed and assessed for their distributional properties by calculating the first four statistical moments (see Supplementary Table 1). The log transformed connectivity scores were subsequently used to calculate a network-level ICC for each ICN. Across the 12 ICNs, the network-level ICC (ICCn) of mean connectivity within the full ICN masks ranged from 0.29 to 0.69 (see Table 2). Five out of 12 ICNs showed an ICCn equal to or above 0.40, indicating a ‘fair’ level of agreement over time (Cicchetti and Sparrow, 1981); these included networks associated with audition and speech (ICCn = 0.69), right-lateralized executive functions (ICCn = 0.58), visuospatial processing (ICCn = 0.51), sensorimotor of the arm and hand (ICCn = 0.51), and coordination (ICCn = 0.49). Notably, six ICNs that showed at least moderate group-level reproducibility (ρ ≥ 0.50) now showed ‘poor’ within-subject reliability at the network level (ICCn < 0.40, (Cicchetti and Sparrow, 1981)); these included networks associated with interoception and autonomic functions, vision, social cognition and the default mode, emotion and reward, left-lateralized executive functions, and the frontal-temporal network. In fact, the network-level ICC was lowest for the networks associated with interoception and autonomic function (ICCn = 0.29), and social cognition and the default mode (ICCn = 0.30). Moreover, across all ICNs the level of reproducibility (SID) did not systematically predict network-level within-subject reliability, ρ (10) = −0.40, p = 0.19. Additionally, the degree of voxel-level within-subject reliability did not systematically predict network-level within-subject reliability, ρ (10) = 0.36, p = 0.25. To test if variability in the properties of network-level mean connectivity scores could account for the observed reliability differences, Spearman correlations (ρ) between the ICCn and each statistical moment were computed for each ICN using values calculated from within the full ICN masks. There were no systematic relationships between statistical moments and the ICCn (correlation with mean, ρ (10) = −0.05, p = 0.88, variance, ρ (10) = 0.14, p = 0.66, skewness, ρ (10) = −0.16, p = 0.63, and kurtosis, ρ (10) = −0.46, p = 0.13), suggesting variation in retest reliability may not have been a function of ceiling, floor or other distributional properties of the metrics.
3.4. Functional interpretation of ICNs: Cross-Validation Sample
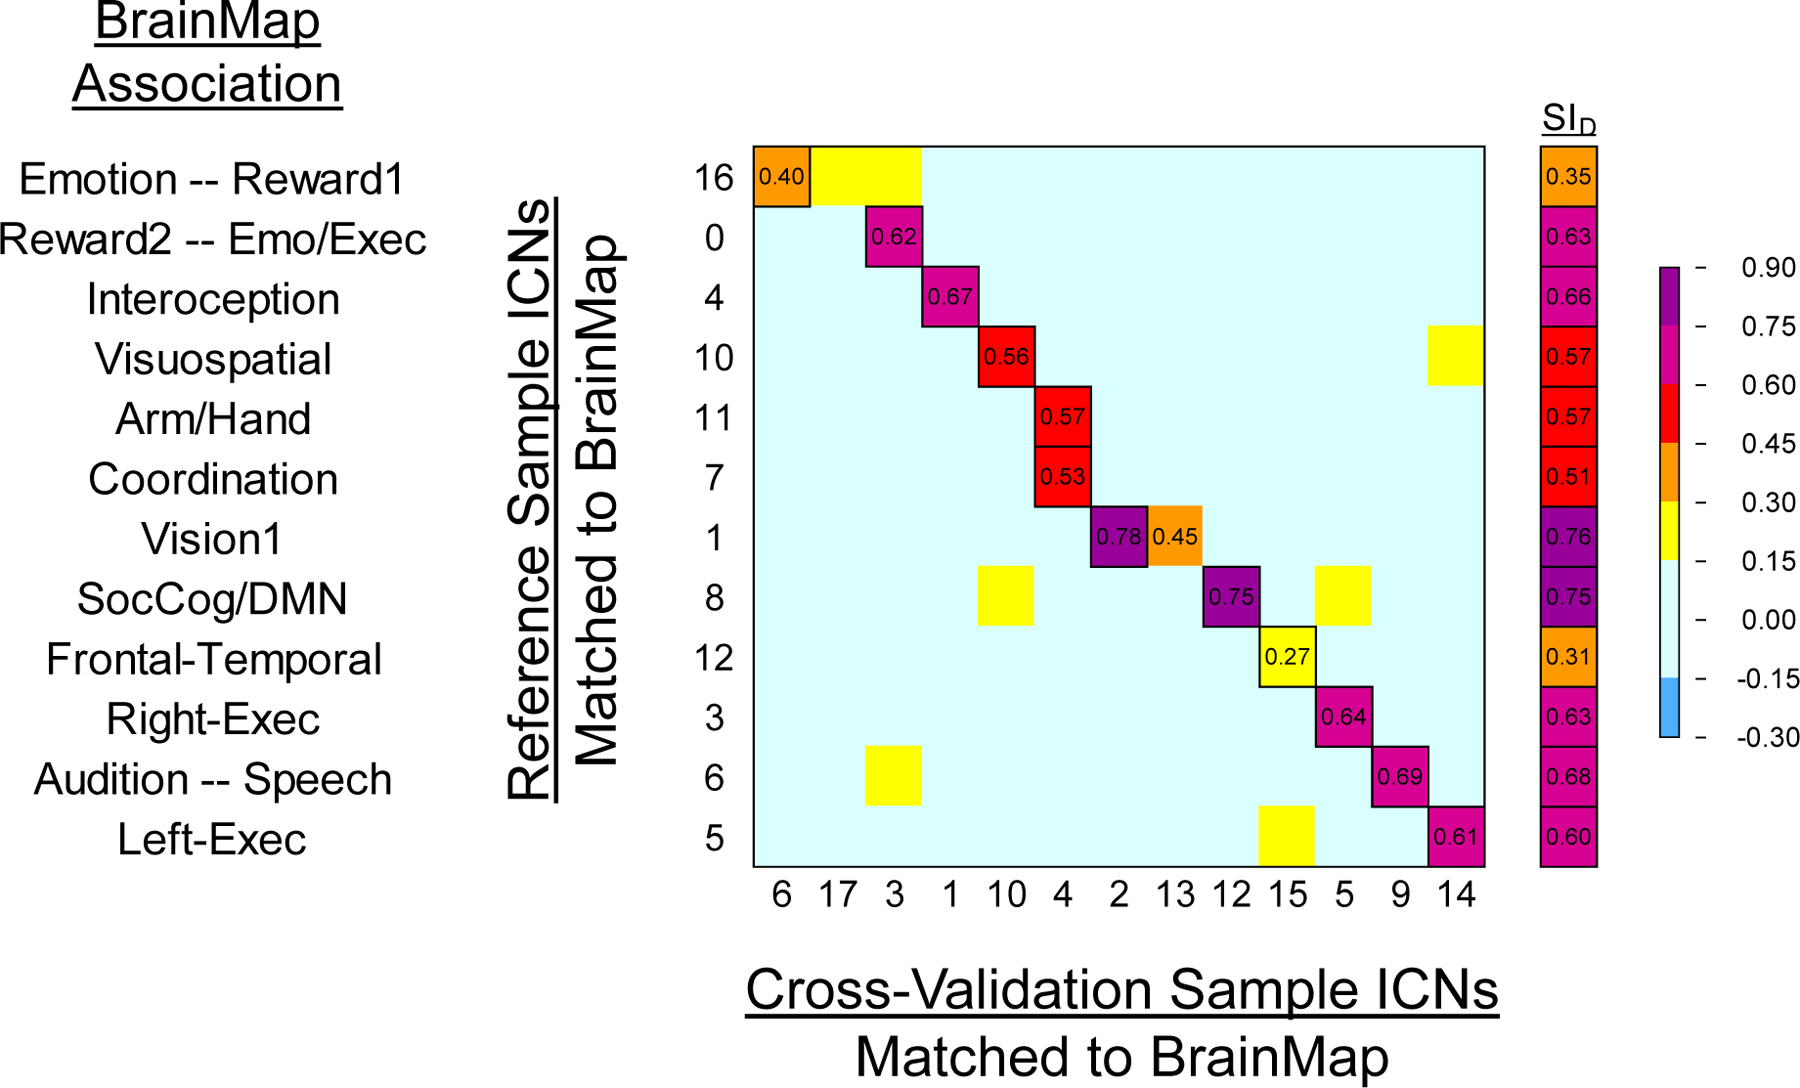
The meta-ICA procedure derived a total of 13 non-artifact ICNs from the Cross-Validation Sample data (7 ICNs were artifacts or clearly white matter components) which reflected 17 of the 18 non-artifact BrainMap (BM) networks (ρ ≥ 0.30 with any ICN) as some ICNs loaded on multiple BrainMap networks. The reward network was not well represented in this sample (ρ < 0.30 with BM03). Figure 7 shows the correlations and SID values between the BrainMap and Cross-Validation Sample networks. Across the 18 pairs of networks derived from the correlations, the mean SID was 0.46. Five of the 13 Cross-Validation Sample ICNs showed at least moderate correlations (ρ ≥ 0.50) with BrainMap networks. The greatest correspondence was observed for networks associated with vision (ρ=0.76 with BM 12), social cognition and the default-mode (ρ=0.54 with BM 13), and audition (ρ=0.53 with BM 16). The weakest correspondence was observed for the network associated with viewing complex images (ρ=0.36 with BM 10); this was a network which also showed low correspondence with BrainMap in the Reference Sample and Retest Sample. Although the magnitude of the relationships with BrainMap networks differed between the Reference Sample and the Cross-Validation Sample this change was generally within a small range, and again, the overall 1:1 or 1:2 correspondence with BrainMap networks remained. Axial slices of the non-artifact ICNs for the Cross-Validation Sample, including a frontal-temporal network and white matter component, are shown in Figure 4 alongside the matched BrainMap network.
Figure 7.
Heat map matrices comparing BrainMap meta-analytic networks (Laird et al., 2011) with the ICNs from the Cross-Validation Sample using Spearman’s correlation (13 non-artifact ICNs). To the right is the Dice Similarity Index for matched volumes; outlined cells indicate paired ICNs used in the Dice Similarity Index. See Figure 3A for comparison relationships between BrainMap and the Reference Sample.
3.5. Group-level replicability of ICNs: Reference & Cross-Validation data sets
Spearman’s correlations (ρ) and the Dice Similarity Index (SID) were calculated for ICNs from the Reference Sample and Cross-Validation Sample to examine group-level replicability of ICNs across independent data sets. Figure 8 shows the correlations and SID values between those ICNs. Across the 12 pairs of networks derived from the correlations, the mean SID was 0.59. Overall, the ICNs from the Cross-Validation Sample showed a high degree of correspondence with the Reference Sample, with most networks showing a 1:1 relationship across the data sets. Ten of the 12 Reference Sample ICNs showed at least moderate correlations (ρ ≥ 0.50) with Cross-Validation Sample ICNs; notably, of those 10, eight were ICNs which previously showed correlations ≥ 0.50 with Retest Sample ICNs. The greatest correspondence was observed for networks associated with vision (ρ=0.78), social cognition and the default mode (ρ=0.75), audition and speech (ρ=0.69), as well as interoception and autonomic functions (ρ=0.67). The Cross-Validation Sample ICNs that demonstrated the weakest relationship to Reference Sample ICNs included a network associated with emotion and reward (ρ=0.40) and the bilateral frontal-temporal network (ρ=0.27).
Figure 8.
Heat map matrices correlating Reference Sample ICNs with Cross-Validation Sample ICNs to indicate reproducibility using Spearman’s correlations across brain voxels for each ICN. To the right is the Dice Similarity Index for matched volumes from the two samples; outlined cells indicate paired ICNs used in the Dice Similarity Index. BrainMap domain labels on the y-axis were determined by the associations revealed by Reference Sample and BrainMap network correlations.
3.6. Intrinsic connectivity cores and correspondence
Voxel-level and network-level ICC statistics were recalculated using a second, and separately a third, set of masks referred to as the “connectivity cores” and “reliability cores” in order to investigate how their neurometrics compared to the full ICN masks (z ≥ 6) (see Table 2). Results from within-subject reliability analyses showed that the “connectivity cores” (≥75th percentile on voxel connectivity strength) increased the overall means of voxel- and network-level ICC statistics across the 12 ICNs by a modest + 0.04 and + 0.01, respectively, when compared to the same calculations using the full ICN mask. (The overall mean of mean voxel-level ICCs increased from 0.38 to 0.41; the overall mean of network-level ICCs increased from 0.42 to 0.43.) The statistical moments for the connectivity cores are provided in Supplementary Table 1 alongside those values for the full ICN. Unsurprisingly, the “reliability cores” ((≥75th percentile on voxel ICC) increased the overall means of voxel- and network-level ICC statistics across the 12 ICNs by + 0.22 and + 0.24, respectively, when compared to the same calculations using the full ICN mask. (The overall mean of mean voxel-level ICCs increased from 0.38 to 0.60; the overall mean of network-level ICCs increased from 0.42 to 0.65.) Critically, although the two thresholding techniques showed similar reductions in the number of voxels included in each ‘core’ mask, the increases in the ICCs as a result of the thresholding were substantially different (see Table 2). To illustrate the degree to which the connectivity cores and reliability cores overlapped for each Reference Sample ICN, a Dice Similarity Index (SID) was calculated. Overlay images of the corresponding constrained ICN masks and the resulting SID are shown in Figure 9. Overall the SID statistics across the 12 ICNs were low with an overall mean SID of 0.29 (range = 0.15 – 0.46).
Figure 9.
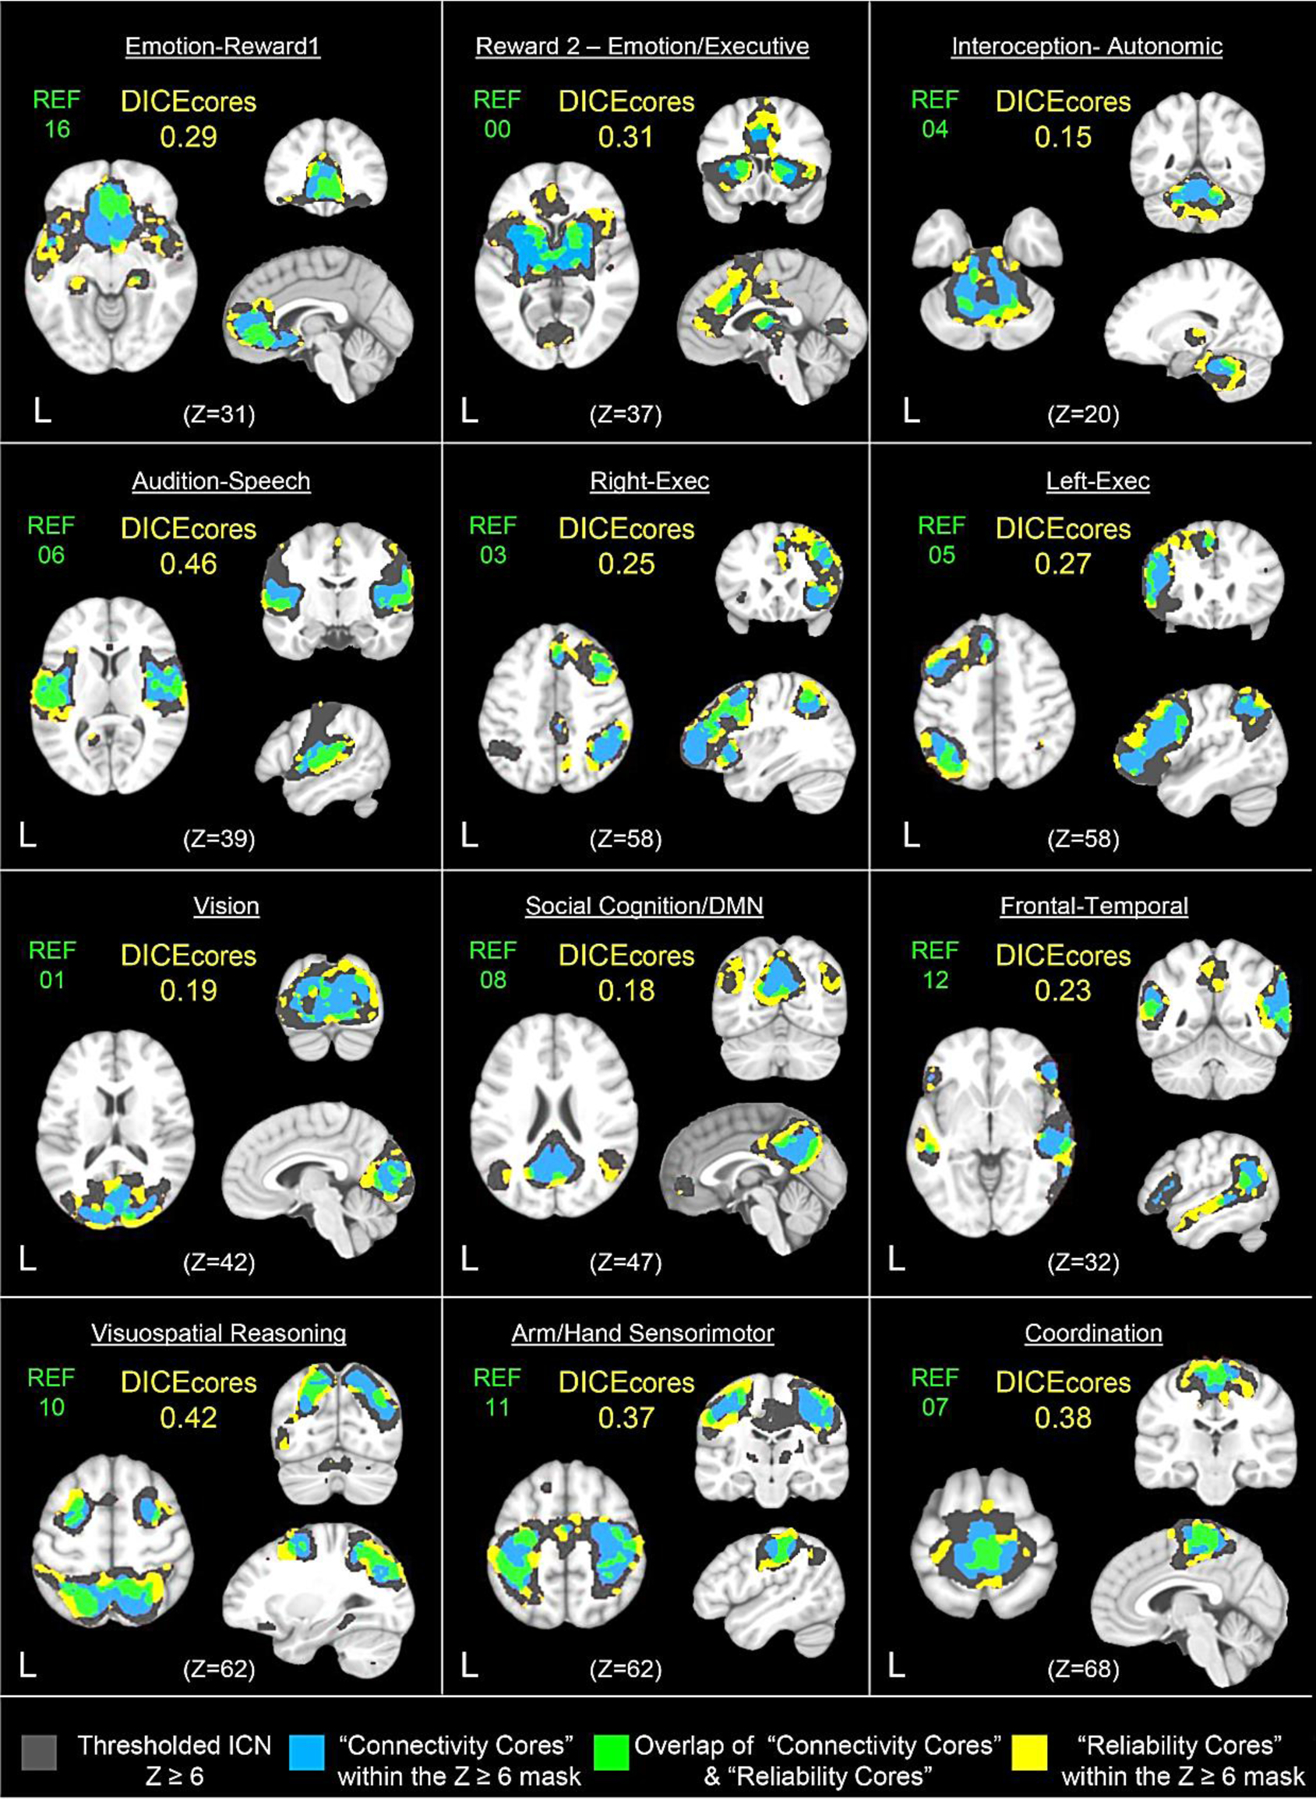
Comparison of brain maps including voxels of varying degrees of reliable resting-state connectivity for the Reference Sample meta-ICNs. Also shown is the extent of spatial overlap of the varying degrees of reliability maps, accompanied by the Dice Similarity Index which quantifies the degree of overlap between the connectivity cores and reliability cores, thus indicating the degree of shared voxels. Dark gray indicates the meta-ICN with connectivity thresholded at z ≥ 6; blue indicates the “connectivity cores” that are regions where connectivity values include only those above the 75th percentile within the z ≥ 6 mask; yellow indicates the “reliability cores” that are regions where the intraclass correlation coefficient are above the 75th percentile within the z ≥ 6 mask; green indicates the overlap or intersection of the connectivity cores with the reliability cores.
Discussion
Three resting-state data sets comprising 88 scans from 61 individuals demonstrated a robust and independent replication of Smith et al. (2009). The results showed 12 ICNs that had a 1:1 or 1:2 relationships with BrainMap’s descriptively and quantitatively enriched canonical, meta-analytic task-based maps (Laird et al., 2011). Of the 12 Reference Sample ICNs, all showed a stable and high degree of internal consistency, 10 demonstrated at least moderate (ρ ≥ 0.50) group-level reproducibility over time, and eight of those 10 additionally demonstrated at least moderate (ρ ≥ 0.50) group-level replicability across independent samples. In contrast, only four of those eight ICNs furthermore demonstrated at least fair within-subject reliability at both the voxel- and network-level (ICC ≥ 0.40), despite procedures to minimize subject-order induced bias. We also found that group-level reproducibility did not predict within-subject reliability, and that voxels with the highest connectivity strength within an ICN did not predict those with the highest reliability. These findings have immediate implications for study design, analysis and interpretation.
4.1. Correspondence to BrainMap meta-analyses
The present study closely replicates the methods and findings of Smith et al. (2009) and extends them to the more descriptively detailed and larger meta-analysis reported in Laird et al. (2011). Using this set of 18 networks from BrainMap, we found robust correspondence between 17 task-based networks and 12 to 15 ICNs across three sets of resting-state data. Using the meta-level ICA approach to generate unbiased networks, the ICN’s from each sample typically adhered to brain anatomy in homologous regions across hemispheres, and showed a consistently strong correspondence to BrainMap. A high correspondence to BrainMap was always observed for the network associated with processing of simple visual stimuli (“Vision3”), and low correspondence was always observed for the network associated with viewing complex images (“Vision1”). While empirical confirmation is beyond the scope of the current study, this may be because network responsible for processing simple visual stimuli is similarly configured during attentive rest due to optical stimulation even with eyes closed; whereas connectivity within higher visual cortical regions may be dependent on demands from complex stimuli. Each of the three samples also showed strong and consistent correspondence to BrainMap networks associated with left-executive functions (“Left-Exec”) and default-mode/social cognition functions (“SocCog/Default Mode”). As above, it may be that the language and memory network is similarly configured during attentive rest because the network is engaged in self-talk and retrieval of stored memories during that time. Likewise, the social cognition network may be similarly configured during attentive rest by virtue of these regions participating in the maintenance of one’s sense of self (Qin and Northoff, 2011). Additional data will be needed to clarify this point.
Consistent divergence from BrainMap was also observed as a merger of the interoception and autonomic networks, and a merger of the speech and audition networks in all three samples. The appearance of a bilateral frontal-temporal network showing only weak relationships to networks associated with default mode, executive functions, and audition functions also differed from BrainMap’s meta-structure and maps (Laird et al., 2011). Although finding a non-artifactual network lacking moderate correspondence to a BrainMap (ρ < 0.50) was unexpected, similar ICNs have been reported by other resting-state studies (Biswal et al., 2010; Zuo et al., 2010b); thus the lack of correspondence to BrainMap may be due to a low proportion of studies in that database which found this pattern of activation. Anatomical regions of this network suggest it may be associated with social-emotional judgments and self-referential tasks (Beer and Ochsner, 2006).
Although a number of ICNs showed generally consistent correspondence to BrainMap networks across samples, there were some differences with regard to which ICNs showed very strong or very weak relationships to BrainMap networks. For example, the visuomotor network was poorly represented in the Reference Sample, the audition network was poorly represented in the Retest Sample, and a reward network was poorly represented in the Cross-Validation Sample. This may be due to how ICNs can split or combine into related networks. Although speculative, such splitting may be influenced by state-based differences that cause instability in configurations across samples. For instance, it is possible participants from the two independent samples experienced similar degrees of anxiety during their initial scan. This may be reflected in their similar number of networks and manner of correspondence with BrainMap observed for the Reference Sample (12 ICNs) and the Cross-Validation Sample (13 ICNs). In contrast, scan anxiety may be reduced due to retest effects during the second scan and play a role in the modulated correspondence with BrainMap observed for the Retest Sample (15 ICNs).
4.2. Robustness, reproducibility, reliability, & replicability of ICNs
The present study tested the neurometrics of BrainMap-related ICNs across and within data sets to facilitate studies of brain-behavior relationships and individual differences in connectivity for purposes of external validation and theory development. First, the consistency of ICN configurations was improved when using the meta-ICA procedure compared to those produced by a single ICA. This illustrated the robustness of the meta-ICA procedure to starting conditions, and is in line with other robustness findings of ICA (Himberg et al., 2004; Yang et al., 2008; Ylipaavalniemi and Vigário, 2008; Ylipaavalniemi and Soppela, 2009; Zhang et al., 2010). Second, the internal consistency of within-ICN connectivity was excellent, with vision, coordination, and the default mode showing the highest values. This observation may be less than it appears, however, since the ICA procedure will, by design, extract internally consistent signals. Third, 10 of the 12 ICNs represented in the Reference Sample were moderately to highly reproducible over nine months; eight of those 10 ICNs additionally showed moderate to high group-level replicability in an independent sample, including networks associated with autonomic functions and interoception, vision, default mode, left-lateralized executive functions, right lateralized executive functions, audition and speech, visuospatial reasoning, and coordination. These networks have previously been reported in a number of studies on resting-state connectivity using ICA (Beckmann et al., 2005; Damoiseaux et al., 2006; Calhoun et al., 2008; Smith et al., 2009; Biswal et al., 2010; Littow et al., 2010; Zuo et al., 2010b), and thus appear to be ICNs which are consistently derived from resting-state fMRI data. Fourth, it is important to note, however, that only the latter four of these eight ICNs additionally showed at least ‘fair’ reliability at both the voxel- and network-level. Additionally, the two ICNs that showed moderate to high group-level reproducibility, but quite low replicability, also showed poor within-subject reliability; however, ICNs that showed at least fair or better within-subject reliability (ICC ≥ 0.40), also showed at least moderate reproducibility and replicability (ρ ≥ 0.50) across data sets. This highlights the importance of identifying ICNs with at least fair or better within-subject reliability over time.
Our estimates of reproducibility and reliability also converge with a number of other sources in the literature. In terms of reproducibility, task-based fMRI studies show an average activation overlap of 0.45 using SID (Bennett and Miller, 2010) and the current study showed majority of SID ≥ 0.50. In terms of reliability (using full ICN values), the voxel-level reliability (range ICCvox 0.24– 0.53) and network-level reliability (range ICCn 0.29 – 0.69) findings reported in the present study are consistent with the overall findings from previous resting-state reliability investigations covering a range of networks (Shehzad et al., 2009; Zuo et al., 2010b; Wang et al., 2011; Braun et al., 2012). They are also broadly consistent with task-based activation studies, which report voxel-wise ICCs> 0.4 (Eaton et al., 2008) or ICCs > 0.5 (Aron et al., 2006); additionally, a review of task-based fMRI studies indicated an average voxel-wise ICC of 0.50 (Bennett and Miller, 2010). Compared specifically to a previous report using MELODIC and dual regression on resting-state data (Zuo et al., 2010b),voxel-wise reliability statistics in the present study were lower (see Table 1 for full ICN median values). This difference may, however, be due to methodological differences: in the previous study three scanning sessions were used to generate the ICN templates, also the retest data set used twice the amount of data as the baseline (Zuo et al., 2010b). This study did not calculate network-level within-subject reliability statistics for comparison with the present findings.
Many analyses, however, do not use voxel-wise statistics to relate brain function to behavior or condition, but use summary scores for an identified region, such as a network-level score, for purposes of external validation. It was perhaps not surprising that the reliability of the network as a whole, that is the reliability of the average connectivity across voxels (ICCn), tended to be higher than the average reliability of each voxel’s connectivity (ICCvox) for most ICNs. However, it was surprising that network-level reliability was largely uncorrelated with voxel-level reliability, and that neither metric showed a systematic relationship with group-level reproducibility. This emphasized the need to examine reliability in several ways or, if only one, then the one most appropriate for the external validation, such as a summary score for an identified region. The overall reliability of the network-level connectivity score for these ICN’s appears to be on a par with other (non-fMRI) physiological connectivity measures collected at rest, such as magnetoencephalography (Deuker et al., 2009); however, it compares poorly to the psychometric properties of neuropsychological tests, personality, or psychopathology (Nuechterlein et al., 2008). These findings therefore anticipate challenges that will come when moving this literature beyond basic science questions, to questions wherein ICNs are applied to studies of individual differences, including cognitive abilities and clinical psychopathology.
One obstacle presented by the current findings is that within-subjects reliability cannot be inferred from group-level reproducibility. A second obstacle is that reliability has a direct impact on power required to observe an association, and therefore large differences in reliability affect the likelihood of observing effects of a similar magnitude across ICNs. False inferences can therefore occur because a network with lower reliability has a decreased likelihood of being associated with any other variable, relative to a more reliably measured ICN with the same “true” relationship to that variable. As others have also reported (Zuo et al., 2010b), executive networks had higher voxel-level ICCs whereas networks associated with interoception, reward, or emotion were among the lowest. Lower reliability of these ICN’s could be related to reduced variance due to floor or ceiling effects in ICN metrics, degraded signal integrity in the associated regions, or greater dependence on the participant’s current state. We addressed the first possibility by calculating ICN internal consistency (Figure 5), and by examining the ICN’s mean signal, variance, skew, and kurtosis using the network-level connectivity scores (Supplementary Table 1). These statistics did not appear to have a systematic relationship to ICCs. With regard to signal integrity, one advantage of ICA is its capacity to isolate source signals based on signal coherence, thereby reducing the likelihood that differences in ICCs across ICNs were due to differences in noise level relative to signal coherence. Thus differences in state across sessions are likely to be an important source of variance in within-subject reliability. This question will benefit from further study as it has important implications for the sample sizes required to see relationships between individual differences in behavior and connectivity for executive control ICNs, relative to ICNs associated with interoceptive, reward, and emotional processes, and pursuant risk of false negative findings in the latter cases.
4.3. Additional neurometric observations.
There are additional observations about the nature ICN’s worthy of note. In the present study, unexpected contrasts were observed regarding the overall reliability of ICNs when using full ICNs compared to when using the connectivity cores or reliability cores. We observed that metrics derived using connectivity cores, compared to using full ICNs, provided little or no improvement in the ICCs for voxel or network-level metrics, and that there was a stark disunion between the spatial characteristics of the connectivity cores and reliability cores for most ICNs. Albeit, this is not the first instance in which regions of high voxel strength were low in reliability; a few task-based fMRI studies demonstrated that highly significant voxels in an image contrast are not necessarily those with the highest reliability (Caceres et al., 2009; Bennett and Miller, 2010). This suggests that if a region does not have intrinsically reliable connectivity, very high signal at one time point may be ephemeral, and simply be due to state-based effects or chance; thus, the measurement would be subject to regression to the mean effects at subsequent time points. This is an important observation to note, given some analyses attribute greater importance to voxels or regions demonstrating the highest significance.
Considering now the specific reliability profiles for the different ICNs, it was observed that in most cases the network-level ICC was higher than the voxel-level ICC using the full ICN masks. ICNs which did not show this pattern included those associated with left-executive functions, default-mode processes/social cognition, and vision (Table 2). This decreased reliability at the network-level is most striking for the left-executive, as it is often compared to the highly reliable right-executive. As shown in Figure 9, for the left-executive, default-mode, and vision ICNs, the most reliable voxels (identified by the reliability cores) appeared to be located on the periphery of the network rather than centrally located. In contrast, for the four ICNs showing at least fair reliability on both ICC metrics (visuospatial, coordination, right-executive, and audition/speech) the most reliable voxels appear to be in central or hub-like locations of the ICN. Based on this observation it is possible that central hub-like voxel clusters may help to synchronize, coordinate, or stabilize voxel connectivity throughout the larger extent of the network (Sporns et al., 2007), leading to more homogenous connectivity across voxels, and a more reliable network-level summary score (given constant demands). This is an interesting observation and illustrates how metric properties can change based on the way a measurement is derived, underscoring the need to assess metric reliability before application in studies of individual differences. It also provides insight into the network characteristics which may be a function of the number of components (dimensionality); it is possible that at a higher dimensionality, the vision, default-mode, and left-executive ICNs split into sub-networks which include hub-like regions. Although this question is not within the scope of the present paper, it is an important question that should be examined in future studies.
The behavioral characterization of BrainMap networks, provided by Laird et al. (2011), can also inform theses neurometric findings. Some ICN’s were highly reproducible and replicable across samples, and highly reliable within individuals. This is consistent with the profile of a trait; a robust signal is engaged in a way that is systematically reliable within and across individuals over time. One example is the right-executive ICN associated with attention, inhibition, working-memory, and reasoning demands which have shown reliable individual differences behaviorally and with neuroimaging tasks (Manoach et al., 2001; Hockey and Geffen, 2004). Engagement of this ICN during a resting scan is likely to occur as individuals focus on resisting the urge to become active, and are otherwise engaged in monitoring themselves and the environment. Other ICNs with this neurometric profile, and likely involved in monitoring, include auditory/speech ICN (attending to sounds), as well as the visuospatial and coordination ICNs (attending to position and orientation of body in space). In contrast, the left-executive ICN demonstrated high reproducibility and replicability, but low reliability within individuals at the network-level. This profile is suggestive of a system that is “always on”, but where individual variability may be less systematic over time. Although this ICN shares behavioral relations to the right-executive, it is also associated with explicit memory, covert reading, and language skills; thus, it’s possible that connectivity during rest could change based on the degree of self-talk or memory retrieval an individual entertains. ICNs associated with emotion, reward, and interoceptive processes also showed low reliability. Based on BrainMap descriptors, and as discussed earlier in this report, the neurometric profile of these ICNs may be influenced by participant’s current state.
Taken together, the above total combination of neurometric findings in the present study is encouraging, yet also humbling. The ICN which demonstrated the most robust reliability regardless of the manner of measurement appeared to be the right-executive network. Other ICNs that showed consistently strong reliability included the visuospatial and coordination ICNs; whereas, others showed more variable reliability across the different metrics. It will be important to continue assessing neurometrics in multiple ways and aim to optimize connectivity measurements, while also viewing previous association findings with appropriate skepticism until they are replicated and the properties of the metrics are better understood. Over the past ten years a number of associations between different resting-state connectivity networks and cognitive functioning, personality, and measures of psychopathology have been reported, but few studies considered the neurometrics of the measurements underlying their association tests. As such, there is room for improvement in the field regarding concern for robustness, replicability, reproducibility, and reliability of both methods and findings. That being said, further examination, development, and ongoing refinement of ICN neurometrics are needed to improve the metrics, as scanning sequences continue to be developed and as ICNs become employed in clinical contexts; both paths are necessary and neither is likely to be sufficient. It is possible that longer scanning sessions may improve long-term reliability estimates for ICNs. Currently there is some evidence that longer scans will not yield a significant improvement (Van Dijk et al., 2010), but this has not be tested for a wide range of networks or scan durations, and thus further evaluation is warranted. It is also possible that connectivity metrics derived from data collected during task conditions may be more reliable due to the response of ICNs to controlled external stimulation (Deuker et al., 2009), albeit such metrics may represent modulated versions of the ICNs observed at rest.
4.4. Limitations and future directions
Although the present study provided much needed replication and extension regarding ICNs, there are three limitations which should be considered. First, the analysis and findings are constrained by the design. To replicate and bear relevance to most previous work, the MELODICs were set to extract 20 ICNs each, rather than 50, 70, or 100. It is possible that reliability metrics could change based on the dimensionality that is chosen. This is a particularly relevant given repeatability of the ICNs seems to be affected by dimensionality (Abou-Elseoud et al., 2010) which has clear implications for reliability (Zhao et al., 2004) and may interact with other factors in the meta-ICA. Also only metrics measuring connectivity within an ICN were investigated; neurometrics of measures indicating connectivity between ICNs should also be investigated. Additionally, the type of data used to derive the BrainMap task-based ICNs was fundamentally different from the resting-state data, as the former were peak coordinates from reported brain activations (contrast images). Further verification regarding the correspondence of rest and task-based connectivity networks would be obtained by completing the same analysis on both types of raw fMRI data (Calhoun et al., 2008), and comparing this for multiple tasks. Second, although the current study demonstrated a method to identify reliable voxels, it used a circular method that required at least two time points of data which is uncommon; therefore, the problem remains and a method is needed to determine reliable voxels from a single scan. Third, the functional interpretation of resting-state ICNs remains preliminary until behavioral measures related to the BrainMap networks are actually tested for associations with ICN metrics. For these brain-behavior relationships to be valid the associations must be reliable and reproducible within, and across subjects, respectively. This latter point is particularly relevant given the prospect for ICNs to be used as predictive tools for diagnosing brain disorders including Alzheimer’s disease and schizophrenia (Greicius et al., 2004; Sorg et al., 2007, 2009; Zhu et al., 2008; Demirci et al., 2008; Greicius, 2008; Sui et al., 2009; Arribas et al., 2010; Shen et al., 2010; Chen et al., 2011; Xie et al., 2011).
4.5. Conclusions
In the current study, we present key replications and convergent findings which provide new evidence of the utility of ICNs for understanding brain functioning. We showed ICNs derived from resting-state data included a large proportion of grey matter, shared a number of characteristics with task-based brain networks, and were consistently reproduced across data sets. These findings provide additional evidence in support of the hypothesis that ICNs are the fundamental architecture of the brain (Smith et al., 2009; Biswal et al., 2010; Deco and Corbetta, 2011). We also demonstrated that ICNs are, overall, fairly reliable in individuals over time; however, there is a range of neurometrics associated with different networks, with findings indicating that executive and reasoning related networks were more reliable than emotion and reward related networks. The observed range of reproducibility and reliability, as well as variation across metrics, have strong implications for how we interpret the validity and strength of our findings given how reliability influences the power to find large or small effects. As such, one should have in mind an appropriate level of skepticism for previous association findings until they are replicated or the measurement properties are evaluated. In turn, neurometrics, are a necessary compliment to external validation and convergence of findings; none are solely sufficient. These findings suggest a need for further examination and optimization of intrinsic connectivity neurometrics and greater consideration of neurometrics in studies of group and individual differences.
Supplementary Material
Supplemental Figure 1. The meta-ICA approach compared to the typical approach of completing a single using three different methods 1) “Single ICAs” = 50 single (typical) group-levels ICAs, 2) “Random Order Metas” = 50 meta-ICAs each completed on randomly concatenated results from 50 different single ICAs, 3) “Random Order & Selection Metas” = 50 meta-ICAs each completed on the randomly concatenated results from 50 single ICAs randomly selected from a total of 100 different single ICAs. The mean Dice Similarity Index across the 50 ICAs, with respect to each of the Reference Sample meta-level ICNs, was calculated for each of the three methods for testing ICN generation consistency. See Figure 3 or Figure 4 for the Reference Sample (REF) ICN labels based on relationship to BrainMap networks.
Supplemental Figure 2. Representations of the 12 non-artifact Reference Sample ICNs. A) Combined mask of the 12 ICNs (thresholded at z ≥ 6) in blue, probabilistic gray matter mask (thresholded at 0.30) in yellow, intersection of the combined 12 ICN mask and the gray matter probabilistic mask in green. B) Slices of the 12 ICNs discriminated into nine broad domains based on correlations with BrainMap networks; represented by nine colors, red = left and right executive networks, dark blue = default mode network, light blue = frontal-temporal network, pink = emotion and reward networks, magenta = audition/speech network, dark green = coordination and arm/hand sensorimotor networks, yellow = vision network, orange = visuospatial reasoning network, beige = autonomic/interoception network. A probabilistic gray matter image from the FSL library was thresholded at 75 and binarized to generate a 0.3 probability mask. The intersection of the thresholded probability mask and the combined ICN mask was computed and the number of non-zero voxels was calculated for the three images. The combined 12 ICN mask included 165149 voxels and the probabilistic gray matter mask included 200874 voxels; the intersection and thus overlap of the two masks encompassed 14560 voxels. This resulted in an overlap of 88% with gray matter brain voxels.
Acknowledgments
We are grateful to Andrew Poppe for optimizing and improving the code implemented during the analyses, and to Chris Bell for his time and efforts involved in the data collection. We are also grateful for the computing resources as well as technical support from the University of Minnesota Supercomputing Institute, and the neuroimaging resources and technical support from the Center for Magnetic Resonance Research at the University of Minnesota. We are further grateful for the analytical insight provided by Angela R. Laird, Christian F. Beckmann, and Stephen M. Smith. Data collection was possible thanks to the financial support of the NIMH grant R01MH060662 and the NIDA grant P20DA024196. A.W.M. was additionally supported by the NIMH grant R01MH084861 and R21MH079262 during the course of this research; K.M.W. was supported by the NIMH Training Grant 5T32MH017069-29. Parts of this manuscript were previously presented at the 2012 annual meeting for the Cognitive Neuroscience Society and were included in the master’s thesis completed by K.M.W in April of 2012.
References
- Abou-Elseoud A, Starck T, Remes J, Nikkinen J, Tervonen O, Kiviniemi V (2010) The effect of model order selection in group PICA. Human brain mapping 31:1207–1216 Available at: http://www.ncbi.nlm.nih.gov/pubmed/20063361 [Accessed March 8, 2012]. [DOI] [PMC free article] [PubMed] [Google Scholar]
- Adelstein J, Shehzad Z, Mennes M (2011) Personality Is Reflected in the Brain’s Intrinsic Functional Architecture. PloS one 6:e27633 Available at: http://dx.plos.org/10.1371/journal.pone.0027633 [Accessed August 29, 2012]. [DOI] [PMC free article] [PubMed] [Google Scholar]
- Andersson J, Smith S, Jenkinson M (2008) FNIRT-FMRIB’s non-linear image registration tool. In: 14th Annual Meeting of the Organization for Human Brain Mapping. [Google Scholar]
- Aron AR, Gluck M a, Poldrack R a (2006) Long-term test-retest reliability of functional MRI in a classification learning task. NeuroImage 29:1000–1006 Available at: http://www.pubmedcentral.nih.gov/articlerender.fcgi?artid=1630684&tool=pmcentrez&rendertype=abstract [Accessed March 18, 2012]. [DOI] [PMC free article] [PubMed] [Google Scholar]
- Arribas JI, Calhoun VD, Adali T (2010) Automatic Bayesian classification of healthy controls, bipolar disorder, and schizophrenia using intrinsic connectivity maps from FMRI data. IEEE Trans Biomed Eng 57:2850–2860 Available at: http://www.pubmedcentral.nih.gov/articlerender.fcgi?artid=2982883&tool=pmcentrez&rendertype=abstract. [DOI] [PMC free article] [PubMed] [Google Scholar]
- Beckmann CF, DeLuca M, Devlin JT, Smith SM (2005) Investigations into resting-state connectivity using independent component analysis. Philos Trans R Soc Lond B Biol Sci 360:1001–1013 Available at: http://www.pubmedcentral.nih.gov/articlerender.fcgi?artid=1854918&tool=pmcentrez&rendertype=abstract [Accessed March 1, 2012]. [DOI] [PMC free article] [PubMed] [Google Scholar]
- Beckmann CF, Mackay CE, Filippini N, Smith SM (2009) Group comparison of resting-state FMRI data using multi-subject ICA and dual regression. In: Organization of Human Brain Mapping Annual Meeting. [Google Scholar]
- Beckmann CF, Smith SM (2004) Probabilistic Independent Component Analysis for Functional Magnetic Resonance Imaging. IEEE Trans Med Imaging 23:137–152. [DOI] [PubMed] [Google Scholar]
- Beer JS, Ochsner KN (2006) Social cognition: a multi level analysis. Brain Res 1079:98–105 Available at: http://www.ncbi.nlm.nih.gov/pubmed/16513097 [Accessed March 14, 2012]. [DOI] [PubMed] [Google Scholar]
- Bennett CM, Miller MB (2010) How reliable are the results from functional magnetic resonance imaging? Ann N Y Acad Sci 1191:133–155 Available at: http://www.ncbi.nlm.nih.gov/pubmed/20392279 [Accessed March 12, 2012]. [DOI] [PubMed] [Google Scholar]
- Biswal B et al. (2010) Toward discovery science of human brain function. Proc Natl Acad Sci U S A 107:4734–4739 Available at: http://www.pubmedcentral.nih.gov/articlerender.fcgi?artid=2842060&tool=pmcentrez&rendertype=abstract [Accessed March 2, 2012]. [DOI] [PMC free article] [PubMed] [Google Scholar]
- Biswal B, Van Kylen J, Hyde JS (1997) Simultaneous assessment of flow and BOLD signals in resting-state functional connectivity maps. NMR Biomed 10:165–170 Available at: http://www.ncbi.nlm.nih.gov/pubmed/9430343. [DOI] [PubMed] [Google Scholar]
- Biswal B, Yetkin FZ, Haughton VM, Hyde JS (1995) Functional connectivity in the motor cortex of resting human brain using echo-planar MRI. Magn Reson Med 34:537–541. [DOI] [PubMed] [Google Scholar]
- Braun U, Plichta MM, Esslinger C, Sauer C, Haddad L, Grimm O, Mier D, Mohnke S, Heinz A, Erk S, Walter H, Seiferth N, Kirsch P, Meyer-Lindenberg A (2012) Test-retest reliability of resting-state connectivity network characteristics using fMRI and graph theoretical measures. NeuroImage 59:1404–1412 Available at: http://www.ncbi.nlm.nih.gov/pubmed/21888983 [Accessed March 8, 2012]. [DOI] [PubMed] [Google Scholar]
- Caceres A, Hall DL, Zelaya FO, Williams SCR, Mehta M a (2009) Measuring fMRI reliability with the intra-class correlation coefficient. NeuroImage 45:758–768 Available at: http://www.ncbi.nlm.nih.gov/pubmed/19166942 [Accessed March 20, 2012]. [DOI] [PubMed] [Google Scholar]
- Calhoun VD, Kiehl K a, Pearlson GD (2008) Modulation of temporally coherent brain networks estimated using ICA at rest and during cognitive tasks. Hum Brain Mapp 29:828–838 Available at: http://www.pubmedcentral.nih.gov/articlerender.fcgi?artid=2649823&tool=pmcentrez&rendertype=abstract [Accessed July 24, 2012]. [DOI] [PMC free article] [PubMed] [Google Scholar]
- Camchong J, MacDonald AW, Bell C, Mueller BA, Lim KO (2011a) Altered functional and anatomical connectivity in schizophrenia. Schizophr Bull 37:640–650 Available at: http://www.hubmed.org/display.cgi?uids=19920062. [DOI] [PMC free article] [PubMed] [Google Scholar]
- Camchong J, MacDonald AW, Nelson B, Bell C, Mueller B a, Specker S, Lim KO (2011b) Frontal hyperconnectivity related to discounting and reversal learning in cocaine subjects. Biol Psychiatry 69:1117–1123. [DOI] [PMC free article] [PubMed] [Google Scholar]
- Carter CS, Barch DM, CNTRICS Executive Committee (2012) Imaging biomarkers for treatment development for impaired cognition: report of the sixth CNTRICS meeting: Biomarkers recommended for further development. Schizophrenia bulletin 38:26–33 Available at: http://www.ncbi.nlm.nih.gov/pubmed/21914642 [Accessed December 3, 2012]. [DOI] [PMC free article] [PubMed] [Google Scholar]
- Chai XJ, Whitfield-Gabrieli S, Shinn AK, Gabrieli JDE, Nieto Castañón A, McCarthy JM, Cohen BM, Ongür D (2011) Abnormal Medial Prefrontal Cortex Resting-State Connectivity in Bipolar Disorder and Schizophrenia. Neuropsychopharmacology 36:2009–2017 Available at: http://www.ncbi.nlm.nih.gov/pubmed/21654735 [Accessed August 11, 2011]. [DOI] [PMC free article] [PubMed] [Google Scholar]
- Chen G, Ward BD, Xie C, Li W, Wu Z, Jones JL, Franczak M, Antuono P, Li S-J (2011) Classifi cation of Alzheimer Disease, Mild Cognitive Impairment, and Normal Cognitive Status with Large-Scale Network Analysis Based on Resting-State Functional MR Imaging. Radiology 259:213–221. [DOI] [PMC free article] [PubMed] [Google Scholar]
- Chou Y-H, Panych LP, Dickey CC, Petrella JR, Chen N-K (2012) Investigation of Long-Term Reproducibility of Intrinsic Connectivity Network Mapping: A Resting-State fMRI Study. Am J Neuroradiol 33:833–838 Available at: http://www.ncbi.nlm.nih.gov/pubmed/22268094. [DOI] [PMC free article] [PubMed] [Google Scholar]
- Cicchetti DV, Sparrow SA (1981) Developing criteria for establishing interrater reliability of specific items: applications to assessment of adaptive behavior. Am J Ment Defic 86:127–137 Available at: http://www.ncbi.nlm.nih.gov/pubmed/7315877. [PubMed] [Google Scholar]
- Damoiseaux JS, Rombouts SARB, Barkhof F, Scheltens P, Stam CJ, Smith SM, Beckmann CF (2006) Consistent resting-state networks. Proc Natl Acad Sci U S A 103:13848–13853. [DOI] [PMC free article] [PubMed] [Google Scholar]
- Deco G, Corbetta M (2011) The dynamical balance of the brain at rest. Neuroscientist 17:107–123 Available at: http://www.ncbi.nlm.nih.gov/pubmed/21196530 [Accessed March 8, 2012]. [DOI] [PMC free article] [PubMed] [Google Scholar]
- Deco G, Jirsa V, McIntosh R, Sporns O, Kötter R (2009) Key role of coupling, delay, and noise in resting brain fluctuations. Proc Natl Acad Sci U S A 106:10302–10307 Available at: http://www.pubmedcentral.nih.gov/articlerender.fcgi?artid=2690605&tool=pmcentrez&rendertype=abstract. [DOI] [PMC free article] [PubMed] [Google Scholar]
- Demirci O, Clark VP, Calhoun VD (2008) A projection pursuit algorithm to classify individuals using fMRI data: Application to schizophrenia. NeuroImage 39:1774–1782 Available at: http://linkinghub.elsevier.com/retrieve/pii/S1053811907009469 [Accessed March 19, 2012]. [DOI] [PMC free article] [PubMed] [Google Scholar]
- Deuker L, Bullmore ET, Smith M, Christensen S, Nathan PJ, Rockstroh B, Bassett DS (2009) Reproducibility of graph metrics of human brain functional networks. NeuroImage 47:1460–1468 Available at: http://www.ncbi.nlm.nih.gov/pubmed/19463959 [Accessed August 1, 2012]. [DOI] [PubMed] [Google Scholar]
- Dice L (1945) Measures of the Amount of Ecologic Association Between Species. Ecology 26:297–302. [Google Scholar]
- Doria V, Beckmann CF, Arichi T, Merchant N, Groppo M, Turkheimer FE, Counsell SJ, Murgasova M, Aljabar P, Nunes RG, Larkman DJ, Rees G, Edwards a D (2010) Emergence of resting state networks in the preterm human brain. Proc Natl Acad Sci U S A 107:20015–20020. [DOI] [PMC free article] [PubMed] [Google Scholar]
- Eaton KP, Szaflarski JP, Altaye M, Ball AL, Kissela BM, Banks C, Holland SK (2008) Reliability of fMRI for studies of language in post-stroke aphasia subjects. NeuroImage 41:311–322 Available at: http://www.pubmedcentral.nih.gov/articlerender.fcgi?artid=2474692&tool=pmcentrez&rendertype=abstract [Accessed March 2, 2012]. [DOI] [PMC free article] [PubMed] [Google Scholar]
- Filippini N, MacIntosh BJ, Hough MG, Goodwin GM, Frisoni GB, Smith SM, Matthews PM, Beckmann CF, Mackay CE (2009) Distinct patterns of brain activity in young carriers of the APOE-epsilon4 allele. Proc Natl Acad Sci U S A 106:7209–7214 Available at: http://www.ncbi.nlm.nih.gov/pubmed/19357304. [DOI] [PMC free article] [PubMed] [Google Scholar]
- Greicius MD (2008) Resting-state functional connectivity in neuropsychiatric disorders. Curr Opin Neurol 21:424–430 Available at: http://www.ncbi.nlm.nih.gov/pubmed/18607202. [DOI] [PubMed] [Google Scholar]
- Greicius MD, Srivastava G, Reiss AL, Menon V (2004) Default-mode network activity distinguishes Alzheimer ‘ s disease from healthy aging : Evidence from functional MRI. Proc Natl Acad Sci U S A 101:4637–4642. [DOI] [PMC free article] [PubMed] [Google Scholar]
- Guo CC, Kurth F, Zhou J, Mayer E a, Eickhoff SB, Kramer JH, Seeley WW (2012) One-year test-retest reliability of intrinsic connectivity network fMRI in older adults. NeuroImage 61:1471–1483. [DOI] [PMC free article] [PubMed] [Google Scholar]
- Hampson M, Driesen NR, Skudlarski P, Gore JC, Constable RT (2006) Brain connectivity related to working memory performance. J Neurosci 26:13338–13343. [DOI] [PMC free article] [PubMed] [Google Scholar]
- Himberg J, Hyvärinen A, Esposito F (2004) Validating the independent components of neuroimaging time series via clustering and visualization. NeuroImage 22:1214–1222 Available at: http://www.ncbi.nlm.nih.gov/pubmed/15219593 [Accessed November 8, 2012]. [DOI] [PubMed] [Google Scholar]
- Hockey A, Geffen G (2004) The concurrent validity and test?retest reliability of a visuospatial working memory task. Intelligence 32:591–605 Available at: http://linkinghub.elsevier.com/retrieve/pii/S016028960400073X [Accessed November 24, 2012]. [Google Scholar]
- Jenkinson M, Bannister P, Brady M, Smith S (2002) Improved Optimization for the Robust and Accurate Linear Registration and Motion Correction of Brain Images. NeuroImage 17:825–841 Available at: http://linkinghub.elsevier.com/retrieve/pii/S1053811902911328 [Accessed March 13, 2012]. [DOI] [PubMed] [Google Scholar]
- Jeong B, Choi J, Kim J-W (2012) MRI study on the functional and spatial consistency of resting state-related independent components of the brain network. Korean J Radiol 13:265–274 Available at: http://www.pubmedcentral.nih.gov/articlerender.fcgi?artid=3337862&tool=pmcentrez&rendertype=abstract. [DOI] [PMC free article] [PubMed] [Google Scholar]
- Kelly CA, Uddin LQ, Biswal BB, Castellanos FX, Milham MP (2008) Competition between functional brain networks mediates behavioral variability. NeuroImage 39:527–537. [DOI] [PubMed] [Google Scholar]
- Kelly RE, Alexopoulos GS, Wang Z, Gunning FM, Murphy CF, Morimoto SS, Kanellopoulos D, Jia Z, Lim KO, Hoptman MJ (2010) Visual inspection of independent components: defining a procedure for artifact removal from fMRI data. J Neurosci Methods 189:233–245. [DOI] [PMC free article] [PubMed] [Google Scholar]
- Kiviniemi V, Kantola J-H, Jauhiainen J, Hyvärinen A, Tervonen O (2003) Independent component analysis of nondeterministic fMRI signal sources. NeuroImage 19:253–260. [DOI] [PubMed] [Google Scholar]
- Kunisato Y, Okamoto Y, Okada G, Aoyama S, Nishiyama Y, Onoda K, Yamawaki S (2011) Personality traits and the amplitude of spontaneous low-frequency oscillations during resting state. Neurosci Lett 492:109–113. [DOI] [PubMed] [Google Scholar]
- Laird AR, Fox PM, Eickhoff SB, Turner JA, Ray KL, McKay DR, Glahn DC, Beckmann CF, Smith SM, Fox PT (2011) Behavioral Interpretations of Intrinsic Connectivity Networks. J Cogn Neurosci 23:4022–4037 Available at: http://www.hubmed.org/display.cgi?uids=21671731. [DOI] [PMC free article] [PubMed] [Google Scholar]
- Littow H, Elseoud AA, Haapea M, Isohanni M, Moilanen I, Mankinen K, Nikkinen J, Rahko J, Rantala H, Remes J, Starck T, Tervonen O, Veijola J, Beckmann C, Kiviniemi VJ (2010) Age-Related Differences in Functional Nodes of the Brain Cortex - A High Model Order Group ICA Study. Front Syst Neurosci 4:1–11 Available at: http://www.pubmedcentral.nih.gov/articlerender.fcgi?artid=2955419&tool=pmcentrez&rendertype=abstract [Accessed March 19, 2012]. [DOI] [PMC free article] [PubMed] [Google Scholar]
- Ma N, Liu Y, Li N, Wang C-X, Zhang H, Jiang X-F, Xu H-S, Fu X-M, Hu X, Zhang D-R (2010) Addiction related alteration in resting-state brain connectivity. NeuroImage 49:738–744 Available at: http://www.pubmedcentral.nih.gov/articlerender.fcgi?artid=2764798&tool=pmcentrez&rendertype=abstract [Accessed March 5, 2012]. [DOI] [PMC free article] [PubMed] [Google Scholar]
- Manoach DS, Halpern EF, Kramer TS, Chang Y, Goff DC, Rauch SL, Kennedy DN, Gollub RL (2001) Test-retest reliability of a functional MRI working memory paradigm in normal and schizophrenic subjects. The American journal of psychiatry 158:955–958 Available at: http://www.ncbi.nlm.nih.gov/pubmed/11384907. [DOI] [PubMed] [Google Scholar]
- Margulies DS, Vincent JL, Kelly C, Lohmann G, Uddin LQ, Biswal BB, Villringer A, Castellanos FX, Milham MP, Petrides M (2009) Precuneus shares intrinsic functional architecture in humans and monkeys. Proc Natl Acad Sci U S A 106:20069–20074 Available at: http://www.pubmedcentral.nih.gov/articlerender.fcgi?artid=2775700&tool=pmcentrez&rendertype=abstract. [DOI] [PMC free article] [PubMed] [Google Scholar]
- McKeown MJ, Sejnowski TJ (1998) Independent component analysis of fMRI data: examining the assumptions. Hum Brain Mapp 6:368–372 Available at: http://www.ncbi.nlm.nih.gov/pubmed/9788074. [DOI] [PMC free article] [PubMed] [Google Scholar]
- Meehl PE (1986) Diagnostic Taxa as Open Concepts: Metatheoretical and Statistical Questions about Reliability and Construct Validity in the Grand Strategy of Nosological Revision. In: Contemporary directions in Psychopathology (Millon T, Klerman GL, eds), pp 215–231. Guilford. Available at: http://psycnet.apa.org/psycinfo/1986-98140-010. [Google Scholar]
- Meindl T, Teipel S, Elmouden R, Mueller S, Koch W, Dietrich O, Coates U, Reiser M, Glaser C (2010) Test-retest reproducibility of the default-mode network in healthy individuals. Hum Brain Mapp 31:237–246 Available at: http://www.ncbi.nlm.nih.gov/pubmed/19621371 [Accessed July 14, 2012]. [DOI] [PMC free article] [PubMed] [Google Scholar]
- Nuechterlein KH et al. (2008) The Matrics Consensus Cognitive Battery, Part 1: Test Selection, Reliability, and Validity. Am J Psychiatry 165:203–213. [DOI] [PubMed] [Google Scholar]
- Qin P, Northoff G (2011) How is our self related to midline regions and the default-mode network? NeuroImage 57:1221–1233 Available at: http://www.ncbi.nlm.nih.gov/pubmed/21609772 [Accessed November 13, 2012]. [DOI] [PubMed] [Google Scholar]
- Repovs G, Csernansky JG, Barch DM (2011) Brain network connectivity in individuals with schizophrenia and their siblings. Biol Psychiatry 69:967–973 Available at: http://www.pubmedcentral.nih.gov/articlerender.fcgi?artid=3081915&tool=pmcentrez&rendertype=abstract [Accessed March 8, 2012]. [DOI] [PMC free article] [PubMed] [Google Scholar]
- Shapiro SS, Wilk MB (1965) An Analysis of Variance Test for Normality. Biometrika 52:591–611. [Google Scholar]
- Shehzad Z, Kelly a MC, Reiss PT, Gee DG, Gotimer K, Uddin LQ, Lee SH, Margulies DS, Roy AK, Biswal BB, Petkova E, Castellanos FX, Milham MP (2009) The resting brain: unconstrained yet reliable. Cereb Cortex 19:2209–2229. [DOI] [PMC free article] [PubMed] [Google Scholar]
- Shen H, Wang L, Liu Y, Hu D (2010) Discriminative analysis of resting-state functional connectivity patterns of schizophrenia using low dimensional embedding of fMRI. NeuroImage 49:3110–3121 Available at: http://www.ncbi.nlm.nih.gov/pubmed/19931396 [Accessed March 2, 2012]. [DOI] [PubMed] [Google Scholar]
- Shrout PE, Fleiss JL (1979) Intraclass correlations: uses in assessing rater reliability. Psychol Bull 86:420–428 Available at: http://www.ncbi.nlm.nih.gov/pubmed/18839484. [DOI] [PubMed] [Google Scholar]
- Smith SM (2002) Fast robust automated brain extraction. Hum Brain Mapp 17:143–155 Available at: http://www.ncbi.nlm.nih.gov/pubmed/12391568 [Accessed March 5, 2012]. [DOI] [PMC free article] [PubMed] [Google Scholar]
- Smith SM, Fox PT, Miller KL, Glahn DC, Fox PM, Mackay CE, Filippini N, Watkins KE, Toro R, Laird AR, Beckmann CF (2009) Correspondence of the brain’s functional architecture during activation and rest. Proc Natl Acad Sci U S A 106:13040–13045 Available at: http://www.ncbi.nlm.nih.gov/pubmed/19620724. [DOI] [PMC free article] [PubMed] [Google Scholar]
- Smyser CD, Inder TE, Shimony JS, Hill JE, Degnan AJ, Snyder AZ, Neil JJ (2010) Longitudinal analysis of neural network development in preterm infants. Cereb Cortex 20:2852–2862. [DOI] [PMC free article] [PubMed] [Google Scholar]
- Sorg C, Riedl V, Muhlau M, Calhoun VD, Eichele T, Laer L, Drzezga A, Forstl H, Kurz A, Zimmer C, Wohlschlager AM (2007) Selective changes of resting-state networks in individuals at risk for Alzheimer ‘ s disease. Proc Natl Acad Sci U S A 104:18760–18765. [DOI] [PMC free article] [PubMed] [Google Scholar]
- Sorg C, Riedl V, Perneczky R, Kurz A, Wohlschläger AM (2009) Impact of Alzheimer’s disease on the functional connectivity of spontaneous brain activity. Curr Alzheimer Res 6:541–553. [DOI] [PubMed] [Google Scholar]
- Sporns O, Honey C, Kötter R (2007) Identification and classification of hubs in brain networks. PLoS One 2:e1049 Available at: http://dx.plos.org/10.1371/journal.pone.0001049 [Accessed December 4, 2012]. [DOI] [PMC free article] [PubMed] [Google Scholar]
- Sui J, Adali T, Pearlson GD, Calhoun VD (2009) An ICA-based method for the identification of optimal FMRI features and components using combined group-discriminative techniques. NeuroImage 46:73–86 Available at: http://www.ncbi.nlm.nih.gov/pubmed/19457398 [Accessed March 19, 2012]. [DOI] [PMC free article] [PubMed] [Google Scholar]
- Tomasi D, Volkow ND (2011) Functional connectivity hubs in the human brain. NeuroImage 57:908–917 Available at: http://www.ncbi.nlm.nih.gov/pubmed/21609769 [Accessed July 16, 2012]. [DOI] [PMC free article] [PubMed] [Google Scholar]
- Van Dijk KR, Hedden T, Venkataraman A, Evans KC, Lazar SW, Buckner RL (2010) Intrinsic functional connectivity as a tool for human connectomics: theory, properties, and optimization. J Neurophysiol 103:297–321 Available at: http://www.pubmedcentral.nih.gov/articlerender.fcgi?artid=2807224&tool=pmcentrez&rendertype=abstract [Accessed March 1, 2012]. [DOI] [PMC free article] [PubMed] [Google Scholar]
- Wang J-H, Zuo X-N, Gohel S, Milham MP, Biswal BB, He Y (2011) Graph theoretical analysis of functional brain networks: test-retest evaluation on short- and long-term resting-state functional MRI data. PloS one 6:e21976 Available at: http://www.pubmedcentral.nih.gov/articlerender.fcgi?artid=3139595&tool=pmcentrez&rendertype=abstract [Accessed March 4, 2012]. [DOI] [PMC free article] [PubMed] [Google Scholar]
- Xie C, Li S-J, Shao Y, Fu L, Goveas J, Ye E, Li W, Cohen AD, Chen G, Zhang Z, Yang Z (2011) Identification of hyperactive intrinsic amygdala network connectivity associated with impulsivity in abstinent heroin addicts. Behav Brain Res 216:639–646 Available at: http://www.ncbi.nlm.nih.gov/pubmed/20851718 [Accessed March 8, 2012]. [DOI] [PMC free article] [PubMed] [Google Scholar]
- Yang Z, LaConte S, Weng X, Hu X (2008) Ranking and averaging independent component analysis by reproducibility (RAICAR). Human brain mapping 29:711–725 Available at: http://www.ncbi.nlm.nih.gov/pubmed/17598162 [Accessed November 16, 2012]. [DOI] [PMC free article] [PubMed] [Google Scholar]
- Ylipaavalniemi J, Soppela J (2009) Arabica : Robust ICA in a Pipeline. LNCS 5441:379–386. [Google Scholar]
- Ylipaavalniemi J, Vigário R (2008) Analyzing consistency of independent components: an fMRI illustration. NeuroImage 39:169–180 Available at: http://www.ncbi.nlm.nih.gov/pubmed/17931888 [Accessed November 22, 2012]. [DOI] [PubMed] [Google Scholar]
- Zhang H, Zuo XN, Ma SY, Zang YF, Milham MP, Zhu CZ (2010) Subject order-independent group ICA (SOI-GICA) for functional MRI data analysis. Neuroimage 51:1414–1424 Available at: http://www.ncbi.nlm.nih.gov/pubmed/20338245. [DOI] [PubMed] [Google Scholar]
- Zhang T, Wang J, Yang Y, Wu Q, Li B, Chen L, Yue Q, Tang H, Yan C, Lui S, Huang X, Chan RCK, Zang Y, He Y, Gong Q (2011) Abnormal small-world architecture of top-down control networks in obsessive-compulsive disorder. J Psychiatry Neurosci 36:23–31. [DOI] [PMC free article] [PubMed] [Google Scholar]
- Zhao X, Glahn D, Tan LH, Li N, Xiong J, Gao J-H (2004) Comparison of TCA and ICA techniques in fMRI data processing. J Magn Reson Imaging 19:397–402 Available at: http://www.ncbi.nlm.nih.gov/pubmed/15065162 [Accessed November 2, 2012]. [DOI] [PubMed] [Google Scholar]
- Zhu C-Z, Zang Y-F, Cao Q-J, Yan C-G, He Y, Jiang T-Z, Sui M-Q, Wang Y-F (2008) Fisher discriminative analysis of resting-state brain function for attention-deficit/hyperactivity disorder. NeuroImage 40:110–120 Available at: http://www.ncbi.nlm.nih.gov/pubmed/18191584 [Accessed March 8, 2012]. [DOI] [PubMed] [Google Scholar]
- Zhu X, Wang X, Xiao J, Liao J, Zhong M, Wang W, Yao S (2012) Evidence of a Dissociation Pattern in Resting-State Default Mode Network Connectivity in First-Episode, Treatment-Naive Major Depression Patients. Biol Psychiatry 71:611–617 Available at: http://www.ncbi.nlm.nih.gov/pubmed/22177602 [Accessed March 8, 2012]. [DOI] [PubMed] [Google Scholar]
- Zijdenbos AP, Dawant BM, Margolin RA, Palmer AC (1994) Morphometric analysis of white matter lesions in MR images: method and validation. IEEE Trans Med Imaging 13:716–724 Available at: http://www.ncbi.nlm.nih.gov/pubmed/18218550. [DOI] [PubMed] [Google Scholar]
- Zuo X-N, Di Martino A, Kelly C, Shehzad ZE, Gee DG, Klein DF, Castellanos FX, Biswal BB, Milham MP (2010a) The oscillating brain: complex and reliable. NeuroImage 49:1432–1445 Available at: http://www.pubmedcentral.nih.gov/articlerender.fcgi?artid=2856476&tool=pmcentrez&rendertype=abstract [Accessed July 13, 2012]. [DOI] [PMC free article] [PubMed] [Google Scholar]
- Zuo X-N, Ehmke R, Mennes M, Imperati D, Castellanos FX, Sporns O, Milham MP (2012) Network Centrality in the Human Functional Connectome. Cereb Cortex 22:1862–1875 Available at: http://www.ncbi.nlm.nih.gov/pubmed/21968567 [Accessed March 8, 2012]. [DOI] [PubMed] [Google Scholar]
- Zuo XN, Kelly C, Adelstein JS, Klein DF, Castellanos FX, Milham MP (2010b) Reliable intrinsic connectivity networks: test-retest evaluation using ICA and dual regression approach. Neuroimage 49:2163–2177 Available at: http://www.ncbi.nlm.nih.gov/pubmed/19896537. [DOI] [PMC free article] [PubMed] [Google Scholar]
Associated Data
This section collects any data citations, data availability statements, or supplementary materials included in this article.
Supplementary Materials
Supplemental Figure 1. The meta-ICA approach compared to the typical approach of completing a single using three different methods 1) “Single ICAs” = 50 single (typical) group-levels ICAs, 2) “Random Order Metas” = 50 meta-ICAs each completed on randomly concatenated results from 50 different single ICAs, 3) “Random Order & Selection Metas” = 50 meta-ICAs each completed on the randomly concatenated results from 50 single ICAs randomly selected from a total of 100 different single ICAs. The mean Dice Similarity Index across the 50 ICAs, with respect to each of the Reference Sample meta-level ICNs, was calculated for each of the three methods for testing ICN generation consistency. See Figure 3 or Figure 4 for the Reference Sample (REF) ICN labels based on relationship to BrainMap networks.
Supplemental Figure 2. Representations of the 12 non-artifact Reference Sample ICNs. A) Combined mask of the 12 ICNs (thresholded at z ≥ 6) in blue, probabilistic gray matter mask (thresholded at 0.30) in yellow, intersection of the combined 12 ICN mask and the gray matter probabilistic mask in green. B) Slices of the 12 ICNs discriminated into nine broad domains based on correlations with BrainMap networks; represented by nine colors, red = left and right executive networks, dark blue = default mode network, light blue = frontal-temporal network, pink = emotion and reward networks, magenta = audition/speech network, dark green = coordination and arm/hand sensorimotor networks, yellow = vision network, orange = visuospatial reasoning network, beige = autonomic/interoception network. A probabilistic gray matter image from the FSL library was thresholded at 75 and binarized to generate a 0.3 probability mask. The intersection of the thresholded probability mask and the combined ICN mask was computed and the number of non-zero voxels was calculated for the three images. The combined 12 ICN mask included 165149 voxels and the probabilistic gray matter mask included 200874 voxels; the intersection and thus overlap of the two masks encompassed 14560 voxels. This resulted in an overlap of 88% with gray matter brain voxels.