

Abstract

We present the magnetic properties of a new family of S = 1 molecule-based magnets, NiF2(3,5-lut)4·2H2O and NiX2(3,5-lut)4, where X = HF2, Cl, Br, or I (lut = lutidine C7H9N). Upon creation of isolated Ni–X···X–Ni and Ni–F–H–F···F–H–F–Ni chains separated by bulky and nonbridging lutidine ligands, the effect that halogen substitution has on the magnetic properties of transition-metal-ion complexes can be investigated directly and in isolation from competing processes such as Jahn–Teller distortions. We find that substitution of the larger halide ions turns on increasingly strong antiferromagnetic interactions between adjacent Ni2+ ions via a novel through-space two-halide exchange. In this process, the X···X bond lengths in the Br and I materials are more than double the van der Waals radius of X yet can still mediate significant magnetic interactions. We also find that a simple model based on elongation/compression of the Ni2+ octahedra cannot explain the observed single-ion anisotropy in mixed-ligand compounds. We offer an alternative that takes into account the difference in the electronegativity of axial and equatorial ligands.
Short abstract
The magnetic properties of well-separated Ni2+ chains are highly dependent on the bridging halide ligands. By increasing the size of the halide ions, we can decrease the single-ion anisotropy such that the system moves from easy plane to easy axis. Through-space magnetic interactions between adjacent Ni2+ ions are also turned on as the larger halides are substituted into the exchange pathway.
Introduction
Theoretical work on low-dimensional magnets1 and advances in material design2 have led to a vast number of experimental investigations into quantum magnetism. This is partly driven by possible applications in data storage, catalysis, and quantum computing,3−7 among others. Producing designer magnetic systems for physical applications or experimental tests of theoretical predictions is of great interest to physicists and chemists alike.
There have been many experimental studies of the magnetism of low-dimensional S = 1/2 systems in recent years, such that the influence of structure and composition on the magnetic properties is reasonably well understood.7−11 This allows experiments on these systems to explore exotic states, such as magnetic Bose–Einstein condensates of magnons12−14 or quantum spin liquids.15 However, investigations into S = 1 magnetic compounds are more rare due to the more complex ground state that these materials exhibit. The S = 1 Hamiltonian is given by
| 1 |
where J is the magnetic exchange interaction between ions within a chain or plane and J⊥ ≪ J is the exchange interaction between ions on adjacent chains or planes. For antiferromagnets, we define J, J⊥ > 0. Angular brackets denote a sum over unique pairs of metal ions, and a primed index indicates an ion in an adjacent chain or plane. D and E are the axial and rhombic single-ion anisotropy (SIA) parameters, respectively. For S = 1 compounds, D > 0 corresponds to easy-plane anisotropy with a singlet ground state (see, for example, the inset of Figure 4a), whereas D < 0 defines easy-axis anisotropy that contains the doublet in the ground state. The final term is the Zeeman splitting. The connection between the g factor and single-ion anisotropy can be found using perturbation theory, which predicts
| 2 |
where λ ∼ −500 K is the typical spin–orbit coupling constant for Ni2+ in an octahedral environment.16 The interplay between the different terms in the Hamiltonian leads to a rich and varied phase diagram for S = 1 quantum magnets, which includes the exotic Haldane gapped phase, a rare example of a topologically nontrivial magnetic state.17 The predicted phase diagram of S = 1 antiferromagnetic chains is shown in Figure 1 as a function of J⊥/J and D/J, with the positions of several real materials highlighted. In addition to the Haldane phase, the ordered Néel, Ising, and XY states are also seen, along with the disordered quantum paramagnetic phase at large positive D/J values.18 Designing bespoke systems to further understand these different phases is currently somewhat hit and miss due to an incomplete understanding of how the Hamiltonian parameters are affected by structure and composition. However, with our family of materials, we are able to span several of these phases and probe them more readily.
Figure 4.

Magnetometry data for single crystals of NiF2(3,5-lut)4·2H2O. (a) Zero-field-cooled susceptibility (χmol) measured at μ0H = 0.1 T for the field applied along the z-axis (orange triangles) and within the x–y plane (purple circles). Solid lines are fits to the models described in the text. (b) Pulsed-field magnetization (line) calibrated using similar temperature dc-field SQUID (circles) measurements with the field applied within the x–y plane. (c) Pulsed-field magnetization (line) calibrated using gz obtained from modeling χ(T) with the field applied parallel to the z-axis. SQUID data (triangles) are also shown. The differences between the data sets are caused by a magnetocaloric cooling in the pulsed-field measurements. The inset shows a peak in the pulsed-field dM/dH data (line) centered at μ0Hc is consistent with the feature in the 1.8 K SQUID dM/dH data (triangles).
Figure 1.

Phase diagram of the S = 1 antiferromagnetic chain recreated from refs (17) and (18). Compounds for which J⊥ values are not quantitatively established are represented by arrows along the x-axis. From the results in ref (19), it is known that the J⊥/J ratio for NiI2(3,5-lut)4 is extremely small. We expect it will be the same for the isostructural NiBr2(3,5-lut)4. Reproduced with permission from ref (17). Copyright 2014 American Physical Society. Reproduced with permission from ref (18). Copyright 2014 World Scientific Publishing.
Synthesizing high-purity single-phase single crystals is highly resource-intensive, and many compounds are only initially available as powders. The combination of single-ion and exchange effects causes great challenges when characterizing the magnetic properties of polycrystalline samples, especially if J ≈ D.20 In simple monoligand materials, the link between the distortion of the local octahedral environment and the single-ion anisotropy is clear: an increasingly axially elongated Ni2+ octahedron leads to an increase in the easy-plane anisotropy. In contrast, an axially compressed octahedron will promote easy-axis anisotropy. This is also supported by studies of varying distortions in similar mixed-ligand octahedra.21 However, predicting how anisotropy energies change between different mixed-ligand materials is necessarily more complex16 and remains to be fully elucidated.
To shed light on these issues, our study makes use of a family of mixed-ligand magnetic metal–organic complexes. The suitability of these systems for exploring magnetic phase diagrams and their structural and compositional dependences is well established.9,14,20,22−31 Using recently published analytical techniques,31−33 we present the characterization of the S = 1 chain family NiF2(3,5-lut)4·2H2O and NiX2(3,5-lut)4 (X = HF2, Cl, Br, or I). Because of their nonbridging nature, lutidine molecules create an inefficient pathway for intermolecular magnetic exchange. Upon creation of isolated Ni-X···X-Ni chains separated by the nonbridging lutidine ligands, the effect that halogen substitution has on the magnetic properties of NiF2(3,5-lut)4·2H2O and NiX2(3,5-lut)4 can be detached and investigated in detail. While two-halide exchange interactions have been documented in a few cases of Cu-X···X-Cu pathways for X = Cl and Br,34−36 the presence of Jahn–Teller distortions in Cu(II) complexes complicates the structural analysis. The work presented here allows us to span the entire halide series in the absence of Jahn–Teller distortions for the first time by exploiting Ni(II) ions. In addition, the isostructural family that is created provides an ideal test for directly correlating and quantifying the halide radius, the distance between them (LX···X), and exchange interaction J. We will show that as the radius of the axial halogen ion increases with a corresponding increase in the Ni–X bond distance,20 there is a reduction in the single-ion anisotropy from the strongly easy-plane Ni(HF2)2(3,5-lut)4 to the weakly easy-axis NiI2(3,5-lut)4. Surprisingly, we also find that there are antiferromagnetic interactions along the chains NiBr2(3,5-lut)4 and NiI2(3,5-lut)4, despite the distance between halide ions on adjacent NiX2N4 moieties being greater than twice the van der Waals radii of the respective X– ions.
To fully characterize the properties of powder samples of low-dimensional Ni(II) antiferromagnets, we and others have developed a suite of complementary experimental techniques. We use a mixture of bulk (quasi-static and pulsed-field magnetometry) and local probes [electron spin resonance (ESR)] to characterize the magnetic properties of NiF2(3,5-lut)4·2H2O and NiX2(3,5-lut)4. Quasi-static magnetometry measurements using a SQUID are relatively quick and economical to perform and have been shown to provide accurate modeling of S = 1 systems exhibiting negligible exchange energies, yielding results in good agreement with those of the more rigorous ESR method.21,33 The characterization of low-dimensional antiferromagnetically interacting S = 1 systems cannot rely on susceptibility measurements of powdered samples alone if J and D are similar in magnitude, as there are no models that can be used to reliably fit the data.32 To overcome this, we have successfully used additional information available from low-temperature, high-field magnetization measurements (namely spin-flop, metamagnetic, and saturation fields) to simultaneously extract J and D in the low-temperature state.21,32,33 ESR is highly suited to characterizing the single-ion properties of quantum magnets. In our compounds, the size of the zero-field splitting requires magnetic fields that are higher than can found in commercially available ESR machines. The required equipment is only available at a few specialized facilities worldwide. We therefore reserve ESR measurements for compounds containing both single-ion anisotropy and magnetic interactions, for example, NiBr2(3,5-lut)4, or in which a complete characterization using magnetometry techniques is not possible, as is the case for Ni(HF2)2(3,5-lut)4.
Experimental Details
Synthesis
Chemical reagents were obtained from commercial sources and used as received. All fluoride- and hydrogen difluoride-containing compounds were manipulated and stored in plasticware. The desired products of each compound were obtained in good yield (>70%), and the reaction conditions were not optimized any further.
Synthesis of NiF2(3,5-lut)4·2H2O
Ni(BF4)2·6H2O (0.5023 g, 1.48 mmol) was dissolved in 2 mL of H2O to produce a green solution. Ammonium fluoride (0.2721 g, 7.35 mmol) was dissolved in 2 mL of H2O, and the mixture slowly added to the Ni solution. Lastly, 4 mL of neat 3,5-lutidine was slowly pipetted into the aqueous solution of in situ NiF2·6H2O, separating upon contact into a clear layer and a blue layer. The beaker was covered with perforated Parafilm and allowed to slowly evaporate at room temperature. After the mixture had stood for several months, 0.2005 g of small medium-blue crystals was collected via vacuum filtration and carefully washed with a minimal amount of fresh H2O.
Synthesis of Ni(HF2)2(3,5-lut)4
Ni(NO3)2·6H2O (0.3050 g, 1.05 mmol) and 4 equiv of NH4HF2 (0.2376 g, 4.17 mmol) were dissolved together in 5 mL of H2O to produce a light green solution. A 2 mL volume of neat 3,5-lutidine was dissolved in 5 mL of acetonitrile and slowly added to the Ni solution. The resulting solution changed color to dark teal upon contact. All steps were performed in plastic. The beaker was covered with perforated Parafilm, and its contents were allowed to slowly evaporate at room temperature. Upon standing for 3 days, the solution produced medium-blue block-shaped crystals.
Synthesis of NiCl2(3,5-lut)4
NiCl2·6H2O (0.3500 g, 1.47 mmol) was dissolved in 30 mL of H2O at room temperature, and the solution slowly mixed with neat 3,5-lutidine (0.9467 g, 8.83 mmol). After a few hours, small crystals were observed growing on the walls of the Erlenmeyer flask. After 3 days, a larger mass of teal-colored crystals had grown, and they were collected via vacuum filtration, washed with fresh 2 × 5 mL aliquots of a 1:1 H2O/3,5-lutidine mixture, and lightly dried to avoid possible decomposition.
Synthesis of NiBr2(3,5-lut)4
Preparation of the NiBr2(3,5-lut)4 compound was accomplished in the same manner as for NiCl2(3,5-lut)4 but substituting NiBr2·4H2O for NiCl2·6H2O.
Synthesis of NiI2(3,5-lut)4
The preparation of this compound has been described by Williams et al.19
X-ray Structure Determination
Single-crystal X-ray diffraction measurements on NiF2(3,5-lut)4·2H2O and Ni(HF2)2(3,5-lut)4 were performed using a Bruker D8 Venture CPAD DUO microsource diffractometer using θ and ω scans and graphite monochromatic Mo Kα (λ = 0.71073 Å) radiation. Suitable single crystals were selected from the bulk, mounted on a cryoloop, and cooled to 150(2) K using an LN2 cryostream. Data sets were corrected for Lorentz and polarization effects as well as absorption. The criterion for observed reflections was I > 2σ(I). Lattice parameters were determined from least-squares analysis of reflection data. Empirical absorption corrections were applied using SADABS. Structures were determined by direct methods and refined by full-matrix least-squares analysis on F2 using the SHELXT functionality within X-SEED. Non-hydrogen atoms were refined anisotropically using the SHELXL program. Hydrogen atoms were located by difference Fourier synthesis but placed in idealized geometric positions with Uiso = 1.2Ueq of the atom to which they were attached; Uiso = 1.5Ueq for methyl groups. The O atoms of the H2O molecules are 0.125 occupied owing to 16-fold positional disorder; however, the associated H atoms were not located or modeled. Methyl groups were equally modeled over two positions as suggested by final residual difference maps. Tables S1 and S6 list structural and refinement parameters.
Low-temperature, single-crystal X-ray diffraction measurements of NiX2(3,5-lut)4 (X = F, Cl, Br, or I) were conducted on the ChemMatCARS 15-ID-B microcrystal beamline of the Advanced Photon Source (APS) at Argonne National Laboratory (ANL). Microcrystals measuring 10 μm × 10 μm × 2 μm were selected from the bulk samples using a cryo-loop and mounted on a Huber three-circle X-ray diffractometer equipped with an APEX II CCD area detector. The sample was cooled to 100(2) K using an LN2 cryojet. Further details of the beam profile and data collection and analysis, alongside the full details of the resulting structural refinement, bond lengths, and angles, are given in the Supporting Information. The atom labeling scheme is shown in Figure S1.
Magnetometry
Pulsed-field magnetization measurements of powdered NiCl2(3,5-lut)4 and NiBr2(3,5-lut)4 and single crystals of NiF2(3,5-lut)4·2H2O and Ni(HF2)2(3,5-lut)4 were performed at the National High Magnetic Field Laboratory (NHMFL) in Los Alamos. Fields of ≤40 T with typical rise times of ≈10 ms were used. Samples were mounted in 1.3 mm diameter PCTFE ampules (inner diameter of 1.0 mm) that can be moved into and out of a 1500-turn, 1.5 mm bore, 1.5 mm long compensated-coil susceptometer, constructed from 50 gauge high-purity copper wire.9 When the sample is within the coil and the field pulsed the voltage induced in the coil is proportional to the rate of change of magnetization with time, dM/dt. Accurate values of the magnetization are obtained by numerical integration of the signal with respect to time, followed by subtraction of the integrated signal recorded using an empty coil under the same conditions.9 The magnetic field is measured via the signal induced within a coaxial 10-turn coil and calibrated via observation of de Haas–van Alphen oscillations arising from the copper coils of the susceptometer.9 The susceptometer is placed inside a 3He cryostat, which can attain temperatures as low as 500 mK.
Pulsed-field data were calibrated using magnetization measurements made in a Quantum Design MPMS 7 T SQUID magnetometer. Powdered samples of a known mass were loaded into gelatin capsules and fixed to a stainless steel rod. The samples were cooled in zero field to the measured temperature, and then the field was increased in increments of 0.1 T from 0 to 7 T, with the field stabilized before each measurement was taken. The pulsed-field measurements were then scaled onto the SQUID data. This experimental setup was also used to obtain dc susceptibility measurements, with the sample zero-field cooled to 1.8 K. The field was then set to 0.1 T, and temperature-dependent susceptibility data were taken on warming to 300 K.
ESR
High-field, high-frequency ESR spectra of powdered Ni(HF2)2(3,5-lut)4 and NiBr2(3,5-lut)4 were recorded on a home-built spectrometer at the EMR facility, NHMFL, Tallahassee, FL. Microwave frequencies (ν) in the range of 160–516.9 GHz at temperatures ranging from 3 to 30 K were used in the measurement. The instrument was a transmission-type device and used no resonant cavity. Powdered samples were loaded into thin Teflon vessels and lowered into the cryostat. The microwaves were generated by a phase-locked Virginia Diodes source, generating frequencies (ν) in the range of 12–18 GHz, and equipped with a cascade of frequency multipliers to generate higher harmonic frequencies. The resultant signal was detected using a cold bolometer. A superconducting magnet capable of reaching fields of ≤15 T was employed.
In a polycrystalline S = 1 sample with axial single-ion anisotropy (E = 0), multiple ESR transitions are expected between the split triplet energy levels. At a given frequency, for the field applied parallel to the local i-axis (i = a, b, or c), there are two transitions possible that obey the ESR selection rule Δms = ±1: one at low field and one at high field, which we label βi and γi, respectively (inset of Figure 4a). In addition, it is also possible to see an excitation with Δms = ±2; this so-called half-field transition is labeled αi. Formally, such transitions are forbidden, but when the Zeeman energy is comparable to the zero-field splitting, strong mixing between ms states occurs and the selection rule is relaxed. Double-quantum transitions may also occur when two microwave packets enter the sample at the same time. Additional lines may also be observed at positions that do not correspond to one of the Cartesian axes. These off-axis resonances may be present at the half-field transitions and have been known to dominate the polycrystalline spectra.37−39
Polarized Neutron Diffraction
Neutron diffraction studies of a single crystal of Ni(HF2)2(3,5-lut)4 were performed at the Orphée 14MW reactor of the Laboratory Léon Brillouin, CEA Saclay. The diffraction patterns were collected on a model 5C1 diffractometer, equipped with a position-sensitive detector, which has a cylindrical geometry covering 80° and 25° in the horizontal and vertical directions, respectively. Incident neutrons of wavelength λ = 0.84 Å were obtained with a Heusler-alloy monochromator, and the beam polarization was 0.88.
Results
X-ray Crystallography
NiX2(3,5-lut)4 compounds (X = HF2, Cl, Br, or I19) crystallize in tetragonal space group P4/nnc. The nickel octahedron contains four equatorial nitrogen atoms donated from the lutidine molecules and two axial halogen ions (Figure 2a). Because of the tetragonal structure of each compound, the rhombic anisotropy parameter E is determined to be zero.40 Ni2+ ions are linearly bridged along the c-axis via two HF2 molecules (Figure 2b) or two halogen ions (Figure 2c), where F–H–F bonds are linearly oriented along the c-axis in Ni(HF2)2(3,5-lut)4. The X···X linkages arise via halogen bonds, which are noncovalent through-space interactions shown to be capable of mediating magnetic exchange.41−43 Nonbridging lutidine molecules keep the chains well separated (Figure 2d), and nickel ions in adjacent chains are offset from each other along the c direction. There are no clear exchange pathways between adjacent nickel ions within the a–b plane, and therefore, it is likely that any significant magnetic interaction will be limited to the nickel–halogen chains.
Figure 2.
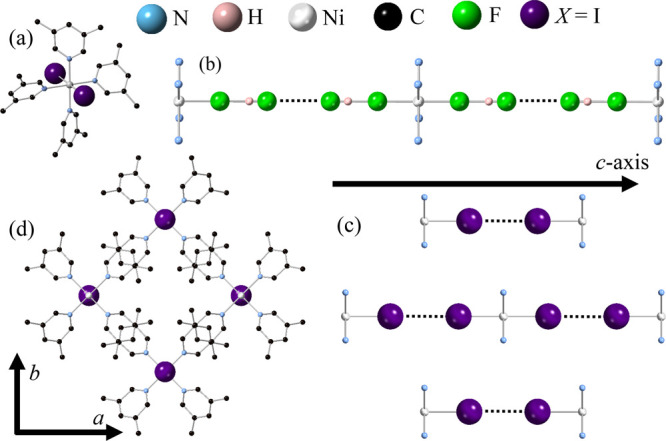
Low-temperature structure of NiX2(3,5-lut)4. (a) Layout of the local environment around each Ni2+ ion (silver). (b) Ni–HF2···HF2–Ni chain showing that the F–H–F molecule axis is oriented along the c direction in Ni(HF2)2(3,5-lut)4. (c) Ni–I···I–Ni chains in NiI2(3,5-lut)4 (isostructural with X = Cl and Br), where Ni2+ ions in adjacent chains are offset in the c direction. (d) Lutidine molecules keep Ni–X···X–Ni chains well separated in the a–b plane. Lutidine hydrogen atoms have been omitted for the sake of clarity.
Within NiF2(3,5-lut)4·2H2O, which is isostructural to the Co analogue CoF2(3,5-lut)4·2.6H2O,44 adjacent intrachain octahedra are rotated by 45° about the crystallographic c-axis as shown in panels a and b of Figure 3. Despite the difference in space group (P4/mcc), adjacent Ni2+ sites remain well separated with an unchanged local environment (Figure 3c). Positionally disordered water molecules sit between fluorine ions that are coordinated to adjacent Ni2+ ions. In NiF2(3,5-lut)4·2H2O, the local environment has tetragonal symmetry and therefore E = 0 as for the other compounds.
Figure 3.

150 K structure of NiF2(3,5-lut)4·2H2O. (a) Ni–F···F–Ni chain with lutidine paddle wheels rotated by 45° on adjacent sites. Water molecules located between F– ions along Ni–F···F–Ni bond pathways are positionally disordered (water hydrogen atoms have been omitted for the sake of clarity). (b) View down the Ni2+ chains highlighting the rotation of the lutidine paddle wheels along the c-axis. Lutidine hydrogen atoms in panels a and b have been omitted for the sake of clarity.
The relevant structural and bond information for NiX2(3,5-lut)4 is given in Tables 1 and 2. As the Ni–N bond lengths for all NiX2(3,5-lut)4 compounds are all very similar, this gives an excellent starting point for understanding how the single-ion anisotropy changes due to the substitution of the halogen ion. The nearest-neighbor Ni–Ni distance along the chain decreases as X = Cl → I in NiX2(3,5-lut)4 despite the increase in the Ni–X bond length. This contraction of LNi–Ni is driven by the decrease in the LX···X distance. Coincident with this change is the near 1 Å increase in lattice parameters a and b, wherein the lutidine torsion angle (C1–N1–Ni–X) decreases from 45.52° for X = Cl to 40.29° for X = I. The structure of NiF2(3,5-lut)4·2H2O does not follow this trend owing to the different space group and interstitial H2O molecule, resulting in a much shorter intrachain nearest-neighbor Ni2+ distance.
Table 1. Unit Cell Parameters for NiX2(3,5-lut)4 and NiF2(3,5-lut)4·2H2O.
| a, b (Å) | c (Å) | space group | |
|---|---|---|---|
| NiF2(3,5-lut)4·2H2O | 9.1773(2) | 17.2386(4) | P4/mcc |
| Ni(HF2)2(3,5-lut)4 | 11.1287(3) | 11.7600(4) | P4/nnc |
| NiCl2(3,5-lut)4 | 11.4902(9) | 10.5512(11) | P4/nnc |
| NiBr2(3,5-lut)4 | 11.7232(5) | 10.1153(4) | P4/nnc |
| NiI2(3,5-lut)419 | 12.0048(5) | 9.9568(4) | P4/nnc |
Table 2. Bond Lengths in NiX2(3,5-lut)4 and NiF2(3,5-lut)4·2H2O.
| LNi–X (Å) | LNi–Nia (Å) | LX···X (Å) | van der Waals radius of Xb (Å) | LNi–N (Å) | |
|---|---|---|---|---|---|
| NiF2(3,5-lut)4·2H2O | 2.036(2) | 8.619(2) | 4.547(6) | 1.35 | 2.124(2) |
| Ni(HF2)2(3,5-lut)4 | 2.0120(15) | 11.7600(4) | 3.137 | 1.35 | 2.0945(16) |
| NiCl2(3,5-lut)4 | 2.4502(9) | 10.5512(11) | 5.651(2) | 1.8 | 2.122(2) |
| NiBr2(3,5-lut)4 | 2.6170(4) | 10.1153(4) | 4.881(2) | 1.95 | 2.121(2) |
| NiI2(3,5-lut)419 | 2.8292(4) | 9.9568(4) | 4.298(2) | 2.1 | 2.123(3) |
LNi–Ni corresponds to the nearest-neighbor Ni–Ni distance along the Ni–X···X–Ni chains.
van der Waals radius of the halide ion in NiF2(3,5-lut)4·2H2O and NiX2(3,5-lut)4.45
Magnetic Properties
NiF2(3,5-lut)4·2H2O
Single-crystal magnetic susceptibility χ(T) data for the field parallel and perpendicular to the crystallographic c-axis are shown in Figure 4a. For the field applied parallel to c, χ(T) shows a broad hump centered around T ≈ 5 K, while with the field perpendicular to c, χ(T) continues to increase as the temperature is decreased. These data hint at the beginning of a plateau as the temperature approaches the lowest experimentally accessible value of T = 1.8 K. The χ(T) curves show that the anisotropy in NiF2(3,5-lut)4·2H2O is easy-plane,46 with the hard axis along the crystallographic c direction. Therefore, we define the z-axis to be along the c direction, with the x–y plane analogous to the a–b plane. We use a model containing SIA and paramagnetic contributions33 and perform a global fit to the data for the field applied parallel and perpendicular to the z-axis, shown by solid lines in Figure 4a. The fitting returns the following values: gxy = 2.12(1), gz = 2.13(2), and D = +8.7(3) K. We note that the fitted gz and gxy are the same within errors. In this case, the simple perturbation theory of eq 2 suggests that the magnitude of the spin–orbit coupling could be very large.
Pulsed-field magnetization for the field applied within the x–y plane rises smoothly to a broad saturation at 2.13(4) μB per formula unit shown in Figure 4b (data calibrated using MPMS SQUID measurements). For the field applied along the z-axis (Figure 4c), it is not possible to use SQUID measurements to calibrate the pulsed-field data due to some magnetocaloric cooling in the latter experiment. Therefore, we use the value of gz found from the measurement of χz(T) to calibrate the saturation at Msat = 2.13 μb per formula unit. In this orientation, the magnetization shows an initial slow rise before a sharp upturn and eventual rounding to a plateau at saturation.
The midpoint of the upturn occurs at μ0Hc, where gzμBμ0Hc = D, and is the point at which the applied field closes the gap between the ms = 0 and ms = −1 states (see the inset of Figure 5a). Using the peak in dM/dH (inset of Figure 4a), we find that μ0Hc = 6.0(2) T and D = +8.7(4) K, in excellent agreement with the susceptibility measurements. We note that the same critical field can be seen in the SQUID data, but the feature is narrower and sharper in the pulsed-field measurement due to a magnetocaloric cooling associated with the high dB/dt in the pulsed-field measurement.14
Figure 5.

Magnetometry data for an aligned single crystal of Ni(HF2)2(3,5-lut)4. (a) Zero-field-cooled susceptibility plotted vs temperature for the field applied parallel (blue triangles) and perpendicular (black circles) to the crystallographic c-axis. Solid lines correspond to a fit to the model described in the text. The inset is a representative sketch of an S = 1 energy-level diagram, showing the labeling scheme for transitions observed in ESR measurements of Ni(HF2)2(3,5-lut)4 and NiBr2(3,5-lut)4. (b) Pulsed-field magnetization (solid black line) calibrated to similar temperature DC-field SQUID data (black circles) with the field perpendicular to the c-axis. SQUID magnetometry data with the field parallel to the c-axis (blue triangles) are also shown.
Ni(HF2)2(3,5-lut)4
Single-crystal susceptibility data for Ni(HF2)2(3,5-lut)4 (Figure 5a) show a rise to a broad hump centered around T ≈ 8 K for the magnetic field parallel to the c-axis. For the field perpendicular to the c-axis, the data continue to rise and appear to begin to plateau as the temperature approaches 1.8 K. The χ(T) measurements are consistent with a singlet ground state and D > 0. Following the treatment given to NiF2(3,5-lut)4·2H2O, we define the z-axis and x–y plane to be along the c-axis and a–b plane, respectively. Fitting the data to a model containing contributions from SIA and paramagnetism46 gives the following values: gxy = 2.20(1), gz = 2.13(3), and D = +11.0(6) K. Muon spin rotation measurements also show no evidence of long-range order at temperatures as low as 20 mK,47 consistent with J ≈ 0 for Ni(HF2)2(3,5-lut)4.
The calibrated pulsed-field magnetization data with the field applied perpendicular to the z direction (Figure 5b) rises smoothly to a broad saturation at 2.18(1) μB per formula unit. For the field applied parallel to the z-axis, SQUID magnetization displays an upturn due to the field-induced ground-state energy-level crossing in the S = 1 triplet (inset of Figure 4a). This is consistent with easy-plane anisotropy in Ni(HF2)2(3,5-lut)4. The application of a magnetic field above 7 T in the c direction consistently caused shattering of crystals, regardless of the method used to fix the samples in position. As a result, M(H) data cannot be used to quantify D for Ni(HF2)2(3,5-lut)4.
To confirm the Hamiltonian parameters derived from magnetometry, high-field ESR measurements of polycrystalline Ni(HF2)2(3,5-lut)4 were performed and show resonances corresponding to γxy, γz, βxy, and βz transitions as shown in Figure 6a. A feature corresponding to the off-axis resonance is also present in the 321.6 and 406.4 GHz sweeps. The resonance marked with an asterisk is attributed to an impurity. The field frequency positions of the resonances were fitted (Figure 6a), with the resulting parameters extracted: gxy = 2.22(1), gz = 2.16(1), and D = +11.0(1) K. Simulating spectra using a model containing only SIA at the experimentally measured frequencies and temperatures provides results in excellent agreement with the data. A temperature-dependent study at 321.6 GHz was performed (Figure 6c) to confirm the sign of D. The data show an increase in the intensity of the βxy transitions as the temperature decreases. This is due to an increased occupation of the ms = −1 state at lower temperatures. At the same time, the intensity of the γxy resonance decreases as the temperature decreases due to a reduction in the occupation of the ms = 0 state. Both of these trends are consistent with Ni(HF2)2(3,5-lut)4 exhibiting easy-plane anisotropy. This is further supported by the fact that gxy > gz, and the resulting value of λ ≈ −400 K is consistent with that expected for Ni2+ ions in octahedral environments.16 The value of D extracted from ESR measurements is in excellent agreement with that found from fitting the susceptibility data above.
Figure 6.

(a) ESR spectra of Ni(HF2)2(3,5-lut)4 recorded at 20 K and frequencies of 203.2, 321.6, and 406.4 GHz. Large resonances are observed in all three spectra, which were fitted using a model with single-ion anisotropy D. The obtained parameters were then simulated (Sim) in good agreement with the data. (b) Field frequency positions of the observed resonances (circles) and the result of the fit (lines) with the following extracted parameters: gxy = 2.22(1), gz = 2.16(2), and D = +11.0(1) K. (c) Temperature dependence of the 321.6 GHz Ni(HF2)2(3,5-lut)4 ESR spectra.
To provide further evidence of the easy-plane nature of Ni(HF2)2(3,5-lut)4, polarized neutron diffraction measurements were performed on a single crystal of Ni(HF2)2(3,5-lut)4. Data were collected at temperatures of 1.8 and 10 K in a range of magnetic fields between 1.5 and 6 T applied parallel to the y- and z-axes. The magnetization density was extracted from flipping ratio R, the ratio of the intensity of neutrons scattered when polarized parallel and antiparallel to the external magnetic field. Initial data refinement indicated a strong anisotropy between the y and z directions, which are aligned along the crystallographic b- and c-axes, respectively. This anisotropy has been taken into account using the susceptibility approach described by Gukasov and Brown.48 In the orthorhombic axes, the symmetry constraints for the magnetic Ni atom occupying the “2b” site in the P4/nnc space group imply χxx = χyy and χxy = χxz = χyz = 0. Thus, only two independent susceptibility parameters, χxx and χzz, need to be determined to fully characterize the magnetic behavior of the Ni2+ ion.
The susceptibility component χzz can be accurately determined on the basis of a set of flipping ratios collected in a magnetic field applied along the z-axis. At the same time, susceptibility component χyy has a significant effect on the flipping ratios measured in the magnetic field applied along the y-axis. Thus, a joint refinement procedure, in which two data sets with the field oriented along the y- and z-axes are fitted simultaneously, is required to simultaneously calculate the χyy and χzz components. The joint refinement of the data at 10 K shows no evidence of anisotropy, whereas at 1.8 K, the joint refinement of the lower-field (H//y = 1.5 T, and H//z = 3.3 T) data sets and higher-field (H//y = 6 T, and H//z = 4 T) data indicates that χyy ≫ χzz. The susceptibility components are combined to produce magnetization ellipsoids (Figure 7), showing that Ni(HF2)2(3,5-lut)4 exhibits easy-plane anisotropy, with the hard axis oriented along the z-axis. These results are in excellent agreement with the magnetometry and ESR measurements.
Figure 7.

Illustration of magnetization ellipsoids for Ni atoms in a single crystal of Ni(HF2)2(3,5-lut)4 as determined by refinement of polarized neutron diffraction data (see the text): (a) high-temperature, high-field data and (b) low-temperature, high-field data. The ellipsoids in panel b confirm the xy orientation of the Ni2+ moment in the paramagnetic state attributed to D > 0.
NiCl2(3,5-lut)4
Single crystals of sufficient size to perform bulk magnetometry measurements of NiCl2(3,5-lut)4 and NiBr2(3,5-lut)4 are not currently available. Therefore, we use the methods of extracting the Hamiltonian parameters of polycrystalline samples described by Blackmore et al.33
Susceptibility data of powdered NiCl2(3,5-lut)4 increase as the temperature is decreased before appearing to plateau at ≈2 K (Figure 8a), consistent with negligible magnetic interactions and the presence of single-ion anisotropy with D > 0. The data are fitted using a model incorporating single-ion anisotropy, paramagnetism,46 and a small temperature-independent contribution χ0 = −1.46(7) × 10–9 m3 mol–1 that is obtained from a Curie–Weiss fit to χ–1(T) (inset of Figure 8a). The parameters extracted are D = +10.1(1) K and powder-averaged g factor g̃ = 2.16(1).
Figure 8.

(a) Temperature-dependent susceptibility measurements of polycrystalline NiCl2(3,5-lut)4 performed at an applied field of 0.1 T and fitted to a model including a single-ion anisotropy contribution (see the text). The inset of panel b shows inverse susceptibility data of NiCl2(3,5-lut)4 fitted to a Curie–Weiss model and a small temperature-independent contribution in the range 36–300 K. (b) Magnetization and differential susceptibility (inset) of polycrystalline NiCl2(3,5-lut)4. A feature indicating a ground-state energy-level crossing is apparent in the dM/dH data at μ0Hc = 6.6(5) T. The sharp rise below 0.3 T is due to an artifact of the measurement.
Pulsed-field magnetization measurements of polycrystalline NiCl2(3,5-lut)4 show a smooth, seemingly featureless, concave rise to a broad saturation point (Figure 8b), while differentiating the data reveals a weak bumplike feature (inset). The observations are consistent with the simulations for an S = 1 system with negligible exchange interactions.31,33 The weak bump in dM/dH at μ0Hc = 6.6(5) T is caused by the ground-state energy-level crossing, which for E = 0 occurs for only easy-plane systems (D > 0)33 and yields a D value of +9.6(7) K, in agreement with the susceptibility result. As NiCl2(3,5-lut)4 exhibits the same symmetry as Ni(HF2)2(3,5-lut)4, we determine that the z-axis is located along the c-axis and the x–y plane is located within the a–b plane in NiCl2(3,5-lut)4.
NiBr2(3,5-lut)4
DC susceptibility data of powdered NiBr2(3,5-lut)4 (suspended in Vaseline to prevent grain movement) (Figure 9a) show an increase in χ(T) as the temperature is decreased, before leveling off as T approaches 1 K. The data are fitted to a model that includes a small mean-field perturbation caused by magnetic exchange on a single-ion anisotropy model, as described by Carlin and de Jongh.49 The parameters extracted from the resultant fit are g̃ = 2.11(1), D = +6.84(9) K, χ0 = −5(1) × 10–9 m3 mol–1, and nJ = 1.09(4) K, where n = 2 is the number of magnetically interacting nearest neighbors. The model recreates the data well, and the parameters are consistent with the weak exchange and stronger single-ion anisotropy that we find in the analysis of M(H) and ESR data below. This strongly indicates the presence of weak magnetic interactions along the Ni–Br···Br–Ni chains. The inverse susceptibility data show paramagnetic behavior down to very low temperatures and were fitted to a Curie model (inset of Figure 9a). The parameters obtained are g̃ = 2.09(1) with a small temperature-independent contribution χ0 = −6.05(4) × 10–9 m3 mol–1.
Figure 9.

(a) Temperature-dependent susceptibility measurements of powdered NiBr2(3,5-lut)4 suspended in Vaseline performed at an applied field of 0.1 T. The data are fitted to a model containing both single-ion and magnetic exchange terms [green (see the text)].49 The inset shows inverse susceptibility data fitted to a Curie model in the range of 50–300 K. (b) Pulsed-field magnetization and differential susceptibility (inset) of NiBr2(3,5-lut)4. Critical fields are observed in the dM/dH data indicating saturation of moments for the field parallel to the easy plane at μ0Hsatxy = 2.3(2) T and the easy axis at μ0Hsat = 11.1(5) T.
Pulsed-field (Figure 9b) measurements of polycrystalline NiBr2(3,5-lut)4 show that the magnetization rises quasi-linearly at first before approaching a broad saturation. The differential susceptibility (inset of Figure 9b) similarly shows a flattish region that ends in a short rise to a peak before dropping to saturation with no indication of a spin flop. This is consistent with an S = 1 compound with easy-plane single-ion anisotropy and modest magnetic interactions between adjacent Ni2+ ions.33 In general, two critical fields can be identified in polycrystalline M(H) data of Ni2+ antiferromagnets that are attributed to moments saturating when the field is parallel to the easy-plane gxyμBμ0Hsatxy = 2SnJ and along the hard-axis gzμBμ0Hsat = 2(nJ + D)S, where n is the number of nearest neighbors. The lower saturation field occurs at μ0Hsatxy = 2.3(2) T. The upper saturation field is estimated as the point at which d2M/dH2 first crosses zero, which occurs at μ0Hsat = 11.1(5) T. Using gxy = 2.20(1) and gz = 2.08(1) obtained from ESR measurements (see below), values of J = 0.85(7) K and D = +6.1(5) K are extracted, consistent with the fit to χ(T) presented above.
Low-temperature ESR measurements of polycrystalline NiBr2(3,5-lut)4 were recorded in the first-derivative mode at frequencies between 160 and 516.9 GHz (Figure 10a). No evidence for long-range magnetic order has been observed in this system, nor is it to be expected as the temperature range (3 K ≤ T ≤ 5 K) at which these data are taken is larger than energy scale of the exchange interaction estimated from magnetometry. For this reason, it is possible to identify features in the spectra that arise from transitions between anisotropy-split S = 1 energy levels only, neglecting the effects of magnetic exchange. The low-frequency data show resonances corresponding to γz and γxy transitions at higher fields, which move out of the field window above 326.4 GHz. The βxy transition is also observed at ν ≥ 196.8 GHz, and the βz resonance develops as the frequency increases from 370 GHz. A feature corresponding to αoff is also present in all field sweeps. Resonances marked with a “∧” are ascribed to the double-quantum transition. The resonances caused by transitions between magnetic energy levels of the Ni2+ ion are plotted in Figure 10b and are fitted to a Hamiltonian containing a single-ion anisotropy term and no exchange. The extracted parameters are gxy = 2.20(1), gz = 2.08(1), and |D| = 6.2(1) K. A simulation at 260 GHz using these parameters is plotted in Figure 10c and successfully replicates the position and amplitudes of the αoff, βxy, γxy, and γz transitions. The position of the simulated βz transition is in good agreement with the data but is recreated at a much smaller amplitude.
Figure 10.

(a) ESR spectra of polycrystalline NiBr2(3,5-lut)4 collected in derivative mode at low temperatures and high frequencies. Red arrows show the position of the γz transition, and blue arrows show the positions of the γxy (at high field) and βxy (at low field) transitions. Gray arrows and ∧ mark the off-axis and double-quantum resonances, respectively. (b) Plot of frequency vs field showing the peak positions (circles). The lines are the expected locations of resonances from the fit to the experimental data described in the text, with the dark gray line and circles corresponding to the off-axis resonances and the brown circles referring to the double-quantum resonances. (c) Temperature dependence of the 260 GHz spectra. The orange line is a simulation at 5 K using the parameters obtained from the fit in panel b.
The sign of D can be extracted from observing the temperature dependence of the β and γ peaks. The 260 GHz data (Figure 10c) show the intensity of the γxy transition increases as the temperature increases, corresponding to a transition between two excited states. The βxy and γz resonances are present at very low temperatures, indicating that these are caused by transitions between the ground state and an excited state. The temperature dependence of these transitions implies that D > 0 for NiBr2(3,5-lut)4, consistent with the observation that gxy > gz.16 The calculated value of λ ≈ −100 K is of the order expected for Ni2+ in such an environment. The value of D = 6.2(1) K obtained here is in excellent agreement with that extracted from magnetization measurements and consistent with that obtained from the χ(T) data.
NiI2(3,5-lut)4
NiI2(3,5-lut)4 has been previously characterized by Williams et al.19 and exhibits easy-axis single-ion anisotropy with D = −1.2(3) K, which was extracted from inelastic neutron scattering measurements. Pulsed-field magnetization shows a very high saturation field relative to the other compounds reported here, indicating strong antiferromagnetic interactions of J = 17.5(1) K along the Ni–I···I–Ni chains. NiI2(3,5-lut)4 was also shown to lie in the Haldane phase with anisotropic energy gaps of Δ∥ = 5.3(1) and Δ⊥ = 7.7(1) K. The structural and Hamiltonian parameters of NiI2(3,5-lut)4 will be used in the discussion below.
Discussion
The magnetic parameters of NiF2(3,5-lut)4·2H2O and NiX2(3,5-lut)4 (X = HF2, Cl, Br, or I) are summarized in Table 3. Magnetometry measurements show that NiF2(3,5-lut)4·2H2O and NiCl2(3,5-lut)4 exhibit no magnetic interactions between adjacent Ni2+ ions, and modeling the susceptibility and magnetization data give the same D parameters within errors. In the case of Ni(HF2)2(3,5-lut)4, the D parameter extracted from ESR measurements is in excellent agreement with that found from the susceptibility data. The magnetization data do not provide any additional information in this particular case as the crystal shatters upon application of a significant field parallel to the hard direction, an effect that has also been observed previously.50 The dM/dH curves of NiBr2(3,5-lut)4 are significantly different from that of NiCl2(3,5-lut)4. There is a peak indicating the presence of magnetic interactions, which is supported by fitting the susceptibility data to a a mean-field correction to account for the exchange term. High-frequency ESR measurements confirm the value of single-ion anisotropy of NiBr2(3,5-lut)4, which is in excellent agreement with that extracted from the magnetization data.
Table 3. Experimentally Derived Parameters for NiF2(3,5-lut)4·2H2O and NiX2(3,5-lut)4a.
| X | J (K) | D (K) | g factor |
|---|---|---|---|
| F | ≈0 | 8.7(4) | gxy = 2.12(1) |
| gz = 2.13(1) | |||
| HF2 | ≈0 | 11.0(1)* | gxy = 2.22(1)* |
| gz = 2.16(1)* | |||
| Cl | ≈0 | 9.6(7) | g̃ = 2.16(1) |
| Br | 0.85(7) | 6.1(5) | gxy = 2.20(1)* |
| gz = 2.08(1)* | |||
| I | 17.5(1) | –1.2(3) | gxy = 2.19(1)* |
| gz = 2.13(1)* |
All values are determined from magnetometry data, except those marked with an asterisk, which are derived from ESR measurements.
Here we will discuss the trends linking the structure and composition (Tables 1 and 2) to the magnetic exchange and the anisotropy.
Exchange Interactions
Starting with X = Cl, Br, and I, as the size of bridging halogens increases, adjacent Ni2+ ions move closer together along the z-axis and strong magnetic interactions are turned on from X = Cl → I as indicated by the difference in shape of the dM/dH data for these compounds. There is also a corresponding decrease in the X···X distance (LX···X), with X = I having the smallest separation. In each case, this separation exceeds twice the van der Waals radii for the halides (1.80, 1.95, and 2.10 Å for Cl, Br, and I, respectively) (Table 2). The difference is smallest for X = I (∼0.1 Å) and increases for NiBr2(3,5-lut)4 (∼1 Å) and NiCl2(3,5-lut)4. This is surprising given the measured antiferromagnetic interaction energies in both the X = Br and I materials and implies an efficient through-space mechanism for mediating these interactions. The crystal structures are modeled by treating all atoms and/or ions as spherical shapes. We believe that the heavier halides such as Br– and I– become increasingly aspherical or polarized along the c-axis. This will cause their respective shapes to elongate and enhance their potential for magnetic interactions.
NiF2(3,5-lut)4·2H2O and Ni(HF2)2(3,5-lut)4 follow a separate trend from the other materials due to their structural differences. The smallest nickel–nickel distance (LNi–Ni) is found in NiF2(3,5-lut)4·2H2O, while Ni(HF2)2(3,5-lut)4 has the largest LNi–Ni. The F···F distance linking F atoms on different Ni–HF2 moieties is also ∼0.1 Å more than twice the van der Waals radius of fluorine. This length scale of the halide···halide distance is similar to that found for NiI2(3,5-lut)4. However, the magnetometry data show that there are no antiferromagnetic interactions in either NiF2(3,5-lut)4·2H2O and Ni(HF2)2(3,5-lut)4.
Single-Ion Anisotropy
Another trend linking structure and composition to magnetic parameters in our compounds is the increase in the axial Ni–halogen bond (LNi–X) relative to the equatorial Ni2+–nitrogen bond (LNi–N) in the NiX2N4 octahedron. This is accompanied by a corresponding decrease in D, such that easy-plane anisotropy is suppressed at the extreme end of the family, and the axially elongated NiI2N4 octahedron in NiI2(3,5-lut)4 actually gives rise to easy-axis anisotropy. Furthermore, the NiF2N4 octahedra in NiF2(3,5-lut)4·2H2O and Ni(HF2)2(3,5-lut)4 are both axially compressed, but we find that both materials display strong easy-plane anisotropy. All of this behavior contradicts the simplest predictions that increasingly elongated Ni2+ octahedra should correspond to an increasingly more positive D parameter.16,52,53
The variation in anisotropy on changing the axial ligands involved in the NiX2N4 octahedra in our family of materials fits with the picture16 that for mixed-ligand complexes the relative values of the axial and equatorial crystal-field strength and covalency are additional factors in establishing the size and sign of D. To explore these issues further, Figure 11 plots the value of D as a function of both the axial/equatorial Ni–L bond length ratio and the bonded atom electronegativity ratio54 for a number of different materials with NiX2N4 local environments. Although the relationship between covalency (or orbital reduction factor) and electronegativity is not straightforward and the electronegativity of the bonded atom may not be entirely representative of the effect of the coordinated ligand as a whole, certain trends are highlighted by the figure. For materials in which the halogen remains unchanged, specifically those with F and Cl axial ligands, the electronegativity ratio is fixed. In this case, the simple picture is upheld and D becomes more positive as the axial bond weakens and the octahedron elongates. However, when the coordinated halide changes, the effect of reducing the electronegativity competes with the lengthening of the axial bond. For compounds in which there is a significant difference between the electronegativity of the axial and equatorial ligands, the sign of D can be estimated with confidence. The Ni–F axial bond, for example, has by far the most ionic character and yields a consistently easy-plane magnet in all cases here and for several other materials with NiF2N4 octahedra.21 At the other end of the scale, we would expect that a NiI2N4 environment would consistently yield an easy-axis anisotropy, as is the case here for NiI2(3,5-lut)4. The situation for an electronegativity ratio closer to unity is less clear, with NiCl2(3,5-lut)4 exhibiting greater axial elongation and a D that is slightly more positive than that of NiF2(3,5-lut)4·2H2O, despite the decreased electronegativity ratio. Furthermore, while NiBr2(3,5-lut)4 exhibits a slightly easy-plane D, recent neutron diffraction measurements are indicative of easy-axis behavior for NiBr2(pyz)2, which contains the same NiBr2N4 octahedra,51 suggesting that, in this case at least, the coordinated molecule must be considered as a whole.
Figure 11.

Bond length and bonded atom electronegativity dependence of D for NiX2(3,5-lut)4 (X = HF2, Cl, Br, or I), NiF2(3,5-lut)4·2H2O, NiCl2(pyz)2,20,51 NiF2(pyz)2·3H2O,21 and [Ni(pyz)2(HF2)2](SbF6).32 The compounds presented in this paper are labeled with Xlut, with their NiX2(pyz)2 relatives labeled with Xpyz. The larger red circles are strongly easy-plane, and the smaller bluer circles correspond to an easy-axis D.
Gapped Ground States
The ground state of an S = 1 AFM chain depends on the size of the J⊥/J and D/J ratios. The complete phase diagram for these systems displays Ising and XY-ordered states along with two gapped phases: the Haldane and quantum paramagnetic states (see Figure 1).18 It has already been shown that NiI2(3,5-lut)4 is a highly isotropic [D/J = −0.07(1)] example of a Haldane chain.19 In addition, because it displays no magnetic order even when the Haldane gap has been closed by the application of an applied magnetic field, the value of J⊥ in this material is believed to be extremely small. The similarity between the interchain structure in our family of samples suggests that J⊥ will also be small for NiBr2(3,5-lut)4. This, together with the measured D/J ratio, predicts that this material would lie in the quantum paramagnetic state (see Figure 1). While we see no direct evidence of the anticipated spin gap in the data, it seems that the gap is observed clearly only in magnetometry measurements of single crystals (see, for example, Sr3NiPtO655 and DTN)13 but is not apparent in powdered samples like ours (see the data for NENC,56 which has a D/J ratio of 15 and is known to reside in the QPM phase from the results of heat capacity56 and EPR measurements).57
The ability to populate experimentally underexplored phase diagrams via chemically simple substitution is a benefit to studying molecule-based magnets. In addition, their often low interaction energies mean their novel quantum critical behavior lies well within an experimentally accessible regime. Measurements are underway on the newly synthesized doped compound Ni(BrxI1–x)2(3,5-lut)4 to further probe these gapped phases using chemical pressure.
Summary
We have successfully characterized four new related Ni2+-chain compounds. This enabled us to study the effect that different halide ions have on single-ion anisotropy and two-halide exchange in isolation. NiF2(3,5-lut)4·2H2O, Ni(HF2)2(3,5-lut)4, NiCl2(3,5-lut)4, and NiBr2(3,5-lut)4 have all been shown to exhibit easy-plane single-ion anisotropy. Magnetometry data suggest that the compounds with axial F, HF2, and Cl ligands contain negligible magnetic exchange with D = 8.7(1), 11.0(1), and 9.6(7) K, respectively. Magnetization measurements indicate that NiBr2(3,5-lut)4 contains magnetic exchange along the Ni2+ chains with J = 0.85(7) K and a value of D = 6.1(5) K, which is confirmed by ESR. NiI2(3,5-lut)4 was found to be weakly easy-axis, with D = −1.2(3) K with strong magnetic exchange interactions J = 17.5(1) K. We have shown that the different halides drastically alter the magnetic properties. The single-ion anisotropy is strongly influenced not only by the distortion of the local octahedra but also by the relative size of the electronegativity of the axial and equatorial ligands. As a result, in general for systems with Ni2+ octahedra, we would expect D > 0 for strongly electronegative axial ligands (such fluorine) even when the octahedron is axially compressed but D < 0 in the case of weakly electronegative axial ligands (for example iodine) even when the octahedron is axially compressed. At the same time, upon substitution of larger halide ions into the magnetic exchange pathway, the LX···X distance decreases and J significantly increases. The size of the LX···X distances implies a through-space pathway for the exchange in the X = Br and I systems. It is expected that there will be extreme sensitivity to tuning LX···X on J via the application of strain and pressure in these types of materials. While further study is required to fully understand this through-space mechanism, it is clear that this is a novel kind of exchange pathway that can be exploited in the design of bespoke magnetic materials.
Acknowledgments
This project has received funding from the European Research Council (ERC) under the European Union’s 2020 research and innovative programme 10 (Grant Agreement 681260). This work is also supported by the EPSRC. Data presented in this paper resulting from the UK effort will be made available at http://wrap.warwick.ac.uk/160235/. The authors thank Nicholas Chilton, Gemma Gransbury, Stephen Blundell, Rebecca Scatena, and Tom Lancaster for fruitful discussions. The authors would like to thank Tom Orton and Patrick Ruddy for technical assistance. Work at the National High Magnetic Field Laboratory is supported by National Science Foundation (NSF) Cooperative Agreements DMR-1157490 and DMR 1164477, the State of Florida, and the U.S. Department of Energy (DoE). J.S. acknowledges funding from the DoE BES “Science in 100 T” program and thanks Oxford University for the provision of a visiting professorship. NSF’s ChemMatCARS Sector 15 is principally supported by the Divisions of Chemistry (CHE) and Materials Research (DMR), National Science Foundation, under Grant NSF/CHE-1346572. Use of the Advanced Photon Source, an Office of Science User Facility operated for the DoE Office of Science by Argonne National Laboratory, was supported by the U.S. DoE under Contract DE-AC02-06CH11357. The work at Eastern Washington University was supported by the NSF through Grant DMR-1703003 and DMR-2104167. J.L.M. gratefully acknowledges the NSF (CHE-1827313) for purchase of the single-crystal X-ray diffractometer at Whitworth University.
Supporting Information Available
The Supporting Information is available free of charge at https://pubs.acs.org/doi/10.1021/acs.inorgchem.1c02483.
Accession Codes
CCDC 2074899–2074902 contain the supplementary crystallographic data for this paper. These data can be obtained free of charge via www.ccdc.cam.ac.uk/data_request/cif, or by emailing data_request@ccdc.cam.ac.uk, or by contacting The Cambridge Crystallographic Data Centre, 12 Union Road, Cambridge CB2 1EZ, UK; fax: +44 1223 336033.
The authors declare no competing financial interest.
Supplementary Material
References
- Advanced information, Nobel Prize. 2016. (http://www.nature.com/doifinder/10.1038/news.2010.620, http://arxiv.org/abs/1011.4680).
- Fujita M. In Metal Frameworks; MacGillivray L. R., Ed.; John Wiley & Sons, Inc.: Hoboken, NJ, 2010; pp 1–35. [Google Scholar]
- Goddard P. A.; Manson J. L.; Singleton J.; Franke I.; Lancaster T.; Steele A. J.; Blundell S. J.; Baines C.; Pratt F. L.; McDonald R. D.; Ayala-Valenzuela O. E.; Corbey J. F.; Southerland H. I.; Sengupta P.; Schlueter J. A. Dimensionality selection in a molecule-based magnet. Phys. Rev. Lett. 2012, 108, 077208. 10.1103/PhysRevLett.108.077208. [DOI] [PubMed] [Google Scholar]
- Cortijo M.; Herrero S.; Jiménez-Aparicio R.; Matesanz E. Modulation of the magnetic properties of two-dimensional compounds [NiX2(N-N)] by tailoring their crystal structure. Inorg. Chem. 2013, 52, 7087–7093. 10.1021/ic400632c. [DOI] [PubMed] [Google Scholar]
- Gruden-Pavlović M.; Perić M.; Zlatar M.; García-Fernández P. Theoretical study of the magnetic anisotropy and magnetic tunnelling in mononuclear Ni(II) complexes with potential molecular magnet behavior. Chem. Sci. 2014, 5, 1453. 10.1039/c3sc52984c. [DOI] [Google Scholar]
- Marriott K. E.; Bhaskaran L.; Wilson C.; Medarde M.; Ochsenbein S. T.; Hill S.; Murrie M. Pushing the limits of magnetic anisotropy in trigonal bipyramidal Ni(II). Chem. Sci. 2015, 6, 6823. 10.1039/C5SC02854J. [DOI] [PMC free article] [PubMed] [Google Scholar]
- Dos Santos L. H. R.; Lanza A.; Barton A. M.; Brambleby J.; Blackmore W. J. A.; Goddard P. A.; Xiao F.; Williams R. C.; Lancaster T.; Pratt F. L.; Blundell S. J.; Singleton J.; Manson J. L.; Macchi P. Experimental and Theoretical Electron Density Analysis of Copper Pyrazine Nitrate Quasi-Low-Dimensional Quantum Magnets. J. Am. Chem. Soc. 2016, 138, 2280–2291. 10.1021/jacs.5b12817. [DOI] [PubMed] [Google Scholar]
- Yasuda C.; Todo S.; Hukushima K.; Alet F.; Keller M.; Troyer M.; Takayama H. Néel Temperature of Quasi-Low-Dimensional Heisenberg Antiferromagnets. Phys. Rev. Lett. 2005, 94, 217201. 10.1103/PhysRevLett.94.217201. [DOI] [PubMed] [Google Scholar]
- Goddard P. A.; Singleton J.; Sengupta P.; McDonald R. D.; Lancaster T.; Blundell S. J.; Pratt F. L.; Cox S.; Harrison N.; Manson J. L.; Southerland H. I.; Schlueter J. A. Experimentally determining the exchange parameters of quasi-two-dimensional Heisenberg magets. New J. Phys. 2008, 10, 083025. 10.1088/1367-2630/10/8/083025. [DOI] [Google Scholar]
- Landee C. P.; Turnbull M. M. Recent Developments in Low-Dimensional Copper(II) Molecular Magnets. Eur. J. Inorg. Chem. 2013, 2013, 2266–2285. 10.1002/ejic.201300133. [DOI] [Google Scholar]
- Goddard P. A.; et al. Control of the third dimension in copper-based square-lattice antiferromagnets. Phys. Rev. B: Condens. Matter Mater. Phys. 2016, 93, 094430. 10.1103/PhysRevB.93.094430. [DOI] [Google Scholar]
- Zheludev A.; Roscilde T. Dirty-boson physics with magnetic insulators. C. R. Phys. 2013, 14, 740–756. 10.1016/j.crhy.2013.10.001. [DOI] [Google Scholar]
- Zapf V.; Jaime M.; Batista C. D. Bose–Einstein condensation in quantum magnets. Rev. Mod. Phys. 2014, 86, 563–614. 10.1103/RevModPhys.86.563. [DOI] [Google Scholar]
- Brambleby J.; Goddard P. A.; Singleton J.; Jaime M.; Lancaster T.; Huang L.; Wosnitza J.; Topping C. V.; Carreiro K. E.; Tran H. E.; Manson Z. E.; Manson J. L. Adiabatic physics of an exchange-coupled spin-dimer system: Magnetocaloric effect, zero-point fluctuations, and possible two-dimensional universal behavior. Phys. Rev. B: Condens. Matter Mater. Phys. 2017, 95, 024404. 10.1103/PhysRevB.95.024404. [DOI] [Google Scholar]
- Savary L.; Balents L. Quantum spin liquids: a review. Rep. Prog. Phys. 2017, 80, 016502. 10.1088/0034-4885/80/1/016502. [DOI] [PubMed] [Google Scholar]
- Boča R. Zero-field splitting in metal complexes. Coord. Chem. Rev. 2004, 248, 757. 10.1016/j.ccr.2004.03.001. [DOI] [Google Scholar]
- Wierschem K.; Sengupta P. Quenching the Haldane Gap in Spin-1 Heisenberg Antiferromagnets. Phys. Rev. Lett. 2014, 112, 247203. 10.1103/PhysRevLett.112.247203. [DOI] [PubMed] [Google Scholar]
- Wierschem K.; Sengupta P. Characterizing the Haldane phase in quasi-one-dimensional spin-1 Heisenberg antiferromagnets. Mod. Phys. Lett. B 2014, 28, 1430017. 10.1142/S0217984914300178. [DOI] [PubMed] [Google Scholar]
- Williams R. C.; et al. Near-ideal molecule-based Haldane spin chain. Phys. Rev. Res. 2020, 2, 013082. 10.1103/PhysRevResearch.2.013082. [DOI] [Google Scholar]
- Liu J.; et al. Antiferromagnetism in a Family of S = 1 Square Lattice Coordination Polymers NiX2(pyz)2 (X = Cl, Br, I, NCS; pyz = Pyrazine). Inorg. Chem. 2016, 55, 3515–3529. 10.1021/acs.inorgchem.5b02991. [DOI] [PubMed] [Google Scholar]
- Manson J. L.; et al. Enhancing easy-plane anisotropy in bespoke Ni(II) quantum magnets. Polyhedron 2020, 180, 114379. 10.1016/j.poly.2020.114379. [DOI] [Google Scholar]
- Hammar P. R.; Reich D. H.; Broholm C.; Trouw F. Spin gap in a quasi-one-dimensional S = 1/2 antiferromagnet: Cu2(1,4-diazacycloheptane)2Cl4. Phys. Rev. B: Condens. Matter Mater. Phys. 1998, 57, 7846–7853. 10.1103/PhysRevB.57.7846. [DOI] [Google Scholar]
- Hammar P. R.; Stone M. B.; Reich D. H.; Broholm C.; Gibson P. J.; Turnbull M. M.; Landee C. P.; Oshikawa M. Characterization of a Quasi-One Dimensional Spin-1/2 Magnet which is Gapless and Paramagnetic for gμBH ≲ J and kBT ≪. Phys. Rev. B: Condens. Matter Mater. Phys. 1999, 59, 1008–1015. 10.1103/PhysRevB.59.1008. [DOI] [Google Scholar]
- Manson J. L.; Conner M. M.; Schlueter J. A.; McConnell A. C.; Southerland H. I.; Malfant I.; Lancaster T.; Blundell S. J.; Brooks M. L.; Pratt F. L.; Singleton J.; McDonald R. D.; Lee C.; Whangbo M. H. Experimental and Theoretical Characterization of the Magnetic Properties of CuF2(H2O)2(pyz) (pyz = pyrazine): A Two-Dimensional Quantum Magnet Arising from Supersuperexchange Interactions through Hydrogen Bonded Paths. Chem. Mater. 2008, 20, 7408–7416. 10.1021/cm8016566. [DOI] [Google Scholar]
- Xiao F.; Woodward F. M.; Landee C. P.; Turnbull M. M.; Mielke C.; Harrison N.; Lancaster T.; Blundell S. J.; Baker P. J.; Babkevich P.; Pratt F. L. Two-dimensional XY behavior observed in quasi-two-dimensional quantum Heisenberg antiferromagnets. Phys. Rev. B: Condens. Matter Mater. Phys. 2009, 79, 134412. 10.1103/PhysRevB.79.134412. [DOI] [Google Scholar]
- Wierschem K.; Kato Y.; Nishida Y.; Batista C. D.; Sengupta P. Magnetic and nematic orderings in spin-1 antiferromagnets with single-ion anisotropy. Phys. Rev. B: Condens. Matter Mater. Phys. 2012, 86, 201108. 10.1103/PhysRevB.86.201108. [DOI] [Google Scholar]
- Nath R.; Padmanabhan M.; Baby S.; Thirumurugan A.; Ehlers D.; Hemmida M.; Krug von Nidda H.-A.; Tsirlin A. A. Quasi-two-dimensional S = 1/2 magnetism of Cu[C6H2(COO)4][C2H5NH3]2. Phys. Rev. B: Condens. Matter Mater. Phys. 2015, 91, 054409. 10.1103/PhysRevB.91.054409. [DOI] [Google Scholar]
- Zhang Z.; Wierschem K.; Yap I.; Kato Y.; Batista C. D.; Sengupta P. Phase diagram and magnetic excitations of anisotropic spin-one magnets. Phys. Rev. B: Condens. Matter Mater. Phys. 2013, 87, 174405. 10.1103/PhysRevB.87.174405. [DOI] [Google Scholar]
- Christian A. B.; Masunaga S. H.; Schye A. T.; Rebello A.; Neumeier J. J.; Yu Y.-K. Magnetic field influence on the Néel, dimer, and spin-liquid states of the low-dimensional antiferromagnets NiTa2O6 and CoSb2O6. Phys. Rev. B: Condens. Matter Mater. Phys. 2014, 90, 224423. 10.1103/PhysRevB.90.224423. [DOI] [Google Scholar]
- Lancaster T.; et al. Controlling magnetic order and quantum disorder in molecule-based magnets. Phys. Rev. Lett. 2014, 112, 207201. 10.1103/PhysRevLett.112.207201. [DOI] [Google Scholar]
- Manson J. L.; et al. Implications of bond disorder in a S = 1 kagome lattice. Sci. Rep. 2018, 8, 4745. 10.1038/s41598-018-23054-6. [DOI] [PMC free article] [PubMed] [Google Scholar]
- Brambleby J.; et al. Combining microscopic and macroscopic probes to untangle the single-ion anisotropy and exchange energies in an S = 1 quantum antiferromagnet. Phys. Rev. B: Condens. Matter Mater. Phys. 2017, 95, 134435. 10.1103/PhysRevB.95.134435. [DOI] [Google Scholar]
- Blackmore W. J. A.; et al. Determining the anisotropy and exchange parameters of polycrystalline spin-1 magnets. New J. Phys. 2019, 21, 093025. 10.1088/1367-2630/ab3dba. [DOI] [Google Scholar]
- Schlueter J. A.; et al. Importance of Halogen–Halogen Contacts for the Structural and Magnetic Properties of CuX2(pyrazine-N,N’-dioxide)(H2O)2(X = Cl and Br). Inorg. Chem. 2012, 51, 2121–2129. 10.1021/ic201924q. [DOI] [PubMed] [Google Scholar]
- Lapidus S. H.; Manson J. L.; Park H.; Clement A. J.; Ghannadzadeh S.; Goddard P.; Lancaster T.; Möller J. S.; Blundell S. J.; Telling M. T. F.; Kang J.; Whangbo M.-H.; Schlueter J. A. Antiferromagnetic ordering through a hydrogen-bonded network in the molecular solid CuF2(H2O)2(3-chloropyridine). Chem. Commun. 2013, 49, 499–501. 10.1039/C2CC37444G. [DOI] [PubMed] [Google Scholar]
- Lancaster T.; Blundell S. J.; Pratt F. L.; Brooks M. L.; Manson J. L.; Brechin E. K.; Cadiou C.; Low D.; McInnes E. J. L.; Winpenny R. E. P. Muons as a probe of magnetism in molecule-based low dimensional magnets. J. Phys.: Condens. Matter 2004, 16, S4563–S4582. 10.1088/0953-8984/16/40/009. [DOI] [Google Scholar]
- Houton E.; Taylor S. M.; Beedle C. C.; Cano J.; Piligkos S.; Hill S.; Ryder A. G.; Brechin E. K.; Jones L. F. Ferromagnetic exchange in a twisted, oxime-bridged [Mn2III] dimer. Dalt. Trans. 2012, 41, 8340. 10.1039/c2dt30674c. [DOI] [PubMed] [Google Scholar]
- Teki Y.; Takui T.; Itoh K. General conditions for the occurrence of off-axis extra lines in powder-pattern ESR fine structure. J. Chem. Phys. 1988, 88, 6134–6145. 10.1063/1.454505. [DOI] [Google Scholar]
- Krzystek J.; Ozarowski A.; Telser J. Multi-frequency, high-field EPR as a powerful tool to accurately determine zero-field splitting in high-spin transition metal coordination complexes. Coord. Chem. Rev. 2006, 250, 2308–2324. 10.1016/j.ccr.2006.03.016. [DOI] [Google Scholar]
- Wasserman E.; Snyder L. C.; Yager W. A. ESR of the triplet states of randomly oriented molecules. J. Chem. Phys. 1964, 41, 1763–1772. 10.1063/1.1726156. [DOI] [Google Scholar]
- Butcher R. T.; Novoa J. J.; Ribas-Ariño J.; Sandvik A. W.; Turnbull M. M.; Landee C. P.; Wells B. M.; Awwadi F. F. Strong through-space two-halide magnetic exchange of −234 K in (2,5-dimethylpyrazine)copper(ii) bromide. Chem. Commun. 2009, 1359–1361. 10.1039/b819894b. [DOI] [PubMed] [Google Scholar]
- Turnbull M. M.; Landee C. P.; Wells B. M. Magnetic exchange interactions in tetrabromocuprate compounds. Coord. Chem. Rev. 2005, 249, 2567–2576. 10.1016/j.ccr.2005.01.015. [DOI] [Google Scholar]
- Atzori M.; Serpe A.; Deplano P.; Schlueter J. A.; Mercuri M. L. Tailoring magnetic properties of molecular materials through non-covalent interactions. Inorg. Chem. Front. 2015, 2, 108–115. 10.1039/C4QI00179F. [DOI] [Google Scholar]
- Kenessey G.; Lashgari K.; Machula G.; Liptay G.; Snoeck R.; Balzarini J.; Fransson B.; Ragnarsson U.; Francis G. W. Pyridine-Type Complexes of Transition-Metal Halides. VIII. Preparation, Characterization and Single-Crystal Structure of Difluorotetrakis(3,5-dimethylpyridine)cobalt(II).n Hydrate [n ∼ = 2.6(3)]. Acta Chem. Scand. 1994, 48, 705–710. 10.3891/acta.chem.scand.48-0705. [DOI] [Google Scholar]
- Batsanov S. S. Van der Waals radii of elements. Inorg. Mater. 2001, 37, 871–885. 10.1023/A:1011625728803. [DOI] [Google Scholar]
- Kahn O.Molecular Magnetism; Whiley-VCH, 1993. [Google Scholar]
- Lancaster T. Private communication, 2020.
- Gukasov A.; Brown P. J. Determination of atomic site susceptibility tensors from neutron diffraction data on polycrystalline samples. J. Phys.: Condens. Matter 2010, 22, 502201. 10.1088/0953-8984/22/50/502201. [DOI] [PubMed] [Google Scholar]
- Carlin R. L.; De Jongh L. J. Structural and magnetic properties of transition metal complexes of pyridine N-oxide. Chem. Rev. 1986, 86, 659–680. 10.1021/cr00074a001. [DOI] [Google Scholar]
- Curley S. P.; Scatena R.; Williams R. C.; Goddard P. A.; Macchi P.; Hicken T. J.; Lancaster T.; Xiao F.; Blundell S. J.; Zapf V.; Eckert J. C.; Krenkel E. H.; Villa J. A.; Rhodehouse M. L.; Manson J. L. Magnetic ground state of the one-dimensional ferromagnetic chain compounds M(NCS)2(thiourea)2 (M = Ni,Co). Phys. Rev. Mater. 2021, 5, 034401. 10.1103/PhysRevMaterials.5.034401. [DOI] [Google Scholar]
- Manson J. L.; et al. Magnetic order and excitations in S = 1 square lattices NiX2(pyrazine)2 (X = Cl, Br, I). Manuscript in preparation, 2021.
- Ivaniková R.; Boča R.; Dlháň L.; Fuess H.; Mašlejová A.; Mrázová V.; Svoboda I.; Titiš J. Heteroleptic nickel(II) complexes formed from N-donor bases, carboxylic acids and water: Magnetostructural correlations. Polyhedron 2006, 25, 3261–3268. 10.1016/j.poly.2006.05.040. [DOI] [Google Scholar]
- Titiš J.; Boča R.; Dlháň L.; Ďurčeková T.; Fuess H.; Ivaniková R.; Mrázová V.; Papánková B.; Svoboda I. Magnetostructural correlations in heteroleptic nickel(II) complexes. Polyhedron 2007, 26, 1523–1530. 10.1016/j.poly.2006.11.054. [DOI] [Google Scholar]
- Allred A. Electronegativity values from thermochemical data. J. Inorg. Nucl. Chem. 1961, 17, 215–221. 10.1016/0022-1902(61)80142-5. [DOI] [Google Scholar]
- Chattopadhyay S.; Jain D.; Ganesan V.; Giri S.; Majumdar S. Observation of large-D magnetic phase in Sr3NiPtO6. Phys. Rev. B: Condens. Matter Mater. Phys. 2010, 82, 094431. 10.1103/PhysRevB.82.094431. [DOI] [Google Scholar]
- Orendáč M.; Orendáčová A.; Černák J.; Feher A.; Signore P. J. C.; Meisel M. W.; Merah S.; Verdaguer M. Thermodynamic and magnetic properties of the S = 1 Heisenberg chain Ni(C2H8N2)2Ni(CN)4: Experiments and theory. Phys. Rev. B: Condens. Matter Mater. Phys. 1995, 52, 3435–3440. 10.1103/PhysRevB.52.3435. [DOI] [PubMed] [Google Scholar]
- Zvyagin S. A.; Rieth T.; Sieling M.; Schmidt S.; Lüthi B. Magnetic excitation spectrum in large-D chain NENC. Czech. J. Phys. 1996, 46, 1937–1938. 10.1007/BF02570960. [DOI] [Google Scholar]
Associated Data
This section collects any data citations, data availability statements, or supplementary materials included in this article.