Abstract
The new type of coronavirus disease, which has spread from Wuhan, China since the beginning of 2020 called COVID-19, has caused many deaths and cases in most countries and has reached a global pandemic scale. In addition to test kits, imaging techniques with X-rays used in lung patients have been frequently used in the detection of COVID-19 cases. In the proposed method, a novel approach based on a deep learning model named DeepCovNet was utilized to classify chest X-ray images containing COVID-19, normal (healthy), and pneumonia classes. The convolutional-autoencoder model, which had convolutional layers in encoder and decoder blocks, was trained by using the processed chest X-ray images from scratch for deep feature extraction. The distinctive features were selected with a novel and robust algorithm named SDAR from the deep feature set. In the classification stage, an SVM classifier with various kernel functions was used to evaluate the classification performance of the proposed method. Also, hyperparameters of the SVM classifier were optimized with the Bayesian algorithm for increasing classification accuracy. Specificity, sensitivity, precision, and F-score, were also used as performance metrics in addition to accuracy which was used as the main criterion. The proposed method with an accuracy of 99.75 outperformed the other approaches based on deep learning.
Keywords: COVID-19, Convolutional-autoencoder model, Feature selection, Bayesian algorithm
Introduction
The number of cases and deaths is increasing day by day due to the COVID-19 pandemic, which emerged in the last months of 2019 and spread all over the world in a short period of 5 months [1]. Many countries, such as the USA, Brazil, India, Turkey, England, and Canada are on the brink of the second wave in combating coronavirus disease. By November 2020, more than 48 million cases were detected worldwide, and the death rate in these cases was recorded as 2.51%. The health systems of many countries came to the point of collapse due to a rapid increase in the number of cases [2]. Besides, countries with a high number of cases have imposed a curfew for their citizens since the COVID-19 virus spreads very rapidly through breathing. Under these circumstances, social life has been negatively affected, and economic crises have broken out in many countries.
Early detection is essential to prevent the spread of the COVID-19 virus. For this, a large number of test processes that give fast results are required. The RT-PCR test is the most commonly used method to detect the COVID-19 virus in cases that come to health centers with symptoms such as cough, fever, shortness of breath, loss of taste and smell, and weakness [3]. The samples in the RT-PCR test are collected by nasopharyngeal swab or oropharyngeal swab. The samples are evaluated in test kits by experts in the laboratory environment. After a few days, the RT-PCR test result is taken as positive or negative. This testing process is time-consuming and test results are not highly reliable. Also, it is very difficult for all countries to supply a sufficient number of test kits due to the pandemic [4]. For this reason, radiological imaging techniques, which constitute chest X-ray (CXR) and computed tomography (CT) images, have been also used to detect the COVID-19 virus throughout the pandemic. CT scan machines provide the most accurate and sensitive results for the diagnosis of COVID-19, however, they are not available in every health center as they are expensive. CXR images are frequently used in the diagnosis of COVID-19 due to their fast results and cheap supply. Despite these advantages of using CXR images, there are not enough radiologists in hospitals, and radiologists have to diagnose hundreds of CXR images a day [5]. In this context, machine learning-based computer-aided systems can provide great convenience to experts in detecting COVID-19 cases from CXR images and prevent false detections caused by workload.
Up to now, deep learning, which is a subset of machine learning based on neural networks that enable a machine to train itself to carry out a duty, has been used in many tasks such as image classification, environmental sound classification, and biomedical signal classification [6–12]. Generally, deep learning approaches have outperformed hand-crafted-based machine learning approaches [13, 14]. Therefore, deep learning techniques have frequently been preferred for automated COVID-19 virus detection. Ucar et al. [15] used the Squeeze Net model, in which the hyperparameters are optimized by a Bayesian algorithm, for automatic diagnosis of COVID-19 disease. The proposed model achieved an accuracy of 98.26% for 3-class categorization. Aras et al. [16] utilized a hybrid method containing fine-tuning, deep feature, end-to-end training algorithms. The authors reached a success rate of 0.92 for binary classification composed of COVID-19 and normal classes. Khan et al. [17] proposed Xception pre-trained CNN structure for applying the transfer learning technique. The proposed model provided an accuracy of 95% for 3 classes composed of normal, COVID-19, and pneumonia. Pathak et al. [18] extracted deep features by using the ResNet model for binary classification. Also, the authors used cost-sensitive features for increasing classification performance. The best accuracy was 93.018% with this method. Oh et al. [19] proposed a segmentation and classification method for the COVID-19 problem. For segmentation and classification, the authors used FC-DenseNet and ResNet-18 models. The best sensitivity and precision scores were 94.33% and 87.63%, respectively. Zhang et al. [20] utilized a deep domain adaption algorithm. With this algorithm, COVID- 19 cases were classified by defining the similar and different characteristics between COVID-19 and pneumonia. Sethy et al. [21] used ResNet50 pre-trained model to extract deep features from CXR images. This model reached a 95.3% accuracy score with the Support Vector Machine (SVM) classifier. Ozturk et al. [22] used a stack model named the DarkNet model, which included 17 convolutional layers. Different filtering techniques for each layer were applied in the proposed model. For 2-class and 3-class classification, the best accuracies were 98.08% and 87.02%, respectively. Gour et al. [23] extracted deep features from a pre-trained VGG19 model and a new model containing 30 layers. The classification was performed with a logistic regression algorithm. Narin et al. [24] used different pre-trained models such as ResNet50, InceptionV3, and ResNetV2 for detecting the COVID-19 virus automatically. The best accuracy score was achieved as 98% with the ResNet50 pre-trained model. Butt et al. [25] utilized the Hounsfield scale (HU) values for pre-processing stage and a 3D CNN model for deep feature extraction. Mangal et al. [26] proposed a 121 layered ChexNet model composed of convolutional and dense layers. The highest accuracy was 90.5% for 3-class classification containing COVID-19, normal, and pneumonia class labels. Togacar et al. [27] utilized MobileNetV2 and SqueezeNet pre-trained models for automated COVID-19 detection. A stack feature set was constituted with these models. The best classification result was achieved with the SVM algorithm. Nour et al. [28] proposed an end-to-end learning model, which includes 5 convolutional layers, to classify COVID-19, pneumonia and normal classes. Turkoglu [29] proposed a transfer learning approach using a pre-trained AlexNet model to extract deep features from CXR images. Deep features were constituted from third dimension additions of each layer in the trained model. The SVM classifier provided a 99.18% accuracy for 3-class classification.
In this study, a convolutional-autoencoder (CA) model was proposed for detecting the COVID-19 virus automatically. Deep features were extracted from the compressed activations of the CA model. The SVM classifier is used in the classification stage. For increasing the classification performance, contributions and limitations of the DeepCovNet model can be stated as follows:
The gradient-based pre-processing operation was applied to raw CXR images.
Convolutional layers were used in the CA model instead of dense layers.
Distinctive deep features were selected by a new and effective algorithm (SDAR) containing a two-level process.
Hyperparameters of the SVM classifier were tuned with a Bayesian algorithm to give better performance.
If the size of the input images is increased during the training phase, the computational cost will increase.
The remainder of this work was organized as follows. The material and methods were explained in Sect. 2. The experimental works and results were mentioned in Sect. 3. The discussion and conclusion were explained in Sects. 4 and 5, respectively.
Materials and Methods
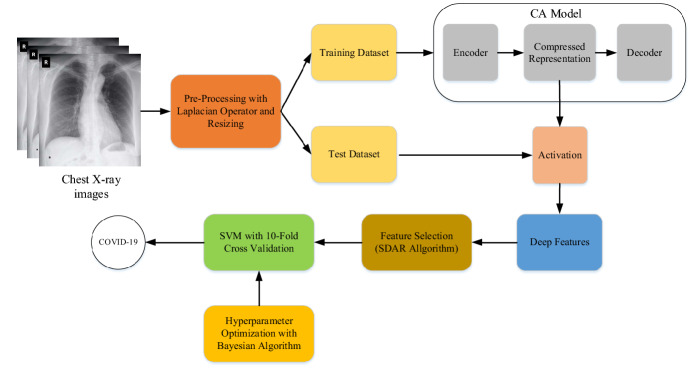
The illustration of the proposed method, which automatically detects the COVID-19 virus from CXR images, is given in Fig. 1. Firstly, the Laplacian-based gradient operation was applied to CXR images in the pre-processing stage of the proposed work. Then, the pre-processed images were resized to 100 × 100 pixels for reducing the hardware requirement. The dataset was randomly divided into two sets namely training and test datasets and the CA model was trained with the training dataset. The CA model, which was composed of a convolutional layer-based autoencoder architecture, was utilized to extract deep features. The encoder and decoder blocks in the CA model were composed of 3 convolutional layers and 4 convolutional layers, respectively. The layers of the CA model are given in Table 1. As shown in Table 1, the CA model was composed of an ordered structure containing 1 input layer, 5 convolutional layers, 3 max-pooling layers, and 3 up-sampling layers. The encoder and decoder of the CA model consisted of structures organized from the input layer named input_1 up to the convolutional layer named conv2d_3 and from the convolutional layer named conv2d_4 up to the convolutional layer named conv2d_7, respectively. The max-pooling layer named max_pooling2d_3 was used for the compressed representation that was utilized to extract deep features. The numbers of filters in the convolutional layer from conv2d_1 up to conv2d_7 were 32, 16, 8, 8, 16, 32, respectively. Also, the sizes of filters in the convolutional, max-pooling, and up-sampling layers were chosen 3, 2, and 2, respectively.
Fig. 1.
The illustration of the proposed method
Table 1.
Analysis of the CA model
| Layer (type) | Output size | Parameters |
|---|---|---|
| input_1 (Input Layer) | (100, 100, 1) | 0 |
| conv2d_1 (Conv2D) | (100, 100, 32) | 320 |
| max_pooling2d_1 (MaxPooling2) | (50, 50, 32) | 0 |
| conv2d_2 (Conv2D) | (50, 50, 16) | 4624 |
| max_pooling2d_2 (MaxPooling2) | (25, 25, 16) | 0 |
| conv2d_3 (Conv2D) | (25, 25, 8) | 1160 |
| max_pooling2d_3 (MaxPooling2) | (13, 13, 8) | 0 |
| conv2d_4 (Conv2D) | (13, 13, 8) | 584 |
| up_sampling2d_1 (UpSampling2) | (26, 26, 8) | 0 |
| conv2d_5 (Conv2D) | (26, 26, 16) | 1168 |
| up_sampling2d_2 (UpSampling2) | (52, 52, 16) | 0 |
| conv2d_6 (Conv2D) | (50, 50, 32) | 4640 |
| up_sampling2d_3 (UpSampling2) | (100, 100, 32) | 0 |
| conv2d_7 (Conv2D) | (100, 100, 1) | 289 |
| Total learnable parameters: 12,785 | ||
The deep features were extracted from the compressed activations (the max-pooling layer output which comes after the last convolutional layer in the encoder block) in the CA model. Then, the two-level feature selection process (SDAR algorithm) was performed in the deep feature set. In the first level, features were reduced with a threshold algorithm based on standard deviation and average values. In the second level, the reduced features were selected with positive feature importance weights in the RelifF algorithm. Finally, the SVM classifier, in which the hyperparameters were optimized with the Bayesian algorithm, was used in the classification stage.
Pre-processing
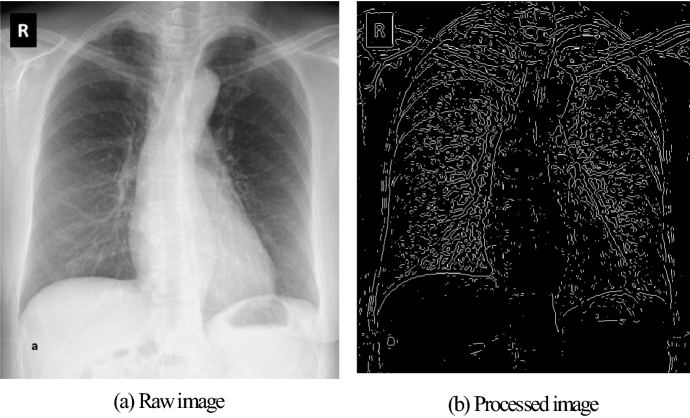
CXR pictures are morphologically similar to each other. As a result of the examinations, deformities and white spots were detected in the CXR images of COVID-19 cases. To make these changes more distinctive, the gradient operation with the Laplacian operator is applied to the CXR pictures [30, 31]. According to and variables of input, the gradient operation with Laplacian operator is defined as follows:
| 1 |
The output of the gradient operation is given in Fig. 2 for the CXR image of a COVID-19 case. As shown in Fig. 4b, only the draws related to the pattern are present in the CXR image.
Fig. 2.
Pre-processing for a CXR image
Fig. 4.
The representation of the CA model
Convolutional-Autoencoder (CA) Model
An autoencoder neural network is an unsupervised learning model and its purpose is to reconstitute output similar to the input while reducing the recreation error. If a training dataset is assumed to be {x1, x2,..., xn} for xi ∈ ℝn, the target of autoencoder is described to be yi = xi for i ∈ {1, 2,..., n}. In other words, the autoencoder output is targeted to be equal to its input. The autoencoder creates optimized compressed representations at the output of hidden layers, keeping this target function in mind. Therefore, the autoencoder learns the F (F(w,b)(x) x) feature space that changes according to the b bias vector and w weight vector [32]. The general statement of the autoencoder loss function is as follows:
| 2 |
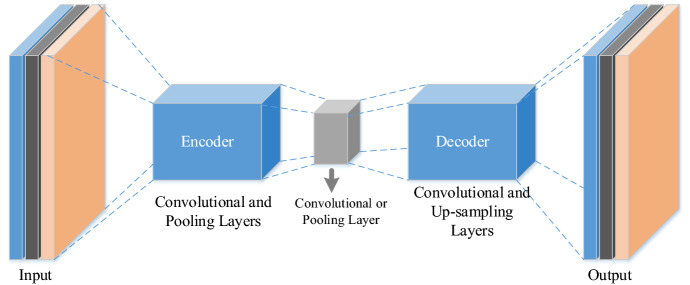
As shown in Fig. 3, a general autoencoder architecture consists of dense layers as in a multilayer perceptron.
Fig. 3.
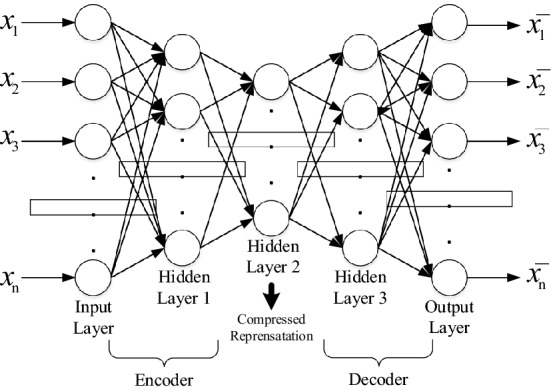
The general autoencoder architecture
The representation of the CA structure is given in Fig. 4. In the autoencoder model, convolutional and pooling layers are utilized for encoding operations, and convolutional and up-sampling layers are utilized for decoded operations. Also, the compressed representation is achieved with a convolutional layer or pooling layer. Moreover, autoencoder-based deep features are extracted from the output of compressed representation.
Convolutional layers are used as the main layer in deep learning-based approaches to extract distinctive features of different types of data in many areas. Convolutional operations are performed through filters containing learnable parameters such as weight and bias [33, 34]. Generally, the height and width of the input data do not change after convolutional processing. However, the depth increases depending on the number of filters. The convolutional operation between filter and input in a convolutional layer is defined as shown in Eq. 3.
| 3 |
where is the input data from previous layers, is the filter weight matrix, is the bias vector and is the input map. Also, represents an activation function such as rectified linear unit (ReLU), which is often used in convolutional layers.
Pooling layers are utilized for the down-sampling process in the deep learning approaches. Also, a pooling layer both prevents overfitting and decreases computational cost in the training stage [35]. Max-pooling, average-pooling, global max-pooling, and global average-pooling is utilized frequently in deep learning approaches.
The up-sampling layer functions the opposite of the pooling layer and must be used in autoencoder structures. In other words, the up-sampling layer enlarges the input transmitted to it with a certain interpolation operation such as nearest and bilinear.
In the deep learning models, stochastic gradient descent with momentum (SGDM), root mean square error probability (RMSprop), and adaptive moment estimation (ADAM) are used as robust optimization solvers. The performance of this solver can change according to the type and size of the data.
Feature Selection with SDAR Algorithm
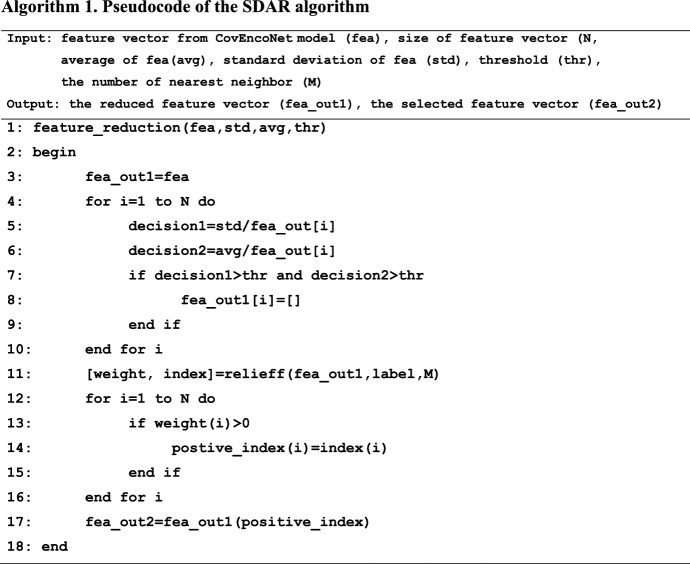
Deep features are created by taking the output from one of the sequential layers such as the convolutional layer and fully connected layer after training deep learning models. At the end of the optimization process, most of the values in these deep features highlight the characteristics of the sample more, while some of them show a weaker representation power. SDAR algorithm is utilized for increasing classification performance in the proposed approach. The pseudocode of the SDAR algorithm is given in Algorithm 1. In the first stage of the SDAR algorithm, the average and standard deviation of the normalized deep feature values are calculated. The standard deviation and average values are divided one by one to the deep feature values. If the results obtained are greater than the threshold value, that value is deleted from the deep feature vector. It is appropriate to choose the threshold value between 5 and 20 times the average value.
In the second stage of the SDAR algorithm, features having high representation power in the reduced feature set are selected by positive importance weight indices computed with the ReliefF. The ReliefF calculates the feature weights in case labels are multi-classes. The predictors that give different values to neighbors in the same class are punished. In other words, the predictors that give the same scores to neighbors in the same class are awarded a prize [36]. At the ReliefF algorithm, feature weights (Wk) are first adjusted to zero. Then, the ReliefF algorithm re-chooses a random prediction (xs), computes the k-nearest predictions to xs for each class, and updates according to each nearest neighbor (xt) [7, 37]. If the classes of xs and xt are the same, all the weights for the predictors (Pi), are as follows:
| 4 |
If the classes of xs and xt are different, all the weights for the predictors (Pi), are as follows:
| 5 |
where denotes the weight of the for the jth iteration, stands for the prior possibility of the category to which xa belongs, represents the previous possibility of the category to which xb belongs, t is the number of optimization iterations, and is the variation in the value of the predictor between the observation xa and the observation xb. For discrete situation, the can be stated as follows:
| 6 |
The distance functions and are expressed as follows:
| 7 |
| 8 |
where rank(a,b) is the location in the observation of bth between the nearest neighbors in the observation of ath, ranked by distance. M is the number of nearest neighbors.
Support Vector Machines (SVM)
SVM, which was developed by Vapnik, is used for classification and regression by performing statistical learning [38, 39]. The main target of SVM is to constitute the most convenient hyperplane by using support vectors between positive and negative data. Considering training data as x and class label as y, the used equation for separating linearly of positive and negative samples can be expressed as in Eq. 9.
| 9 |
The position of the hyperplane is determined with w weight and b bias vectors, which are learnable parameters. The optimization problem in Eq. 10 should be solved in Eq. 11 for finding the best hyperplane.
| 10 |
| 11 |
The Lagrange multipliers, which is an optimization method for learning the local maxima and minima of a function connected to equality limitations, are utilized to solve this optimization problem [40]. For the best hyperplane, the Lagrange multipliers are given in Eq. 7 subject to . Where and are the Lagrange multipliers and smoothing parameter, respectively.
| 12 |
For problems that cannot be separated linearly, samples are moved from the existing space to a different space. This transformation is performed using kernel functions symbolized as K. The most used kernel functions are Gaussian, RBF, polynomial, and cubic. The SVM decision function with the K kernel, which is expressed with and core functions, is given in Eq. 13.
| 13 |
The methods of one-versus-one and one-versus-all are the most used strategies in multi-class SVM classification problems [41].
Hyperparameter Optimization
The hyperparameters, which can be selected manually or automatically, in machine learning algorithms significantly affect the performance of the used methods. Manual selections require expertise, however, the hyperparameter choices of experts often do not provide optimum results on first attempts. Besides, it may be necessary to run the algorithms several times to fine-tune the hyperparameters [42]. The grid-search and random search-based optimization algorithms are mostly used for finding the best hyperparameters. However, the solution to the optimization problem with these algorithms requires time-consuming operation in deep learning models with big data. The Bayesian optimization algorithm is an efficient way to solve functions containing high computational costs [25]. For finding the global maximum value in a black-box function, the optimization target can be defined as follows:
| 14 |
where symbolizes the searching space in . Considering an evidence data D at the general Bayesian theorem, the posterior probability P(E|D) of pattern E can be calculated as:
| 15 |
where is a prior possibility, and is the likelihood of overserving D. The Bayesian optimization algorithm combines the former distribution of the function with the samples of the previous information to get the posteriors. The posteriors compute the valuation which defines the maximization value of the . The maximization operation criterion is the statement named utility function (). The steps of Bayesian optimization algorithm with training data () and the numbers of observations (n) can be expressed as follows:
Find by optimizing the utility function with a certain iteration →
Test the objective function →
Add new values and update data →
Model Evaluation
The performance of the proposed method is evaluated by using the confusion matrix. The confusion matrix gives about four parameters, which consist of true positive (TP), false positive (FP), false negative (FN), and true negative (TN). Performance metrics consisting of accuracy (ACC), sensitivity (Sn), specificity (Sp), precision (Pr), and F-score, which are frequently used in the literature, are obtained with these parameters. These metrics are calculated as follows:
| 16 |
| 17 |
| 18 |
| 19 |
| 20 |
Experimental Works and Results
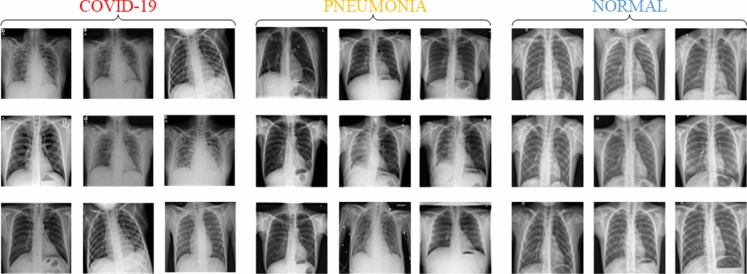
The coding for the pre-processing and the CA model was performed on Python 3.7 programming language while the coding for the classification and the hyperparameter optimization was performed with Matlab software. Experimental works were carried out with the Windows 10 operating system equipped with a 2 GB graphics card, 8 GB RAM card, and an Intel(R) Core(TM) i7-5500U CPU @ 2.4 GHz processor. The dataset containing chest X-ray images was constituted by combining five different sources [43–47] with the labeling of the chest X-ray images examined via radiologists. The combined dataset consists of 580 COVID-19, 500 Pneumonia, 1541 Normal chest X-ray images. All chest X-ray images in the dataset were resized to 100 × 100 pixels with the nearest-neighbor interpolation method. Also, RGB images in the dataset were converted to grayscale images for pre-processing stage, which uses the Laplacian operator with a 3 × 3 kernel size. 70% of the dataset for the training of the CA model was used. Using the rest of the dataset, the classification results were achieved with tenfold cross-validation. A few samples of chest X-ray images for all classes are shown in Fig. 5.
Fig. 5.
Different chest X-ray samples for COVID-19, Pneumonia, and Normal classes
70 percent of the training data was used for training the CA model and the rest for validation. The training options containing epochs and batch size were selected 50 and 256, respectively, and the rest options were tuned as default. Adam solver and cross-entropy loss function were used in the optimization process since they provided better performance. The changes in training loss and validation loss by periods are shown in Fig. 6. The best loss values for training and validation were 0.0156 at the end of 50 epochs.
Fig. 6.
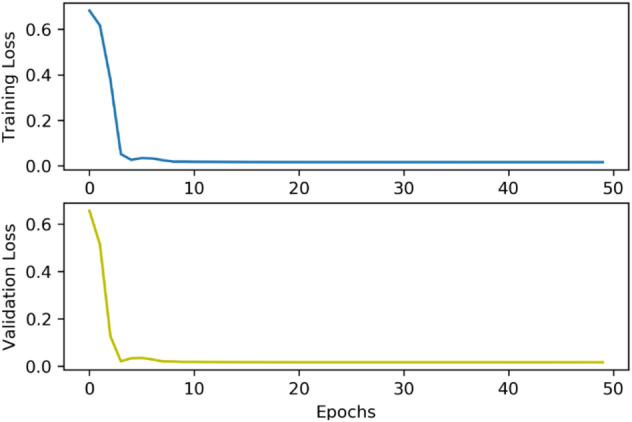
The training process of the CA model
The importance weight values, which deep features extracted from the CA model are calculated with the SDAR algorithm are given in Fig. 7. As seen in Fig. 7, the importance weight values deep features became negative after the 500th iteration. The SDAR algorithm computed 502 features containing positive feature importance weight.
Fig. 7.
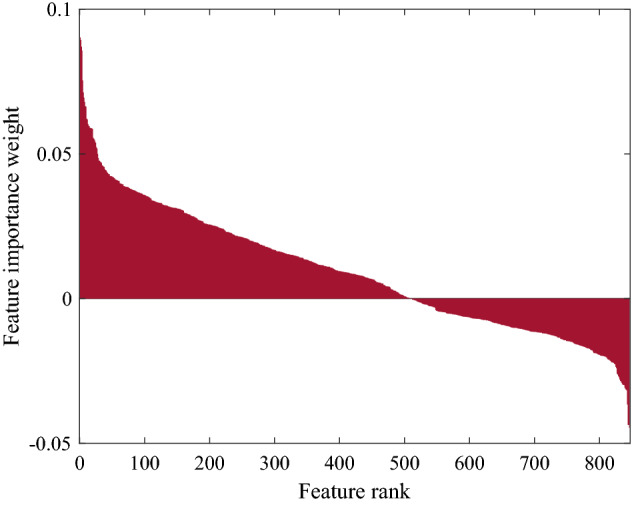
The feature importance weight values calculated with the SDAR model
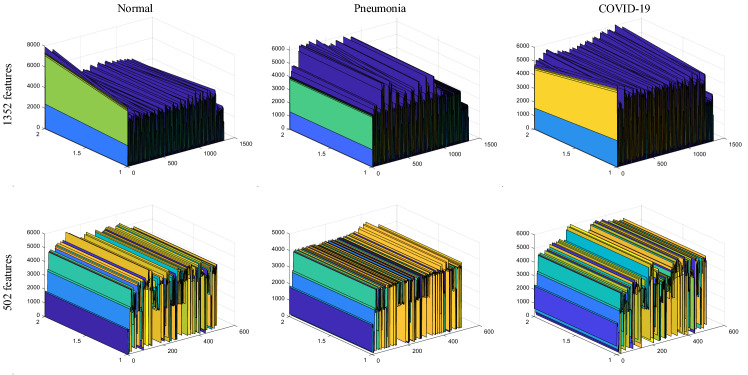
In Fig. 8, the 3-Dimensional representations of deep features with and without SDAR algorithm are shown for each class. As seen in Fig. 8, the computational parameter was decreased in the feature set. Besides, the distinctive representation power was boosted between classes.
Fig. 8.
3D representations of deep features according to the situations of feature selection and classes
The accuracy scores for various classifiers, which use deep features achieved with the CA model, are given in Table 2. As seen in Table 2, the best results were obtained with the SVM classifier for both 1352 features and 502 features selected with the SDAR algorithm. The SVM classifier performed better by 1.1% with the selected deep features compared to 1352 features. The lowest result was obtained with the Naive Bayes classifier as 90.1%. The SDAR algorithm improved the classification accuracy for all classifiers.
Table 2.
Performances of classifiers
| Classifiers | ACC % | |
|---|---|---|
| 1352 features | 502 features | |
| Decision Tree | 91.6 | 92.7 |
| Naive Bayes | 90.3 | 91.8 |
| SVM | 96.2 | 97.3 |
| KNN | 96.1 | 96.8 |
| Ensemble Subspace Discriminant | 94.8 | 95.4 |
| Ensemble Subspace KNN | 96.1 | 96.9 |
The results of other performance metrics such as sensitivity and specificity for the proposed model, which uses the SVM classifier and the selected deep features, are given in Table 3. The selected deep features (502) outperformed 1352 deep features for all metrics. The best results were obtained for the Pneumonia class for all metrics, while the lowest results were for the COVID-19 class.
Table 3.
Three different cases for the proposed model
| Size of features | Classes | Sn | Sp | Pr | F-score |
|---|---|---|---|---|---|
| 1352 | COVID-19 | 0.8977 | 0.9819 | 0.9349 | 0.9159 |
| Normal | 0.9763 | 0.94375 | 0.9619 | 0.9691 | |
| Pneumonia | 0.9931 | 1 | 1 | 0.9965 | |
| 502(Selected) | COVID-19 | 0.9205 | 0.9885 | 0.9586 | 0.9391 |
| Normal | 0.985 | 0.9564 | 0.9704 | 0.9776 | |
| Pneumonia | 1 | 1 | 1 | 1 |
In Table 4, the performance scores of the SVM classifier are given for the kernels of linear, Gaussian, and polynomial. The best overall accuracy was obtained with the polynomial kernel as 97.30%. The scores of all metrics for the Pneumonia class were 1.00 for each kernel function. The best sensitivity, specificity, and F-score for the COVID-19 class were achieved with the Gaussian kernel, and the best precision was achieved with the polynomial kernel as 0.99. In the normal class, the performances of Gaussian and polynomial kernels were equal for specificity and sensitivity metrics, and the Polynomial kernel outperformed the Gaussian kernel for precision and F-score.
Table 4.
SVM classifier performance according to kernel functions
| Kernel Functions of SVM | Classes | Sn | Sp | Pr | F-score | ACC (%) |
|---|---|---|---|---|---|---|
| Linear | COVID-19 | 0.95 | 0.94 | 0.96 | 0.95 | 95.00 |
| Normal | 0.90 | 0.96 | 0.88 | 0.89 | ||
| Pneumonia | 1.00 | 1.00 | 1.00 | 1.00 | ||
| Gaussian | COVID-19 | 0.96 | 0.96 | 0.97 | 0.97 | 96.40 |
| Normal | 0.93 | 0.97 | 0.90 | 0.91 | ||
| Pneumonia | 1.00 | 1.00 | 1.00 | 1.00 | ||
| Polynomial | COVID-19 | 0.92 | 0.99 | 0.96 | 0.94 | 97.30 |
| Normal | 0.98 | 0.96 | 0.97 | 0.98 | ||
| Pneumonia | 1.00 | 1.00 | 1.00 | 1.00 |
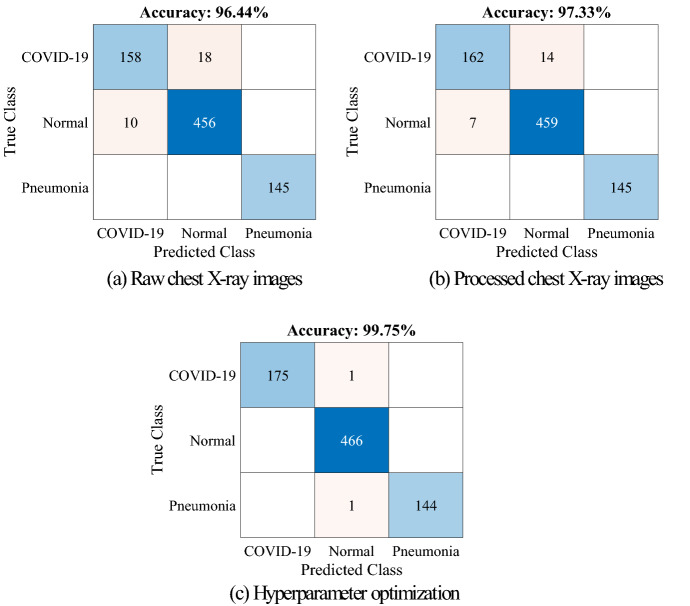
As shown in Table 5, the proposed method was evaluated for three different cases. According to Table 5, the CA model for deep features and the SVM classifier for classification was used in all cases. According to Table 5, raw images were only used in case-1 for training the CA model, and Bayesian algorithms were only used in case-3 for hyperparameter optimization of the SVM classifier. According to the cases in Table 5, the results of confusion matrices and other performance metrics are given in Fig. 9 and Table 6.
Table 5.
Three different cases for the proposed model
| Case | Type of images | Model of deep features | Classifier | Hyperparameter optimization |
|---|---|---|---|---|
| 1 | Raw | CA model | SVM | – |
| 2 | Processed | CA model | SVM | – |
| 3 | Processed | CA model | SVM | Bayesian Algorithm |
Fig. 9.
Confusion matrices of proposed model a case-1, b case-2, c case-3
Table 6.
Other performance metrics for three different cases in Table 2
| Cases | Classes | Se | Sp | Pr | F-score |
|---|---|---|---|---|---|
| 1 | COVID-19 | 0.8977 | 0.9836 | 0.9405 | 0.9186 |
| Normal | 0.9785 | 0.9439 | 0.9620 | 0.9702 | |
| Pneumonia | 1.0000 | 1.0000 | 1.0000 | 1.0000 | |
| 2 | COVID-19 | 0.9205 | 0.9885 | 0.9586 | 0.9391 |
| Normal | 0.9850 | 0.9564 | 0.9704 | 0.9776 | |
| Pneumonia | 1.0000 | 1.0000 | 1.0000 | 1.0000 | |
| 3 | COVID-19 | 0.9943 | 1.0000 | 1.0000 | 0.9972 |
| Normal | 1.0000 | 0.9938 | 0.9957 | 0.9979 | |
| Pneumonia | 0.9931 | 1.0000 | 1.0000 | 0.9965 |
As shown in Fig. 9 and Table 6, the best scores were achieved with case-3. However, except for the Pneumonia class, the worst scores were obtained with case-1. In case-1, 18 samples from the COVID-19 class and 10 samples from the Normal class were misclassified.
For the best classification in the proposed method, the kernel scale and box constraint hyperparameters were searched in the range of 0.001–1000 by using the Bayesian algorithm for SVM classifier, with polynomial (cubic) kernel function and one-vs-all coding. The analysis of observed and estimated minimum classification errors was given for 30 iterations in Fig. 10. At the end of 30 iterations, kernel scale with a value of 34.091 and box constraint with a value of 0.62179 provided the best minimum classification error. The observed and estimated minimum classification error values were obtained as 0.036849 and 0.038936, respectively. For SVM hyperparameters optimization, the elapsed time in the Bayesian algorithm was 1838s.
Fig. 10.
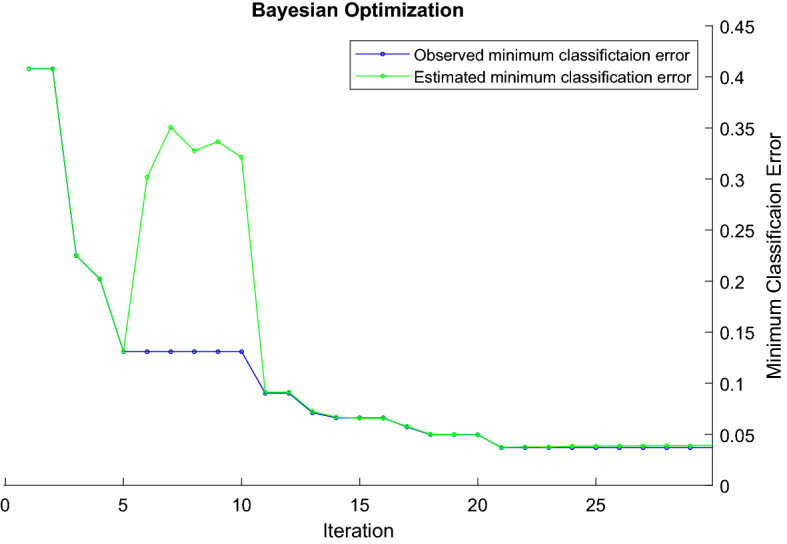
Analysis of Bayesian algorithm for minimum classification error
Discussions
The COVID-19 pandemic has adversely affected the health and economies of many countries since 2019. Now, thousands of cases and hundreds of deaths are recorded every day in these countries. Moreover, health services have been insufficient in terms of both personnel and health supplies. In this process, many machine learning-based studies have been conducted to automatically diagnose COVID-19 cases with high accuracy to support clinicians, radiologists, and experts. Chest X-ray images and deep learning algorithms were used in most of these studies. Besides, classification problems involving normal, COVID-19, and pneumonia classes are generally preferred in the literature. Therefore, we compared our proposed method with deep learning-based approaches and classification problems involving the same class tags (COVID-19, Normal, Pneumonia). Methods, accuracies, sensitivities, and specificities of these approaches are given in Table 7.
Table 7.
Comparison of the proposed methods with other published methods
| Methods | Dataset | Number of classes | Acc (%) | Se (%) | Sp (%) |
|---|---|---|---|---|---|
| DarkCovidNet [22] | Public | 3 | 87.02 | 92.18 | 89.96 |
| COVID-Net [48] | Public | 3 | 92.64 | 91.37 | 95.76 |
| The pretrained CNNs [49] | Public | 3 | 96.78 | 98.66 | 96.46 |
| COVIDiagnosis-Net [15] | Public | 3 | 98.26 | 98.33 | 99.10 |
| Deep CNN, SVM [28] | Public | 3 | 98.97 | 89.39 | 99.75 |
| Deep CNN, AlexNet, Feature Selection, SVM [29] | Public | 3 | 99.18 | 99.13 | 99.21 |
| Deep features, SqueezeNet, SVM [27] | Public | 3 | 99.27 | 98.33 | 99.69 |
| DeepCovNet | Public | 3 | 99.75 | 99.33 | 99.79 |
In Ref. [8], a novel method, which uses 17 convolutional layers and various filters, was proposed to diagnose COVID-19 cases automatically. This method provided an accuracy of 87.02%, a sensitivity of 92.18%, and a specificity of 89.96. In Ref. [28], an end-to-end trained CNN architecture containing many residual blocks was used to detect automatically COVID-19 disease from chest X-ray images. This model outperformed ResNet-50 and VGG-19 CNN models. The accuracy, sensitivity, and specificity scores with this method were 92.64%, 91.37%, and 95.76, respectively. In Ref. [29], the performance of transfer learning models such as MobileNet v2, VGG19, and Inception was compared with the metrics of accuracy, specificity, and sensitivity. The best scores were obtained with the MobileNet v2 model. In Ref. [1], a SqueezeNet Model trained with the augmented dataset from scratch was proposed for automated COVID-19 disease detection. Also, the Bayesian algorithm was used for hyperparameter optimization. The best accuracy, sensitivity, and specificity were 98.26%, 98.33%, and 99.10%, respectively. In Ref. [13], an end-to-end trained CNN model with 5 convolutional layers was utilized to extract deep features from chest X-ray images. In the classification stage, the SVM classifier with radial basis function kernel obtained an accuracy of 98.97%, a sensitivity of 89.39%, and a specificity of 99.75. In Ref. [14], deep features were extracted from fully connected and convolutional layers of the AlexNet model. A total of 10,568 deep features were reduced to 1500 deep features with the Relief algorithm. The accuracy, sensitivity, and specificity with this model were 99.18%, 99.13%, and 99.21%, respectively. In Ref. [12], the combined features were constituted with MobileNetV2 and SqueezeNet models. The SVM classifier, in which hyperparameters were tuned with the Social Mimic algorithm, reached an accuracy of 99.27%, a sensitivity of 98.33%, and a specificity of 99.69%.
In the DeepCovNet Model, deep features were extracted from the compressed representation of the CA model with 7 convolutional layers. To increase classification performance, 3 algorithms were used in the pre-processing (Laplacian), feature selection (SDAR), and hyperparameter optimization (Bayesian) stages. The proposed method gave a high performance with an accuracy of 99.75%, a sensitivity of 99.33%, and a specificity of 99.79%.
Considering that proposed methods in the literature are evaluated on certain datasets, it would not be correct to state that any method is exactly superior to another for COVID-19 disease. The reason for this is that the numbers of radiological images are not much as sufficient. However, as the number of COVID-19 cases increases, more organized and big datasets can be created.
Conclusions
People around the world suffer from COVID-19 disease in terms of their health, economy, and social life. In this pandemic period where an accurate diagnosis is important, artificial intelligence-based automated detection methods can make a great contribution to the decision-making process of specialists and radiologists. The deep features in the proposed approach were extracted from a new deep autoencoder model, which used the processed chest X-ray images and was trained from scratch. The distinctive deep features were selected with a novel algorithm (SDAR) that was easy to apply. An SVM classifier with a polynomial kernel was used in the classification stage. The hyperparameters of the SVM were tuned with the Bayesian algorithm for increasing the classification performance. The results at end of experimental works showed the following outcomes;
In particular, the approaches involving deep features and SVM classifier performed better than the other methods in detecting COVID-19 disease.
The Polynomial kernel outperformed the linear and Gaussian kernels in most performance metrics.
The Laplacian, SDAR, and Bayesian algorithms boosted the classification accuracy at a rate of 0.89%, 1.1%, and 2.42%, respectively.
Since the computer capacity used was not much, images were used with a maximum size of 100 × 100 in experimental studies and high classification performance was obtained under these conditions.
In future works, more refined models will be constituted with big datasets containing many chest X-ray images. Also, the proposed method with a high-capacity computer will be re-tried for the chest X-ray images resized as 200 × 200 and 300 × 300. Moreover, it is planned to implement a GUI application that can be used by radiologists and physicians in the decision-making process.
Funding
There is no funding source for this article.
Declarations
Conflict of interest
The authors declare that there is no conflict to interest related to this paper.
Ethical approval
Not required.
Footnotes
Publisher's Note
Springer Nature remains neutral with regard to jurisdictional claims in published maps and institutional affiliations.
References
- 1.WHO updates on COVID-19. https://www.who.int/news-room/news-updates. Accessed 20 May 2021
- 2.Chen N, Zhou M, Dong X, et al. Epidemiological and clinical characteristics of 99 cases of 2019 novel coronavirus pneumonia in Wuhan, China: a descriptive study. Lancet. 2020;395:507–513. doi: 10.1016/S0140-6736(20)30211-7. [DOI] [PMC free article] [PubMed] [Google Scholar]
- 3.Xie X, Zhong Z, Zhao W, et al. Chest CT for typical coronavirus disease 2019 (COVID-19) pneumonia: relationship to negative RT-PCR testing. Radiology. 2020;296:E41–E45. doi: 10.1148/radiol.2020200343. [DOI] [PMC free article] [PubMed] [Google Scholar]
- 4.Chandra TB, Verma K, Singh BK, et al. Coronavirus disease (COVID-19) detection in chest X-ray images using majority voting based classifier ensemble. Expert Syst. Appl. 2021;165:113909. doi: 10.1016/j.eswa.2020.113909. [DOI] [PMC free article] [PubMed] [Google Scholar]
- 5.Tuncer T, Dogan S, Ozyurt F. An automated residual exemplar local binary pattern and iterative ReliefF based corona detection method using lung X-ray image. Chemom. Intell. Lab. Syst. 2020;203:104054. doi: 10.1016/j.chemolab.2020.104054. [DOI] [PMC free article] [PubMed] [Google Scholar]
- 6.Demir F, Abdullah DA, Sengur A. A new deep CNN model for environmental sound classification. IEEE Access. 2020;8:66529–66537. doi: 10.1109/ACCESS.2020.2984903. [DOI] [Google Scholar]
- 7.Demir F, Turkoglu M, Aslan M, Sengur A. A new pyramidal concatenated CNN approach for environmental sound classification. Appl. Acoust. 2020;170:107520. doi: 10.1016/j.apacoust.2020.107520. [DOI] [Google Scholar]
- 8.Demir F, Ismael AM, Sengur A. Classification of lung sounds with CNN model using parallel pooling structure. IEEE Access. 2020;8:105376–105383. doi: 10.1109/ACCESS.2020.3000111. [DOI] [Google Scholar]
- 9.Demir F, Sengur A, Bajaj V. Convolutional neural networks based efficient approach for classification of lung diseases. Heal. Inf. Sci. Syst. 2020;8:4. doi: 10.1007/s13755-019-0091-3. [DOI] [PMC free article] [PubMed] [Google Scholar]
- 10.Demir F, Bajaj V, Ince MC, et al. Surface EMG signals and deep transfer learning-based physical action classification. Neural Comput. Appl. 2019;31:8455–8462. doi: 10.1007/s00521-019-04553-7. [DOI] [Google Scholar]
- 11.Ahmad S, Agrawal S, Joshi S, et al. Environmental sound classification using optimum allocation sampling based empirical mode decomposition. Phys. A Stat. Mech. Appl. 2020;537:122613. doi: 10.1016/j.physa.2019.122613. [DOI] [Google Scholar]
- 12.Demir, F., Sengur, A., Lu, H., et al.: Compact bilinear deep features for environmental sound recognition. In: 2018 International Conference on Artificial Intelligence and Data Processing, IDAP 2018, pp. 1–5 (2019)
- 13.Jagadeesh, M.S., Alphonse, P.J.: NIT_COVID-19 at WNUT-2020 Task 2: Deep Learning Model RoBERTa for Identify Informative COVID-19 English Tweets. In: W-NUT@ EMNLP, pp 450–454 (2020)
- 14.Malla SJ, Alphonse PJA. COVID-19 outbreak: an ensemble pre-trained deep learning model for detecting informative tweets. Appl. Soft Comput. 2021;107:107495. doi: 10.1016/j.asoc.2021.107495. [DOI] [PMC free article] [PubMed] [Google Scholar]
- 15.Ucar F, Korkmaz D. COVIDiagnosis-Net: deep Bayes-Squeezenet based diagnostic of the coronavirus disease 2019 (COVID-19) from X-ray ımages. Med. Hypotheses. 2020;140:109761. doi: 10.1016/j.mehy.2020.109761. [DOI] [PMC free article] [PubMed] [Google Scholar]
- 16.Ismael AM, Şengür A. Deep learning approaches for COVID-19 detection based on chest X-ray images. Expert Syst. Appl. 2021;164:114054. doi: 10.1016/j.eswa.2020.114054. [DOI] [PMC free article] [PubMed] [Google Scholar]
- 17.Khan AI, Shah JL, Bhat MM. CoroNet: a deep neural network for detection and diagnosis of COVID-19 from chest x-ray images. Comput. Methods Programs Biomed. 2020;196:105581. doi: 10.1016/j.cmpb.2020.105581. [DOI] [PMC free article] [PubMed] [Google Scholar]
- 18.Pathak Y, Shukla PK, Tiwari A, et al. Deep transfer learning based classification model for COVID-19 disease. Irbm. 2020 doi: 10.1016/j.irbm.2020.05.003. [DOI] [PMC free article] [PubMed] [Google Scholar]
- 19.Ismael AM, Şengür A. Deep learning approaches for COVID-19 detection based on chest X-ray images. Expert Syst. Appl. 2020;164:114054. doi: 10.1016/j.eswa.2020.114054. [DOI] [PMC free article] [PubMed] [Google Scholar]
- 20.Zhang, Y., Niu, S., Qiu, Z., et al.: COVID-DA: deep domain adaptation from typical pneumonia to COVID-19. Preprint at http://arxiv.org/abs/200501577 (2020)
- 21.Sethy PK, Behera SK, Ratha PK, Biswas P. Detection of coronavirus disease (COVID-19) based on deep features and support vector machine. Int. J. Math. Eng. Manag. Sci. 2020;5:643–651. doi: 10.33889/IJMEMS.2020.5.4.052. [DOI] [Google Scholar]
- 22.Ozturk T, Talo M, Yildirim EA, et al. Automated detection of COVID-19 cases using deep neural networks with X-ray images. Comput. Biol. Med. 2020;121:103792. doi: 10.1016/j.compbiomed.2020.103792. [DOI] [PMC free article] [PubMed] [Google Scholar]
- 23.Gour, M., Jain, S.: Stacked convolutional neural network for diagnosis of COVID-19 disease from X-ray ımages. Preprint at http://arxiv.org/abs/200613817 (2020)
- 24.Narin, A., Kaya, C., Pamuk, Z.: Automatic detection of coronavirus disease (COVID-19) Using X-ray ımages and deep convolutional neural networks. Preprint at http://arxiv.org/abs/200310849 (2020) [DOI] [PMC free article] [PubMed]
- 25.Klein, A., Falkner, S., Bartels, S., et al.: Fast Bayesian optimization of machine learning hyperparameters on large datasets. In: Proceedings of the 20th International Conference on Artificial Intelligence and Statistics, AISTATS 2017, pp. 528–536 (2017)
- 26.Mangal, A., Kalia, S., Rajgopal, H., et al.: CovidAID: COVID-19 detection using chest X-ray. Preprint at http://arxiv.org/abs/200409803 (2020)
- 27.Toğaçar M, Ergen B, Cömert Z. COVID-19 detection using deep learning models to exploit social mimic optimization and structured chest X-ray images using fuzzy color and stacking approaches. Comput. Biol. Med. 2020;121:103805. doi: 10.1016/j.compbiomed.2020.103805. [DOI] [PMC free article] [PubMed] [Google Scholar]
- 28.Nour M, Cömert Z, Polat K. A novel medical diagnosis model for COVID-19 infection detection based on deep features and Bayesian optimization. Appl. Soft. Comput. J. 2020;97:106580. doi: 10.1016/j.asoc.2020.106580. [DOI] [PMC free article] [PubMed] [Google Scholar]
- 29.Turkoglu M. COVIDetectioNet: COVID-19 diagnosis system based on X-ray images using features selected from pre-learned deep features ensemble. Appl. Intell. 2020 doi: 10.1007/s10489-020-01888-w. [DOI] [PMC free article] [PubMed] [Google Scholar]
- 30.Wang X. Laplacian operator-based edge detectors. IEEE Trans. Pattern Anal. Mach. Intell. 2007;29:886–890. doi: 10.1109/TPAMI.2007.1027. [DOI] [PubMed] [Google Scholar]
- 31.Yan T, Hu Z, Qian Y, et al. 3D shape reconstruction from multifocus image fusion using a multidirectional modified Laplacian operator. Pattern Recognit. 2020;98:107065. doi: 10.1016/j.patcog.2019.107065. [DOI] [Google Scholar]
- 32.Lotfollahi M, Siavoshani MJ, Zade RSH, Saberian M. Deep packet: a novel approach for encrypted traffic classification using deep learning. Soft. Comput. 2020;24:1999–2012. doi: 10.1007/s00500-019-04030-2. [DOI] [Google Scholar]
- 33.Krizhevsky, A., Sutskever, I., Hinton, G.E.: Imagenet classification with deep convolutional neural networks. In: Advances in Neural İnformation Processing Systems, pp. 1097–1105 (2012)
- 34.Simonyan, K., Zisserman, A.: Very deep convolutional networks for large-scale image recognition. Preprint at http://arxiv.org/abs/14091556 (2014)
- 35.Giusti, A., Cireşan, D.C., Masci, J., et al.: Fast image scanning with deep max-pooling convolutional neural networks. In: 2013 IEEE International Conference on Image Processing, ICIP 2013 – Proceedings, pp. 4034–4038 (2013)
- 36.Tuncer T, Dogan S, Ozyurt F. An automated residual exemplar local binary pattern and iterative ReliefF based COVID-19 detection method using chest X-ray image. Chemom. Intell. Lab. Syst. 2020;203:104054. doi: 10.1016/j.chemolab.2020.104054. [DOI] [PMC free article] [PubMed] [Google Scholar]
- 37.Turkoglu M. COVIDetectioNet: COVID-19 diagnosis system based on X-ray images using features selected from pre-learned deep features ensemble. Appl. Intell. 2021;51:1213–1226. doi: 10.1007/s10489-020-01888-w. [DOI] [PMC free article] [PubMed] [Google Scholar]
- 38.Osowski, S., Siwek, K., Markiewicz, T.: MLP and SVM networks—a comparative study. In: Report— Helsinki University of Technology, Signal Processing Laboratory, pp 37–40 (2004)
- 39.Cortes C, Vapnik V. Support-vector networks. Mach. Learn. 1995;20:273–297. doi: 10.1007/BF00994018. [DOI] [Google Scholar]
- 40.Rastogi R, Sharma S, Chandra S. Robust parametric twin support vector machine for pattern classification. Neural Process. Lett. 2018;47:293–323. doi: 10.1007/s11063-017-9633-3. [DOI] [Google Scholar]
- 41.Bogawar PS, Bhoyar KK. An improved multiclass support vector machine classifier using reduced hyper-plane with skewed binary tree. Appl. Intell. 2018;48:4382–4391. doi: 10.1007/s10489-018-1218-y. [DOI] [Google Scholar]
- 42.Snoek J, Larochelle H, Adams RP. Practical Bayesian optimization of machine learning algorithms. Adv. Neural Inf. Process. Syst. 2012;4:2951–2959. [Google Scholar]
- 43.COVID-19 Radiography Database. https://www.kaggle.com/tawsifurrahman/covid19-radiography-database (2020)
- 44.Kaggle. Covid-19 X-ray chest and CT . https://www.kaggle.com/bachrr/covid-chest-xray (2020a)
- 45.GitHub. COVID-19. https://github.com/ieee8023/covid-chestxray-dataset/tree/master/images (2020)
- 46.Kaggle. X-ray chest. https://www.kaggle.com/paultimothymooney/chest-xray-pneumonia (2020b)
- 47.Wang, X., Peng, Y., Lu, L., et al. Chest x-ray 8: Hospital-scale chest x-ray database and benchmarks on weakly-supervised classification and localization of common thorax diseases. In: Proceedings of the IEEE Conference on Computer Vision and Pattern Recognition, pp 2097–2106 (2017)
- 48.Wang L, Lin ZQ, Wong A. COVID-Net: a tailored deep convolutional neural network design for detection of COVID-19 cases from chest X-ray images. Sci. Rep. 2020 doi: 10.1038/s41598-020-76550-z. [DOI] [PMC free article] [PubMed] [Google Scholar]
- 49.Apostolopoulos ID, Mpesiana TA. Covid-19: automatic detection from X-ray images utilizing transfer learning with convolutional neural networks. Phys. Eng. Sci. Med. 2020;43:635–640. doi: 10.1007/s13246-020-00865-4. [DOI] [PMC free article] [PubMed] [Google Scholar]


