

Abstract
Objective
To assess the feasibility of T2 mapping for evaluating pediatric SIJ cartilage at 3 Tesla (T) magnetic resonance imaging (MRI).
Methods
Healthy control subjects and adolescents with sacroiliitis underwent a 3T MRI dedicated pelvic protocol that included a T2 mapping sequence consisting of multislice, multiecho acquisition. Healthy control subjects were prospectively recruited from our primary care practices as part of a larger imaging study, whereas adolescents with sacroiliitis were recruited specifically for this study. Regions of interest (ROIs) were hand‐drawn by a senior pediatric radiologist twice and a radiology fellow twice to calibrate and test reliability using the intraclass correlation coefficient (ICC). T2 relaxation time between control subjects and cases was compared using univariate linear regression. We tested the association of T2 relaxation time in adolescents with sacroiliitis with patient‐reported outcomes and the Spondyloarthritis Research Consortium of Canada sacroiliac joint (SIJ) inflammation and structural scores using Pearson correlation coefficients.
Results
Fourteen subjects were evaluable (six control subjects: median age 13.7 years [interquartile range (IQR): 12.2‐15.5], 67% male patients; eight cases: median age 17.4 years [IQR: 12.5‐20], 88% male patients]. Acquisition time for T2 mapping sequences was approximately 6 minutes, and segmenting the ROI for each SIJ took approximately 3 minutes. The intrarater and inter‐rater ICCs were 0.67 and 0.46, respectively, indicating good to fair reliability. There was a trend, albeit statistically insignificant, in longer median T2 relaxation time in cases (43.04 ms; IQR: 41.25‐49.76 ms) versus healthy control subjects (40.0 ms; IQR: 38.9‐48.6 ms). Although not statistically significant, cases with longer T2 relaxation time tended to occur with poorer patient‐reported outcomes. Correlations with the SIJ inflammation and structural lesion scores were weak.
Conclusion
T2 mapping of the SIJ cartilage in children was feasible and reliable. Larger controlled and longitudinal assessments are needed to assess the validity and utility of these measurements for routine clinical practice and trials.
INTRODUCTION
Children and adolescents with juvenile spondyloarthritis (SpA) are at risk of developing sacroiliitis, or inflammation of the sacroiliac joints (SIJs) (1). Sacroiliitis is common at diagnosis of SpA and is frequently asymptomatic, which is problematic because, if left untreated, sacroiliitis may result in long‐term morbidity and dysfunction (2). The SIJ is a complex structure that undergoes many physiological changes over a lifetime and is known to have many anatomic variants (3, 4). The SIJ is a diarthroidal joint with hyaline cartilage covering the sacral surface and a thin fibrocartilage covering the iliac surface (5). The upper dorsal part of the joint is fibrous, whereas the inferior or distal third of the joint resembles a synovial joint with an inner capsule containing synovial cells (5). Magnetic resonance imaging (MRI) is increasingly used to evaluate the SIJ, focusing on the distal third of the joint, particularly when inflammation is suspected.
Traditional MRI methods are based on visual detection of the disease. Fluid‐sensitive sequences in standard magnetic resonance pelvic protocols are neither quantitative nor sufficient for early identification of cartilage damage. T2 mapping is a noninvasive method that provides a quantitative means to identify the early stages of cartilage matrix degeneration that precedes visible morphologic damage (6, 7, 8). T2 relaxation times have the potential to detect ultrastructural changes in cartilage, including proteoglycan content, water mobility, compressibility, and orientation. Longer T2 relaxation times signify higher extracellular water content, which is the earliest detectable change that corresponds with inflammation and cartilage degeneration in the joints (9). In a recent study by Renner et al, longer disease duration (as a proxy for prolonged synovitis) and the presence of anticitrullinated protein antibodies and rheumatoid factor were associated with longer T2 relaxation time in adults with rheumatoid arthritis (9).
T2 relaxation time mapping has been studied in rheumatoid arthritis (9), osteoarthritis (10), postoperative knee (11) and ankle repair (12), juvenile osteochondrosis (13), and the healthy pediatric knee (14). Furthermore, in a longitudinal study of children with early juvenile idiopathic arthritis, despite improved clinical assessments, T2 values increased from the 3‐ to 24‐month assessment, suggesting progressive microstructural changes that were not detectable with standard imaging (15). All these studies suggest a role for longitudinal quantitative assessment and outcome prognostication. In a preliminary feasibility study on adults, T2 mapping of the SIJ was deemed feasible on a 3 Tesla (T) MRI scanner (16); however, no pediatric subjects were included. Another feasibility study of T2 mapping of the adult SIJ on 1.5T MRI scanner confirmed feasibility and demonstrated higher T2 relaxation times in female versus male patients and an inverse correlation between T2 relaxation and body mass index (17). In a recent study of adults with axial spondyloarthritis and healthy control subjects, mean T2 relaxation times were significantly higher in cases (18). A T2 value of 52.5 milliseconds yielded excellent sensitivity (100%) and specificity (91.7%) to distinguish adults with axial disease and control subjects (18). The feasibility of T2‐mapping has not been studied in children.
There is increasing evidence in juvenile arthritis (19, 20, 21, 22) and adult SpA (23, 24, 25, 26) that there is a “window of opportunity” during which early aggressive therapy can impact the treatment course and long‐term outcomes. In one trial, for each month less of disease duration prior to initiation of biologic disease‐modifying antirheumatic drug therapy, there was 30% increased odds of attaining clinically inactive disease (27). In adults with ankylosing spondylitis, it has been shown that acute inflammatory lesions may resolve completely but that more advanced and chronic lesions do not and are associated with new bone formation and likely ankylosis (23). In another study of patients with ankylosing spondylitis treated with tumor necrosis factor inhibitor (TNFi) agents, earlier initiation of TNFi therapy was associated with less progression (28). Lastly, there is recent evidence to suggest that longer duration of inflammation is associated with more progression (23). Therefore, accurate and timely diagnosis of sacroiliitis is critical to long‐term outcomes. Studies from adults with osteoarthritis established strong correlations between T2 mapping and histologic characteristics despite the lack of abnormal morphology on conventional MRI (7, 8, 29). There is opportunity with novel and more sensitive imaging techniques, such as T2 relaxation time mapping, to augment our ability to detect early disease and damage and monitor for changes (progression or reversal) over time.
The aim of this preliminary study was to assess the feasibility of using T2 mapping as a tool for quantitative analysis of SIJ cartilage at 3T for potential use in future clinical trials. We additionally compared T2 relaxation times in healthy control subjects with patients with a history of sacroiliitis.
Patients and Methods
The same T2 mapping sequences were added to the protocols of two studies to investigate the feasibility of T2 mapping as a tool for quantitative analysis of the sacroiliac cartilage. Healthy control subjects were recruited as part of a larger imaging study (30), whereas adolescents and young adults with established sacroiliitis were evaluated as part of a distinct study. The institutional review board at the hospital has reviewed and approved these studies (16‐012981 and 18‐015236), and informed consent and assent were obtained from all guardians/participants.
Subjects
Six healthy control subjects with no personal history of back pain, trauma, or surgery and no endocrine, oncologic, or rheumatologic disease were prospectively recruited from our primary care practices as part of a larger imaging study (30). Ten subjects with juvenile spondyloarthritis and known sacroiliitis were prospectively recruited from the rheumatology clinic at our hospital. Sacroiliitis in cases was previously identified by clinical symptoms and examination with confirmation of periarticular bone marrow edema (BME) using standard MRI as part of routine clinical care. Subjects with a contraindication to MRI or inability to undergo MRI without sedation were excluded. As this was a feasibility study, we did not power the number of subjects needed to find a statistically significant difference between cases and control subjects.
Data collected on subjects or abstracted from the electronic medical health record included demographics, patient‐reported overall global assessment on a visual analog scale (VAS; range: 0‐10, higher scores indicate worse status), disease activity assessment (VAS; range: 0‐10, higher scores indicate more disease activity), overall pain (VAS; range: 0‐10, higher scores indicate more pain), and axial pain (VAS; range: 0‐10, higher scores indicate more pain). Several Patient‐Reported Outcomes Measurement Information System (PROMIS) pediatric measures (physical function, pain interference, fatigue, and global health) (31) as well as the Bath Ankylosing Spondylitis Functional Index (32) and Bath Ankylosing Spondylitis Disease Activity Index (BASDAI) (33) (range: 0‐10) were also collected. Raw PROMIS measure scores were converted to T‐scores with mean = 50 (SD = 10) according to the appropriate scoring manuals available at healthmeasures.net. Imaging studies were obtained from the picture archiving and communication system for analysis.
MRI protocol
Oblique‐coronal small field‐of‐view T1‐weighted and short τ inversion recovery (STIR) sequences of the SIJs were performed as part of our standard pelvic imaging protocol. T2 mapping of the SIJ included a multislice multiecho spin‐echo acquisition sequence with eight echoes (echo time [TE] = 13, 27, 41, 55, 69, 82, 96, and 110 ms), a repetition time (TR) of 1870 ms, and an acquisition time of approximately 6 minutes (field of view, 160 × 160 mm; slice thickness, 4 mm; number of slices, 8‐16; flip angle, 90°; parallel acceleration, 2; number of averages, 1; acquisition matrix, 128 × 128 [protocol parameters are summarized in Table 1]). The total scan time (standard imaging plus T2 mapping) was approximately 60 minutes. Scans were performed on a 3T magnetic resonance scanner (Prisma, Siemens) using the built‐in spine array and eight‐channel abdomen receive‐only coil. Unwanted B0 and B1 inhomogeneity can affect a study in a variety of ways, including spectral line broadening and erroneous results. As part of image acquisition, we performed second order B0 and B1 shimming to minimize any inhomogeneity effects. The T2 relaxation times calculated with this method have been used previously to evaluate cartilage and have been shown to be reproducible (16, 17). T2 relaxation time mapping was performed on an axial oblique slice perpendicular to the S1 to S3 axis (Figure 1).
Table 1.
MRI protocol
| Parameter | Quantitative T2 mapping |
|---|---|
| Pulse sequence | 2D MSME |
| Number of echoes | 8 |
| TR, ms | 1870 |
| TEs, ms) | 13‐110 |
| Number of slices | 8‐16 |
| Flip angle, degrees | 90 |
| Slice thickness, mm | 4 |
| Acceleration factor | 2 |
| Matrix size | 128 × 128 |
| Approximate scan time, min | 6 |
Abbreviations: 2D, two‐dimensional; MRI, magnetic resonance imaging; MSME, multislice, multiecho; TE, echo time; TR, repetition time.
Figure 1.

Slice positioning for SIJ image acquisition. (A) Oblique axial slices planned perpendicular to S1‐S3. (B) Representative T2 mapping slices across the six individual TEs used to generate the T2 maps. TE, echo time.
Image analysis
The SIJs of healthy control subjects were compared with the cases with sacroiliitis. A custom software, written in C# and C++, which are broadly used programming languages, was used for postprocessing and generating T2 relaxation maps (Dmitry Khrichenko, www.parametricMRI.com). Digital Imaging and Communications in Medicine images were exported offline and loaded into the software. T2 maps were generated based on a monoexponential model using a least‐squares fitting algorithm. Regions of interest (ROIs) for monoexponential fitting of average signal intensity were meticulously drawn across the cartilaginous portion of the SIJs by a board‐certified pediatric radiologist with more than 5 years postfellowship experience with care to avoid inclusion of any subchondral bone (MLF). In order to determine intrarater and inter‐rater reliability, this process was repeated by the same senior pediatric radiologist 6 months later (MLF) and by a pediatric radiology fellow (LG). Measurements were taken on all slices on which the cartilaginous portion of the SIJ was clearly visible. The possibility of SIJ fluid or gas was accounted for by evaluating the STIR and T1 sequences. No SIJ fluid or gas was present in the studied cases. After the initial intrarater and inter‐rater reliability assessment, a calibration exercise was performed consisting of review of four cases, which were discussed and scored separately to assure concordance. The full set of cases were then reassessed by both radiologists, and intrarater and inter‐rater reliability was reassessed. Data from the case assessment (MLF) following calibration is presented in the results, tables, and figures.
The first TE images in each calculation were excluded to avoid overestimation of T2 values in accordance with previous literature (34, 35, 36). The T2 relaxation time for each pixel was calculated by fitting the measured signal intensity to the equation S(TE) = S0e(−TE×1/T2) + C, in which T2 is the T2 relaxation time, S(TE) is the signal intensity at TE, S0 is the theoretical signal intensity at time TE = 0, and C is the noise plateau offset. Interpretation of T2 relaxation time from a representative case is shown in Figure 2.
Figure 2.

Interpretation of T2 relaxation time from representative cases, a 20‐year‐old patient from our cohort. (A) Axial T2 weighted regions of interest (ROIs) drawn on the left (blue) and right (red) sacroiliac joints. (B) T2 map overlay on the anatomical image. Color spectrum represents T2 relaxation times anchored at 0 ms (purple) and 200 ms (red). (C) Monoexponential fit T2 relaxation curves for the 2 ROIs in A (red = right joint and blue = left joint) with the first echo excluded.
Each MRI study was evaluated for active inflammatory lesions (BME, capsulitis, SIJ effusion, and enthesitis outside of the SIJ) and structural lesions (erosion, sclerosis, and ankylosis). Inflammation was assessed using the Canadian Research and Education Arthritis platform and Spondyloarthritis Research Consortium of Canada (SPARCC) SIJ Inflammation Score scoring module. Details about the platform and scoring have been previously published (37), and both are reliable assessments in children and adolescents (38, 39). The inflammation score quantifies the presence, depth, and intensity of BME on STIR MRI (total score, 0‐72).
Data analysis
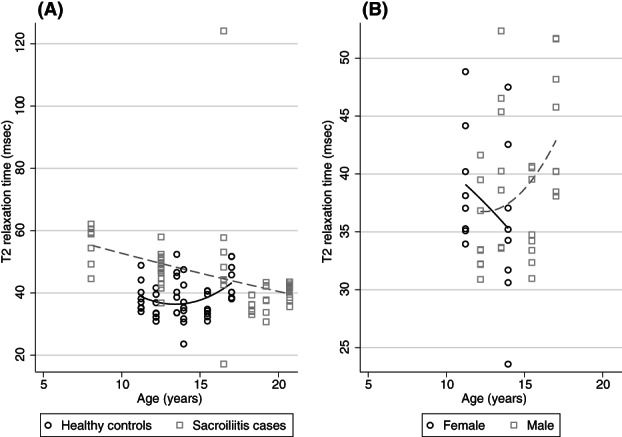
Demographics and clinical characteristics were summarized by median and interquartile range (IQR). Intraobserver and interobserver reliability was assessed using intraclass correlation coefficients (ICCs) with 95% confidence intervals (CIs) before and after calibration of the two radiologists interpreting the studies (MLF and LG). An ICC below 0.40 was considered poor, between 0.40 and 0.59 was considered fair, between 0.60 and 0.74 was considered good, and between 0.75 and 1.00 was considered excellent (40). For assessment of T2 relaxation values, each subject contributed two joints (the left and right SIJs). All linear regression models accounted for clustering by subject. Association of T2 relaxation time with age was stratified by case versus control. Effect of sex or race/ethnicity was not assessed because of limited sample size. Association of T2 relaxation time with patient‐reported outcomes (PROMIS mobility, PROMIS upper‐extremity function, and PROMIS pain interference) was performed in all patients using linear regression adjusted for case–control status. Correlation of T2 relaxation time in children with sacroiliitis with the SPARCC SIJ Inflammation Score and Structural Score lesions (except ankylosis because that implied no evaluable joint space) was assessed using the Pearson correlation coefficient. Correlation coefficients of 0.1 to less than 0.3, 0.3 to less than 0.5, and 0.5 to 1.0 were considered weak, moderate, and strong correlation, respectively.
Results
Six healthy control subjects (median age: 13.7 y; IQR: 12.2‐15.5 y; range: 11.2‐17.0 y) and eight cases with a history of sacroiliitis (median age: 17.4 years; IQR: 12.5‐20 y; range: 8.0‐20.7 y) were evaluable. Two patients with a history of sacroiliitis were excluded from analysis. One patient was excluded because of severe motion artifacts, and the other was excluded because of complete ankylosis and hence no evaluable joint space. Patient demographics are shown in Table 2. Although the median age of cases is higher than that of control subjects, this difference was not statistically significant (P = 0.09). Sixty‐seven percent (4/6) of healthy control subjects were male, and 83% (5/6) were nonwhite. Eighty‐eight percent (7/8) of patients with a history of sacroiliitis were male, and 50% (4/8) were nonwhite. Seventy percent of cases with sacroiliitis were HLA‐B27 positive, and the median disease duration was 3.0 years (IQR: 0.5‐5.3 y). Patient‐reported outcomes were indicative of low to moderate disease activity, with a median patient‐reported global assessment of 2 (IQR: 0.0‐6.0) and disease activity assessment of 4.5 (IQR: 0.5‐6.0). Three patients (37.5%) had a BASDAI score greater than 4 (median: 1.8; IQR: 1.1‐4.9). Patients with sacroiliitis reported overall and axial median pain scores of 3 (IQR: 0.0‐6.5) and 1.5 (IQR: 0.5‐6.0), respectively.
Table 2.
Subject demographics and patient‐reported outcomes among case and control subjects
| All (N = 14) | Cases (n = 8) | Control Subjects (n = 6) | P Value | |
|---|---|---|---|---|
| Age, median (IQR), y | 14.7 (12.5‐18.3) | 17.4 (12.5‐20) | 13.7 (12.2‐15.5) | 0.28 |
| Sex, male, n (%) | 11 (78.6) | 7 (87.5) | 4 (66.7) | 0.09 |
| Race, white, n (%) | 9 (64.3) | 4 (50) | 5 (83.3) | 0.20 |
| Disease duration, median (IQR), y | – | 3.0 (0.5‐5.3) | – | – |
| BASFI, median (IQR) | – | 0.9 (0.4‐3.7) | – | – |
| BASDAI, median (IQR) | – | 1.8 (1‐4.9) | – | – |
| Patient pain VAS, a median (IQR) | – | 3 (0‐6.5) | – | – |
| Patient global VAS, a median (IQR) | – | 2 (0‐6) | – | – |
| Patient disease activity VAS, a median (IQR) | – | 4.5 (0.5‐6) | – | – |
| Axial pain VAS, a median (IQR) | – | 1.5 (0.5‐6) | – | – |
| PROMIS mobility, b median (IQR) | 59 (52‐59) | 55.5 (44.5‐59) | 59 (59‐59) | – |
| PROMIS upper extremity, b median (IQR) | 57 (49‐57) | 57 (47‐57) | 57 (57‐57) | 0.48 |
| PROMIS pain interference, b median (IQR) | 34 (34‐51.7) | 46.2 (34‐59.5) | 34 (34‐34) | 0.09 |
| PROMIS fatigue, b median (IQR) | – | 40.9 (36.7‐49.8) | – | – |
| PROMIS global health, b median (IQR) | – | 50.4 (40.5‐57) | – | – |
Abbreviations: BASDAI, Bath Ankylosing Spondylitis Disease Activity Index; BASFI, Bath Ankylosing Spondylitis Functional Index; IQR, interquartile range; PROMIS, Patient‐Reported Outcomes Measurement Information System; VAS, visual analog scale.
VAS ranges from 0 to 10, in which 10 was indicative of worse status.
Higher scores in each of the PROMIS instruments represent more of the trait being measured (more mobility and upper‐extremity function, increased interference from pain, more fatigue, and better global health). Raw PROMIS measure scores were converted to T‐scores with mean = 50 and SD = 10 according to the appropriate scoring manuals available at healthmeasures.net.
Segmentation and drawing the ROI for each joint took approximately 3 minutes per side. The intrarater and inter‐rater reliability were fair and poor with ICCs of 0.40 (95% CI: 0.04‐0.67) and 0.24 (95% CI: −0.33 to 0.71), respectively, before calibration. After calibration, the intrarater and inter‐rater reliability both improved, respectively, to “good” and “fair” with ICCs of 0.67 (95% CI: 0.25‐0.85) and 0.46 (95% CI: 0.13‐0.70). The median T2 relaxation time in control subjects was 40.02 milliseconds (IQR: 36.16‐47.13 ms). Table 3 shows the association of T2 relaxation time and patient demographics and patient‐reported outcomes using linear regression accounting for clustering by subject. Although not statistically significant, cases with longer T2 relaxation time tended to occur with poorer patient‐reported outcomes, with the exception of axial pain VAS which had a β coefficient of 0.
Table 3.
Association of T2 relaxation time with subject demographics and patient‐reported outcomes using linear regression stratified by exposure (case vs control) or measured in all subjects, adjusting for clustering by subject
| Control Subjects (n = 6) | Patients with Sacroiliitis (n = 8) | All Subjects | ||||
|---|---|---|---|---|---|---|
| β Coefficient (95% CI) | P Value | β Coefficient (95% CI) | P Value | β Coefficient (95% CI) | P Value | |
| Age, y | 0.96 (−1.49 to 3.41) | 0.36 | −1.39 (−2.05 to −0.73) | <0.01 | ‐ | ‐ |
| PROMIS fatigue a , b | ‐ | ‐ | 0.28 (0.01 to 0.54) | 0.04 | ‐ | ‐ |
| PROMIS global health a , b | ‐ | ‐ | −0.37 (−1.05 to 0.31) | 0.24 | ‐ | ‐ |
| BASDAI b | ‐ | ‐ | 0.14 (−2.97 to 3.24) | 0.92 | ‐ | ‐ |
| BASFI b | ‐ | ‐ | 0.21 (−2.77 to 3.20) | 0.87 | ‐ | ‐ |
| Patient pain VAS b , c | ‐ | ‐ | 0.11 (−0.10 to 0.32) | 0.25 | ‐ | ‐ |
| Patient global assessment VAS b , c | ‐ | ‐ | 0.17 (−0.01 to 0.36) | 0.06 | ‐ | ‐ |
| Patient disease activity VAS b , c | ‐ | ‐ | 0.18 (0.06 to 0.30) | <0.01 | ‐ | ‐ |
| Axial pain VAS b , c | ‐ | ‐ | −0.03 (−0.25 to 0.20) | 0.79 | ‐ | ‐ |
| PROMIS mobility a | −0.10 (−0.60 to 0.39) | 0.66 | ||||
| PROMIS upper‐extremity function a | −0.72 (−1.06 to −0.38) | <0.01 | ||||
| PROMIS pain interference a | 0.28 (−0.15 to 0.71) | 0.18 | ||||
Abbreviations: BASDAI, Bath Ankylosing Spondylitis Disease Activity Index; BASFI, Bath Ankylosing Spondylitis Functional Index; CI, confidence interval; PROMIS, Patient‐Reported Outcomes Measurement Information System; VAS, visual analog scale
Higher scores in each of the PROMIS instruments represent more of the trait being measured (more mobility and upper‐extremity function, increased interference from pain, more fatigue, and better global health).
Measured only in patients with sacroiliitis (n = 8).
VAS ranges from 0 to 10, wherein 10 was indicative of worse status.
The median T2 relaxation times in cases and control subjects were 43.04 milliseconds (IQR: 41.25‐49.76 ms) and 40.02 milliseconds (IQR: 36.16‐47.13 ms), respectively. Figure 3 shows the range of T2 relaxation time in control subjects, cases with active inflammation, and cases with chronic inflammation.
Figure 3.
T2 relaxation times in the joints of healthy control subjects (n = 12 joints), patients with active inflammation (n = 6 joints), and patients with chronic inflammation (n = 8 joints). Active and chronic inflammation groups are not mutually exclusive.
There were no inflammatory or structural abnormalities in the healthy control subjects. Of the subjects with a known history of sacroiliitis, three (38%) had detectable bilateral subchondral BME on STIR images. The SPARCC inflammation score for each of these joints, by subject, was 1 and 1, 21 and 18, and 22 and 10. In cases, the median T2 relaxation times for joints with (n = 6; 42.86 ms; IQR: 41.54‐48.23 ms) and without detectable subchondral BME (n = 10; 45.31 ms; IQR: 40.95‐51.14 ms) on STIR was not statistically different (P = 0.74). At least one chronic lesion was detected in all cases with sacroiliitis. Of cases (n = 16 total joints), 13 (81%), five (31%), four (25%), three (19%), and five (31%) joints had erosion, sclerosis, ankylosis, fat metaplasia, and back fill on T1‐weighted imaging, respectively. There was a weak correlation between T2 relaxation time and the SPARCC sacroiliac inflammation score (r = −0.34). The correlation between T2 relaxation time and each of the SPARCC sacroiliac structural lesion scores was weak for sclerosis (r = −0.29), fat metaplasia (r = 0.25), and backfill (r = 0.08) and was moderate for erosion (r = 0.32).
Discussion
T2 relaxation time mapping is an indirect, noninvasive imaging biomarker that provides a quantitative means to identify the earliest stages of cartilage matrix degeneration that precede visible morphologic damage (41, 42, 43). This preliminary single‐center study is the first to demonstrate the feasibility of T2 mapping at the pediatric SIJ. The acquisition time of T2 sequences is similar to that reported in adults (18). Intrarater and inter‐rater reliability were good and fair, supporting reliability of the technique in this population. In our control arm, we did not observe statistically significant associations between longer T2 relaxation times and older age, but all control subjects were peripubertal or postpubertal. Despite our small sample size, we saw a trend in longer T2 relaxation time in cases with sacroiliitis versus healthy control subjects. Interestingly, cases with longer T2 relaxation time tended to occur with poorer patient‐reported outcomes, albeit statistically insignificant.
Several key findings warrant additional discussion. First, the median T2 relaxation times in the adolescents and young adults from this study are in concordance with those reported in T2 feasibility studies in healthy adults at 1.5T (17, 18). The mean T2 values in healthy adults was approximately 41 milliseconds ±4 milliseconds, which encompasses the T2 value we observed, lending face validity to our study. A prior study in children reported a significant association between younger age and longer T2 (14). We did not see the same association of age and relaxation time, likely because all the healthy control subjects were peripubertal or postpubertal. The association of age and T2 relaxation time should be further evaluated in a larger sample that includes prepubertal, peripubertal, and postpubertal individuals.
Second, the mean T2 relaxation time reported in adults with axial spondyloarthritis was higher than the mean in adolescent and young adult cases with active inflammation reported herein. The proposed cutoff to distinguish cases and control subjects in the adult population, 55.21 milliseconds (18), would not have identified any of the adolescents and young adults with active inflammation on a standard MRI evaluation. The overall higher T2 values in adults may reflect longer disease duration and more severe disease. These differences underscore the need to further evaluate T2 mapping in the SIJ specifically in adolescents and young adults and not simply extrapolate from studies performed in adults.
On the basis of prior work, we know that established quantitative scoring systems based on standard MRI sequences are not well correlated with patient‐reported outcomes or physician‐determined clinical disease assessments (38, 39). This discordance may be either because the imaging technique is not sensitive enough or it is just measuring a different construct. In one small longitudinal assessment of T2 mapping of the knee in children with juvenile arthritis, T2 relaxation time correlated well with physician and parent global assessment, total active joint count, and function (15). This work demonstrates that T2 relaxation time may be better associated with patient‐reported outcomes than existing metrics. We were not able to show a statistically significant association with patient‐reported outcomes in our limited sample.
This study has limitations that should be acknowledged. First, our study had a limited sample size comprising solely peripubertal and postpubertal healthy control subjects. Given associations of T2 relaxation time and age in other pediatric studies, future studies should include prepubertal children. However, the fact that we were able to demonstrate feasibility and similar relaxation time reported in adults is promising. Second, the morphological features of SIJ are complex, and measuring T2 relaxation time is challenging because of its narrowness, limited spatial resolution, and difficulty in identifying anatomical borders. Additionally, inadvertent inclusion of adjacent marrow or subchondral bone could artificially elevate the T2 relaxation time values. However, after calibration, our trained pediatric radiologist with more than 5 years of postfellowship experience meticulously reviewed every study to draw ROIs that were extracted to generate T2 maps, and, despite the SIJ complexity, we demonstrated good intrarater and fair inter‐rater reliability, in accordance with prior published feasibility studies in adults (16, 17, 18). The inter‐rater reliability also improved after calibration but remained fair; given the complexity of measuring T2 relaxation time, the assessment may need to rely primarily with radiologists with experience in T2 relaxation assessment, perhaps limiting its utility in routine clinical care. Third, prior studies have shown that T2 relaxation times can be impacted by physical activity and that T2 values normalize after several hours (44, 45). In this study, we did not collect information on physical activity at each study visit nor did we instruct subjects not to exercise vigorously prior to the study visit. However, most of the study visits occurred in the early morning, making vigorous exercise prior to imaging highly unlikely. Fourth, our cohort had unequal sex distribution, prohibiting our ability to evaluate the association of T2 relaxation times and sex. The larger number of male subjects in the cases, however, is somewhat expected because sacroiliitis is more common in male than female individuals. Lastly, the plane of imaging impacts the feasibility and accuracy of segmenting the SIJ. Most anatomic data about the joint are available on T1‐weighted signal intensity or STIR sequences, which are typically obtained in an oblique‐coronal plane. The T2 mapping sequence, which contains relatively little anatomic detail, was obtained in an oblique axial plane based on the only published MRI T2 mapping protocols for the SIJ (16, 17). However, we felt that the axial oblique plane limited our ability to correlate information between the T2 mapping sequence and the anatomic sequence, particularly in light of its anatomic structural differences. Additionally, given the availability of the SPARCC SIJ inflammation and structural scores, we believe that performing the T2 mapping on oblique‐coronal sequences inherently makes more sense going forward and may improve the correlation between T2 relaxation time and these measures.
Our preliminary study shows the feasibility of T2 mapping at the pediatric SIJ despite its challenging anatomy. Although statistically significant differences were observed in our limited dataset, further tightly controlled studies with a larger number of patients and longitudinal assessments are required to investigate possible associations and assess the potential usefulness of these measurements for both routine clinical practice and clinical trials.
AUTHOR CONTRIBUTIONS
All authors were involved in drafting the article or revising it critically for important intellectual content, and all authors approved the final version to be published. Dr. Weiss had full access to all of the data in the study and takes responsibility for the integrity of the data and the accuracy of the data analysis.
Study conception and design
Weiss.
Acquisition of data
Francavilla, Serai, Khrichenko, Nguyen, Chauvin, Gendler.
Analysis and interpretation of data
Francavilla, Serai, Brandon, Biko, Khrichenko, Nguyen, Xiao, Chauvin, Weiss.
Supporting information
Disclosure Form
Supported by Rheumatology Research Foundation R‐Bridge Award (awarded to PFW).
Dr. Weiss receives consulting fees from Lilly and Pfizer (less than $10 000). No other disclosures relevant to this article were reported.
Author disclosures are available at https://onlinelibrary.wiley.com/action/downloadSupplement?doi=10.1002%2Facr211354&file=acr211354-sup-0001-Disclosureform.pdf.
REFERENCES
- 1. Weiss PF, Xiao R, Biko DM, Chauvin NA. Assessment of sacroiliitis at diagnosis of juvenile spondyloarthritis by radiography, magnetic resonance imaging, and clinical examination. Arthritis Care Res (Hoboken) 2016;68:187–94. [DOI] [PMC free article] [PubMed] [Google Scholar]
- 2. Weiss PF, Colbert RA. Juvenile spondyloarthritis: a distinct form of juvenile arthritis. Pediatr Clin North Am 2018;65:675–90. [DOI] [PubMed] [Google Scholar]
- 3. Navallas M, Ares J, Beltran B, Lisbona MP, Maymo J, Solano A. Sacroiliitis associated with axial spondyloarthropathy: new concepts and latest trends. Radiographics 2013;33:933–56. [DOI] [PubMed] [Google Scholar]
- 4. El Rafei M, Badr S, Lefebvre G, Machuron F, Capon B, Flipo R‐M, et al. Sacroiliac joints: anatomical variations on MR images. Eur Radiol 2018;28:5328–37. [DOI] [PubMed] [Google Scholar]
- 5. Puhakka KB, Melsen F, Jurik AG, Boel LW, Vesterby A, Egund N. MR imaging of the normal sacroiliac joint with correlation to histology. Skeletal Radiol 2004;33:15–28. [DOI] [PubMed] [Google Scholar]
- 6. Johnston JH, Kim HK, Merrow AC, Laor T, Serai S, Horn PS, et al. Quantitative skeletal muscle MRI: Part 1, derived T2 fat map in differentiation between boys with duchenne muscular dystrophy and healthy boys. AJR Am J Roentgenol 2015;205:W207–15. [DOI] [PubMed] [Google Scholar]
- 7. Nguyen JC, Allen H, Liu F, Woo KM, Zhou Z, Kijowski R. Maturation‐Related Changes in T2 Relaxation Times of Cartilage and Meniscus of the Pediatric Knee Joint at 3 T. AJR Am J Roentgenol 2018;211:1369–75. [DOI] [PMC free article] [PubMed] [Google Scholar]
- 8. Nguyen JC, Liu F, Blankenbaker DG, Woo KM, Kijowski R. Juvenile osteochondritis dissecans: cartilage T2 mapping of stable medial femoral condyle lesions. Radiology 2018;288:536–43. [DOI] [PMC free article] [PubMed] [Google Scholar]
- 9. Renner N, Kleyer A, Kronke G, Simon D, Sollner S, Rech J, et al. T2 mapping as a new method for quantitative assessment of cartilage damage in rheumatoid arthritis. J Rheumatol 2020;47:820–5. [DOI] [PubMed] [Google Scholar]
- 10. Choi JA, Gold GE. MR imaging of articular cartilage physiology. Magn Reson Imaging Clin N Am 2011;19:249–82. [DOI] [PMC free article] [PubMed] [Google Scholar]
- 11. Domayer SE, Welsch GH, Nehrer S, Chiari C, Dorotka R, Szomolanyi P, et al. T2 mapping and dGEMRIC after autologous chondrocyte implantation with a fibrin‐based scaffold in the knee: preliminary results. Eur J Radiol 2010;73:636–42. [DOI] [PubMed] [Google Scholar]
- 12. Rehnitz C, Kuni B, Wuennemann F, Chloridis D, Kirwadi A, Burkholder I, et al. Delayed gadolinium‐enhanced MRI of cartilage (dGEMRIC) and T(2) mapping of talar osteochondral lesions: Indicators of clinical outcomes. J Magn Reson Imaging 2017;46:1601–10. [DOI] [PubMed] [Google Scholar]
- 13. Vira S, Ramme AJ, Chapman C, Xia D, Regatte RR, Chang G. Juvenile particulate osteochondral allograft for treatment of osteochondral lesions of the talus: detection of altered repair tissue biochemical composition using 7 tesla MRI and T2 mapping. J Foot Ankle Surg 2017;56:26–9. [DOI] [PubMed] [Google Scholar]
- 14. Kim HK, Shiraj S, Anton CG, Horn PS, Dardzinski BJ. Age and sex dependency of cartilage T2 relaxation time mapping in MRI of children and adolescents. AJR Am J Roentgenol 2014;202:626–32. [DOI] [PubMed] [Google Scholar]
- 15. Kim HK, Laor T, Graham TB, Anton CG, Salisbury SR, Racadio JM, et al. T2 relaxation time changes in distal femoral articular cartilage in children with juvenile idiopathic arthritis: a 3‐year longitudinal study. AJR Am J Roentgenol 2010;195:1021–5. [DOI] [PubMed] [Google Scholar]
- 16. Lefebvre G, Bergère A, Rafei ME, Duhamel A, Teixeira P, Cotten A. T2 mapping of the sacroiliac joints with 3‐T MRI: a preliminary study. AJR Am J Roentgenol 2017;209:389–94. [DOI] [PubMed] [Google Scholar]
- 17. Albano D, Chianca V, Cuocolo R, Bignone R, Ciccia F, Sconfienza LM, et al. T2‐mapping of the sacroiliac joints at 1.5 Tesla: a feasibility and reproducibility study. Skeletal Radiol 2018;47:1691–6. [DOI] [PubMed] [Google Scholar]
- 18. Albano D, Bignone R, Chianca V, Cuocolo R, Messina C, Sconfienza LM, et al. T2 mapping of the sacroiliac joints in patients with axial spondyloarthritis. Eur J Radiol 2020;131:109246. [DOI] [PubMed] [Google Scholar]
- 19. Hinze C, Gohar F, Foell D. Management of juvenile idiopathic arthritis: hitting the target. Nat Rev Rheumatol 2015;11:290–300. [DOI] [PubMed] [Google Scholar]
- 20. Wallace CA, Giannini EH, Spalding SJ, Hashkes PJ, O'Neil KM, Zeft AS, et al. Clinically inactive disease in a cohort of children with new‐onset polyarticular juvenile idiopathic arthritis treated with early aggressive therapy: time to achievement, total duration, and predictors. J Rheumatol 2014;41:1163–70. [DOI] [PubMed] [Google Scholar]
- 21. Stoll ML, Cron RQ. Treatment of juvenile idiopathic arthritis: a revolution in care. Pediatr Rheumatol Online J 2014;12:13. [DOI] [PMC free article] [PubMed] [Google Scholar]
- 22. Zhao Y, Wallace C. Judicious use of biologicals in juvenile idiopathic arthritis. Curr Rheumatol Rep 2014;16:454. [DOI] [PubMed] [Google Scholar]
- 23. Maksymowych WP, Morency N, Conner‐Spady B, Lambert RG. Suppression of inflammation and effects on new bone formation in ankylosing spondylitis: evidence for a window of opportunity in disease modification. Ann Rheum Dis 2013;72:23–8. [DOI] [PubMed] [Google Scholar]
- 24. Robinson PC, Brown MA. The window of opportunity: a relevant concept for axial spondyloarthritis. Arthritis Res Ther 2014;16:109. [DOI] [PMC free article] [PubMed] [Google Scholar]
- 25. Claudepierre P. Spondyloarthritis: a window of opportunity? [Editorial]. Joint Bone Spine 2014;81:197–9. [DOI] [PubMed] [Google Scholar]
- 26. Zhang JR, Liu XJ, Xu WD, Dai SM. Effects of tumor necrosis factor‐α inhibitors on new bone formation in ankylosing spondylitis. Joint Bone Spine 2016;83:257–64. [DOI] [PubMed] [Google Scholar]
- 27. Wallace CA, Giannini EH, Spalding SJ, Hashkes PJ, O'Neil KM, Zeft AS, et al. Trial of early aggressive therapy in polyarticular juvenile idiopathic arthritis. Arthritis Rheum 2012;64:2012–21. [DOI] [PMC free article] [PubMed] [Google Scholar]
- 28. Haroon N, Inman RD, Learch TJ, Weisman MH, Lee M, Rahbar MH, et al. The impact of tumor necrosis factor α inhibitors on radiographic progression in ankylosing spondylitis. Arthritis Rheum 2013;65:2645–54. [DOI] [PMC free article] [PubMed] [Google Scholar]
- 29. Li X, Cheng J, Lin K, Saadat E, Bolbos RI, Jobke B, et al. Quantitative MRI using T1ρ and T2 in human osteoarthritic cartilage specimens: correlation with biochemical measurements and histology. Magn Reson Imaging 2011;29:324–34. [DOI] [PMC free article] [PubMed] [Google Scholar]
- 30. Chauvin NA, Xiao R, Brandon TG, Biko DM, Francavilla M, Khrichenko D, et al. MRI of the sacroiliac joint in healthy children. AJR Am J Roentgenol 2019:1–7. [DOI] [PubMed] [Google Scholar]
- 31. Ader DN. Developing the Patient‐Reported Outcomes Measurement Information System (PROMIS). Med Care 2007;45 Suppl 1:S1–2. [DOI] [PMC free article] [PubMed] [Google Scholar]
- 32. Calin A, Garrett S, Whitelock H, Kennedy LG, O'Hea J, Mallorie P, et al. A new approach to defining functional ability in ankylosing spondylitis: the development of the Bath Ankylosing Spondylitis Functional Index. J Rheumatol 1994;21:2281–5. [PubMed] [Google Scholar]
- 33. Garrett S, Jenkinson T, Kennedy LG, Whitelock H, Gaisford P, Calin A. A new approach to defining disease status in ankylosing spondylitis: the Bath Ankylosing Spondylitis Disease Activity Index. J Rheumatol 1994;21:2286–91. [PubMed] [Google Scholar]
- 34. Bae JH, Hosseini A, Wang Y, Torriani M, Gill TJ, Grodzinsky AJ, et al. Articular cartilage of the knee 3 years after ACL reconstruction: a quantitative T2 relaxometry analysis of 10 knees. Acta Orthop 2015;86:605–10. [DOI] [PMC free article] [PubMed] [Google Scholar]
- 35. Baum T, Joseph GB, Karampinos DC, Jungmann PM, Link TM, Bauer JS. Cartilage and meniscal T2 relaxation time as non‐invasive biomarker for knee osteoarthritis and cartilage repair procedures. Osteoarthritis Cartilage 2013;21:1474–84. [DOI] [PMC free article] [PubMed] [Google Scholar]
- 36. Baum T, Stehling C, Joseph GB, Carballido‐Gamio J, Schwaiger BJ, Müller‐Höcker C, et al. Changes in knee cartilage T2 values over 24 months in subjects with and without risk factors for knee osteoarthritis and their association with focal knee lesions at baseline: data from the osteoarthritis initiative. J Magn Reson Imaging 2012;35:370–8. [DOI] [PMC free article] [PubMed] [Google Scholar]
- 37. Maksymowych WP, Lambert RG, Brown LS, Pangan AL. Defining the minimally important change for the spondyloarthritis research consortium of canada spine and sacroiliac joint magnetic resonance imaging indices for ankylosing spondylitis. J Rheumatol 2012;39:1666–74. [DOI] [PubMed] [Google Scholar]
- 38. Weiss PF, Maksymowych WP, Lambert RG, Jaremko JL, Biko DM, Paschke J, et al. Feasibility and reliability of the Spondyloarthritis Research Consortium of Canada sacroiliac joint inflammation score in children. Arthritis Res Ther 2018;20:56. [DOI] [PMC free article] [PubMed] [Google Scholar]
- 39. Weiss PF, Maksymowych WP, Lambert RG, Jaremko JL, Biko DM, Paschke J, et al. Feasibility and reliability of the spondyloarthritis research consortium of canada sacroiliac joint structural score in children. J Rheumatol 2018;45:1411–17. [DOI] [PubMed] [Google Scholar]
- 40. Cicchetti D. Guidelines, criteria, and rules of thumb for evaluating normed and standardized assessment instruments in psychology. Psychological Assessment 1994;6:284–90. [Google Scholar]
- 41. Kim HK, Serai S, Lindquist D, Merrow AC, Horn PS, Kim DH, et al. Quantitative skeletal muscle MRI: Part 2, MR spectroscopy and T2 relaxation time mapping—comparison between boys with duchenne muscular dystrophy and healthy boys. AJR Am J Roentgenol 2015;205:W216–23. [DOI] [PubMed] [Google Scholar]
- 42. Kim HK, Serai S, Merrow AC, Wang L, Horn PS, Laor T. Objective measurement of minimal fat in normal skeletal muscles of healthy children using T2 relaxation time mapping (T2 maps) and MR spectroscopy. Pediatr Radiol 2014;44:149–57. [DOI] [PubMed] [Google Scholar]
- 43. Kijowski R, Blankenbaker DG, Munoz Del Rio A, Baer GS, Graf BK. Evaluation of the articular cartilage of the knee joint: value of adding a T2 mapping sequence to a routine MR imaging protocol. Radiology 2013;267:503–13. [DOI] [PubMed] [Google Scholar]
- 44. Behzadi C, Welsch GH, Laqmani A, Henes FO, Kaul MG, Schoen G, et al. The immediate effect of long‐distance running on T2 and T2* relaxation times of articular cartilage of the knee in young healthy adults at 3.0 T MR imaging. Br J Radiol 2016;89:20151075. [DOI] [PMC free article] [PubMed] [Google Scholar]
- 45. Gatti AA, Noseworthy MD, Stratford PW, Brenneman EC, Totterman S, Tamez‐Peña J, et al. Acute changes in knee cartilage transverse relaxation time after running and bicycling. J Biomech 2017;53:171–7. [DOI] [PubMed] [Google Scholar]
Associated Data
This section collects any data citations, data availability statements, or supplementary materials included in this article.
Supplementary Materials
Disclosure Form