

ABSTRACT
Sialic acids are present in humans and other metazoans, playing essential roles in physiological and pathological processes. Commensal and pathogenic bacteria have evolved the capacity to utilize sialic acids as nutrient and energy sources. However, in some actinobacteria, sialic acid catabolism (SAC) is associated with free-living populations. To unravel the distribution and evolutionary history of SAC in the phylum Actinobacteria, we analyzed the presence and diversity of the putative SAC gene cluster (nan) in 7,180 high-quality, nonredundant actinobacterial genomes that covered 1,969 species. The results showed that ∼13% of actinobacterial species had the potential to utilize sialic acids, with 45 species capable of anhydro-SAC, all except two of them through the canonical pathway. These species belonged to 20 orders and 81 genera, with ∼36% of them from four genera, Actinomyces, Bifidobacterium, Corynebacterium, and Streptomyces. Moreover, ∼40% of the nan-positive species are free living. Phylogenetic analysis of the key nan genes, nanA, nanK, and nanE, revealed a strong signal of horizontal gene transfer (HGT), accompanied with vertical inheritance and gene loss. This evolutionary pattern led to high diversity and differential distribution of nan among actinobacterial taxa and might cause the cluster to spread to some free-living species while losing in some host-associated species. The evolution of SAC in actinobacteria probably represents the evolution of certain kinds of noncore bacterial functions for environmental adaptation and lifestyle switch, in which HGT plays a dominant role.
IMPORTANCE Sialic acids play essential roles in the physiology of humans and other metazoan animals, and microbial sialic acid catabolism (SAC) is one of the processes critical for pathogenesis. To date, microbial SAC is studied mainly in commensals and pathogens, while its distribution in free-living microbes and evolutionary pathway remain largely unexplored. Here, by examining all actinobacterial genomes available, we demonstrate that putative SAC is present in a small proportion of actinobacterial species, of which, however, ∼40% are free-living species. We also reveal remarkable difference in the distribution of SAC among actinobacterial taxa and high diversity of the putative SAC gene clusters. HGT plays a significant role in the evolution of SAC, accompanied with vertical inheritance and gene loss. Our results provide a comprehensive and systematic picture of the distribution and evolutionary history of SAC in actinobacteria, expanding the current knowledge on bacterial adaptation and diversification.
KEYWORDS: sialic acid catabolism, Actinobacteria, evolution, distribution, horizontal gene transfer, free-living species, environmental adaptation
INTRODUCTION
Sialic acids, or neuraminic acids, is the designation given to a family of nine-carbon keto sugar acids, the most common of which is N-acetyl-neuraminic acid (Neu5Ac) (1). Sialic acids are generally found at the outermost end of glycan chains present in glycoconjugates, which decorate cell surfaces and mediate a diverse range of cell-cell or cell-molecule interactions in eukaryotes (2, 3). Sialic acids are also major components of mucin (4–6), modulating a wide variety of physiological and pathological processes and playing pivotal roles in complex metazoan animals (7, 8). Because of the extensive distribution of sialic acids in metazoans, commensal and pathogenic bacteria have evolved the capacity to utilize sialic acids as carbon, nitrogen, and energy sources (2, 9, 10). Previous studies have shown that sialic acid catabolism (SAC) among bacteria is confined mainly to commensals and pathogens (9, 11–13). In addition, considering the important function of sialic acids for vertebrates, microbial SAC has been regarded as a virulence determinant in a range of infectious diseases (2, 9). Therefore, it is of great significance to investigate the distribution and evolution of SAC in microorganisms.
The complete SAC pathway usually contains the following steps. First, sialidases cleave terminal Neu5Ac residues from host glycoconjugates (14, 15). There are many different sialidases across microbes. Those that catalyze sialic acid cleavage can be separated into two classes: hydrolytic sialidases that release Neu5Ac and intramolecular trans-sialidases (IT-sialidases) that release 2,7-anhydro-Neu5Ac (16). Then, free (2,7-anhydro-)Neu5Ac enters into cells via four specialized transport systems: the major facilitator superfamily (MFS) permease, the tripartite ATP-independent periplasmic (TRAP) transporter, the sodium solute symporter (SSS), and the ATP-binding cassette (ABC) transporter (17). According to their evolutionary origins, these transporters can be further classified into eight sialic acid transporter (ST) families (ST1 to ST8) (18). After transport, 2,7-anhydro-Neu5Ac is converted back into Neu5Ac by cytoplasmic oxidoreductase NanOx (NanY in Escherichia coli) (19) and intracellular sialic acid is broken down to N-acetylglucosamine-6-phosphate (GlcNAc-6-P) by two alternative pathways. The canonical (Escherichia coli paradigm) pathway is composed of the sequential action of Neu5Ac lyase (NanA), N-acetyl-mannosamine kinase (NanK), and N-acetyl-mannosamine epimerase (NanE) (20), and the Bacteroidetes paradigm pathway relies on NanA, NanE-II (GlcNAc epimerase), and RokA (glucokinase) (21, 22). Finally, GlcNAc-6-P is deacetylated by GlcNAc-6-P deacetylase (NagA) and further converted by glucosamine-6-P deaminase (NagB) into fructose-6-phosphate, which enters into the subsequent glucolytic pathway (2, 11). In bacteria, the genes involved in the first three intracellular steps of the canonical SAC pathway or the first two steps of the Bacteroidetes pathway usually cluster together, forming a gene cluster denominated as nan (15, 23). However, nagA and nagB vary a lot in their locations among different genomes encoding SAC, either within or far away from the nan cluster, and the sialidase gene is not necessary for all strains capable of SAC (9, 15, 24). For ease of analysis, a complete canonical SAC system is usually defined as one that minimally includes clustered nanA, nanK, and nanE (2, 23), and an alternative Bacteroidetes SAC system minimally includes clustered nanA and nanE-II and contains rokA, too (21, 22).
To date, our understanding of SAC comes largely from commensal and pathogenic bacteria, biasing the knowledge of its ecology and evolution. Actinobacteria is a phylum of ubiquitous Gram-positive bacteria with high genomic G+C contents and diverse physiological and metabolic properties. The phylum has been attracting much attention as a rich source of various bioactive substances and for the complex evolution and diversification processes (25, 26). Although members of this phylum are widely distributed in both terrestrial and aquatic ecosystems, they also contain a large number of pathogens and commensals of humans and animals, such as the genera Actinomyces and Bifidobacterium (27, 28). It has been proved that some actinobacteria have evolved the capacity to degrade sialic acids (14, 29). In particular, there is experimental evidence showing that some free-living actinobacterial species can utilize sialic acids as a sole carbon and energy source. For example, Corynebacterium glutamicum can grow on Neu5Ac and has a full complement of genes for SAC, suggesting that SAC may have physiological roles in the soil environment (30). Our recent studies on different Streptomyces species, Streptomyces albidoflavus and Streptomyces olivaceus, residing in both free-living and insect-associated habitats have demonstrated that SAC is significantly associated, however, with free-living strains (31, 32). Despite these, the phylogenetic and ecological distribution and evolutionary pattern of SAC in the phylum Actinobacteria remain uncharacterized. Based on the NanA phylogeny and transporter distribution, McDonald et al. showed that SAC has evolved multiple times in bacteria but all strains of Actinobacteria form a supercluster that is the most divergent from other bacteria (except that the authors mistakenly assigned Actinobacillus of the phylum Proteobacteria and Mycoplasma of the phylum Tenericutes to Actinobacteria) (13). This likely implies that the evolution of SAC within actinobacteria is relatively independent from other bacteria, thus making Actinobacteria an ideal sample for studying how SAC spreads and evolves within an ancient bacterial phylum.
Here, we surveyed all available genomes of Actinobacteria to characterize the distribution and evolutionary history of putative SAC in the phylum. We assessed the presence/absence of SAC genes and gene clusters among actinobacterial taxa at different taxonomic levels and among both free-living and host-associated species. In addition, we characterized the phylogeny and genetic organization of the nan clusters. The study provides the first systematic and comprehensive insights into the diversity and evolutionary mechanism of actinobacterial SAC and expands the current knowledge of the genetic basis of bacterial adaptation and diversity.
RESULTS
Distribution of putative SAC genes in Actinobacteria.
We first examined the distribution of the three necessary genes for canonical SAC pathway, nanA, nanK, and nanE (hereafter nanA/K/E), in 7,180 high-quality and nonredundant available actinobacterial genomes (see Materials and Methods). We found that putative nanA and nanK genes were widely distributed in all six classes of Actinobacteria but putative nanE genes were distributed in only two classes, Actinomycetia and Coriobacteriia. To avoid statistical bias caused by intensive sequencing of single species, we used the 1,969 type strains (which represent species) in the data set to calculate the positive rate of nan genes in actinobacteria. The result showed that putative nanA and nanK occurred in nearly all of the actinobacterial species (99.64% and 97.71%, respectively) but putative nanE occurred in only 21.38% (421/1,969) of the species. In addition, the copy numbers of the three genes among the respective positive species also differed significantly (Fig. 1A), with that of nanK the highest and that of nanE the lowest. Nearly all (418/421) the nanE-positive species contained nanA and nanK, too (Fig. 1B). These results suggest that, in actinobacteria, nanE may represent the nan gene cluster better than nanA and nanK.
FIG 1.

Distribution of putative sialic acid catabolism (SAC) genes and gene clusters among 1,969 actinobactieral species. (A) Violin plots showing the distribution of copy numbers of putative SAC genes within each genome. Only genomes containing the genes were considered. Center solid lines, median; dashed lines, quartile. (B and C) Venn diagram showing the presence of SAC genes and their distribution. nanA/K/E, containing all three genes (nanA, nanK, and nanE). (D) Phylogenetic reconstruction of the phylum Actinobacteria to map the taxonomic distribution of SAC. The tree was produced by using FastTree based on 138 universally conserved proteins of 1,969 type strains of Actinobacteria. Species with putative SAC are marked as red (canonical paradigm) and green (Bacteroidetes paradigm), and colored branches indicate different orders. The tree is rooted with nonactinobacterial strains (Vibrio cholerae N16961, Staphylococcus aureus USA300, and Escherichia coli MG1655). Scale bar indicates 50% sequence divergence.
For the Bacteroidetes paradigm pathway, 88.17% of the species contained putative rokA, but 84.62% of the genes showed homology to nanK. Only seven species (all belonging to the class Coriobacteriia, six from Eggerthellales, and one from Coriobacteriales) contained nanE-II, with one copy per genome. Of these, only Rubneribacter badeniensis ResAG-85T and “Arabia massiliensis” Marseille-P3078T from the order Eggerthellales contained both nanE-II (clustered with nanA) and rokA, indicating that the alternative pathway is rare in Actinobacteria.
Furthermore, 31.13% (613/1,969) of the species contained putative sialidase genes with a median copy number of 1 per genome (Fig. 1A), and 5.06% (31/613) of these species encoded IT-sialidases. Around 37.80% (158/418) of the species that contained all nanA/K/E genes lacked sialidase genes (Fig. 1C). In addition, 18.18% (358/1,969) of the species contained putative nanOx responsible for converting 2,7-anhydro-Neu5Ac into Neu5Ac, among which 22.91% (82/358) of species contained all nanA/K/E (Fig. 1C). The above-mentioned two species with both nanE-II and rokA contained neither sialidase genes nor nanOx.
Distribution of putative SAC in Actinobacteria.
To make the study tractable, we considered a strain to contain the SAC pathway only if its nanA/K/E genes are located within 10 open reading frames (ORFs) of each other (canonical paradigm) (23) or if it possesses clustered nanA and nanE-II (within 10 consecutive ORFs) and has rokA, too (Bacteroidetes paradigm). As shown in Table 1, putative SAC was distributed in 18.04% (1,295/7,180) of all actinobacterial strains tested and in 13.05% (257/1,969) of the species. Among them, only five strains and two species (Rubneribacter badeniensis and “Arabia massiliensis”) from the order Eggerthellales contained the putative Bacteroidetes pathway, and these strains/species did not have the canonical pathway. Among the 44 orders analyzed, 18 orders of the class Actinomycetia and two orders of the class Coriobacteriia were detected to contain SAC, with positive rates for species ranging from 1.78% to 69.23%. The positive rate was the highest in the order Actinomycetales, followed by Dermabacterales (66.67%), Coriobacteriales (52.63%), and Eggerthellales (50.00%), but was lower than one-third in the other orders (Table 1). The distribution of SAC was more different among families and genera (only those with at least three species in the final data set were considered), even among those belonging to the same order (Table S1). For example, the positive rate in the order Mycobacteriales was 9.32%, but the rates ranged from 0% (e.g., Gordoniaceae, Dietziaceae, Tsukamurellaceae) to 32.71% (Corynebacteriaceae) at the family level; although the positive rate in the order Actinomycetales approximated to 70%, no more than one-third of the species of the genera Varibaculum (33.33%) and Arcanobacterium (25.00%) of this order contained nan clusters. The 257 putative SAC-positive species belonged to 81 genera, interspersed among the Actinobacteria species phylogeny (Fig. 1D), and 36.19% (93/257) of these species were affiliated with four genera, Actinomyces, Bifidobacterium, Corynebacterium, and Streptomyces (Table S1). Collectively, these data suggest that the capacity for SAC in the phylum Actinobacteria is not innate. That is, the common ancestor of actinobacteria might not contain nan, but individual positive taxa likely acquired the cluster through horizontal gene transfer (HGT).
TABLE 1.
Distribution of putative sialic acid catabolism among actinobacterial orders
| Class | Order | No. of strains | No. of strains with SACa | Positive rateb | No. of type strains | No. of type strains with SACa | Positive rate in type strainsb |
|---|---|---|---|---|---|---|---|
| Acidimicrobiia | Acidimicrobiales | 3 | 0 | ND | 3 | 0 | ND |
| Iamiales | 4 | 0 | ND | 4 | 0 | ND | |
| Actinomycetia | Acidothermales | 1 | 0 | ND | 1 | 0 | ND |
| Actinocatenisporales | 1 | 0 | ND | 1 | 0 | ND | |
| Actinomycetales | 229 | 179 | 78.17% | 65 | 45 | 69.23% | |
| Antricoccales | 4 | 0 | ND | 3 | 0 | ND | |
| Beutenbergiales | 7 | 1 | 14.29% | 5 | 1 | 20.00% | |
| Bifidobacteriales | 748 | 187 | 25.00% | 91 | 24 | 26.37% | |
| Bogoriellales | 13 | 1 | 7.69% | 8 | 1 | 12.50% | |
| Brevibacteriales | 70 | 33 | 47.14% | 13 | 4 | 30.77% | |
| Catenulisporales | 2 | 0 | ND | 2 | 0 | ND | |
| Cellulomonadales | 133 | 17 | 12.78% | 61 | 5 | 8.20% | |
| Cryptosporangiales | 3 | 0 | ND | 3 | 0 | ND | |
| Demequinales | 28 | 0 | 0.00% | 17 | 0 | 0.00% | |
| Dermabacterales | 34 | 21 | 61.76% | 12 | 8 | 66.67% | |
| Dermatophilales | 114 | 12 | 10.53% | 60 | 8 | 13.33% | |
| Frankiales | 30 | 0 | 0.00% | 11 | 0 | 0.00% | |
| Geodermatophilales | 72 | 0 | 0.00% | 34 | 0 | 0.00% | |
| Glycomycetales | 16 | 0 | 0.00% | 14 | 0 | 0.00% | |
| Jatrophihabitantales | 4 | 0 | ND | 1 | 0 | ND | |
| Jiangellales | 17 | 0 | 0.00% | 13 | 0 | 0.00% | |
| Kineosporiales | 13 | 0 | 0.00% | 6 | 0 | 0.00% | |
| Microbacteriales | 792 | 53 | 6.69% | 173 | 12 | 6.94% | |
| Micrococcales | 499 | 121 | 24.25% | 81 | 19 | 23.46% | |
| Micromonosporales | 270 | 33 | 12.22% | 103 | 10 | 9.71% | |
| Motilibacterales | 2 | 0 | ND | 2 | 0 | ND | |
| Mycobacteriales | 1,759 | 237 | 13.47% | 429 | 40 | 9.32% | |
| Nakamurellales | 7 | 1 | 14.29% | 6 | 1 | 16.67% | |
| Propionibacteriales | 309 | 20 | 6.47% | 129 | 14 | 10.85% | |
| Pseudonocardiales | 247 | 9 | 3.64% | 169 | 3 | 1.78% | |
| Ruaniales | 8 | 3 | 37.50% | 2 | 1 | ND | |
| Sporichthyales | 1 | 0 | 1 | 0 | ND | ||
| Streptomycetales | 1,286 | 184 | 14.31% | 265 | 25 | 9.43% | |
| Streptosporangiales | 195 | 19 | 9.74% | 118 | 13 | 11.02% | |
| Coriobacteriia | Coriobacteriales | 154 | 116 | 75.32% | 19 | 10 | 52.63% |
| Eggerthellales | 81 | 48 | 59.26% | 26 | 13 | 50.00% | |
| Nitriliruptoria | Egibacterales | 1 | 0 | ND | 1 | 0 | ND |
| Egicoccales | 1 | 0 | ND | 1 | 0 | ND | |
| Euzebyales | 2 | 0 | ND | 2 | 0 | ND | |
| Nitriliruptorales | 1 | 0 | ND | 1 | 0 | ND | |
| Rubrobacteria | Gaiellales | 1 | 0 | ND | 1 | 0 | ND |
| Rubrobacterales | 5 | 0 | 0.00% | 3 | 0 | ND | |
| Thermoleophilia | Solirubrobacterales | 12 | 0 | 0.00% | 8 | 0 | 0.00% |
| Thermoleophilales | 1 | 0 | ND | 1 | 0 | ND | |
| Total | 7,180 | 1,295 | 18.04% | 1,969 | 257 | 13.05% |
SAC, sialic acid catabolism, here equal to cooccurrence and genetic linkage of nanA/K/E genes within 10 open reading frames (ORFs) (canonical paradigm) or to containing clustered nanA and nanE-II (within 10 consecutive ORFs) and having rokA as well (Bacteroidetes paradigm). The putative Bacteroidetes SAC is detected in only five strains (including two type strains) from the order Eggerthellales, and these strains do not contain the putative canonical SAC.
The positive rate is calculated only when the total number of strains is at least 5. ND, no data.
Distribution of putative SAC in animal-associated and non-animal-associated Actinobacteria species.
Based on the isolation source information of the 1,969 species used in this study, 1,923 (97.66%) species could be divided into two major source categories: animal host-associated (e.g., intestine, urinary tract, oral cavity, cow milk; 609 species) and non-animal-associated (e.g., soil, lakes, sea, plant-associated; 1,314 species). Among them, putative SAC was found in 24.79% (151/609) of the animal host-associated species but only in 7.84% (103/1,314) of the non-animal-associated species (P < 2.2e−16, Fisher’s exact test). This is in accordance with the fact that sialic acids are generally found in glycoconjugates in animals. Unexpectedly, however, we did not detect nan in any member of Mycobacterium or Nocardia, two genera both containing a large number of animal host-associated species, although we analyzed 354 strains/74 species (193/62 host-associated) for Mycobacterium and 132 strains/76 species (65/39 host-associated) for Nocardia (Table S1). In addition, among the species with putative SAC, 40.08% (103/257) were non-animal-associated, including those of the genera Streptomyces (with a nan-positive rate of 8.37%), Rhodococcus (9.68%), Micromonospora (13.43%), and Tessaracoccus (66.67%) (Table S1). Notably, all nan-positive Streptomyces species (except for one of unknown source) were isolated from free-living habitats such as soil, although the positive rate (8.37%) was much lower than that of animal-associated genus Actinomyces (83.33%).
Moreover, 17.51% (45/257) of the putative SAC-positive species possessed nanOx, and 64.44% (29/45) of these species were non-animal-associated, indicating that a small number of actinobacteria, mainly free-living, have the capacity for anhydro-SAC. However, the 31 actinobacterial species with IT-sialidase genes were all animal associated, of which 24 species also contained nan and only Devriesea agamarum (order Dermabacterales) contained both nan and nanOx (outside the cluster). The information suggests that, in actinobacteria, the ability to release anhydro-sialic acids might be limited to a few animal-associated species, with very few species capable of both releasing and utilizing anhydro-sialic acids.
Evolution of the nan gene clusters in Actinobacteria.
As mentioned above, the putative Bacteroidetes SAC pathway was found in only two actinobacterial species (and 5 strains); hence, we focused the following analyses on the canonical pathway. Phylogenetic analysis of individual nanA/K/E genes in actinobacteria (Fig. S1) showed that copies of these genes from nan clusters tend to form closely related branches rather than mix with the branches of the other copies. It is thus likely that the nanA/K/E genes within the clusters have undergone evolutionary processes different from those of their homologous genes scattered outside the clusters. Moreover, phylogenies of individual nanA/K/E within the gene clusters were incongruent with each other (Fig. S2). For instance, as shown in Fig. 2, Tessaracoccus oleiagri CGMCC 1.9159T (order Propionibacteriales) contained nanA most similar to that of Actinomyces israelii DSM 43320T (order Actinomycetales) but nanK and nanE most similar to those of Corynebacterium pyruviciproducens ATCC BAA_1742T (order Mycobacteriales), and Corynebacterium mustelae DSM 45274T contained nanA and nanE most similar to those of Gleimia coleocanis DSM 15436T (order Actinomycetales) and nanK most similar to that of Corynebacterium ulcerans NCTC 7910T. These observations suggest that the clustered nanA/K/E genes may also have evolutionary histories different from each other.
FIG 2.
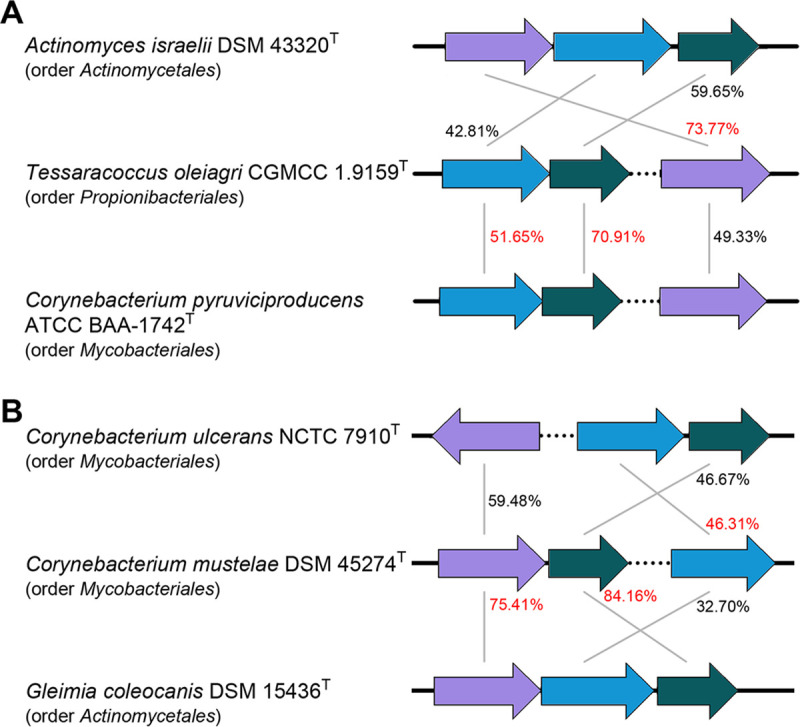
Comparisons of amino acid sequence identities of nanA, nanK, and nanE of Tessaracoccus oleiagri CGMCC 1.9159T (A) and Corynebacterium mustelae DSM 45274T (B) with the most similar counterparts of other actinobacteria. Sequence identities between homologues are indicated. The highest values between these two strains and other strains are marked in red. Only the nanA (purple), nanK (blue), and nanE (dark green) within the nan gene clusters are shown. Genes inserted are marked as dashed lines.
We next performed phylogenetic analysis based on the concatenated proteins encoded by the clustered nanA/K/E. The resulting trees (Fig. 3 and Fig. S3) showed apparent inconsistencies with the corresponding species trees that showed a clear separation of different actinobacterial orders (Fig. S4 and Fig. 1D). The NanA-K-E tree of 255 species could be divided into seven well-separated clades, clades I to VII (Fig. 3 and Fig. S4). The orders Eggerthellales and Coriobacteriales of the class Coriobacteriia and the order Bifidobacteriales were located in the terminal branches (clade VII) of the NanA-K-E tree, neighbored with some species of the order Actinomycetales. But the former three orders were located at the base of the species tree, distinct from the other orders (Fig. S4). Furthermore, in the NanA-K-E tree, taxa from the same order were often distributed in different clades, and the genus Corynebacterium was distributed in clades V to VII (Fig. 3). These phenomena indicate that some nan clusters of the same orders, and even of the same genera, might have different origins or experience different evolutionary processes. Meanwhile, the phylogeny showed clear signals for interorder HGT of nan: species Calidifontibacter indicus of the order Dermatophilales was stably located in a branch of four genera from the order Propionibacteriales in clade III, and similar situations were found for species Actinoplanes missouriensis of the order Micromonosporales, Tessaracoccus oleiagri of the order Propionibacteriales, and Ruania albidiflava of the order Ruaniales (Fig. 3). Nevertheless, in general, most strains from the same orders tended to cluster together in the NanA-K-E phylogeny, although they are often clustered in different clades. In addition, some shallow branches in the NanA-K-E tree and species tree had the same topological structures, such as a branch in clade VII formed by one Peptidiphaga species, two Actinobaculum species, and four Actinotignum species from the order Actinomycetales (Fig. S4). All these observations indicate that the spreading of nan among actinobacterial orders is due mainly to occasional HGT events of nan genes, which are further propagated in respective orders by subsequent intraorder HGT as well as vertical inheritance among closely related species.
FIG 3.

Phylogeny of the concatenated NanA-K-E proteins of 255 actinobacterial species, with features of each nan gene cluster and the source of each species indicated. The tree was produced using FastTree. Nodes with bootstrap values less than 60% are marked with orange circles. Colored background of strain names indicates different orders. “I” to “VII” indicate genetic clades. Scale bar indicates 50% sequence divergence. Circles from the outside to the inside indicate the type of structures of the nan clusters, the type of regulator genes (COG K), the family of transporters, the presence or absence of sialidase gene and nanOx, nagB, nagA, mobilome (COG X), and insertion sequences (IS) around/within the nan clusters, and the source of the strains, respectively. ABC, ABC transporter; SSS, sodium solute symporter; MFS, major facilitator superfamily; ST, sialic acid transporter; ND, not determined.
Furthermore, we found a rough correlation between the phylogenetic clades of nan and the source of the species. Clades VI and VII contained mainly (96/106, 90.57%) animal-associated species, while clades IV and V contained mainly (58/72, 80.56%) non-animal-associated species (with eight animal-associated species forming a monophyletic branch) (Fig. 3). Meanwhile, the isolation sources of nan-positive species in clades I and III (except for the species of Actinomyces in a subclade) showed frequent alternation between animal- and non-animal-associated environments, suggesting a high frequency of nan gene exchange between the host-associated and free-living species.
Gain and loss events of the nan clusters in Actinobacteria.
To further decipher the evolutionary history of the nan gene cluster in Actinobacteria, we assessed the gain and loss events of this cluster among the species using COUNT (33). As a result, 135 gains and 18 losses were detected, which were scattered among the species tree with 88 gains and 14 losses occurring at the species level (Fig. S5). No gene gain or loss events were inferred to have occurred in the last common ancestor of any orders, supporting that nan clusters were acquired by Actinobacteria strains through HGT long after the early divergence of the phylum. Furthermore, 95.29% (243/255) and 9.80% (25/255) of the nan-positive species embraced insertion sequences (ISs) and mobilome genes (Clusters of Orthologous Group [COG] X) around nan, respectively (Fig. 3), providing more evidence for potential HGT events of nan (34, 35). For instance, in a species tree branch containing six strains of Corynebacterium accolens, only two strains contained nan clusters, adjacent to which were a series of genes encoding transposases/integrases (all annotated as IS and proteins of COG X), and the genes at both ends of the regions were quite conserved (Fig. 4). Moreover, these genomic regions of nan were identified as genomic islands by Islandviewer (36), underpinning that SAC was introduced into the two Corynebacterium strains by HGT.
FIG 4.

Genetic organization of the regions containing nan clusters indicating HGT events in Corynebacterium accolens strains. The figure was obtained by EasyFig, where grayscale bars represent regions of shared similarity according to BLASTN. Genomic islands detected by Islandviewer are marked with yellow background. The tree on the left shows the phylogenetic relationships of the corresponding strains based on 138 universally conserved proteins of Actinobacteria, and strains with the nan cluster are marked as red. Branch lengths are ignored, and bootstrap values less than 70% are shown. Putative nagA genes annotated with no observed Pfam domains are indicated with asterisks. SSS, sodium solute symporter transporter; ST, sialic acid transporter.
Meanwhile, several gene loss events were detected in the genus Alloscardovia (Fig. 5). All analyzed Alloscardovia species contained complete nan clusters, except for 4 out of the 10 strains of Alloscardovia omnicolens, a species dwelling everywhere in the human body (37). Comparison of the genomic regions of the nan clusters illustrated that the nan-negative strain 476_GVAG lost nanA and transporter genes, and the other three nan-negative strains lost nanA/K/E and transporter genes (Fig. 5A). In addition, in the remaining nagB of the negative strains, there was an 187A insertion that resulted in a premature termination codon mutation and a 33-nucleotide deletion at positions 573 to 606 (Fig. 5B). These two mutations probably inactivate nagB, supporting that these strains are gradually losing the whole nan cluster, although there was another copy of nagB (with amino acid identity of <39.5%) in their genomes.
FIG 5.

Gene loss events occurring in the nan clusters of the genus Alloscardovia. (A) Comparison of the genetic organization of the regions containing nan genes. The figure was obtained by EasyFig, where grayscale bars represent regions of shared similarity according to BLASTN. Pfam annotations for the other genes within the nan clusters are also given, and genes with no Pfam annotations are indicated with a bracket. The tree on the left shows the phylogenetic relationships of the corresponding strains based on 138 universally conserved proteins of Actinobacteria, and strains with nan clusters are marked as red. Square brackets indicate that structures of the regions of the bracketed strains are the same. Branch lengths are ignored, and bootstrap values less than 70% are shown. ABC, ABC transporter; ST, sialic acid transporter. (B) Sequence alignment of the nagB. Gaps are indicated by dots. Identical (100%), conserved (75 to 99%), and blocks (50 to 74%) of similar amino acid residues are shaded in dark blue, pink, and cyan, respectively. Numbers show the positions of the bases in the gene alignment.
Compositional and structural diversity of the nan clusters.
We found a high diversity of nan by comparing the genetic organization of the gene clusters among actinobacterial species. The clusters contained genes encoding three of the four major superfamilies of bacterial transporters (ABC, MFS, and SSS; Fig. 3 and 6). The ABC superfamily was widely distributed in 88.24% of actinobacterial SAC systems, containing two different ST families. Most of the ABC transporters were featured as Pfam SBP_bac_5 (PF00496, ST3) that transports Neu5Ac, and the remaining were SBP_bac_1 (PF01547, ST7) that specializes in the uptake of 2,7-anhydro-Neu5Ac, occurring in six species of the genera Beutenbergia (n = 1), Ruania (n = 1), and Actinomyces (n = 4). The MFS superfamily was present in 22 species of clades V and VII, including 18 species with ST1 family transporters and four Actinomycetales species that embraced both ABC (ST3) and MFS transporters (ST family not determined). The SSS superfamily (ST5) occurred in nine species that formed two monophyletic branches in clades I and V of the nan phylogeny. Three nan clusters were found to contain no transporter genes. Two of the clusters were located only at contig boundaries of the genome sequences, where genes might be missing. But the transporter system of Arthrobacter castelli DSM 16402T was truncated, leaving two genes of PF00528 (BPD_transp_1), possibly implying gene loss from the original cluster or HGT of partial transporter genes into the cluster.
FIG 6.

Compositional and structural diversity of the nan clusters in actinobacteria. (A) Consecutive nanA/K/E type: nan clusters with nanA/K/E located next to each other in sequence. (B) Inconsecutive nanA/K/E type: nan clusters with nanA/K/E separated by other genes. ABC, ABC transporter; SSS, sodium solute symporter; MFS, major facilitator superfamily transporter; ST, sialic acid transporter.
Among the nan clusters of 255 actinobacterial species, 71 and 123 nan clusters contained nagA and nagB, respectively, 68 of which contained both (Fig. 3). Eighty-two nan clusters contained sialidase genes, of which 12 clusters (all from animal host-associated species) contained IT-sialidase genes (Fig. 3). Only five nan clusters harbored nanOx, and all of them occurred in free-living species, of which Beutenbergia cavernae and Ruania albidiflava also possessed ST7 transporters for anhydro-Neu5Ac (Fig. 3). Regarding the regulation of SAC in actinobacteria, nearly all nan clusters (96.58%, 226/234) in the class Actinomycetia contained the regulator gene fadR (COG2186), whereas those in the class Coriobacteriia contained glpR (COG1349), whiA (COG1481), acrR (COG2207), etc. instead or did not contain regulator genes (Fig. 3). These results suggest that the related components of nan clusters in actinobacteria have evolved multiple times, further enhancing the diversity of the clusters.
Moreover, according to the arrangement of nanA/K/E genes, structures of the nan clusters in actinobacteria could be grouped into two major types, consecutive nanA/K/E and inconsecutive nanA/K/E (Fig. 6). In general, the nanA/K/E genes were located next to each other in sequence (Fig. 6A). Among the species with this nan type, Glutamicibacter nicotianae (order Micrococcales, clade I) and seven Streptomyces species in a clade V branch possessed an additional copy of nanA that was located next to the nan clusters (Fig. 3). This nanA copy of Streptomyces species shared 55.04 to 57.04% (mean, 55.89%) amino acid identity with those in the adjacent nan clusters but a higher mean identity of 63.01% with those of three Kitasatospora species in clade IV. It is thus suggested that HGT of nanA has occurred between Streptomyces and Kitasatospora, two genera previously reported to have undergone extensive recombination (38, 39). In addition, almost all nan-positive actinobacteria contained only one nan cluster, but Tessaracoccus lapidicaptus IPBSL-7T contained two copies of the cluster. These two nan copies were located in different contigs of the genome sequence and shared 81.71% amino acid identity of NanA-K-E. Interestingly, one of the copies shared 99.10% NanA-K-E identity to the nan from Tessaracoccus flavus RP1T (Fig. S6), while the two type strains had a genome-wide average amino acid identity of only 75.35%. A similar phenomenon was also seen in T. lapidicaptus strain T2.5-30. This result implies HGT of nan between different Tessaracoccus species rather than duplication of nan within the genome.
In 53 (20.78%) nan-positive species, nanA/K/E genes were separated by nagA/B, sialidase genes, the transporter genes, the regulator genes, and/or other genes, forming nan clusters of the inconsecutive nanA/K/E type (Fig. 6B). Almost all (50/53) of these clusters were distributed in clades VI and VII, and most of them (47/53) were from three monophyletic branches comprising the genera Bifidobacterium, Gardnerella, Alloscardovia, and Corynebacterium (Fig. 3). These “mosaic” nan clusters showed flexible organization, suggesting multiple evolutionary origins of the SAC-associated enzymes.
DISCUSSION
Relationship between SAC and habitat.
Microbial SAC has long been regarded as a virulence determinant in a range of infectious diseases (2). This is accordant with our result that the positive rate of SAC is the highest in the order Actinomycetales, as the majority of Actinomycetales strains are disease associated (40–43). Similar instances also occur in some genera of the order Bifidobacteriales. For example, the genera Alloscardovia and Gardnerella show high positive rates of SAC (Table S1), and correspondingly, strains of them have been reported to cause bacteremia (44) and bacterial vaginosis (45, 46), respectively. However, our study also reveals lack of SAC in a number of notorious pathogenic actinobacteria, such as the tuberculosis-causing mycobacteria (47), nocardiosis-causing Nocardia spp. (48), and actinomycetoma-causing Nocardia spp., Actinomadura spp., and Streptomyces somaliensis (49). On the other hand, we provide further evidence that SAC also exists in some probiotics, which may provide nutritional immunity and competition for pathogens in the gut environment (29). It has been reported that sialic acid consumption could be used as a treatment of bacterial infection. For instance, the use of probiotics with the ability of SAC to outcompete the pathogens for sialic acids can effectively limit or reverse Clostridium difficile infection (50). Therefore, our study reinforced the acknowledgment in a systematic way that the pathogenic property of microbial SAC should not be generalized to host-associated microbes, and case-by-case analysis is needed for different taxa.
Against the accepted knowledge that SAC is near exclusive to host-associated bacteria (11, 23), the phylum-level investigation here systematically confirms that SAC also exists in many free-living bacterial species. SAC has previously been found in soil actino bacterium Corynebacterium glutamicum (30), and our recent studies also showed that, in Streptomyces species, the nan cluster was significantly associated with free-living strains (31, 32). Frequent nan gene exchange between host-associated and free-living species, as observed in the orders Brevibacteriales and Micrococcales (Fig. 3), may have occurred in the early evolution of SAC in actinobacteria. Still, the nan phylogeny correlates to some extent with the lifestyles of actinobacteria, suggesting that different environmental pressures may confer relatively independent evolution/dispersal histories on the nan clusters. The presence of IT-sialidase and NanOx genes within nan clusters correlates with host-associated and free-living species, respectively, supporting different evolutionary processes of nan in different habitats. The occurrence of both NanOx and characterized anhydro-Neu5Ac transporter (ST7) genes within the nan clusters of free-living species Beutenbergia cavernae and Ruania albidiflava strongly suggests their capacity for uptake and dissimilation of anhydro-sialic acids. These findings probably mean that some free-living actinobacteria can use (anhydro-)sialic acids, perhaps from surrounding fungi or decomposing animals (30), efficiently as nutrient sources to survive adverse conditions and thus play an important role in the spread of SAC. Yet, although the nan clusters identified here show adequate integrity, most of them still need to be verified experimentally for their true function in SAC or even in catabolism of other nonulonosinic acids.
HGT-mediated evolution of SAC in Actinobacteria.
It has been reported that the biosynthesis of sialic acids occurred roughly 500 million years ago, prior to the divergence of Coelomata (protostomes and deuterostomes) (2, 51, 52). By that time, the main orders of Actinobacteria had already diverged from each other (53). Therefore, the nan clusters responsible for SAC in actinobacteria should be considered “foreign goods.” Combined with the limited distribution of the clusters in actinobacteria (∼13%) and the distinct topologies between the NanA-K-E and species phylogenies, it is reasonable to deduce that HGT plays an important role in the evolution and spread of nan in actinobacteria. A nan cluster may transfer in entirety (e.g., Corynebacterium accolens) (Fig. 4), while its gene elements could further exchange between species. Meanwhile, an intact cluster may be combined by genes (including not only the nan genes but also genes of transporters, regulators, and Nag enzymes) that were acquired by multiple HGT events from different species at different evolutionary periods. Both of these two ways may lead to the formation of genomic islands as well as mosaic gene clusters in chromosomes. It has been argued that the most prevalent transporters (ST3) in Actinobacteria are autochthonous to this phylum (18); hence, the complete nan clusters containing ST3 transporter genes might have arisen in Actinobacteria via the latter way. Accompanied with different gene combinations and gene losses or modifications, the nan clusters have developed a high compositional and structural diversity, which may further alter its functional efficiency in different actinobacterial species. Until now, there was no clear evidence for the origin of SAC in bacteria. The multiple-clade topology of the NanA-K-E phylogeny may suggest either different evolutionary directions of nan after it entered into actinobacteria or multiple nan “invasion” events from other organisms.
The evolutionary pattern of SAC in actinobacteria probably represents those of a series of noncore pathways in bacteria. Through occasional HGT, a species can acquire specific adaptive genes from a distantly related organism (54–56). After that, the acquired genes can spread between generations or closely related species by vertical inheritance, accompanied with gene loss. These genes can also spread between higher taxa (such as families and orders) by further HGT, forming a new metabolic pathway or altering an original pathway in the recipient species to improve its environmental adaptability. During this process, the adaptive genes may spread to other habitats, where they may perform other adaptive functions or remain in the genome as a “strategic reserve” of species. Due to the different occurrence times of HGT and the different habitats and taxonomic status of the recipients, the positive rates of the genes or clusters among different taxa may vary greatly. Such evolutionary pattern has played important roles in generating tremendous genetic, ecological, and metabolic diversity in bacteria, especially in Actinobacteria (57, 58).
Diversity of the nan clusters in actinobacteria.
Our results demonstrate again that, in addition to the necessary genes nanA/K/E, an intact nan cluster probably consists of one or more transporter genes, in most cases a regulator gene, sometimes nagA/B and/or sialidase genes, and occasionally nanOx (2, 9, 11, 19). In line with a very recent report (18), we detected ST1 (of MFS), ST5 (of SSS), and ST7 (of ABC) transporter families in addition to the widespread ST3 (of ABC) transporters in Actinobacteria. The MFS transporters of undetermined ST family in four Actinomycetales species may imply more ST diversity that remains to be studied. The different regulatory genes in the nan clusters may suggest different regulatory mechanisms of SAC between the classes Actinomycetia and Coriobacteriia or even among Coriobacteriia taxa, although the latter were all derived from animal hosts (https://www.ezbiocloud.net/). In addition, our recent work on Streptomyces also illustrates that actinobacterial nan clusters may contain accessory genes such as nanS (encoding acetyl-transferase/hydrolase) (31, 32). Different combinations and orders of all these genes expand the diversity of the nan clusters, attesting to a complex evolutionary history of nan in Actinobacteria. However, it should be mentioned that this in silico analysis is limited to the genomic level. Further experiments are needed to verify the functions of the diverse nan clusters, especially whether the additional genes, such as nanA, nagA/B, nanOx, and sialidase genes, in the clusters could enhance the efficiency of (anhydro-)SAC and environmental adaptation in the actinobacteria.
MATERIALS AND METHODS
Collection of actinobacterial genome sequences.
Genome information of strains (17,954 in total) belonging to the phylum Actinobacteria was obtained from EzBioCloud’s public genome database (March 2021) (https://www.ezbiocloud.net/), which includes only taxonomically corrected and quality-controlled genomes (59). Taxonomic positions and source information of these strains were also obtained from the database. Corresponding contigs or scaffolds of the genome sequences were acquired from the NCBI (with ncbi-genome-download tool, https://github.com/kblin/ncbi-genome-download/) and JGI public databases.
We next applied stringent quality control measures to ensure a high-quality and minimally biased set of genomes. CheckM (60) was first used to assess genome completeness and contamination. Only genomes that were more than 95% complete and had less than 5% contamination were retained. The GToTree package v1.5.47 (61) was then used to filter out genomes containing less than 75% of the 138 actinobacterial marker genes included in the package. Then, for each genus, genomes of all type strains were retained, and genomes of non-type strains were dereplicated using dRep (62) with a threshold of 99.5% pairwise genome-wide average nucleotide identity (ANI) value calculated by fastANI (63). Finally, genomes that showed discrepancy between their given taxonomy and their actual phylogenetic placement in the actinobacterial genome tree were also filtered out. A final set of 7,180 nonredundant actinobacterial genomes were obtained, of which 1,969 were from type strains that were assigned to 6 classes, 44 orders, 73 families, and 337 genera (Table S1). Three nonactinobacterial strains (Vibrio cholerae N16961, Staphylococcus aureus USA300, and Escherichia coli MG1655) were used as outgroups.
Genome annotation and identification of putative sialic acid catabolic genes.
In an attempt to overcome the bias from different annotations, all the protein coding sequences (CDSs) were repredicted and reannotated using Prokka (64). In order to identify putative SAC genes (including nanA, nanK, nanE, nagA, nagB, and sialidase genes), all CDSs were subjected to PfamScan (version 31.0) (65) with an E value of <1e−10 against the PFAM-A database of protein families to identify those containing conserved protein domains of SAC (Table S2). The resulting protein sequences were further analyzed using reverse-position-specific BLAST with an E value of <1e−10 against NCBI’s Conserved Domain Database (CDD) (66) to confirm the presence of SAC-associated domains (Table S2). We followed the method proposed by Tailford et al. to distinguish IT-sialidases from hydrolytic sialidases (16). Briefly, all proteins from the CAZy GH33 family were downloaded and filtered by CD-HIT (67) with default settings to remove highly similar sequences. Then, after alignment, segments of RgNanH-type domain were extracted to build a model for further HMM searching against the putative sialidase genes identified above by Pfam and conserved domains. Finally, the resulting sequences were manually checked for the presence of the segmented RgNanH-type domain. Genes of NanE-II, RokA, and NanOx were determined by DIAMOND BLASTP (E value of <1e−5 and identity of >30%) using typical protein sequences listed in Table S2 as queries (19, 21, 22). If the nanA/K/E genes in a genome were within 10 ORFs of each other (canonical paradigm), or alternatively, if a genome contained nanA and nanE-II within 10 consecutive ORFs and contained rokA as well (Bacteroidetes paradigm), we determined that the strain had the ability to catabolize sialic acids (23). The nearest transporter genes around nanA/K/E genes were determined to encode sialic acid transporters, and the ST families were determined by Pfam searching according to Severi et al. (18). Regulatory genes within and/or around the cluster (within three ORFs) were annotated using COG annotation (COG K). Insertion sequences (IS) and transposable elements were detected and annotated using ISFinder (68) with an E value of <1e−5 and using COG annotation (COG X), respectively. The COG annotation was performed by sequence comparison using DIAMOND BLASTP (E value of <1e−5, coverage >50%, and identity >50%) against the recently updated COG database (69). The presence of genomic island was predicted using the IslandViewer online tool (36). Linear comparison of corresponding genomic regions was performed using BLASTN and visualized by the EasyFig software (70). Visualization of sequence alignment was produced by DNAMAN version 9.0 (Lynnon Biosoft, Canada).
Phylogenetic analysis.
In order to infer the evolutionary relationships of actinobacterial species, the GToTree package v1.5.47 (61) was used with default parameters. All CDSs were searched against the actinobacterial single-copy gene set in GToTree that contains 138 marker genes using HMMER3 (71). A concatenated protein alignment from the marker genes was constructed using Muscle (72) and subsequently trimmed using TrimAl to remove poorly aligned regions (73). The approximately maximum-likelihood phylogenomic tree was built using FastTree (74). The average amino acid identity between genomes was calculated using CompareM (https://github.com/dparks1134/CompareM).
Multiple protein sequence alignments of each nanA/K/E gene were performed using MAFFT l-INS-I (75) and trimmed with TrimAl (73). Phylogenetic reconstruction was carried out using FastTree (74). For the nan phylogeny, only the nanA/K/E genes clustered within 10 ORFs of each other (23) were considered, and the phylogeny was determined based on the concatenated NanA-K-E sequences. All trees were further rendered by the iTOL (Interactive Tree Of Life) online tool (http://itol.embl.de/itol.cgi) (76) and with the ggtree package (77). To elucidate the evolutionary process of the nan cluster, we performed ancestral reconstructions using the COUNT software (33) with Wagner parsimony. An absence/presence (0/1) matrix of the nan cluster and the species tree of type strains were used as input files.
Supplementary Material
ACKNOWLEDGMENTS
This work was supported by the National Key R&D Program of China (2018YFC0310703) and the National Natural Science Foundation of China (32070001, 32100002, and 91751118). We are grateful to Bin-Bin Xie (Shandong University) for his support to Li Y. during manuscript writing and fund application.
Footnotes
Supplemental material is available online only.
Contributor Information
Ying Huang, Email: huangy@im.ac.cn.
Beile Gao, South China Sea Institute of Oceanology, Chinese Academy of Sciences.
REFERENCES
- 1.Angata T, Varki A. 2002. Chemical diversity in the sialic acids and related alpha-keto acids: an evolutionary perspective. Chem Rev 102:439–469. doi: 10.1021/cr000407m. [DOI] [PubMed] [Google Scholar]
- 2.Vimr ER, Kalivoda KA, Deszo EL, Steenbergen SM. 2004. Diversity of microbial sialic acid metabolism. Microbiol Mol Biol Rev 68:132–153. doi: 10.1128/MMBR.68.1.132-153.2004. [DOI] [PMC free article] [PubMed] [Google Scholar]
- 3.Varki NM, Strobert E, Dick EJ, Jr, Benirschke K, Varki A. 2011. Biomedical differences between human and nonhuman hominids: potential roles for uniquely human aspects of sialic acid biology. Annu Rev Pathol 6:365–393. doi: 10.1146/annurev-pathol-011110-130315. [DOI] [PubMed] [Google Scholar]
- 4.Podolsky DK. 1985. Oligosaccharide structures of human colonic mucin. J Biol Chem 260:8262–8271. doi: 10.1016/S0021-9258(17)39465-6. [DOI] [PubMed] [Google Scholar]
- 5.Corfield AP, Myerscough N, Warren BF, Durdey P, Paraskeva C, Schauer R. 1999. Reduction of sialic acid O-acetylation in human colonic mucins in the adenoma-carcinoma sequence. Glycoconj J 16:307–317. doi: 10.1023/a:1007026314792. [DOI] [PubMed] [Google Scholar]
- 6.Robbe C, Capon C, Coddeville B, Michalski JC. 2004. Structural diversity and specific distribution of O-glycans in normal human mucins along the intestinal tract. Biochem J 384:307–316. doi: 10.1042/BJ20040605. [DOI] [PMC free article] [PubMed] [Google Scholar]
- 7.Schwarzkopf M, Knobeloch KP, Rohde E, Hinderlich S, Wiechens N, Lucka L, Horak I, Reutter W, Horstkorte R. 2002. Sialylation is essential for early development in mice. Proc Natl Acad Sci USA 99:5267–5270. doi: 10.1073/pnas.072066199. [DOI] [PMC free article] [PubMed] [Google Scholar]
- 8.Varki A. 2008. Sialic acids in human health and disease. Trends Mol Med 14:351–360. doi: 10.1016/j.molmed.2008.06.002. [DOI] [PMC free article] [PubMed] [Google Scholar]
- 9.Almagro-Moreno S, Boyd EF. 2010. Bacterial catabolism of nonulosonic (sialic) acid and fitness in the gut. Gut Microbes 1:45–50. doi: 10.4161/gmic.1.1.10386. [DOI] [PMC free article] [PubMed] [Google Scholar]
- 10.Olson ME, King JM, Yahr TL, Horswill AR. 2013. Sialic acid catabolism in Staphylococcus aureus. J Bacteriol 195:1779–1788. doi: 10.1128/JB.02294-12. [DOI] [PMC free article] [PubMed] [Google Scholar]
- 11.Severi E, Hood DW, Thomas GH. 2007. Sialic acid utilization by bacterial pathogens. Microbiology (Reading) 153:2817–2822. doi: 10.1099/mic.0.2007/009480-0. [DOI] [PubMed] [Google Scholar]
- 12.Haines-Menges BL, Whitaker WB, Lubin JB, Boyd EF. 2015. Host sialic acids: a delicacy for the pathogen with discerning taste. Microbiol Spectr 3. doi: 10.1128/microbiolspec.MBP-0005-2014. [DOI] [PMC free article] [PubMed] [Google Scholar]
- 13.McDonald ND, Lubin JB, Chowdhury N, Boyd EF. 2016. Host-derived sialic acids are an important nutrient source required for optimal bacterial fitness in vivo. mBio 7:e02237-15. doi: 10.1128/mBio.02237-15. [DOI] [PMC free article] [PubMed] [Google Scholar]
- 14.Lewis WG, Robinson LS, Gilbert NM, Perry JC, Lewis AL. 2013. Degradation, foraging, and depletion of mucus sialoglycans by the vagina-adapted Actinobacterium Gardnerella vaginalis. J Biol Chem 288:12067–12079. doi: 10.1074/jbc.M113.453654. [DOI] [PMC free article] [PubMed] [Google Scholar]
- 15.Juge N, Tailford L, Owen CD. 2016. Sialidases from gut bacteria: a mini-review. Biochem Soc Trans 44:166–175. doi: 10.1042/BST20150226. [DOI] [PMC free article] [PubMed] [Google Scholar]
- 16.Tailford LE, Owen CD, Walshaw J, Crost EH, Hardy-Goddard J, Le Gall G, de Vos WM, Taylor GL, Juge N. 2015. Discovery of intramolecular trans-sialidases in human gut microbiota suggests novel mechanisms of mucosal adaptation. Nat Commun 6:7624. doi: 10.1038/ncomms8624. [DOI] [PMC free article] [PubMed] [Google Scholar]
- 17.Thomas GH. 2016. Sialic acid acquisition in bacteria-one substrate, many transporters. Biochem Soc Trans 44:760–765. doi: 10.1042/BST20160056. [DOI] [PubMed] [Google Scholar]
- 18.Severi E, Rudden M, Bell A, Palmer T, Juge N, Thomas GH. 2021. Multiple evolutionary origins reflect the importance of sialic acid transporters in the colonization potential of bacterial pathogens and commensals. Microb Genom 7:e000614. doi: 10.1099/mgen.0.000614. [DOI] [PMC free article] [PubMed] [Google Scholar]
- 19.Bell A, Brunt J, Crost E, Vaux L, Nepravishta R, Owen CD, Latousakis D, Xiao A, Li W, Chen X, Walsh MA, Claesen J, Angulo J, Thomas GH, Juge N. 2019. Elucidation of a sialic acid metabolism pathway in mucus-foraging Ruminococcus gnavus unravels mechanisms of bacterial adaptation to the gut. Nat Microbiol 4:2393–2404. doi: 10.1038/s41564-019-0590-7. [DOI] [PMC free article] [PubMed] [Google Scholar]
- 20.Plumbridge J, Vimr E. 1999. Convergent pathways for utilization of the amino sugars N-acetylglucosamine, N-acetylmannosamine, and N-acetylneuraminic acid by Escherichia coli. J Bacteriol 181:47–54. doi: 10.1128/JB.181.1.47-54.1999. [DOI] [PMC free article] [PubMed] [Google Scholar]
- 21.Brigham C, Caughlan R, Gallegos R, Dallas MB, Godoy VG, Malamy MH. 2009. Sialic acid (N-acetyl neuraminic acid) utilization by Bacteroides fragilis requires a novel N-acetyl mannosamine epimerase. J Bacteriol 191:3629–3638. doi: 10.1128/JB.00811-08. [DOI] [PMC free article] [PubMed] [Google Scholar]
- 22.Roy S, Douglas CW, Stafford GP. 2010. A novel sialic acid utilization and uptake system in the periodontal pathogen Tannerella forsythia. J Bacteriol 192:2285–2293. doi: 10.1128/JB.00079-10. [DOI] [PMC free article] [PubMed] [Google Scholar]
- 23.Almagro-Moreno S, Boyd EF. 2009. Insights into the evolution of sialic acid catabolism among bacteria. BMC Evol Biol 9:118. doi: 10.1186/1471-2148-9-118. [DOI] [PMC free article] [PubMed] [Google Scholar]
- 24.Roggentin P, Schauer R, Hoyer LL, Vimr ER. 1993. The sialidase superfamily and its spread by horizontal gene transfer. Mol Microbiol 9:915–921. doi: 10.1111/j.1365-2958.1993.tb01221.x. [DOI] [PubMed] [Google Scholar]
- 25.Miao V, Davies J. 2010. Actinobacteria: the good, the bad, and the ugly. Antonie Van Leeuwenhoek 98:143–150. doi: 10.1007/s10482-010-9440-6. [DOI] [PubMed] [Google Scholar]
- 26.Barka EA, Vatsa P, Sanchez L, Gaveau-Vaillant N, Jacquard C, Meier-Kolthoff JP, Klenk H-P, Clément C, Ouhdouch Y, van Wezel GP. 2016. Taxonomy, physiology, and natural products of Actinobacteria. Microbiol Mol Biol Rev 80:1–43. doi: 10.1128/MMBR.00019-15. [DOI] [PMC free article] [PubMed] [Google Scholar]
- 27.Ventura M, Canchaya C, Tauch A, Chandra G, Fitzgerald GF, Chater KF, van Sinderen D. 2007. Genomics of Actinobacteria: tracing the evolutionary history of an ancient phylum. Microbiol Mol Biol Rev 71:495–548. doi: 10.1128/MMBR.00005-07. [DOI] [PMC free article] [PubMed] [Google Scholar]
- 28.Gao B, Gupta RS. 2012. Phylogenetic framework and molecular signatures for the main clades of the phylum Actinobacteria. Microbiol Mol Biol Rev 76:66–112. doi: 10.1128/MMBR.05011-11. [DOI] [PMC free article] [PubMed] [Google Scholar]
- 29.Egan M, O’Connell Motherway M, Ventura M, van Sinderen D. 2014. Metabolism of sialic acid by Bifidobacterium breve UCC2003. Appl Environ Microbiol 80:4414–4426. doi: 10.1128/AEM.01114-14. [DOI] [PMC free article] [PubMed] [Google Scholar]
- 30.Gruteser N, Marin K, Krämer R, Thomas GH. 2012. Sialic acid utilization by the soil bacterium Corynebacterium glutamicum. FEMS Microbiol Lett 336:131–138. doi: 10.1111/j.1574-6968.2012.02663.x. [DOI] [PubMed] [Google Scholar]
- 31.Li Y, Pinto-Tomás AA, Rong X, Cheng K, Liu M, Huang Y. 2019. Population genomics insights into adaptive evolution and ecological differentiation in streptomycetes. Appl Environ Microbiol 85:e02555-18. doi: 10.1128/AEM.02555-18. [DOI] [PMC free article] [PubMed] [Google Scholar]
- 32.Wang J, Li Y, Pinto-Tomás AA, Cheng K, Huang Y. 2022. Habitat adaptation drives speciation of a Streptomyces species with distinct habitats and disparate geographic origins. mBio 13:e02781-21. 10.1128/mBio.02781-21. [DOI] [PMC free article] [PubMed] [Google Scholar]
- 33.Csűrös M. 2010. Count: evolutionary analysis of phylogenetic profiles with parsimony and likelihood. Bioinformatics 26:1910–1912. doi: 10.1093/bioinformatics/btq315. [DOI] [PubMed] [Google Scholar]
- 34.Juhas M, van der Meer JR, Gaillard M, Harding RM, Hood DW, Crook DW. 2009. Genomic islands: tools of bacterial horizontal gene transfer and evolution. FEMS Microbiol Rev 33:376–393. doi: 10.1111/j.1574-6976.2008.00136.x. [DOI] [PMC free article] [PubMed] [Google Scholar]
- 35.Langille MG, Hsiao WW, Brinkman FS. 2010. Detecting genomic islands using bioinformatics approaches. Nat Rev Microbiol 8:373–382. doi: 10.1038/nrmicro2350. [DOI] [PubMed] [Google Scholar]
- 36.Bertelli C, Laird MR, Williams KP, Simon Fraser University Research Computing Group, Lau BY, Hoad G, Winsor GL, Brinkman FS. 2017. IslandViewer 4: expanded prediction of genomic islands for larger-scale datasets. Nucleic Acids Res 45:W30–W35. doi: 10.1093/nar/gkx343. [DOI] [PMC free article] [PubMed] [Google Scholar]
- 37.Huys G, Vancanneyt M, D’Haene K, Falsen E, Wauters G, Vandamme P. 2007. Alloscardovia omnicolens gen. nov., sp. nov., from human clinical samples. Int J Syst Evol Microbiol 57:1442–1446. doi: 10.1099/ijs.0.64812-0. [DOI] [PubMed] [Google Scholar]
- 38.Cheng K, Rong X, Huang Y. 2016. Widespread interspecies homologous recombination reveals reticulate evolution within the genus Streptomyces. Mol Phylogenet Evol 102:246–254. doi: 10.1016/j.ympev.2016.06.004. [DOI] [PubMed] [Google Scholar]
- 39.Li Y, Wang M, Sun ZZ, Xie BB. 2021. Comparative genomic insights into the taxonomic classification, diversity, and secondary metabolic potentials of Kitasatospora, a genus closely related to Streptomyces. Front Microbiol 12:683814. doi: 10.3389/fmicb.2021.683814. [DOI] [PMC free article] [PubMed] [Google Scholar]
- 40.Mayer J, Hegewald S, Sartor VE, Carroll K. 1994. Extragenital infection due to Mobiluncus mulieris. Case report and review. Diagn Microbiol Infect Dis 20:163–165. doi: 10.1016/0732-8893(94)90111-2. [DOI] [PubMed] [Google Scholar]
- 41.Fazili T, Blair D, Riddell S, Kiska D, Nagra S. 2012. Actinomyces meyeri infection: case report and review of the literature. J Infect 65:357–361. doi: 10.1016/j.jinf.2012.02.016. [DOI] [PubMed] [Google Scholar]
- 42.Könönen E, Wade WG. 2015. Actinomyces and related organisms in human infections. Clin Microbiol Rev 28:419–442. doi: 10.1128/CMR.00100-14. [DOI] [PMC free article] [PubMed] [Google Scholar]
- 43.Lotte R, Lotte L, Ruimy R. 2016. Actinotignum schaalii (formerly Actinobaculum schaalii): a newly recognized pathogen-review of the literature. Clin Microbiol Infect 22:28–36. doi: 10.1016/j.cmi.2015.10.038. [DOI] [PubMed] [Google Scholar]
- 44.Ogawa Y, Koizumi A, Kasahara K, Lee ST, Yamada Y, Nakano R, Yano H, Mikasa K. 2016. Bacteremia secondary to Alloscardovia omnicolens urinary tract infection. J Infect Chemother 22:424–425. doi: 10.1016/j.jiac.2015.12.013. [DOI] [PubMed] [Google Scholar]
- 45.Zhang G, Gao B, Adeolu M, Khadka B, Gupta RS. 2016. Phylogenomic analyses and comparative studies on genomes of the Bifidobacteriales: identification of molecular signatures specific for the order Bifidobacteriales and its different subclades. Front Microbiol 7:978. doi: 10.3389/fmicb.2016.00978. [DOI] [PMC free article] [PubMed] [Google Scholar]
- 46.Hardy L, Jespers V, Van den Bulck M, Buyze J, Mwambarangwe L, Musengamana V, Vaneechoutte M, Crucitti T. 2017. The presence of the putative Gardnerella vaginalis sialidase A gene in vaginal specimens is associated with bacterial vaginosis biofilm. PLoS One 12:e0172522. doi: 10.1371/journal.pone.0172522. [DOI] [PMC free article] [PubMed] [Google Scholar]
- 47.Dheda K, Barry CE, 3rd, Maartens G. 2016. Tuberculosis. Lancet 387:1211–1226. doi: 10.1016/S0140-6736(15)00151-8. [DOI] [PMC free article] [PubMed] [Google Scholar]
- 48.Wilson JW. 2012. Nocardiosis: updates and clinical overview. Mayo Clin Proc 87:403–407. doi: 10.1016/j.mayocp.2011.11.016. [DOI] [PMC free article] [PubMed] [Google Scholar]
- 49.Welsh O, Vera-Cabrera L, Welsh E, Salinas MC. 2012. Actinomycetoma and advances in its treatment. Clin Dermatol 30:372–381. doi: 10.1016/j.clindermatol.2011.06.027. [DOI] [PubMed] [Google Scholar]
- 50.Ley RE. 2014. Harnessing microbiota to kill a pathogen: the sweet tooth of Clostridium difficile. Nat Med 20:248–249. doi: 10.1038/nm.3494. [DOI] [PubMed] [Google Scholar]
- 51.Warren L. 1963. The distribution of sialic acids in nature. Comp Biochem Physiol 10:153–171. doi: 10.1016/0010-406x(63)90238-x. [DOI] [PubMed] [Google Scholar]
- 52.Roth J, Kempf A, Reuter G, Schauer R, Gehring WJ. 1992. Occurrence of sialic acids in Drosophila melanogaster. Science 256:673–675. doi: 10.1126/science.1585182. [DOI] [PubMed] [Google Scholar]
- 53.Lewin GR, Carlos C, Chevrette MG, Horn HA, McDonald BR, Stankey RJ, Fox BG, Currie CR. 2016. Evolution and ecology of Actinobacteria and their bioenergy applications. Annu Rev Microbiol 70:235–254. doi: 10.1146/annurev-micro-102215-095748. [DOI] [PMC free article] [PubMed] [Google Scholar]
- 54.Moran Y, Fredman D, Szczesny P, Grynberg M, Technau U. 2012. Recurrent horizontal transfer of bacterial toxin genes to eukaryotes. Mol Biol Evol 29:2223–2230. doi: 10.1093/molbev/mss089. [DOI] [PMC free article] [PubMed] [Google Scholar]
- 55.Caro-Quintero A, Konstantinidis KT. 2015. Inter-phylum HGT has shaped the metabolism of many mesophilic and anaerobic bacteria. ISME J 9:958–967. doi: 10.1038/ismej.2014.193. [DOI] [PMC free article] [PubMed] [Google Scholar]
- 56.Chen SC, Sun GX, Rosen BP, Zhang SY, Deng Y, Zhu BK, Rensing C, Zhu YG. 2017. Recurrent horizontal transfer of arsenite methyltransferase genes facilitated adaptation of life to arsenic. Sci Rep 7:7741. doi: 10.1038/s41598-017-08313-2. [DOI] [PMC free article] [PubMed] [Google Scholar]
- 57.Polz MF, Alm EJ, Hanage WP. 2013. Horizontal gene transfer and the evolution of bacterial and archaeal population structure. Trends Genet 29:170–175. doi: 10.1016/j.tig.2012.12.006. [DOI] [PMC free article] [PubMed] [Google Scholar]
- 58.Park CJ, Smith JT, Andam CP. 2019. Horizontal gene transfer and genome evolution in the phylum Actinobacteria, p 155–174. In Villa TG, Viñas M (ed), Horizontal gene transfer: breaking borders between living kingdoms. Springer International Publishing, Cham, Switzerland. [Google Scholar]
- 59.Yoon SH, Ha SM, Kwon S, Lim J, Kim Y, Seo H, Chun J. 2017. Introducing EzBioCloud: a taxonomically united database of 16S rRNA gene sequences and whole-genome assemblies. Int J Syst Evol Microbiol 67:1613–1617. doi: 10.1099/ijsem.0.001755. [DOI] [PMC free article] [PubMed] [Google Scholar]
- 60.Parks DH, Imelfort M, Skennerton CT, Hugenholtz P, Tyson GW. 2015. CheckM: assessing the quality of microbial genomes recovered from isolates, single cells, and metagenomes. Genome Res 25:1043–1055. doi: 10.1101/gr.186072.114. [DOI] [PMC free article] [PubMed] [Google Scholar]
- 61.Lee MD. 2019. GToTree: a user-friendly workflow for phylogenomics. Bioinformatics 35:4162–4164. doi: 10.1093/bioinformatics/btz188. [DOI] [PMC free article] [PubMed] [Google Scholar]
- 62.Olm MR, Brown CT, Brooks B, Banfield JF. 2017. dRep: a tool for fast and accurate genomic comparisons that enables improved genome recovery from metagenomes through de-replication. ISME J 11:2864–2868. doi: 10.1038/ismej.2017.126. [DOI] [PMC free article] [PubMed] [Google Scholar]
- 63.Jain C, Rodriguez RL, Phillippy AM, Konstantinidis KT, Aluru S. 2018. High throughput ANI analysis of 90K prokaryotic genomes reveals clear species boundaries. Nat Commun 9:5114. doi: 10.1038/s41467-018-07641-9. [DOI] [PMC free article] [PubMed] [Google Scholar]
- 64.Seemann T. 2014. Prokka: rapid prokaryotic genome annotation. Bioinformatics 30:2068–2069. doi: 10.1093/bioinformatics/btu153. [DOI] [PubMed] [Google Scholar]
- 65.El-Gebali S, Mistry J, Bateman A, Eddy SR, Luciani A, Potter SC, Qureshi M, Richardson LJ, Salazar GA, Smart A, Sonnhammer ELL, Hirsh L, Paladin L, Piovesan D, Tosatto SCE, Finn RD. 2019. The Pfam protein families database in 2019. Nucleic Acids Res 47:D427–D432. doi: 10.1093/nar/gky995. [DOI] [PMC free article] [PubMed] [Google Scholar]
- 66.Marchler-Bauer A, Derbyshire MK, Gonzales NR, Lu S, Chitsaz F, Geer LY, Geer RC, He J, Gwadz M, Hurwitz DI, Lanczycki CJ, Lu F, Marchler GH, Song JS, Thanki N, Wang Z, Yamashita RA, Zhang D, Zheng C, Bryant SH. 2015. CDD: NCBI's conserved domain database. Nucleic Acids Res 43:D222–D226. doi: 10.1093/nar/gku1221. [DOI] [PMC free article] [PubMed] [Google Scholar]
- 67.Huang Y, Niu B, Gao Y, Fu L, Li W. 2010. CD-HIT Suite: a web server for clustering and comparing biological sequences. Bioinformatics 26:680–682. doi: 10.1093/bioinformatics/btq003. [DOI] [PMC free article] [PubMed] [Google Scholar]
- 68.Siguier P, Perochon J, Lestrade L, Mahillon J, Chandler M. 2006. ISfinder: the reference centre for bacterial insertion sequences. Nucleic Acids Res 34:D32–D36. doi: 10.1093/nar/gkj014. [DOI] [PMC free article] [PubMed] [Google Scholar]
- 69.Galperin MY, Wolf YI, Makarova KS, Vera Alvarez R, Landsman D, Koonin EV. 2021. COG database update: focus on microbial diversity, model organisms, and widespread pathogens. Nucleic Acids Res 49:D274–D281. doi: 10.1093/nar/gkaa1018. [DOI] [PMC free article] [PubMed] [Google Scholar]
- 70.Sullivan MJ, Petty NK, Beatson SA. 2011. Easyfig: a genome comparison visualizer. Bioinformatics 27:1009–1010. doi: 10.1093/bioinformatics/btr039. [DOI] [PMC free article] [PubMed] [Google Scholar]
- 71.Eddy SR. 2011. Accelerated profile HMM searches. PLoS Comput Biol 7:e1002195. doi: 10.1371/journal.pcbi.1002195. [DOI] [PMC free article] [PubMed] [Google Scholar]
- 72.Edgar RC. 2004. MUSCLE: multiple sequence alignment with high accuracy and high throughput. Nucleic Acids Res 32:1792–1797. doi: 10.1093/nar/gkh340. [DOI] [PMC free article] [PubMed] [Google Scholar]
- 73.Capella-Gutierrez S, Silla-Martinez JM, Gabaldon T. 2009. trimAl: a tool for automated alignment trimming in large-scale phylogenetic analyses. Bioinformatics 25:1972–1973. doi: 10.1093/bioinformatics/btp348. [DOI] [PMC free article] [PubMed] [Google Scholar]
- 74.Price MN, Dehal PS, Arkin AP. 2010. FastTree 2–approximately maximum-likelihood trees for large alignments. PLoS One 5:e9490. doi: 10.1371/journal.pone.0009490. [DOI] [PMC free article] [PubMed] [Google Scholar]
- 75.Katoh K, Standley DM. 2013. MAFFT multiple sequence alignment software version 7: improvements in performance and usability. Mol Biol Evol 30:772–780. doi: 10.1093/molbev/mst010. [DOI] [PMC free article] [PubMed] [Google Scholar]
- 76.Letunic I, Bork P. 2016. Interactive tree of life (iTOL) v3: an online tool for the display and annotation of phylogenetic and other trees. Nucleic Acids Res 44:W242–W245. doi: 10.1093/nar/gkw290. [DOI] [PMC free article] [PubMed] [Google Scholar]
- 77.Yu G, Smith DK, Zhu H, Guan Y, Lam TT-Y. 2017. ggtree: an R package for visualization and annotation of phylogenetic trees with their covariates and other associated data. Methods Ecol Evol 8:28–36. doi: 10.1111/2041-210X.12628. [DOI] [Google Scholar]
Associated Data
This section collects any data citations, data availability statements, or supplementary materials included in this article.
Supplementary Materials
Supplemental material. Download SPECTRUM02380-21_Supp_1_seq11.xlsx, XLSX file, 0.05 MB (49.7KB, xlsx)
Supplemental material. Download SPECTRUM02380-21_Supp_2_seq12.xlsx, XLSX file, 0.01 MB (10.6KB, xlsx)
Supplemental material. Download SPECTRUM02380-21_Supp_3_seq13.pdf, PDF file, 4.7 MB (4.8MB, pdf)