Abstract
The heart is a highly metabolic organ that uses multiple energy sources to meet its demand for ATP production. Diurnal feeding-fasting cycles result in substrate availability fluctuations which, together with increased energetic demand during the active period, impose a need for rhythmic cardiac metabolism. The nuclear receptors REV-ERBα and β are essential repressive components of the molecular circadian clock and major regulators of metabolism. To investigate their role in the heart, here we generated mice with cardiomyocyte (CM)-specific deletion of both Rev-erbs, which died prematurely due to dilated cardiomyopathy. Loss of Rev-erbs markedly downregulated fatty acid oxidation genes prior to overt pathology, which was mediated by induction of the transcriptional repressor E4BP4, a direct target of cardiac REV-ERBs. E4BP4 directly controls circadian expression of Nampt and its biosynthetic product NAD+ via distal cis-regulatory elements. Thus, REV-ERB-mediated E4BP4 repression is required for Nampt expression and NAD+ production by the salvage pathway. Together, these results highlight the indispensable role of circadian REV-ERBs in cardiac gene expression, metabolic homeostasis and function.
Most organisms manifest diurnal phases of activity and inactivity, requiring switching between fuel sources for biologic functions. In mammals, substrate selection is tissue specific, and thus while some organs are mainly fueled by glucose (e.g. brain), others such as the liver and heart predominantly rely on fatty acids. Fuel utilization depends not only on nutrient availability, but also on the physiological context1. Time-of-the-day-dependent rhythms are observed in many facets of life and oscillatory processes in the body are driven by the circadian clock, which allows for anticipation of rhythmic stimuli such as light/dark changes and food intake2. Disruption of circadian clocks can lead to a plethora of metabolic defects such as hyperglycemia, hypoinsulinaemia, diabetes and dyslipidemia, sleep defects, impaired regenerative capacity, and also pre-disposition to cancer3. Thus, understanding the precise contributions of the clock to organ-specific tissue homeostasis is of utmost importance.
Several cardiovascular parameters, such as heart rate and blood pressure fluctuate over the course of the day, peaking in the early phase of the awake period4,5. Many circadian regulated processes in the heart are governed by the cardiomyocyte circadian clock6. The underlying molecular pathway relies on a transcriptional/translational feedback loop that comprises a number of core clock factors, such as BMAL1, CLOCK and REV-ERBα and β. Their rhythmic function results in tissue-specific clock-controlled gene (CCG) expression programs that maintain proper cellular physiology3,7. Nicotinamide phosphoribosyltransferase (Nampt), the rate limiting enzyme in the NAD+ salvage pathway, is one such CCG shown to be under direct control of the BMAL1:CLOCK heterodimer7,8. NAD+ plays a central role in not only oxidative metabolism and bio-energetics, but also as a co-factor for reactions that can generate signaling intermediates or alter posttranslational modifications (e.g., ADP-ribosylation or deacetylation by sirtuins9). Disturbing the positive output of the circadian clock via ablation of Clock or Bmal1 in the whole body10, as well as in the heart specifically, results in disrupted metabolism11, ventricular arrhythmias12 and dilated cardiomyopathy11,13.
REV-ERB nuclear receptors are key factors in the negative limb of the core clock, and have emerged as a key mechanistic link to metabolism in extra-cardiac tissues14,15. As they lack the canonical activation domain of nuclear receptors, REV-ERBs act as potent and constitutive transcriptional repressors by recruiting Nuclear Receptor CoRepressor (NCoR) and Histone Deacetylase 3 (HDAC3)16. The latter facilitates histone deacetylation at enhancers, thereby contributing to transcriptional repression of target genes. How REV-ERBs regulate gene transcription in the healthy heart is mainly unknown, but several reports show that REV-ERB agonists can impact the cardiac transcriptome, hypertrophy and function (even after myocardial infarction)17–19. Although the compounds used in these studies have been shown to display some non-REV-ERB-mediated effects20, this nonetheless highlights the importance of investigating the role and target genes of REV-ERBs to better understand how they modulate heart function in vivo under physiological conditions.
Here, we report that a mouse model in which both Rev-erbs are deleted in cardiomyocytes (CM-RevDKO mice) develop age-onset dilated cardiomyopathy, leading to premature death. We provide evidence that in the absence of REV-ERBs, inability to meet the high demands for energy production in the heart as a result of direct derepression (activation) of one set of genes and repression of an additional set via the upregulation of transcriptional repressors leads to progressive development of heart failure. In extra-cardiac tissues, circadian clocks have been reported to facilitate cyclic NAD+ levels via BMAL1:CLOCK-mediated circadian Nampt transcriptional activation. We discover that in addition to regulation by the positive arm of the clock pathway, REV-ERBs are essential for proper Nampt expression. Despite increased Bmal1 expression, absence of REV-ERBs results in a drastic repression of Nampt, secondary to upregulation of E4BP4, which directly binds to cis-regulatory elements upstream of the gene. Consistent with a dominant effect of E4BP4, we show that repression of Nampt in Bmal1 KO hearts is prevented by additional E4bp4 KO, demonstrating a causal role for E4BP4-mediated Nampt downregulation in the circadian pathway. In conclusion, we show that circadian REV-ERBs are indispensable to establish the transcriptional program that controls cardiac metabolism, deregulation of which leads to dilated cardiomyopathy and premature death.
Results
Cardiomyocyte-specific depletion of REV-ERBs causes lethal dilated cardiomyopathy
To interrogate the role of the nuclear receptors REV-ERBα and REV-ERBβ in the heart, we crossed conditional Rev-erbαfl/fl/βfl/fl mice20 with a cardiomyocyte (CM)-specific Cre-deleter (αMHC-Cre21, C57BL/6 background) to generate CM-specific Rev-erbα/β double knock-out (CM-RevDKO) mice (Fig. 1a). Reduction in Rev-erbα and β mRNA expression was observed in heart across a 24-hour circadian cycle (Fig. 1b), and REV-ERBα protein levels were constitutively reduced in CM-RevDKO hearts (Fig. 1c). Consistent with this, expression of the canonical REV-ERB target genes Bmal1 and Npas2 were markedly increased in CM-RevDKO hearts (Fig. 1d) and BMAL1 protein was constitutively high (Extended Data Fig. 1a). Rhythmic Per2 mRNA levels on the other hand, were unaffected (Extended Data Fig. 1b). Of note, day-night differences of Rev-erb mRNA levels were dampened in 6-month- vs 2-month-old floxed control mice (Extended Data Fig. 1c).
Fig. 1. CM-RevDKO mice die from dilated cardiomyopathy.
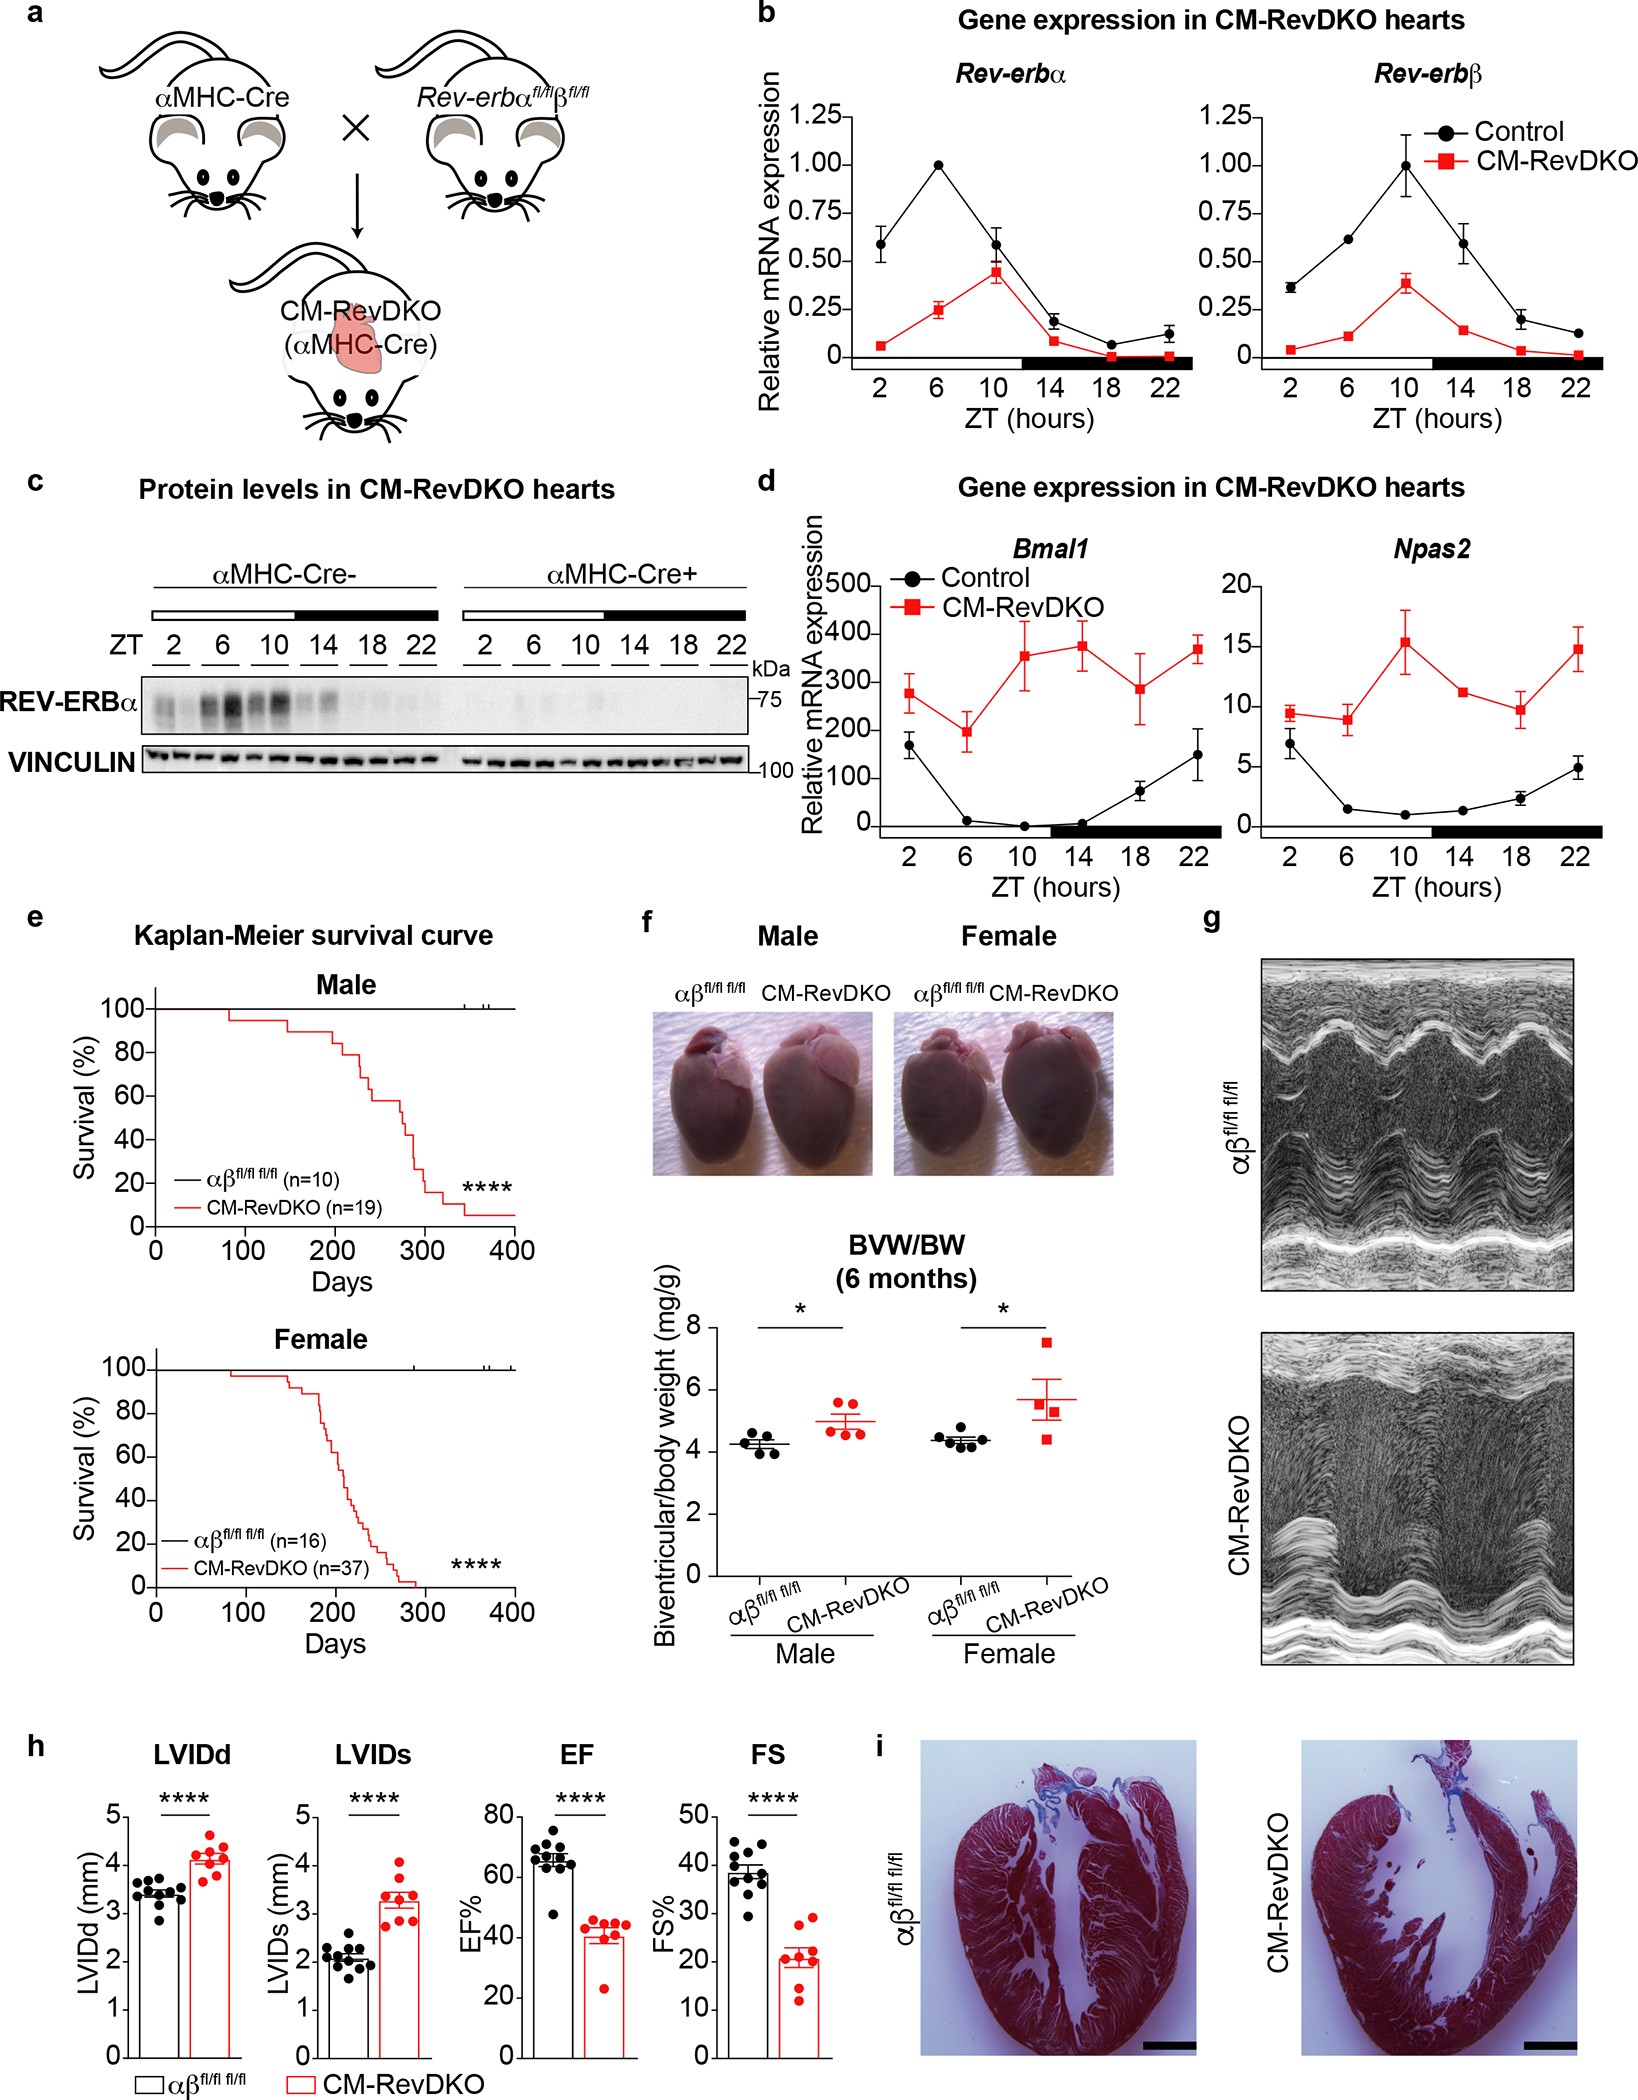
a, Cartoon depicting strategy for cardiomyocyte-specific Rev-erbα/β double knock out model (CM-RevDKO) generation by crossing cardiomyocyte-specific Cre-deleter line (αMHC-Cre)21 with a recently developed Rev-erbαff/βff mouse model20. b, Relative mRNA expression in hearts from 2-month-old male αMHC-Cre+ Rev-erbα/β double floxed (CM-RevDKO) vs littermate controls (αMHC-Cre-) (n = 3 hearts/genotype/timepoint except for n = 2 for ZT6 and ZT22 in control, ZT2 and ZT18 in CM-RevDKO, and n = 4 for ZT22 in CM-RevDKO). c, Immunoblot for REV-ERBα from control (αMHC-Cre-) vs CM-RevDKO (αMHC-Cre+) hearts from 2-month-old male mice (n = 2/timepoint/genotype). d, Relative REV-ERBα/β target gene mRNA expression in control vs CM-RevDKO hearts from 2-month-old male mice (n = 3 hearts/genotype/timepoint except for n = 2 for ZT6 and ZT22 in control, ZT2 and ZT18 in CM-RevDKO, and n = 4 for ZT22 in CM-RevDKO). e, Kaplan-Meier survival curves for control (αβfl/fl fl/fl) and CM-RevDKO male and female mice. f, Gross pictures of hearts at the age of 6 months and biventricular to body weight (BVW/BW) ratios (n=5 hearts/genotype for male, n=6 for control and n = 4 for CM-RevDKO female mice) g, Representative short axis M-mode images from echocardiography on 6-month-old female mice and h, Cardiac structure (LVIDd/s: Left ventricular internal diameter in diastole/systole) and function (EF: Ejection fraction and FS: Fractional shortening) data from echocardiagraphy (n = 11 for control and 8 for CM-RevDKO) for 6-month-old mice. i, Masson’s trichrome staining on 6-month-old female control and CM-RevDKO hearts. Scale bars, 2um. n represents biologically independent replicates. Data are presented as mean ± SEM. ns: non significant, *P < 0.05, ****P < 0.0001, by 2-sided Student’s t test, except for Chi-square (log rank Mantel-Cox) test in e (exact P values are provided in the Source Data).
While CM-RevDKO mice were born at expected Mendelian ratios (Extended Data Fig. 2a), CM-RevDKO resulted in severely reduced life span with increased mortality around 6–9 months in both male and female mice (Fig. 1e). CM-RevDKO mice display normal circadian behavior, food intake and body weight (Extended Data Fig. 2b,c,d). In addition, glucose and insulin tolerance tests in 6-months old mice were normal (Extended Data Fig. 2e,f). Yet, compared to WT mice, heart weight was higher in CM-RevDKO males and females at 6 months of age (Fig. 1f) but not 2-month-old mice (Extended Data Fig. 2g), indicating that CM-specific Rev-erb deletion caused cardiac enlargement over time. Consistent with increased biventricular weight, cardiomyocyte cross sectional area was also larger in 6-month old CM-RevDKO mice (Extended Data Fig. 2h). This is in line with a recent report describing a protective effect of REV-ERB activation against hypertrophy in neonatal ventricular rat cardiomyocytes19. Echocardiography revealed that left ventricular (LV) systolic and end-diastolic diameters are significantly increased at 6 months of age, accompanied by reduced LV ejection fraction, LV fractional shortening (Fig. 1g,h) and other echocardiographic abnormalities reflective of the cardiomyopathic pathologic remodeling only in older mice (Extended Data Fig. 2i,j). H&E and trichrome staining revealed dilation in the CM-RevDKO heart, without any signs of fibrosis (Fig. 1i, Extended Data Fig. 2k). In addition, we could not detect substantial cell death in CM-RevDKO or control hearts (Extended Data Fig. 2l). In conclusion, loss of REV-ERBs in CMs has major structural as well as functional consequences leading to premature death from dilated cardiomyopathy.
CM-RevDKO disrupts metabolic transcriptional programs and causes mitochondrial defects
To elucidate the molecular mechanism that underlies age-dependent heart failure upon KO of both Rev-erbs in CMs, we performed transcriptomic analysis at 2 months of age (i.e., prior to the onset of cardiomyopathy). Hearts were isolated at ZT10, which represents elevated expression of Rev-erbα and β, as well as the trough of Bmal1 expression, in WT hearts (Extended Data Fig. 3a). We detected 553 differentially expressed genes (log2 fold-change (FC) > 0.58, Adj. P < 0.05), of which 253 were upregulated and 300 downregulated in CM-RevDKO hearts (Fig. 2a and Supplementary Table 1). Comparison of these genes (n=553) with transcripts differentially expressed at ZT10 upon KO of Rev-erbs in the liver22 (n=762, log2 fold-change (FC) > 0.58, Adj. P < 0.05) shows that REV-ERB target genes in the heart are generally distinct from those in liver (Extended Data Fig. 3b), consistent with the established notion that REV-ERBs control gene expression in a tissue-specific manner with the exception of core clock factors23. Indeed, canonical circadian regulators such as Bmal1, Clock, and Npas2 were derepressed in both CM-RevDKO hearts and hepatocyte-specific RevDKO livers (Extended Data Fig. 3b). In contrast several key cardiac genes involved in essential cardiomyocyte function (such as metabolism, signaling and ion channels, e.g. p21, Slc41a3 and Fhit) were dysregulated upon REV-ERB loss, as validated by qRT-PCR (Extended Data Fig. 3c). Overlap with previously published circadian cardiac gene expression data24 shows that ~31% of the differentially expressed genes in the CM-RevDKO hearts are rhythmically expressed in the WT hearts. Moreover, the acrophases of the up- and downregulated genes mainly cluster anti- and in- phase, respectively, with expression of Rev-erbs (Extended Data Fig. 3d). This suggests that REV-ERB normally represses the observed upregulated genes during the inactive period of the day and that the downregulated genes are most likely not direct REV-ERB targets.
Fig. 2. REV-ERBs control metabolic gene expression in the heart.
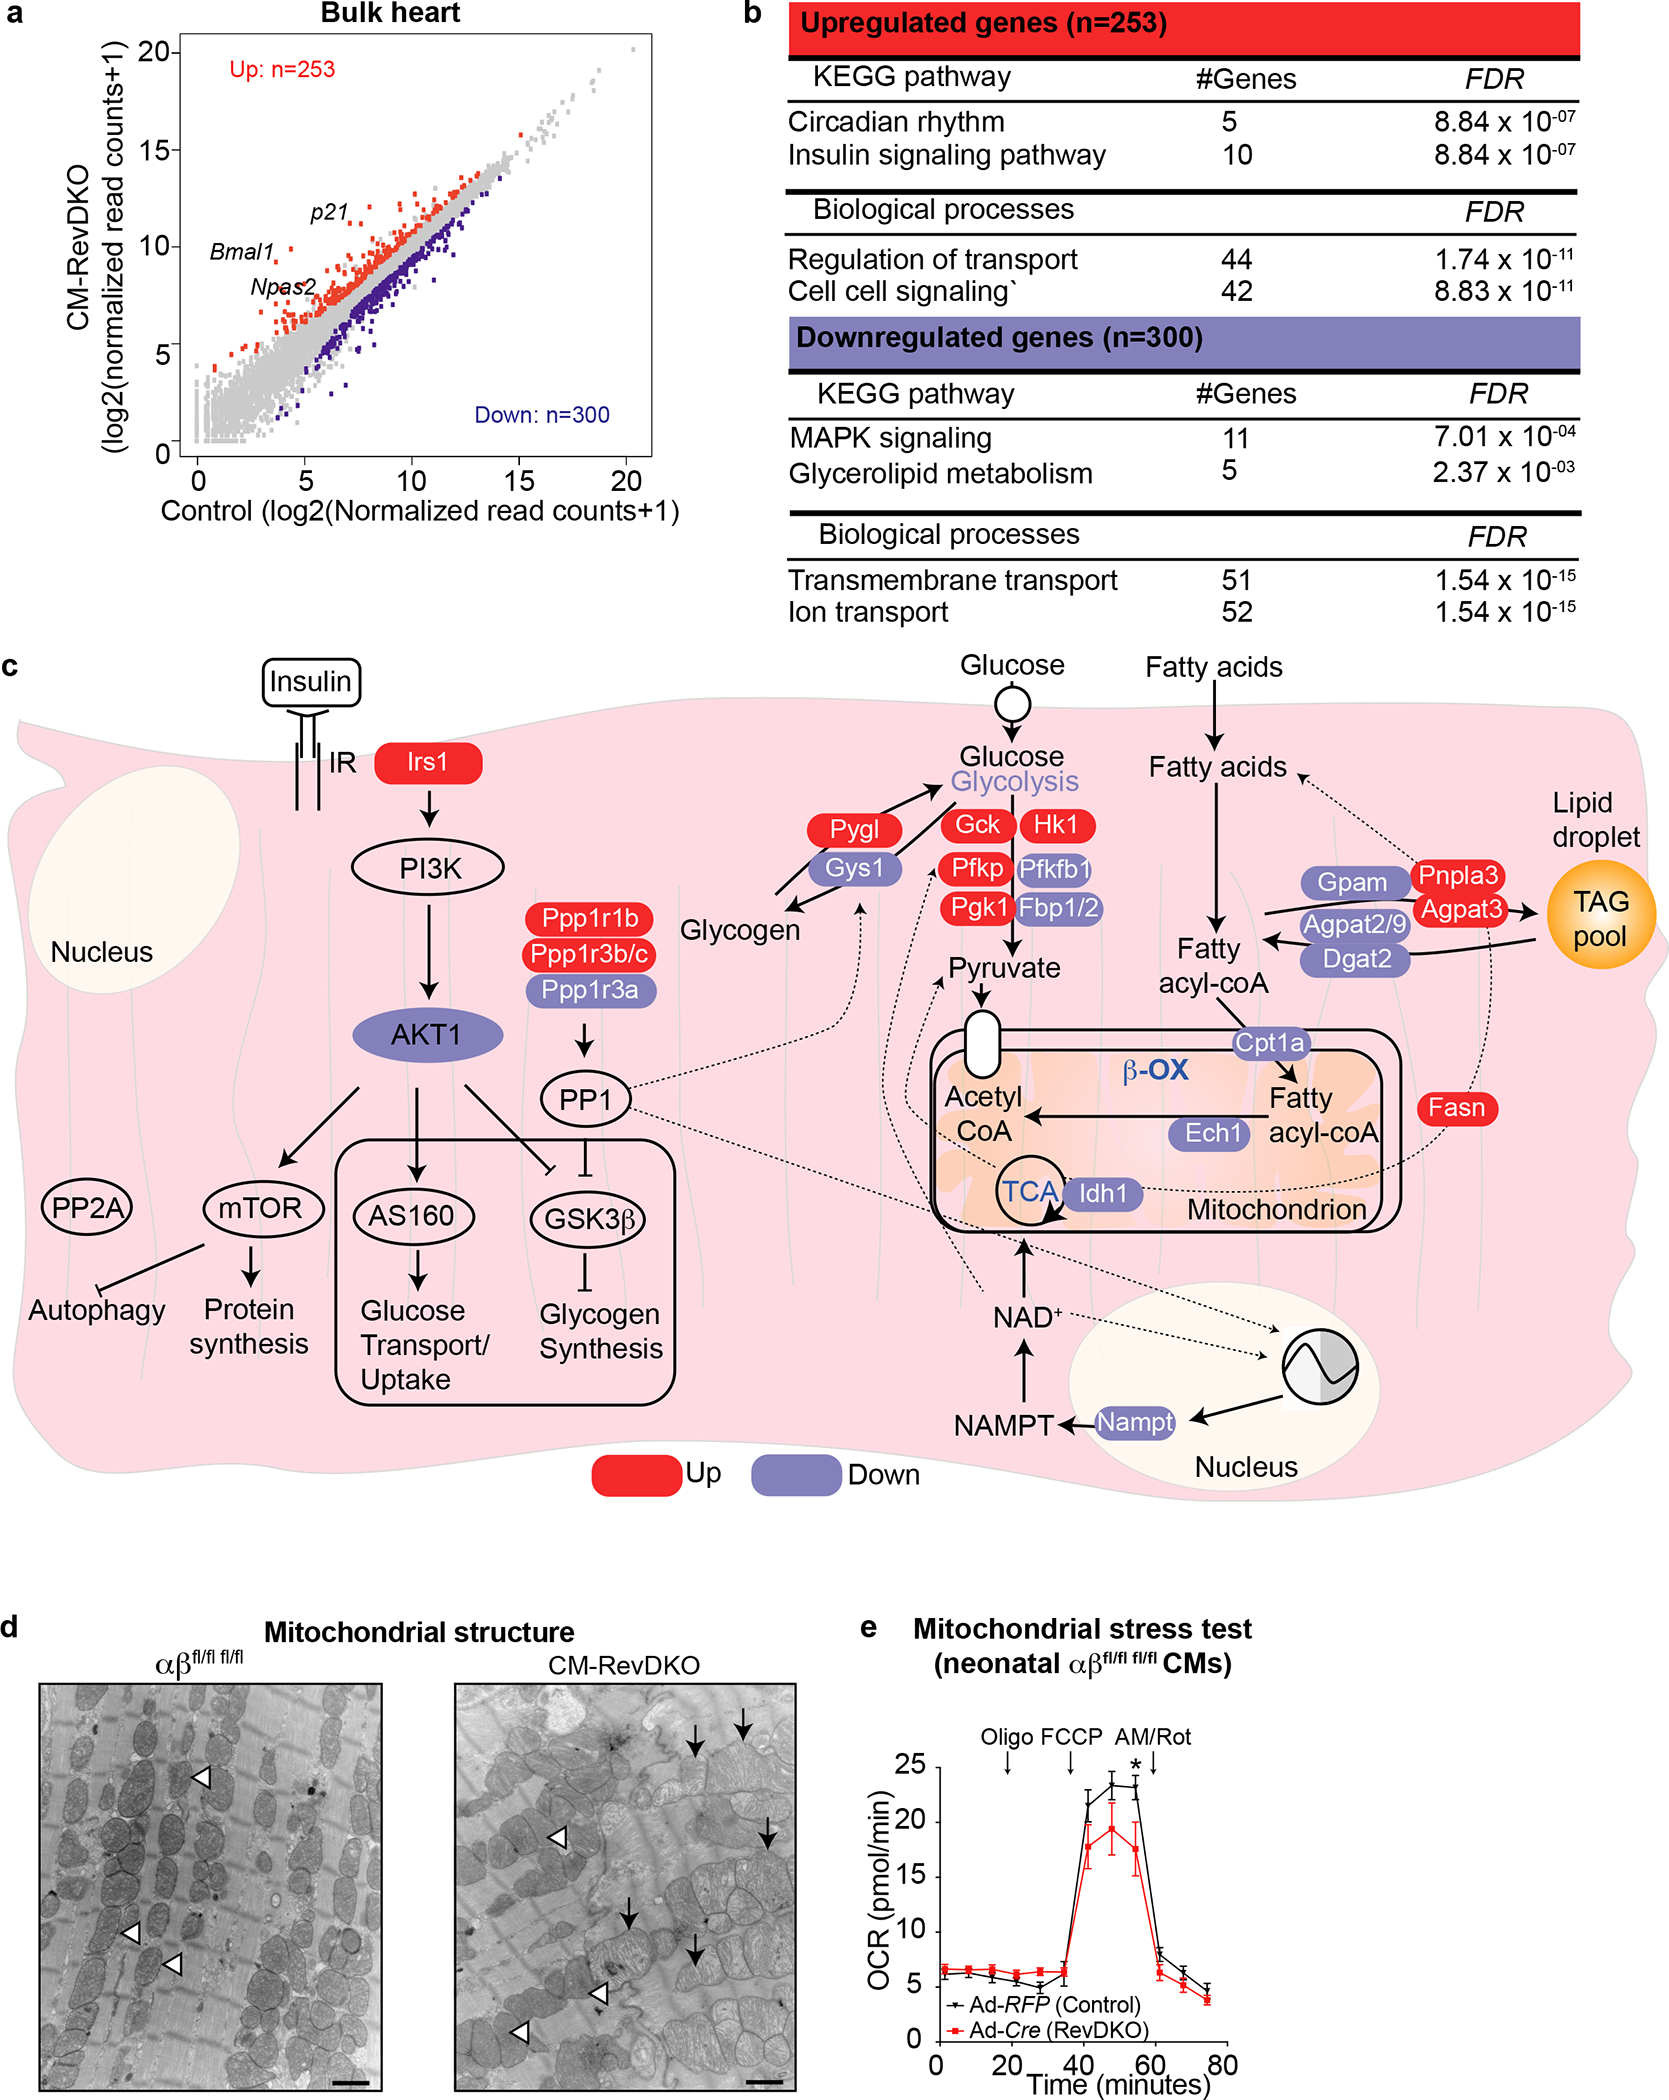
a, Scatter plot showing 553 differentially expressed genes (DEGs) in CM-RevDKO vs control hearts (n = 3/genotype, cut-off: FC > 1.5-fold up (red) and down (blue), Adj. P (FDR) < 0.05). b, KEGG pathway and gene ontology analysis on all DEGs from (a). The analysis was performed via the use of https://www.gsea-msigdb.org/gsea/index.jsp. c, Schematic showing metabolic pathways with significantly upregulated (red) and downregulated (blue) genes in CM-RevDKO, determined in (a,b). d, Electron micrographs of ventricular tissue from control and CM-RevDKO hearts at 6 months. Open arrow heads denote normal looking mitochondria with dense cristae. Black arrows denote abberrant mitochondria with abnormal cristae. Scale bars, 1μM. e, Traces for oxidative phosphorylation (oxygen consumption rate (OCR)) from Seahorse measurements in a mitochondrial stress test on Rev-erbα/βfl/fl fl/fl neonatal CMs, transduced with Adeno-RFP (control) vs Adeno-Cre (RevDKO). Palmitate-BSA was added to the CMs right before the assay (n = 11 independently transduced wells for control and n = 12 for RevDKO). (Oligo) Oligomycin; (FCCP) Carbonyl cyanide-4 (trifluoromethoxy) phenylhydrazone; (AM) Antimycin; (Rot) Rotenone. n represents biologically independent replicates unless otherwise indicated. Data are shown as mean ± SEM. *P < 0.05 by 2-sided Student’s t test (exact P values are provided in the Source Data).
To further investigate the functionality of up and downregulated genes in CM-RevDKO hearts, we performed GO and KEGG pathway analysis. Upregulated genes were enriched for terms such as circadian rhythms, insulin signaling and regulation of transport and cell-cell signaling, while down-regulated genes were related to MAPK signaling, glycerolipid metabolism and transmembrane and ion transport (Fig. 2b). These data suggest that the deletion of both Rev-erbs in the heart resulted in transcriptional deregulation of essential cardiac oxidative metabolic processes.
Indeed, mRNA for several components in the insulin signaling pathway, a process known to be under clock control in the heart11,25, such as Irs1 (up), Pde3a (up), Akt1 (down) are differentially expressed in CM-RevDKO heart, as well as downstream insulin targeted pathways, such as glycogen storage (e.g. Pygl (up)) and signaling pathways that modulate the activity of these proteins (e.g. Ppp1r3a (down), Ppp1r1b (up) and Ppp1r3b/c (up)) (Fig. 2c). We validated the dramatic increase in DARPP-32 (encoded by Ppp1r1b) levels, an important modulator of protein phosphatase 1 (PP1) activity, via qRT-PCR and western blotting (Extended Data Fig. 4a,b). Since PP1 is an important phosphatase in the heart and a key regulator of multiple essential cardiac signaling pathways, disruption of which has been implicated in cardiac dysfunction26, its deregulation in CM-RevDKO hearts might contribute to age-dependent lethality in these mice. We also noted that lipid oxidation genes were predominantly downregulated. These metabolic genes range from mitochondrial fatty acid uptake (transporter Cpt1a), to primary cardiac β-oxidation genes such as Acads/l, Hadha and Ech1) which were all downregulated (down, FC > 1.25), as well as cholesterol metabolism genes such as Ces1d and Nceh1 (Fig. 2c). Furthermore, electron microscopy of 6 months old CM-RevDKO hearts revealed that many cardiomyocyte mitochondria appeared large with abnormal cristae structure indicative of swelling (Fig 2d and Extended Data Fig. 4c). Mitochondria of 2 months old CM-RevDKO CMs were significantly smaller compared to control hearts (Extended Data Fig. 4d). However, no difference in mitochondrial DNA content was noted (Extended Data Fig. 4e). Additionally, we observed impaired performance in a mitochondrial stress test when fueled with palmitate (Fig. 2e). These results demonstrate that REV-ERBs are critical regulators of mitochondrial energetics and fatty acid oxidation (FAO) genes, deregulation of which results in DCM and premature death.
REV-ERBs can mediate gene activation via direct repression of E4bp4 in the heart
REV-ERBs are known to function through binding to cis-regulatory elements (CREs) such as enhancers and promoters, leading to transcriptional repression23. To identify REV-ERB-responsive regulatory regions that might explain direct upregulated genes, as well as putative regulatory sites involved in indirect gene downregulation in CM-RevDKO hearts, we performed Cleavage Under Targets and Release Using Nuclease (Cut&Run)27 for H3K27ac, a mark of active enhancers28,29. Since downregulated genes are unlikely to be direct REV-ERB targets, we opted to perform Cut&Run in isolated CMs from control and CM-RevDKO mice to increase specificity, and search for binding sites of potential transcription factors involved in downregulated CREs (Fig. 3a). H3K27ac changes were integrated with RNA-Seq data using Integrated Analysis of Motif Activity and Gene Expression (IMAGE)30, which revealed a number of transcription factors, such as REV-ERBs, ARNTL, NPAS2, CLOCK, NKX2–5 and E4BP4 (also called NFIL3) (Supplementary Table 2) as putative drivers of REV-ERB-dependent mRNA and enhancer activity changes. In addition, we performed binding similarity analysis using CistromeDB31, matching regions with changes in H3K27ac with cistromes from published heart, muscle and liver ChIP-Seq experiments. As expected, this analysis revealed that binding of REV-ERBα as well as known REV-ERB interactors such as REV-ERBβ, HDAC3 and NCoR1 were enriched at H3K27ac sites that became active upon loss of REV-ERBs (Fig. 3b) supporting direct involvement of REV-ERBs in target derepression. In contrast, binding similarity analysis of differentially enriched H3K27ac regions that were down-regulated by at least 2-fold in CM-RevDKO cardiomyocytes revealed enrichment for GR, TBX3, E4BP4 and others (Fig. 3b).
Fig. 3. Enhancers of downregulated genes are enriched for E4BP4, a direct REV-ERB target that is induced in CM-RevDKO hearts.
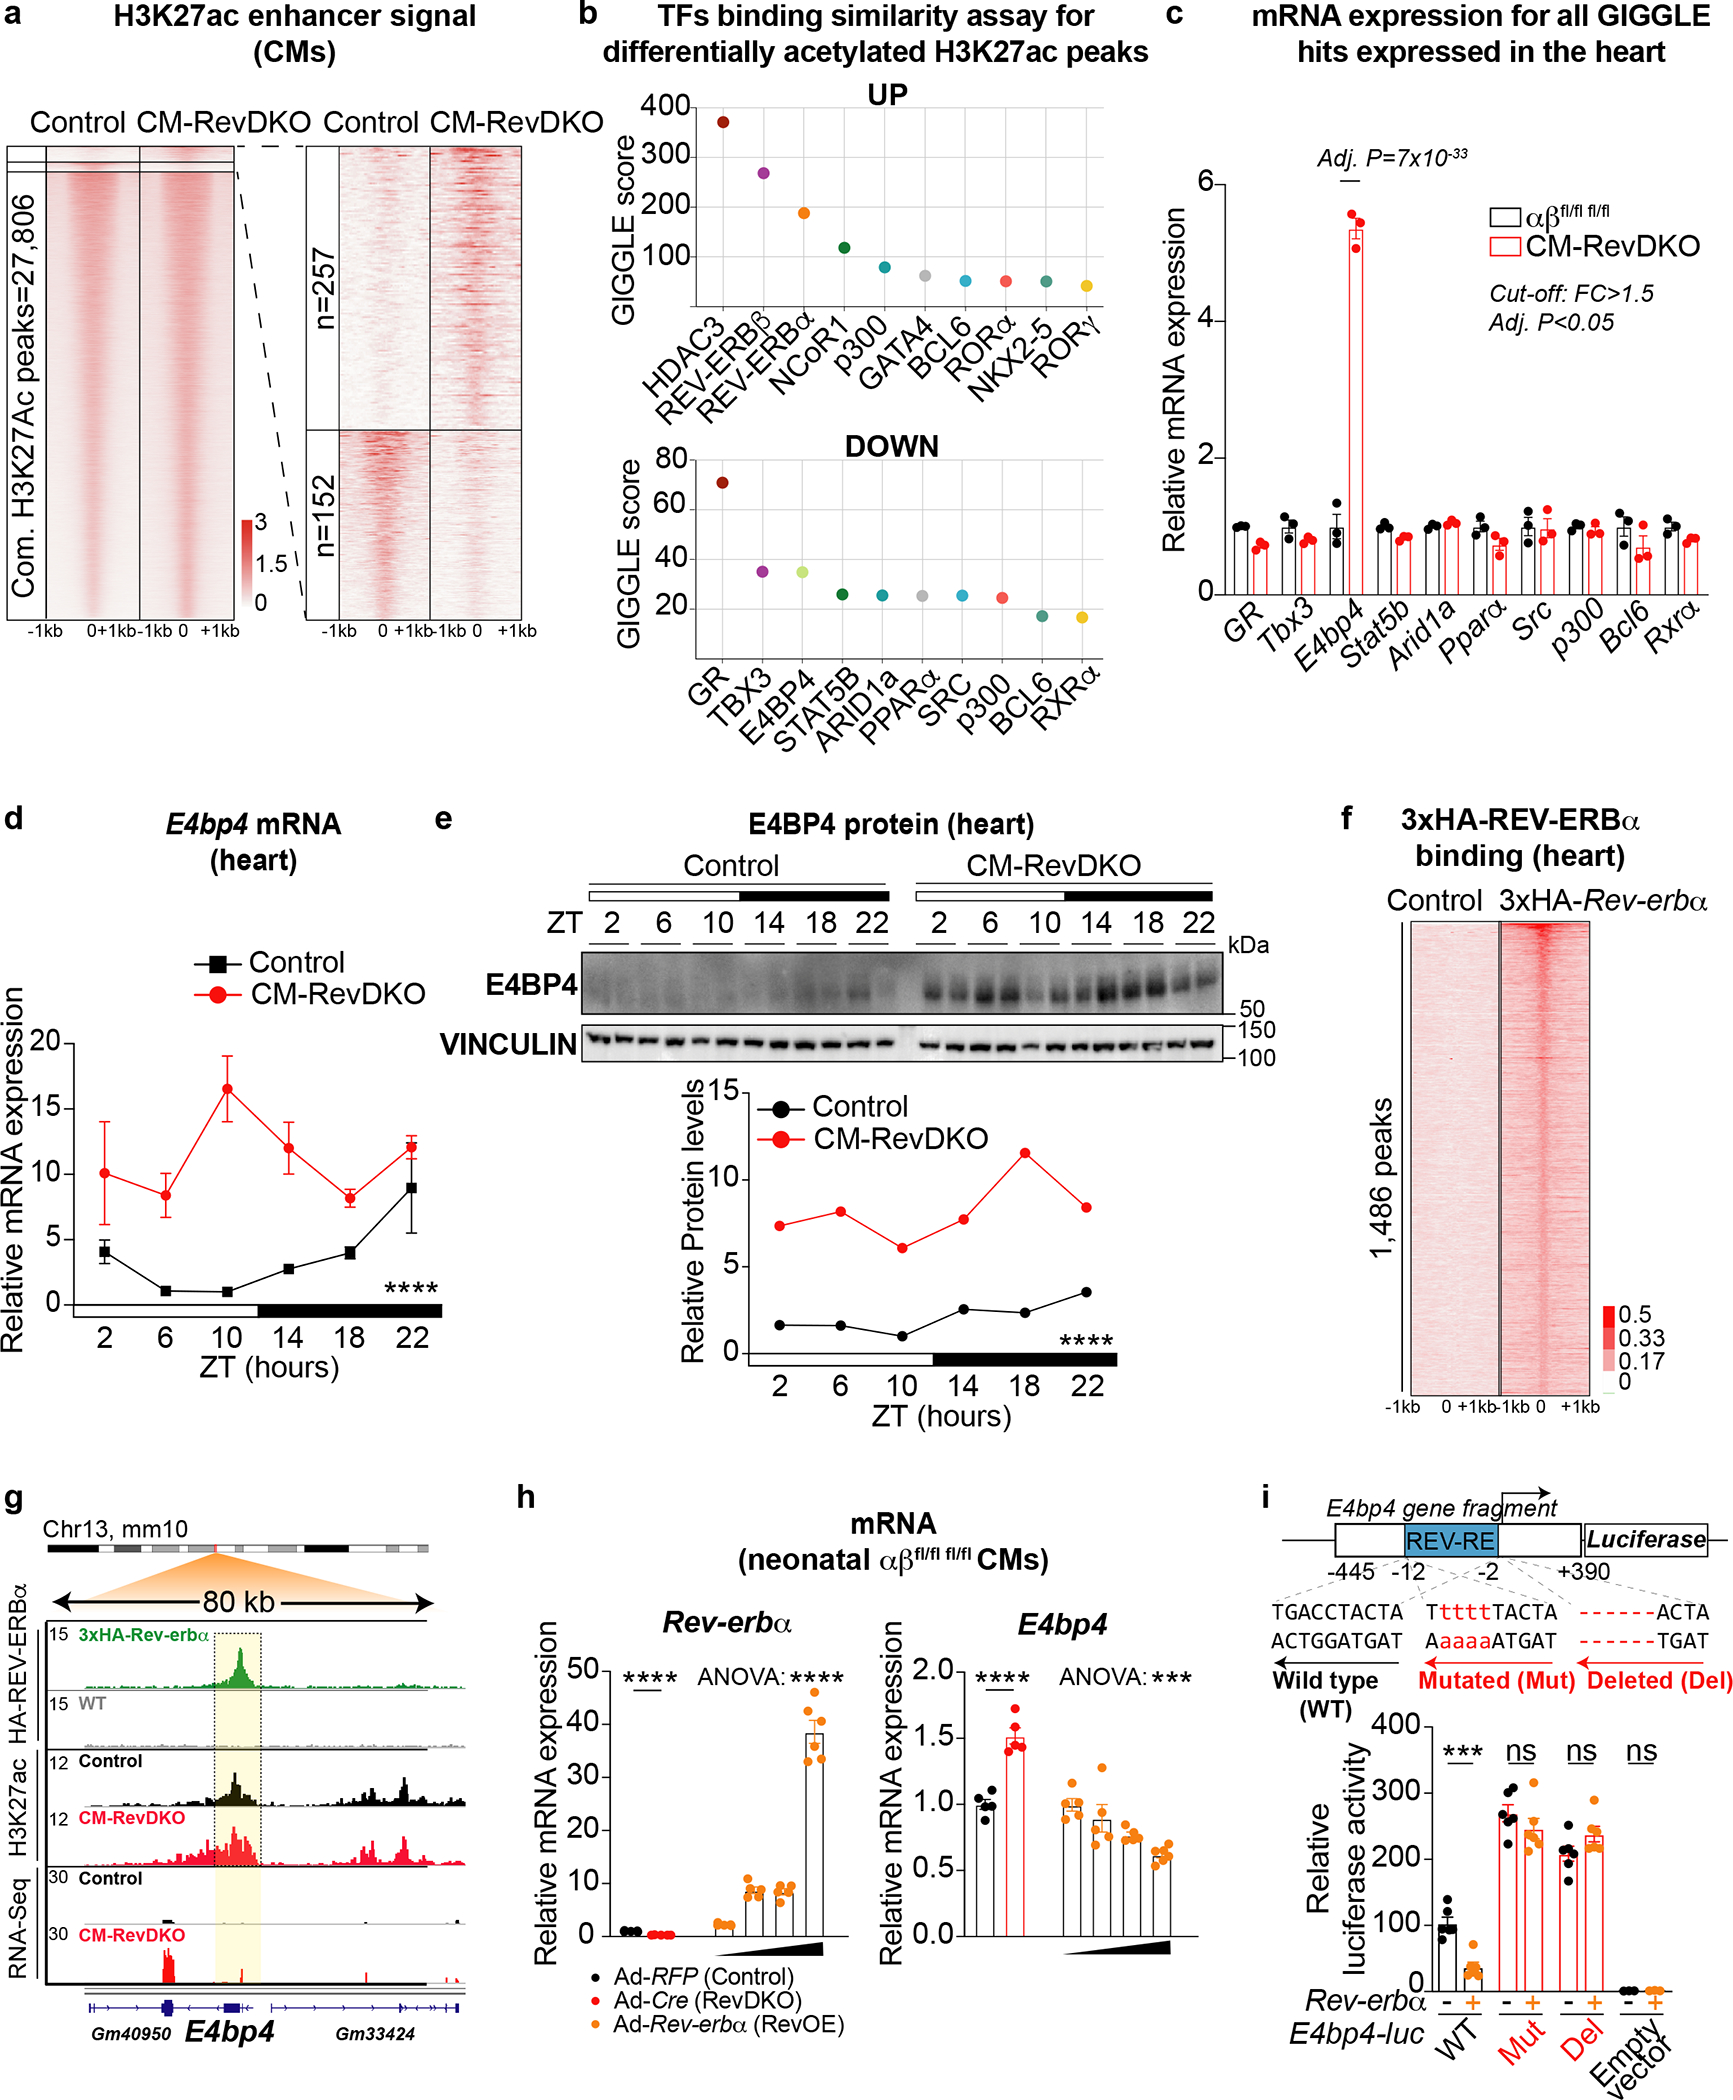
a, Scaled H3K27ac Cut&Run enrichment for cardiomyocytes isolated from control and CM-RevDKO adult hearts. 257 and 152 peaks were increased (FC > 2) and decreased respectively in CM-RevDKO cardiomyocytes (compared to control). Plots depict identified H3K27ac peaks + and −1000 base pairs. b, Transcription factor binding similarity screening on H3K27ac in/decreased sites in CM-RevDKO cardiomyocytes from a using all published cistromes from heart, muscle and liver deposited in CistromeDB31. c, Relative mRNA expression levels for all cardiac expressed putative transcription factors regulating decreased H3K27ac signal from b in hearts from 2-month-old male control vs CM-RevDKO mice (n = 3/genotype). d, Relative mRNA expression in control vs CM-RevDKO hearts from 2-month-old male mice (n=3 hearts/genotype/timepoint except for n = 2 for ZT6 and ZT22 in control, ZT2 and ZT18 in CM-RevDKO, and n = 4 for ZT22 in CM-RevDKO). e, Immunoblot and quantification for E4BP4 from control vs CM-RevDKO hearts (n=2/timepoint/genotype). f, Heat map showing 3xHA ChIP-Seq tag densities (at ZT10) in WT and 3xHA-REV-ERBα hearts at 1,486 REV-ERBα peaks. g, ChIP-Seq, Cut&Run and RNA-Seq read distribution for REV-ERBα and H3K27ac near derepressed REV-ERB target gene E4bp4 upon CM-RevDKO. h, Relative mRNA expression in Rev-erbα/βfl/fl fl/fl neonatal CMs, transduced with Adeno-RFP (control), Adeno-Cre (RevDKO) and increasing concentrations (1:100,000, 1:10,000, 1:5,000 and 1:1,000) of Adeno-RFP-Rev-erbα (RevOE, stock= 3.5×10^10 IFU/ml) (n = 5 independently transduced cell samples/condition). i, Rev-erbα overexpression induces repression of E4bp4 promoter activity in C2C12 cells. The schematic diagram indicates a putative REV-ERB response element (REV-RE) within an 835bp E4bp4 promoter proximal region fragment, where numbers indicate distance from the transcriptional start site of E4bp4. Cells were transfected with E4bp4-luc, E4bp4-luc Mut (4bp mutated in the REV-RE) or E4bp4-luc Del (6bp deleted in the REV-RE) together with TK-Renilla-luc and CMV-DsRed (control) vs CMV-Rev-erbα. Reporter luciferase activity was normalized to Renilla-luc signal and plotted values are relative to promoterless (empty) pGL4.21 vector signal (n = 6 independently transfected cell samples/condition, except for n = 3 for empty pGL4.21 vector transfected samples). n represents biologically independent replicates unless otherwise indicated. Data are presented as mean ± SEM, except for e. Adj. P was calculated by DESeq2 for c. ****P < 0.0001 by 2-way ANOVA for d and e, and ***P < 0.001, ****P < 0.0001, ns: non significant by 2-sided Student’s t test (RevDKO vs Control) and ***P < 0.001, ****P < 0.0001 by one-way ANOVA for gradient of RevOE in h and i (exact P values are provided in the Source Data).
To establish which of those factors is likely directly involved in the repression of the downregulated differentially expressed genes (DEGs) described here, we investigated whether they were differentially expressed (FC >= 1.5, Adj. P < 0.05) upon Rev-erb DKO. E4BP4 was found to change significantly with an observed upregulation of ~6-fold. While GR was modestly decreased (down, FC <1.4-fold, Fig. 3c), overlap of CM-RevDKO downregulated genes showed almost no overlap with published data of deregulated genes in cardiac-specific GR KO hearts32 (Extended Data Fig. 5a). We therefore turned our focus to E4bp4 and observed that the gene is constitutively derepressed across a full diurnal cycle at the mRNA as well as at the protein level (Fig. 3d,e). To validate regulation of E4bp4 by REV-ERBs in the heart specifically, we performed ChIP-Seq for REV-ERBα using an anti-HA antibody at ZT10 in a 3xHA-Rev-erbα mouse model as well as wild type (with no HA knock-in) mice as control. 1,486 high confidence peaks were identified in three samples with high correlation between biological replicates (Pearson correlation > 0.85; Fig. 3f and Extended Data Fig. 5b). 9% of the REV-ERB peaks were found at promoters, 51% at intronic sites and 35% at intergenic regions (Extended Data Fig. 5c). Motif search confirmed binding enrichment at known motifs, such as RORE and RevDR2. In line with this, enhancers with two-fold increased H3K27ac signal revealed similar motifs (Extended Data Fig. 5d). Overlap of annotated high confidence peaks with CM-RevDKO DEGs showed that upregulated genes were significantly enriched for REV-ERB binding in their vicinity, while downregulated genes were not (Extended Data Fig. 5e). Examples of DEGs with REV-ERBα binding and changed regulatory activity include both well-known canonical clock target genes, such as Bmal1 and Cry1 (Extended Data Fig. 5f,g), as well as important cardiac regulators such as the ischaemia/reperfusion injury modulator p21 and Fbn2 encoding the extracellular glycoprotein Fibrillin 2 (Extended Data Fig. 5h).
Importantly, we found the REV-ERBα binds to the E4bp4 promoter in the heart (Fig. 3g), suggesting that REV-ERB directly represses E4bp4 expression. Indeed, overexpression of Rev-erbα with varying adenoviral titers caused a dose-dependent pattern of E4bp4 repression (Fig. 3h). To further verify REV-ERB-dependent functional transcriptional regulation of E4bp4, we constructed an E4bp4-luciferase (E4bp4-luc) construct containing the E4bp4 promoter region (−445,+390 relative to transcriptional start site) harboring an identified putative REV-ERB response element (REV-RE). Transient transfection experiments show that Rev-erbα overexpression induced repression of this WT E4bp4-luc construct (Fig. 3i, Extended Data Fig. 5i). The repression was abolished when the REV-RE was either mutated or deleted (Fig. 3i). These results demonstrate that REV-ERB represses E4bp4 expression directly via binding to a REV-RE identified in its promoter proximal region. In conclusion, loss of REV-ERBs results in derepression of a set of genes including the transcriptional repressor E4bp4. Upon Rev-erb DKO, E4bp4 is expressed at constitutively high levels and could contribute to the paradoxical downregulation of its targets by the loss of repressive REV-ERBs.
Derepression of E4bp4 causes downregulated lipid metabolism gene expression
To interrogate whether CM-RevDKO-mediated E4bp4 derepression has a role in the downregulation of genes, we performed ChIP-Seq for E4BP4 at ZT10 vs ZT22 in control as well as CM-RevDKO hearts. Both known and de novo motif search for control ZT22 heart peaks confirmed NFIL3 as the top enriched motif (Extended Data Fig. 6a), validating the quality of the ChIP-Seq data. In control hearts 3,087 binding sites were observed, which were annotated to promoters (~28%), intergenic (~25%) and intronic (~43%) regions (Extended Data Fig. 6b). In contrast to the circadian E4BP4 binding we observed in control hearts, chromatin binding rhythmicity was lost in CM-RevDKO, which displayed constant binding to CREs at ZT10 and ZT22 (Fig. 4a). Indeed, the majority (2,187/3,384) of E4BP4 binding sites at ZT22 in control hearts, were bound at both ZT22 and ZT10 after CM-RevDKO (Extended Data Fig. 6c), indicating that CM-RevDKO hearts do not gain new E4BP4 binding sites, but E4BP4 constitutively binds to sites normally occupied only during the dark phase.
Fig. 4. Constitutive binding of E4BP4 contributes to downregulated gene expression in CM-RevDKO hearts.
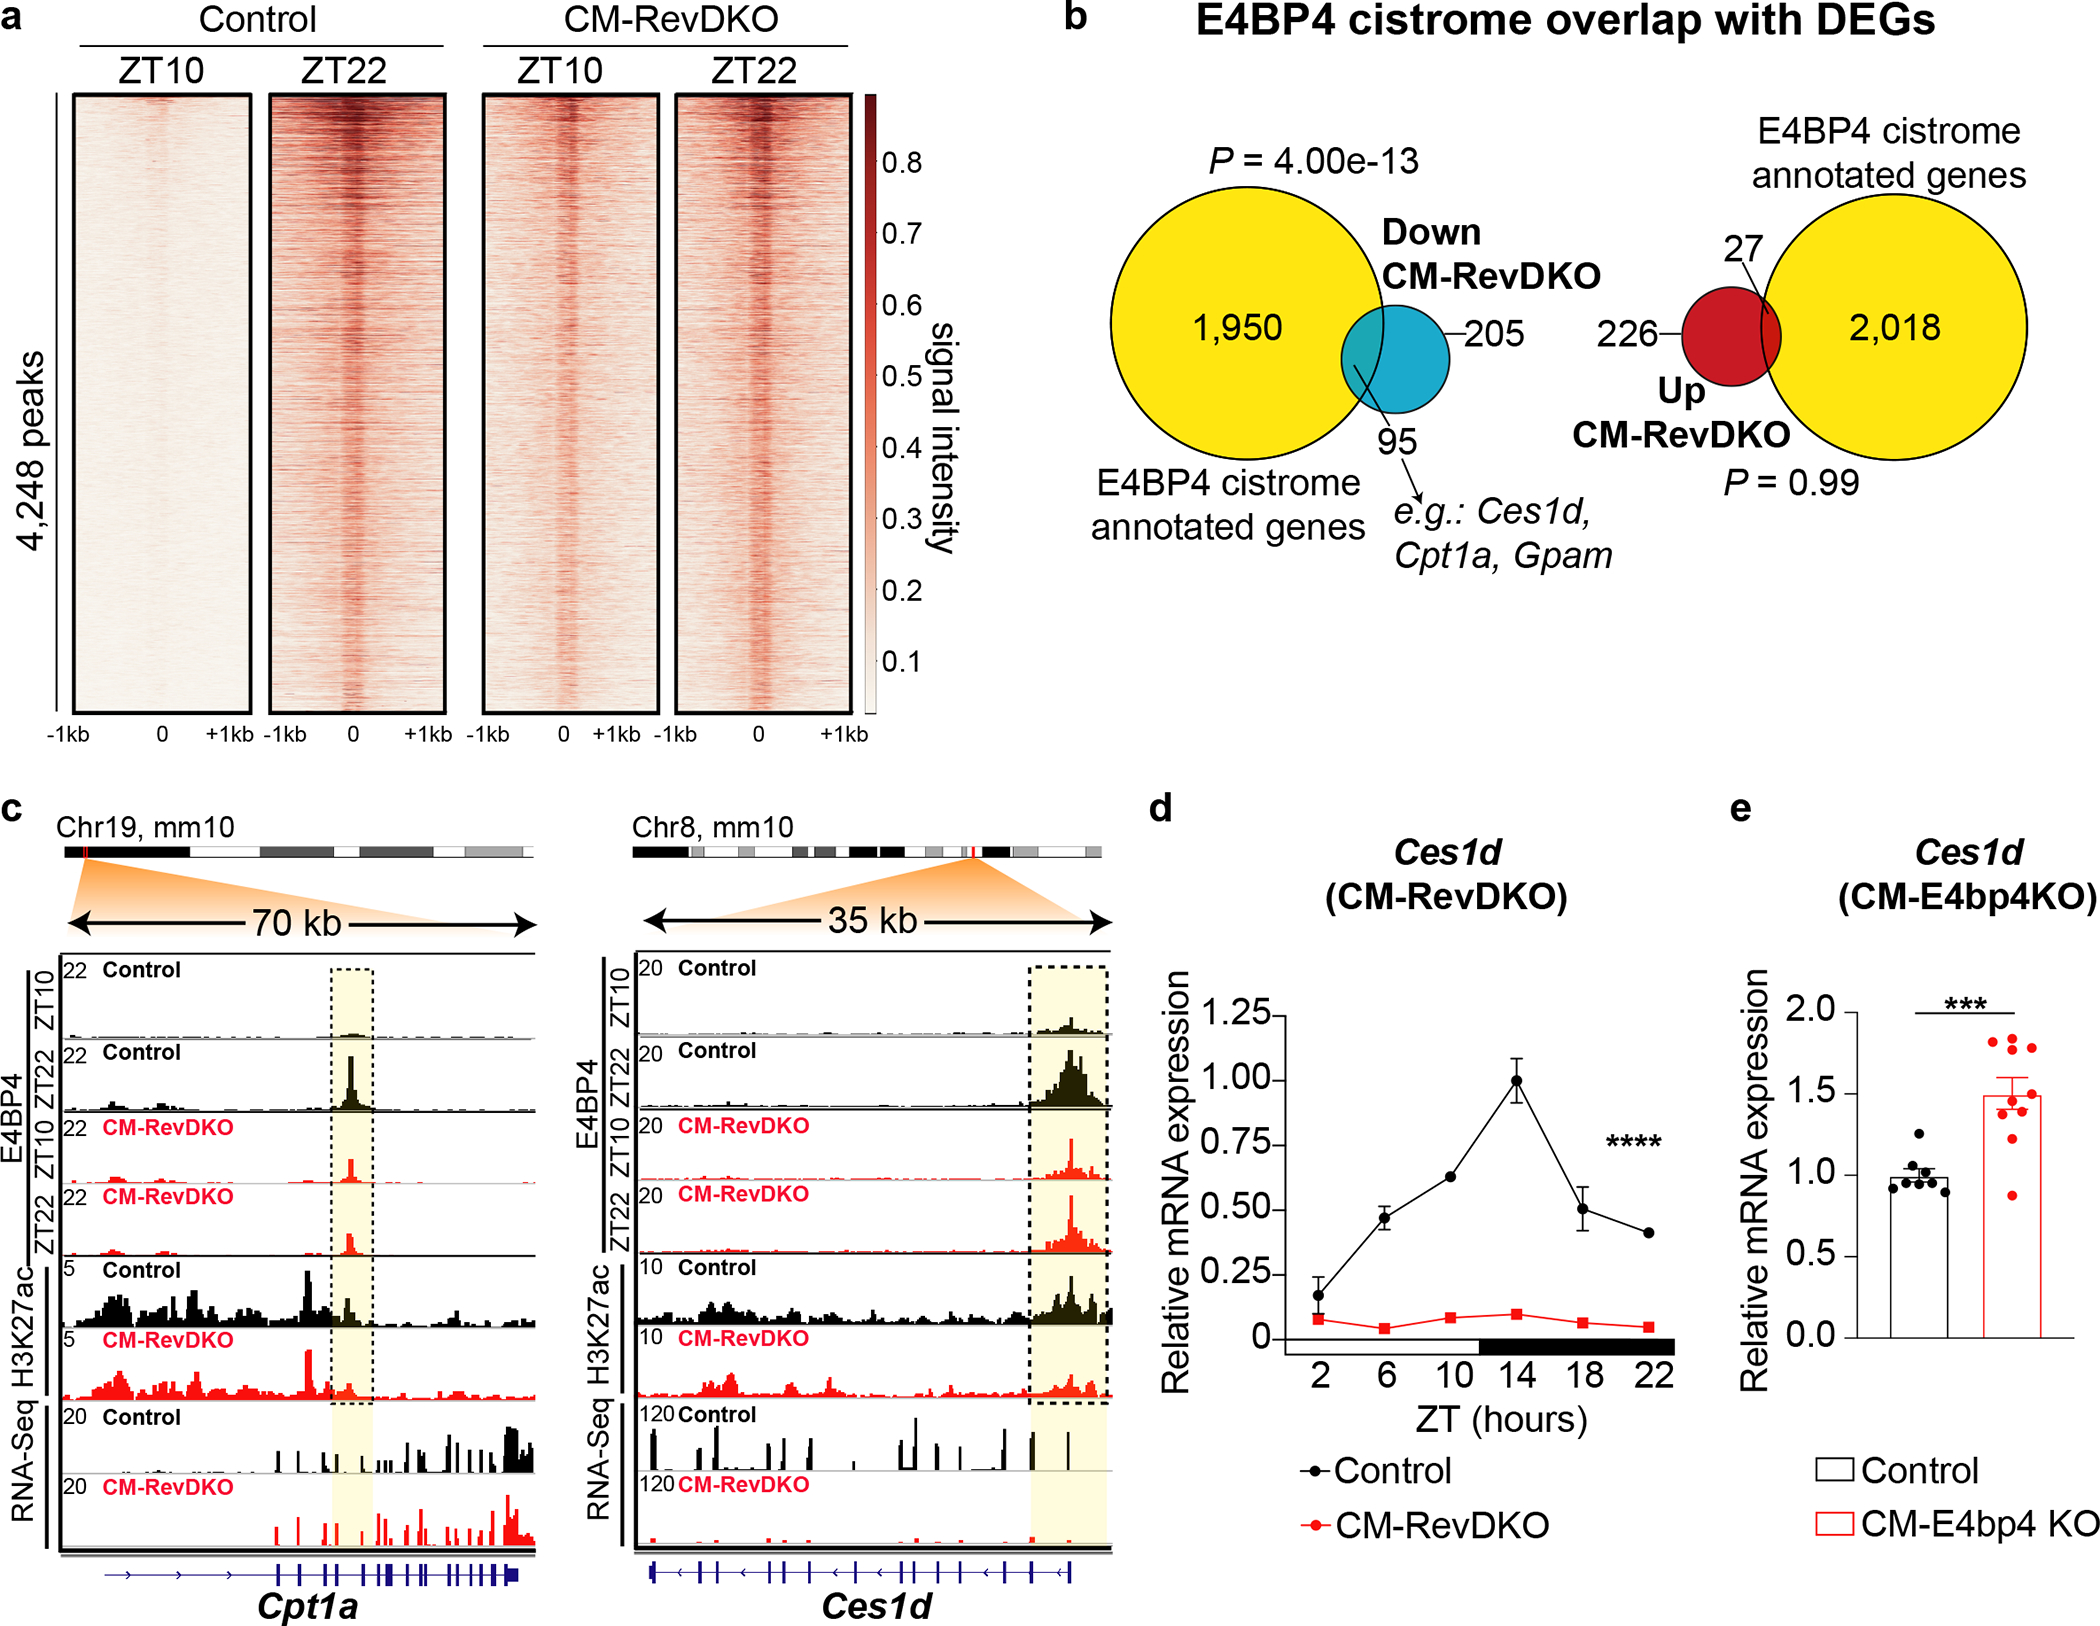
a, Heat map showing E4BP4 ChIP-Seq tag densities (at ZT10 vs ZT22) in control and CM-RevDKO hearts, at 4,248 high-confidence E4BP4 peaks. b, Venn diagram showing overlap between differentially expressed genes (DEGs) in CM-RevDKO vs control hearts and annotated peaks from the control cardiac E4BP4 cistrome (at ZT22). c, ChIP-Seq, Cut&Run and RNA-Seq read distribution for E4BP4 and H3K27ac near identified E4BP4 target genes in control and CM-RevDKO hearts. d, Relative E4BP4-target mRNA expression in control vs CM-RevDKO hearts from 2-month-old male mice (n = 3 hearts/genotype/timepoint, except for n = 2 at ZT2 n = 4 at ZT18 for CM-RevDKO), and e, CM-E4bp4 KO hearts from 3-month-old male mice (at ZT12) (n = 8 for control and n = 10 for CM-E4bp4 KO). n represents biologically independent replicates. Data are presented as mean ± SEM. ****P < 0.0001, by 2-way ANOVA in d and ***P < 0.001, by 2-sided Student’s t test in e. Significance of overlap in b is calculated via a hypergeometric test (exact P values are provided in the Source Data).
Intersection of these data with DEGs in CM-RevDKO hearts showed higher enrichment for E4BP4 binding near downregulated transcripts (Fig. 4b), consistent with transcriptional repression by E4BP4. A number of important metabolic genes that were repressed in CM-RevDKO hearts contained regulatory regions at which H3K27ac was reduced in the absence of REV-ERBs and colocalized with E4BP4 binding in the heart. For example, Cpt1a (Carnithine O-palmitoyltransferase), regulator of mitochondrial uptake of long-chain fatty acids and their subsequent beta-oxidation, the lipase Ces1d (carboxylesterase 1d), Gpam (Glycerol-3-phosphate acyltransferase 1, mitochondrial) and Dgat2 (Diacylglycerol O-acyltransferase 2), two key enzymes involved in triacylglyceride synthesis in the heart, displayed this pattern (Fig. 4c, Extended Data Fig. 6d). In addition, Ces1d mRNA was downregulated across the circadian cycle (Fig. 4d) in line with constitutive high levels of E4BP4. In CM-specific E4bp4 knock-out hearts Ces1d mRNA levels were increased (Fig. 4e), validating this gene as a direct E4BP4 target. Therefore, we conclude that the effects of REV-ERBs in the heart occur, in part, indirectly via derepression of another repressor (E4BP4) leading to decreased transcriptional activity of multiple downstream genes.
REV-ERBs transcriptionally repress Bmal116,33 and their own expression is subject to BMAL1-mediated activation34, which highlights the intricate regulation between the different arms of the molecular clock. A previously described cardiomyocyte-specific Bmal1 knock out (CBK) mouse was also observed to have severe cardiac defects11. Importantly, Bmal1 KO results in Rev-erb downregulation35 as a result of the above-mentioned interplay between these two clock factors. Therefore, CBK mice could share a subset of gene expression alterations (expected to be primarily upregulation) due to absence of REV-ERB’s repressive function in both models. In reverse, Rev-erb DKO results in constitutive presence of BMAL1 (Fig. 1d, Extended Data Fig. 1a), so a potential set of genes downregulated in the CBK but upregulated in the CM-RevDKO could also exist. We investigated whether these genes exist and indeed found 105 out of 253 upregulated genes in CM-RevDKO hearts were also upregulated in CBK hearts, while out of these 253, only 10 were downregulated in CBK hearts (Extended Data Fig. 6e). This suggests that the upregulated transcriptional changes could be a consequence of REV-ERB loss rather than BMAL1 loss (in CBK) or gain (in CM-RevDKO). Indeed, ~25% of those had a binding site for REV-ERBα in the heart (Extended Data Fig. 6f). 121 of 300 downregulated genes in CM-RevDKO hearts were also downregulated in the CBK hearts (Extended Data Fig. 6g).
Given that the potent repressor E4BP4 is upregulated in both Bmal1 and Rev-erb knock out models, we compared transcriptomic data from knockout hearts for these two transcription factors with E4BP4 ChIP-Seq data. ~45% of the commonly downregulated genes in both Bmal1 and Rev-erba/β knockout hearts had E4BP4 binding in close proximity (Extended Data Fig. 6h). This overlap between the differentially enriched genes suggests that loss of REV-ERBs and constitutively high levels of E4BP4 as a result contributes to the observed phenotype in both models. Indeed, as loss of Bmal1 leads to marked reduction in REV-ERBs11, this suggests Bmal1 KO has an indirect effect on E4BP4 via downregulation of REV-ERBs.
REV-ERB controls cardiac NAD+ biosynthesis via E4BP4-mediated Nampt repression
As our results point towards an important role for E4BP4, we explored how this factor might affect cardiac metabolism. E4BP4 is overexpressed in diseased human hearts36 and its Drosophila homologue Vrille increases with aging and overexpression causes dilation of the heart due to mitochondrial dysfunction37. Consistent with this, in the CM-RevDKO hearts, expression of key factors in mitochondrial metabolism such as Pgc1-α/β, Naprt1 and Nampt were severely downregulated at ZT10 (Extended Data Fig. 7a). Since NAMPT is the rate limiting enzyme in the NAD+ salvage pathway, and that NAD+ regulates metabolism both directly (e.g., binding to metabolic enzymes and/or use as a metabolic reaction substrate) and indirectly (e.g., a co-factor for multiple posttranslational modifications)38 we hypothesized that REV-ERBs are crucial for NAD+ homeostasis through transcriptional regulation of Nampt via E4BP4. In CMs, H3K27ac levels were decreased at enhancers upstream of the Nampt promoter that displayed diurnal and constitutive E4BP4 binding in control and CM-RevDKO hearts, respectively (Fig. 5a). Intersection of these data with previously published HiC data from mouse heart39 revealed looping between these putative enhancers and the Nampt promoter (Fig. 5a), suggesting that these CREs are directly regulating cardiac Nampt gene expression. In addition, in each of these 3 enhancers we found a D-Box motif (TTAYGTAA), a canonical sequence bound by E4BP440. ChIP-qPCR for E4BP4 at the most proximal CREs (50 kb upstream of the Nampt promoter) validated E4BP4 binding at both ZT10 and ZT22 in the CM-RevDKO hearts compared to only ZT22 in the control (Fig. 5b). These epigenetic changes led to constant repression of NAMPT mRNA as well as protein levels across the full diurnal cycle (Fig. 5c,d). Diurnal Nampt mRNA expression has classically been attributed to BMAL1:CLOCK-mediated transcription, where KO of Clock or Bmal1 causes drastic Nampt, as well as NAD+, reduction7,8,41. Since Nampt was reduced and E4BP4 was induced in both CM-specific Bmal1 and Rev-erbα/β KO hearts, we hypothesized that E4BP4 would be the main driver of Nampt repression. Therefore, we compared Nampt as well as Bmal1, Rev-erbα/β and E4bp4 mRNA levels in cardiomyocyte-specific KOs of Bmal1, Rev-erbα/β, E4bp4, as well as Bmal1/E4bp4 double KOs (Extended Data Fig. 7b). Where both Bmal1 and Rev-erbα/β KOs showed reduced Nampt levels, E4bp4 KO hearts displayed increased Nampt expression (Fig. 5e). Strikingly, Bmal1/E4bp4 double KOs did not show reduced Nampt levels, suggesting that in Bmal1 single KOs, E4BP4 is necessary to repress Nampt expression (Fig. 5e,f). Protein levels were in line with this, with reduction of NAMPT in the Bmal1 KO hearts which was partially restored by additional E4bp4 KO (Extended Data Fig. 7c). All together these results demonstrate that the repressive REV-ERB-E4BP4 axis is dominant and essential in regulating diurnal Nampt expression.
Fig. 5. REV-ERBs control cardiac NAD+ biosynthesis via E4BP4-mediated repression of Nampt.
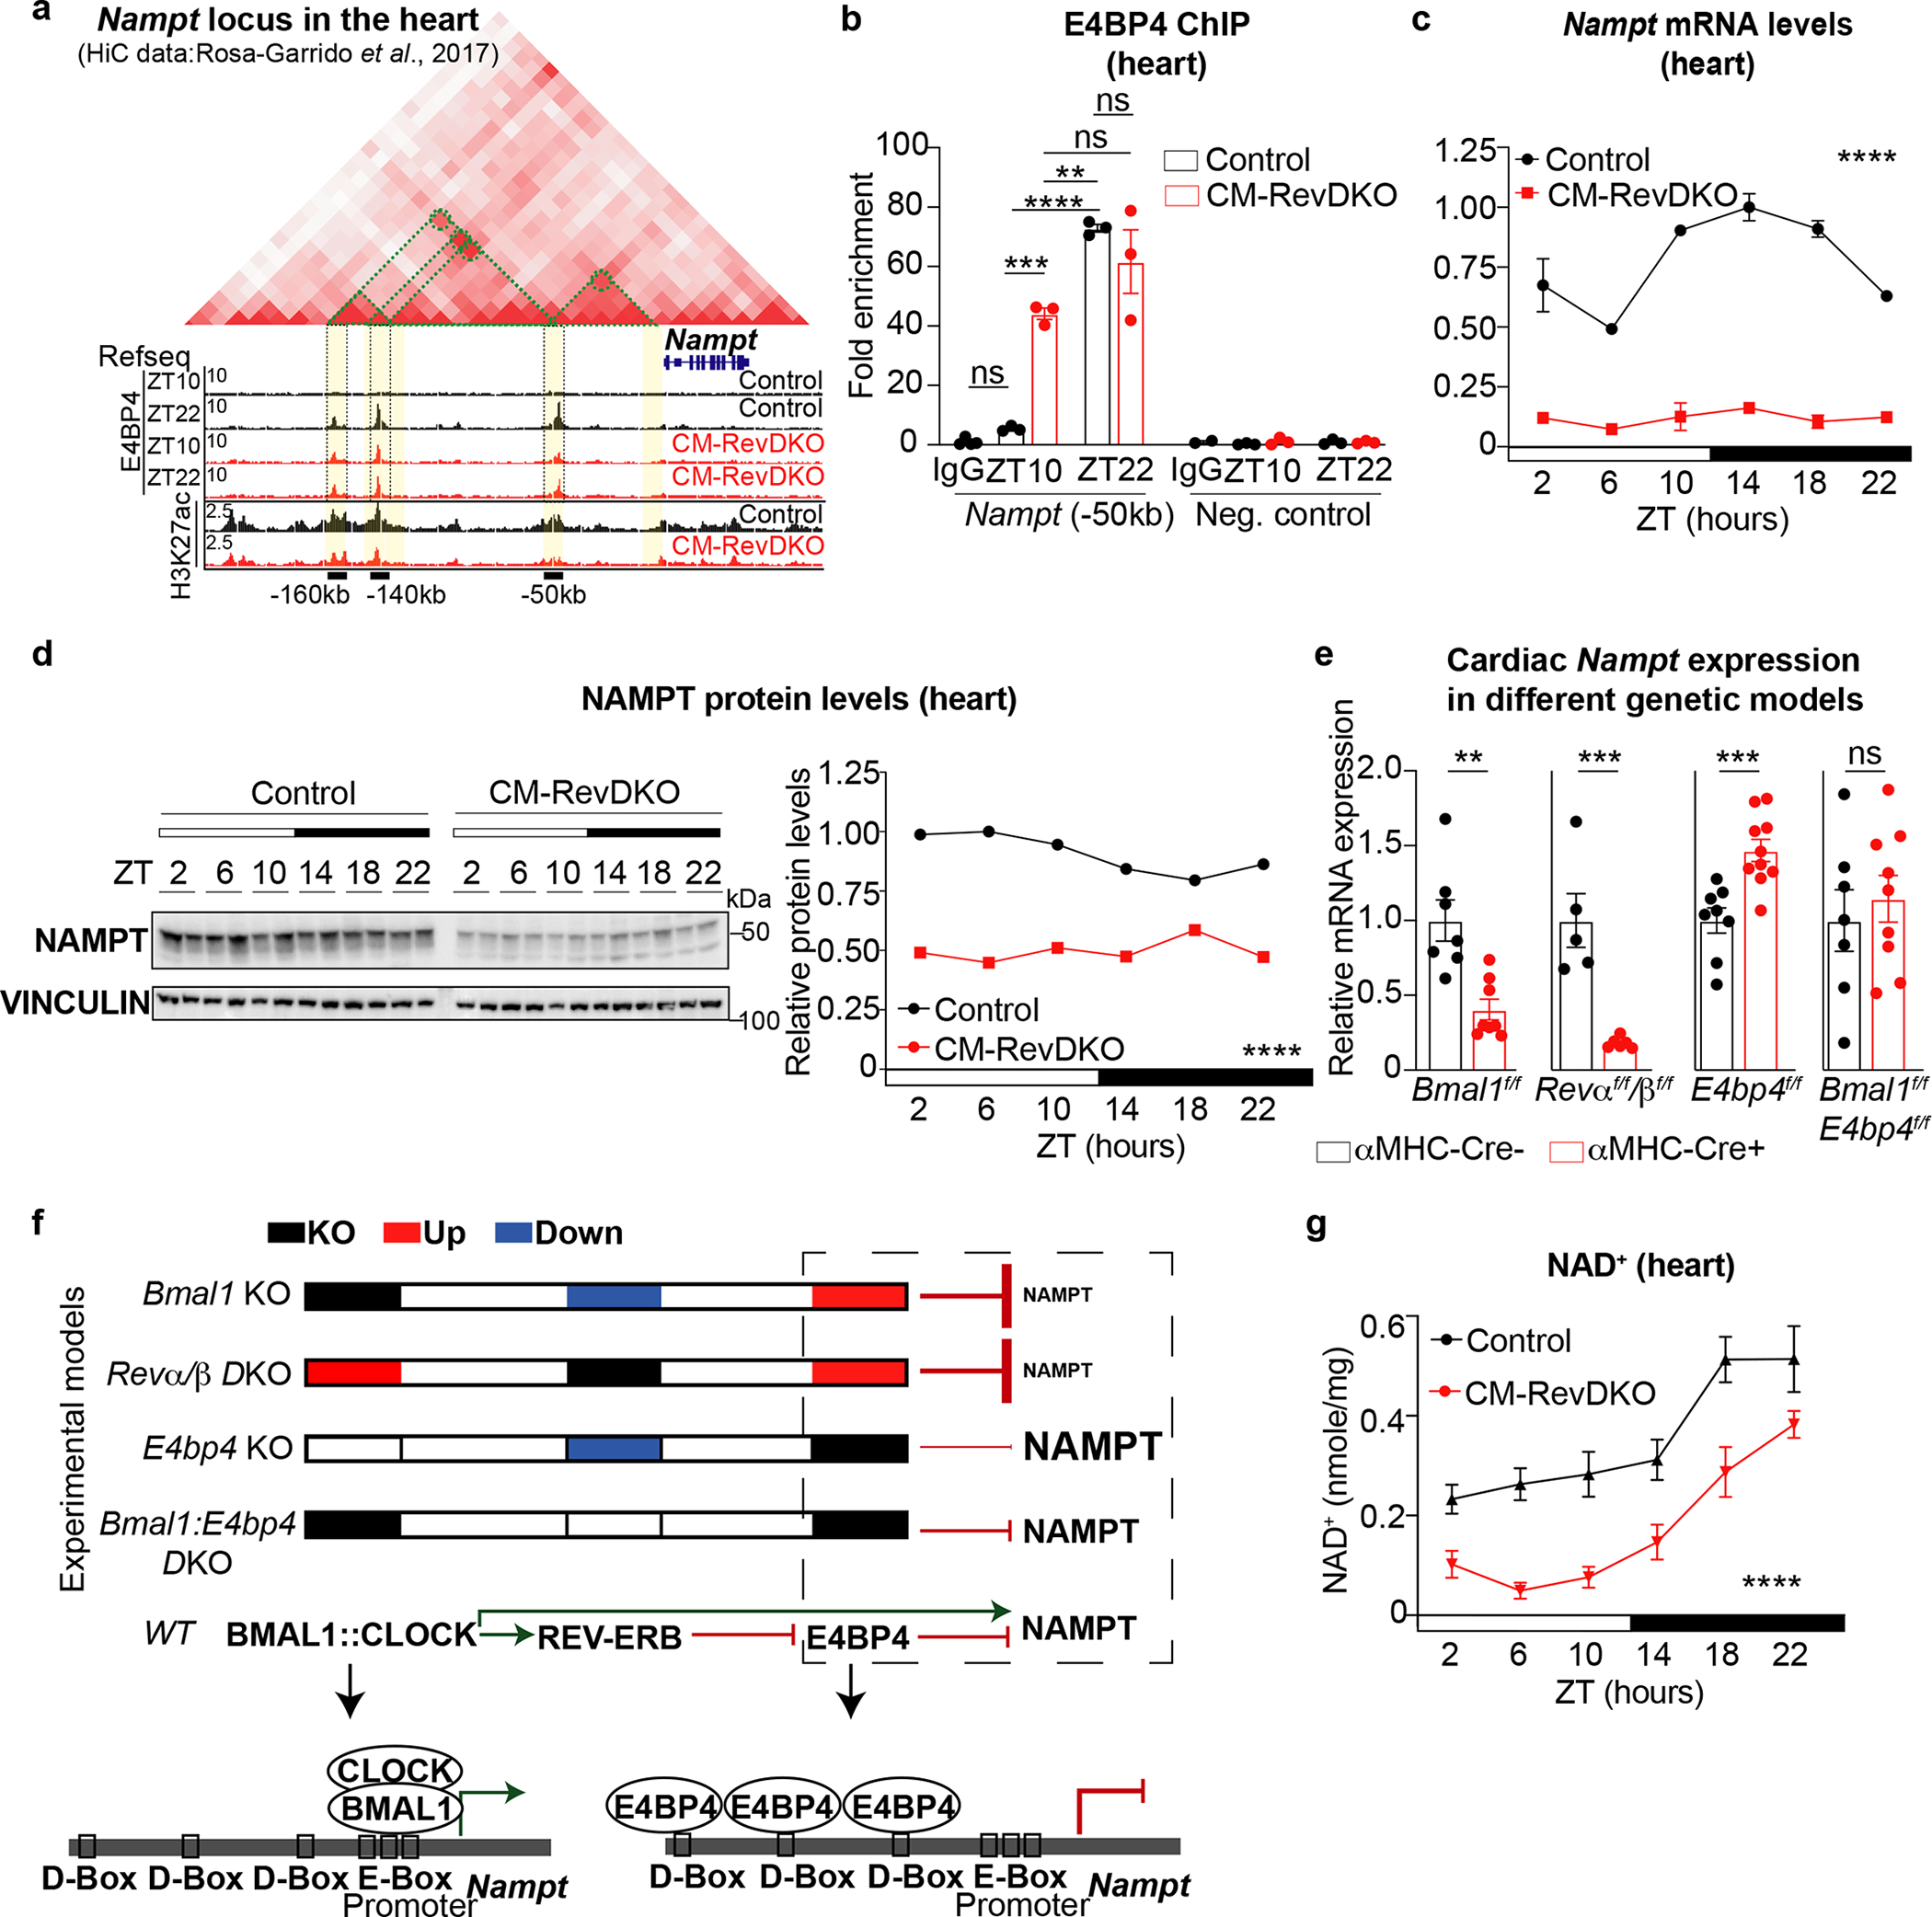
a, Hi-C from the heart (obtained from39), H3K27ac Cut&Run data from isolated adult control and CM-RevDKO hearts (at ZT10) and E4BP4 ChIP-Seq data (at ZT10 and ZT22) from control and CM-RevDKO hearts. Green dotted lines delineate 3D contacts. Identified cis-regulatory elementals (CREs) are highlighted in yellow, 3 of them were found to be bound by E4BP4, marked by black bars and their respective distance to the TSS of Nampt. Data were visualized via Juicebox64. b, E4BP4 ChIP-qPCR at the CRE, identified in (a), 50kb upstream of the Nampt TSS (at ZT10 and ZT22) from control and CM-RevDKO hearts. A random locus in the genome was chosen as negative control. (n = 3/condition/genotype). c, Relative Nampt mRNA expression in control vs CM-RevDKO hearts from 2-month-old male mice (n = 3 hearts/genotype/timepoint except for n = 2 for ZT6/ZT10 and ZT22 in control, ZT2 and ZT18 in CM-RevDKO, and n = 4 for ZT22 in CM-RevDKO). d, Immunoblot and protein quantification for NAMPT from control vs CM-RevDKO hearts from 2-month-old male mice (n=2/timepoint/genotype). e, Relative Nampt mRNA expression in hearts from multiple genetic cardiomyocyte-specific (CM) KO models: CBK (n = 7 for control and n = 8 for KO), CM-RevDKO (n = 5 for control and n = 6 for KO), E4bp4 (n = 8 for control and n = 10 for KO) and CBK/E4bp4 (double) KO (n = 6 for control and n = 9 for DKO) and control hearts from 2-month-old male mice for CM-RevDKO and control at ZT10 and from 3-month-old male mice for the rest at ZT12. f, cartoon of summarized experimental data and proposed mechanism of transcriptional regulation of Nampt in different genetic KO models. g, NAD+ levels from control vs CM-RevDKO hearts from 2-month-old mice (n = 6 hearts/timepoint except for n = 5 for ZT6 in control, n = 5 except for n = 4 for ZT6, n = 6 for ZT18 and n = 7 for ZT22 in CM-RevDKO). n represents biologically independent replicates. All data are presented as mean ± SEM, except for d. ns: non significant, **P < 0.01,***P < 0.001,****P < 0.0001 by two-way ANOVA (in c,d,g), one-way ANOVA followed by a Tukey’s multiple comparisons test (in b), and by 2-sided Student’s t test in e (exact P values are provided in the Source Data).
To investigate the consequences of deregulated NAMPT levels for NAD+, we compared the CM-RevDKO to control hearts and observed severely reduced NAD+ levels at each timepoint during the diurnal cycle (Fig.5g). While consistent reduction over 24 hours was significant, we still noted an oscillatory pattern of NAD+ in the heart. Similar observations were made in Bmal1 KO livers which also show lower levels across a circadian cycle but maintenance of rhythmicity42. As the CM-RevDKO mice have no systemic clock defect, activity of remaining NAMPT protein and substrate availability could contribute to remaining NAD+ rhythmicity. However, we show that constitutive E4BP4-mediated Nampt repression in the absence of REV-ERBs results in lower NAD+ levels throughout the entire 24-hour cycle.
Discussion
The prevalence of heart disease in association with metabolic disorders stresses the importance of understanding how cardiac energy metabolism is maintained with constantly changing external cues. Here, we have uncovered an essential role for circadian REV-ERB nuclear receptors as major transcriptional contributors to metabolic processes in the heart. Chronic absence of REV-ERBs leads to dilated cardiomyopathy and reduced lifespan. Cardiac pathology has previously been observed after CM-specific loss of the core clock factors Bmal1 and Clock13,43–46, and while many deregulated genes overlap between the CBK and CM-RevDKO (Extended Data Fig. 6e,f,g,h), a myriad differ between these models indicating the complexity of how deregulation of different clock factors contribute to disease development. In addition, this highlights the importance of comparing different knock out models of the circadian clock pathway to gain deeper understanding of deregulated transcriptional programs that underlie cardiac phenotypes and establish hierarchical transcription factor networks. In depth comparison between differences in phenotypes of the specific CM-specific KO models is necessary and allows for investigating contributions of different deregulated gene sets to the phenotype.
Several cardiac genes such as voltage-gated/ion channels (e.g. Kcne1 and Slc41a3) were derepressed upon Rev-erbα/β double knock out. In addition, genes like Ppp1r1b, encoding DARPP-32, could be linked to both the core clock and metabolism (Fig. 2). Future investigations will be needed to disentangle this putative contribution of different genes to the phenotype.
In addition, we find that the transcriptional repressor E4bp4 is a direct REV-ERBα target which is constitutively derepressed in CM-RevDKO hearts. Expression of E4bp4 across a full diurnal cycle leads to occupancy at its cognate binding sites at ZT22 as well as ZT10, rather than ZT22 only. At ZT22, we observed a modest decrease in E4BP4 binding in DKO hearts compared to control hearts, which could potentially be due to deregulated competing transcription factors. The contribution of downregulated genes in the cardiac phenotype is demonstrated by decreased expression of a set of important metabolic genes (e.g. Cpt1a, Ces1d and Gpam, Fig. 4c, Extended Data Fig. 6d). In addition, this study reveals that the marked downregulation of NAMPT in CM-RevDKO hearts is facilitated through constitutive E4BP4 binding and repression at 3 cis-regulatory elements 160–50kb upstream of the transcriptional start site of Nampt. Concomitantly, cardiac NAD+ levels were reduced across a full diurnal cycle. However, although both mRNA and protein NAMPT levels were constitutively down in CM-RevDKO hearts, we still noted a residual circadian pattern in the lower NAD+ levels. Since CM-RevDKO mice still show rhythmic activity and feeding patterns, it is likely that systemic rhythmic cues (e.g. food intake), other NAD+ biosynthesis pathways (de novo/kynurenine or Preiss-Handler) or remaining NAMPT protein are contributing to residual rhythms. These data suggest that reduced cardiac NAD+ levels, together with impaired metabolic gene expression can result in age-onset-development of DCM and premature lethality (Fig. 6).
Fig. 6. Scheme of metabolic deregulation in hearts of CM-RevDKO mice.
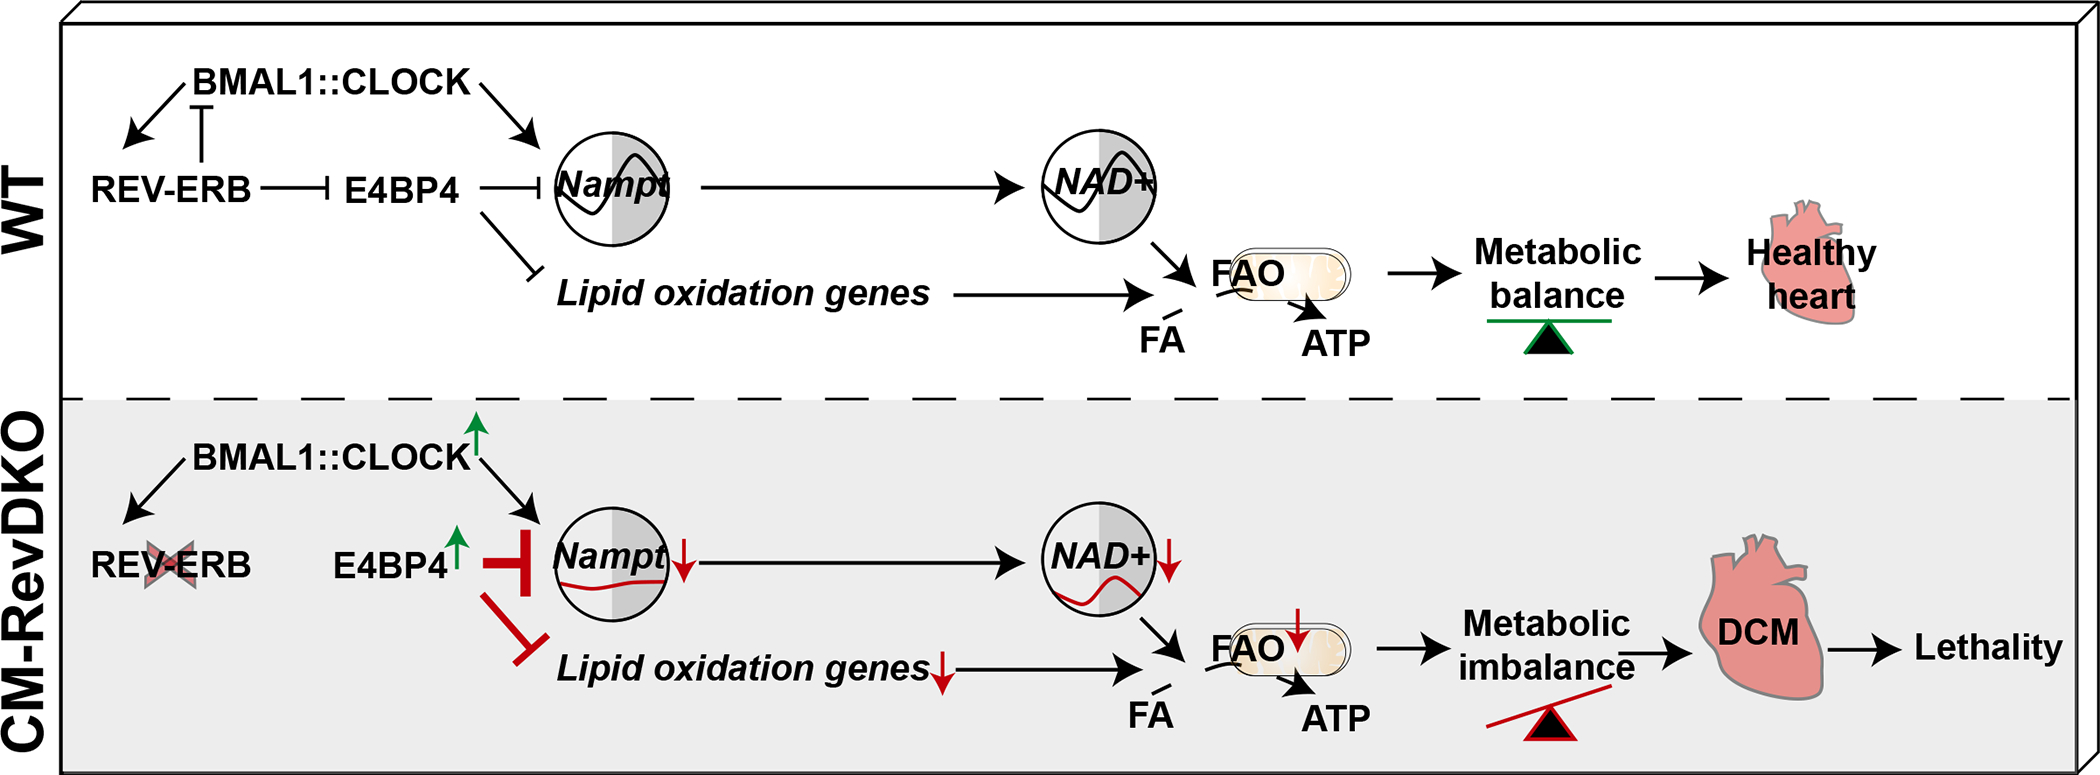
We find that a substantial number of the genes downregulated in CM-RevDKO hearts were also found to be downregulated in CBK hearts. As these genes are enriched for E4BP4 binding, this suggests that E4BP4 could contribute to gene repression in CBK hearts as well. We found that downregulated Nampt levels in CBK hearts could be rescued via additional KO of E4BP4. From these data we conclude that E4BP4 is an essential mediator of circadian Nampt regulation and suggests that the REV-ERB-E4BP4 repressive axis is more dominant than the previously described activating BMAL1:CLOCK axis7,8 in circadian transcriptional Nampt regulation. In hepatocyte-specific Rev-erb DKO livers22 we also noted downregulated Nampt and derepressed E4bp4 levels. As the Nampt gene is downregulated in Clock and Bmal1 KO livers7,8,42 and also contacts the upstream CREs47, this suggests that E4BP4-mediated repression of Nampt is not tied to the heart only and is likely to contribute to the mechanism by which the clock facilitates rhythmic Nampt expression more generally.
E4BP4 has been found to be overexpressed and NAMPT as well as NAD+ levels downregulated in human diseased hearts36,41,48, observations that highlight the importance of gaining insights on the link between multiple clock factors and cardiac metabolism which ultimately allows for future investigation of downstream effectors. Such efforts will be essential for acquiring an understanding of which (target) genes are main contributors to cardiac pathology. Since boosting NAD+ metabolism is of great interest for combating cardiovascular diseases as well as aging-related- disorders, targeting the REV-ERB-E4BP4-NAMPT axis might open up new therapeutic avenues.
Contact for reagent and resource sharing
Further information and requests for resources and reagents should be directed to and will be fulfilled by the Lead Contact, Mitchell A. Lazar (lazar@pennmedicine.upenn.edu).
Methods
Animals
Cardiomyocyte (CM)-specific Rev-erbα/β double KO (CM-RevDKO) mice were generated by breeding Rev-erbαfl/fl (with floxed alleles spanning exon 3–4-5); Rev-erbβfl/fl (with floxed alleles spanning exon 3) animals20 (Institut Clinique de la Souris, Illkirch, France) to an αMHC-Cre mouse line21, on C57BL/6 background. Genotyping was performed following DNA extraction from mouse tissue with standard PCR assay. Rev-erbα genotyping PCR primers 5’-ATAGAGAAGTCTTCCCAGATCTCCTGCACA-3’ and 5’-ACAGTCTACGGCAAGGCAACACCAA-3’ detect wildtype (411 bp) and floxed (511 bp) gene alleles. Rev-erbβ genotyping PCR primers 5’-GGTTAGGTTTGTGAGTGTCCACAGC-3’ and 5’-GGAAGTGCTCCAACAAGGTAGTGCA-3’ detect wildtype (237 bp) and floxed (376 bp) gene alleles. CM-specific E4bp4 KO (CEK) mice were generated by crossing E4bp4 floxed mice48 with αMHC-Cre mice21. CM-specific Bmal1 KO (CBK) mice were previously described45. CM-specific Bmal1/E4bp4 DKO animals were generated by crossing the two single KO animals.
Male and female mice at the age of 2–12 months were used for all experiments, unless stated otherwise in figures and figure legends. They were housed under 12h light/12h dark conditions and fed a standard chow diet (Rodent Diet 5010, LabDiet) ad libitum with free access to water. All animal care and use procedures followed the guidelines of the Institutional Animal Care and Use Committee of the University of Pennsylvania (IACUC protocol: 804747) and University of Alabama at Birmingham in accordance with the NIH guidelines.
Neonatal mouse cardiomyocyte isolation and transduction
Neonatal mouse cardiomyocytes from P0-P3 Rev-erbα/βfl/fl fl/fl were harvested with a primary mouse cardiomyocyte isolation kit (Pierce) following the manufacturer’s protocol. 1 day after isolation neoCMs were transduced with Ad-Cre, Ad-RFP (Control) or Ad-RFP-Rev-erbα (Vector Biolabs) overnight and harvested in RLT buffer 15 hours after medium change and subjected to qRT-PCR for gene expression analysis.
Cell culture
C2C12 (ATCC:CRL-1772) mouse myoblasts were cultured in DMEM supplemented with 10% FBS and 1x Penicillin-Streptomycin. Cells were incubated at 37°C in a humidified atmosphere of 5% CO2.
Construction of plasmids
An 835bp mouse E4bp4 promoter region containing the REV-ERB binding site was amplified from mouse genomic DNA and cloned into a promoterless pGL4.21 (Promega) reporter via restriction digestion with NheI/HindIII (NEB) and subsequent ligation with T4 ligase. DNA sequence was confirmed by Sanger sequencing. The primer sequences used for cloning are: NheI site-flanked fw: 5’-ggttctattggcaacaggtag-3’ and HindIII site-flanked rv: 5’-tcaaagcagctaccttaaggtg-3’. Mutated-REV-RE and deleted REV-RE containing versions of this plasmid were generated by NheI/HindIII restriction digestion of pGL4.21, followed by In-Fusion cloning (Takara) using the following primers: fw; 5’- ACCTGAGCTCGCTAGCGG-3’, rv; 5’-TGTGTTAGTAaaaaAGTTCCGAGCGCCGC-3, fw; 5’-GCTCGGAACTttttTACTAACACACATCTCTCGGCG-3’, rv; 5’-CCGGATTGCCAAGCTTCAAAG-3’, rv; 5’-TTAGTGTTCCGAGCGCCGCGCTA-3’, fw; 5’- CGCTCGGAACACTAACACACATCTCTCGGCGC-3’.
E4bp4-luciferase, pGL4.74 TK-Renilla-luciferase (Promega), 3XFlag-CMV-7.1-Rev-erbα49 and pcDNA3.1 Ds-Red (control) plasmids were transfected using Lipofectamine 3000 (Thermo Fisher Scientific). The medium was changed after 6 hours and 24 hours after medium change cells were harvested.
Luciferase reporter assays
C2C12 cells were transfected with E4bp4-luciferase and pGL4.74 TK-Renilla-luciferase (Promega) constructs alongside 3XFlag-CMV-7.1-Rev-erbα49 and pcDNA3.1-Ds-Red (control) plasmids using Lipofectamine 3000 (Thermo Fisher Scientific). The medium was changed 6 hours later, 24 hours after medium change cells were harvested in passive lysis buffer (Promega) and assessed for luciferase activity using a Dual Luciferase kit (Promega) on a Synergy HT plate reader (Biotek). Firefly luciferase signal was normalized to Renilla luciferase signal as a control for transfection efficiency.
Immunoblotting
Samples were lysed in RIPA buffer supplemented with complete protease inhibitor cocktail (Roche) and with phosSTOP (Roche). Lysates were resolved by gel electrophoresis (Bio-RAD), transferred to PVDF membrane (Immubulon-P, Millipore) and probed with the following antibodies: anti-REV-ERBα (1:1000, Abcam #ab174309); anti-BMAL1 (1:1000, Bethyl Laboratories # A302–616A), anti-E4BP4 (1:500, CST #14312S(D5K80)), anti-NAMPT (1:1000, Bethyl Laboratories #A300–372A-M), anti-DARPP-32 (1:100, SCBT #sc-271111(H3)), anti-FLAG (1:1,000. Invitrogen PA1–984B), anti-Vinculin-HRP (1:5000, CST #E18799), anti-HSP90 (1:1,000, CST 4874S), anti-Rabbit IgG, HRP-linked (1:10,000, CST #7074S), anti-Mouse IgG, HRP-linked (1:10000, CST #7076S).
Quantitative RT–PCR
Total RNA was extracted from cells (RLT buffer) and tissues (TRIZOL) using RNAeasy (Qiagen) according to the manufacturer’s instructions, and treated with DNase (Qiagen) before reverse transcription. cDNA was generated using High Capacity cDNA Reverse Transcription Kit (Applied Biosystems). Quantitative PCR reactions were performed using PowerSYBR Green PCR Master Mix (Applied Biosystems) with specific primers on a QuantStudio 6 Flex instrument (Applied Biosystems). mRNA expression was normalized to the housekeeping gene Ppib for all samples. Importantly, detecting Rev-erb deletion through qRT-PCR was performed with primers located in the deleted exons, as exons outside the deleted region are upregulated due to the normal auto-repression of Rev-erb gene expression by REV-ERB proteins. Primer sequences for qRT–PCR: Ppib-fw, 5’-GCAAGTTCCATCGTGTCATCAAG-3’; Ppib-rev, 5’-CCATAGATGCTCTTTCCTCCTG-3’; Rev-erbα-fw, 5’-GTCTCTCCGTTGGCATGTCT-3’; Rev-erbα-rev, 5’-CCAAGTTCATGGCGCTCT-3’; Rev-erbβ-fw, 5’-TTCTACTGTGTAAAGTCTGTGGG-3’; Rev-erbβ-rev, 5’-CTGGATGTTTTGCTGAATGCTC-3’; Bmal1-fw, 5’-TAGGATGTGACCGAGGGAAG-3’; Npas2-fw, 5’-TGGCCTGAGCCTCACCACGA-3’; Npas2-rv, 5’-GCAACAGCCTGAGCTGCCGA-3’; p21-fw, 5’-CCTGGTGATGTCCGACCTG-3’, p21-rev, 5’-CCATGAGCGCATCGCAATC-3’; Slc41a3-fw, 5’-TGAAGGGAAACCTGGAAATG −3; Bmal1-rev, 5’-TCAAACAAGCTCTGGCCAAT-3’; Fhit-fw, 5’-CTTCCCCCGGAATGACAACA-3’; Fhit-rev, 5’-CAGGCCTGAAAGTAGACCCG-3’; mtCO1-fw, 5’-ACTATACTACTAACAGACCG-3’; mtCO1-rev, 5’-GGTTCTTTTTTTCCGGAGTA-3’; mtCO2-fw, 5’-AACCATAGGGCACCAATGATAC −3’; mtCO2-rev, 5’-GGATGGCATCAGTTTTAAGTCC-3’; mtNd1-fw, 5’-GTTGGTCCATACGGCATTTT-3’; mtNd1-rev, 5’-TGGGTGTGGTATTGGTAGGG-3’; gβAct-fw, 5’- GCGAAGTACTCTGTGTGGA-3’; gβAct -rev, 5’- CATCGTACTCCTGCTTGCTG-3’; Ppp1r1b-fw, 5’- CAGAGCAACACTAAGTGAGCC-3’; Ppp1r1b-rev, 5’- AGTGGGTTTCTGGGGAACAC-3’; E4bp4-fw, 5’-ACGGACCAGGGAGCAGAAC-3’; E4bp4-rv, 5’-GGACTTCAGCCTCTCATCCATC-3’; Nampt-fw, 5’- GGTCATCTCCCGATTGAAGT-3’, Nampt-rv, 5’- TCAATCCAATTGGTAAGCCA-3’; Nampt_ChIP-fw, 5’- ACATTGTCCCATGCCCTAAG-3’; Nampt_ChIP-rv, 5’-AACAAGGACTTTGGCACCTC-3’; Negative control_ChIP-fw, 5’-GGCAATTTGAATGAGAAAAG-3’; Negative control_ChIP-rv, 5’-CTGTCTCGAAAAACCAAAAC-3’.
For qRT-PCR on cardiomyocyte-specific Bmal1, E4BP4 and Bmal1/E4BP4 double KO hearts, specific Taqman assays were designed for each gene from mouse sequences available in GenBank, or were purchased from Applied Biosystems. All qRT-PCR data are presented as fold change compared to control groups.
Activity and feeding monitoring
Comprehensive Lab Animal Monitoring System (CLAMS, Oxymax Window; Columbus Instruments, Columbus, OH, USA) was used to determined locomotor activity and feeding patterns After 2 days of adaptation, experimental data were obtained for 3.5 days in 12h:12h LD cycles (84 hours). Data acquisition and analysis were performed with the Oxymax and Prism software.
Glucose tolerance test
6-month-old mice were fasted for 6hrs before GTT. Blood was obtained from a tail cut and was assessed for fasting glucose levels using a OneTouch Ultra 2 (LifeScan, Johnson & Johnson) glucometer. Briefly, blood glucose was measured at baseline before mice were intraperitoneally injected with glucose solution (0.2 g/ml; 2 g/kg body weight), then subsequent measures of blood glucose were analyzed at 15, 30, 60, and 120 min post injection.
Insulin tolerance test
6-month-old were fasted for 5 hours before ITT. After baseline blood glucose measurement, insulin (0.5 U/kg) (Novolin, Novo Nordisk) was injected intraperitoneally and blood glucose was measured again at time points of 15, 30, 60, and 120 min after injection.
NAD+ measurements
2-month-old male and female hearts were harvested and snap frozen in liquid nitrogen. Hearts were powdered and subsequently lysed in 0.6M perchloric acid. Cardiac NAD+ levels were measured by a cycling enzymatic assay like previously described50.
RNA-Sequencing
RNA-Seq reads were aligned to the mouse genome (mm10) using Hisat251 with default parameters. Only unique mapped reads were considered for further analysis. Normalized expression value, fragments per kilobase of exon per million reads mapped (FPKM), was calculated for each gene using StringTie52. Genes with FPKM larger than 1 in at least one sample were considered. For differential expression analysis, raw read counts were measured within Ensembl genes (NCBIM37.67) using featureCounts53, and then DESeq254 was used with Adj.P < 0.05 and Log2FC > 0.58.
Cut&Run
H3K27ac Cut&Run in isolated adult cardiomyocytes was performed as previously described55. Cardiac cells were dissociated from 2 months old adult hearts by Langendorff perfusion (see above) between ZT7-ZT10. Cardiomyocyte fraction was enriched by low speed centrifuge at 300rpm for 3 min. 200,000 cardiomyocytes were used for each Cut&Run reaction. H3K27ac (Cell Signaling Technology #8173) or Rabbit IgG (Cell Signaling Technology #3900) at 1:100 was incubated with cardiomyocytes which were attached to Concanavalin A coated magnetics beads (Bangs Laboratories #BP531) overnight at 4°C. The next day, 2.5μl of pA-MNase from 1:10 dilution of the original stock provided by the Henikoff lab was applied to cell-beads mixture and incubated at room temperature for 10min. Pull-down DNA was extracted in phase-lock tubes using phenol-chloroform extraction. The DNA library was prepared using Hyper-prep kit (KAPA Biosystems KK8502) and subjected to sequencing on Illumina Nextseq 500 platform at Next-Generation Sequencing Core at UPenn. 40bp X 40bp paired-end read sequencing was adopted.
MACS2 version 2.1.056, was used for peak calling with the following parameters: P = 10−5, extsize = 300 and local lambda = 100,000 using IgG as input controls. Peaks were extended to a minimum size of 2000 base pairs and overlapping peaks were merged into one non-redundant list using WT and CM-RevDKO peaks. To calculate fold change in peak enrichment between WT and CM-RevDKO cardiomyocytes, read coverage within peaks was determined using bedtools coverage. Reads were normalized for the total number of reads within peaks and peaks with a control/CM-RevDKO ratio of >2 or <0.5 were defined to be down, and up respectively in WT versus CM-RevDKO. Bigwigs were RPM normalized.
ChIP-Sequencing/ChIPmentation and data analysis
In general, 1–2 mouse hearts were dounced with 15 ml cold swelling buffer (10 mM HEPES, 2 mM MgCl2, 3 mM CaCl3, 1x protease inhibitor cocktail) 20–30 times with piston A. The homogenate was spun down at 400g in 4°C for 10 min, and washed once by DPBS, resuspended in 10 ml 1% formaldehyde in DPBS for 20 min at room temperature. Then, cells were quenched by 0.125 M glycine for 10 mins at room temp. Next, cells were resuspended in 15 ml cold swelling buffer and dounced again by piston B for 10–40 times after 80%−90% of single cells/nuclei were released from clumps. The homogenate was filtered by 100 um cell strainer and spun down at 400g in 4°C for 10 min. The pellet was resuspended in 10 ml cold swelling buffer containing 10% glycerol and followed by adding 10 ml cold lysis buffer (swelling buffer + 10 % glycerol + 1% IGEPAL) slowly. After incubation on ice for 5 min, 30 ml cold lysis buffer was added and spin down at 600g in 4°C for 5 min. The pellet was washed once by 25 ml cold lysis buffer and 10 ml DPBS, then resuspend in 10 ml 1.5 mM EGS (Thermo Fisher Scientific, #21565) in 37°C for 45 min and quenched by 0.125 M glycine for 10 mins at room temperature. The dual-crosslinked pellets were kept in −80°C for ChIP-Seq experiment.
The HA and E4BP4 ChIP-Seq were performed according to previous protocol (Li et al., 2017). In short, dual-crosslinked heart cells from 3xHA-Rev-erbα or αMHC-Cre(+vs-)/Rev-erbα/β ff/ff mice were used for ChIP pull down by anti-HA Magnetic Beads (Thermo Fisher Scientific, #88837) or anti-E4BP4 (CST, #14312). Immunoprecipitated DNA was subjected to Tn5 (Illumina, 20034197) tagmentation, and PCR amplification (Illumina, #FC-121–1031). PCR products were subjected to SPRIselect (Beckman coulter, #B23318) for size selection and pair-end sequencing on Illumina Hiseq platform.
The ChIP-Seq data was processed by standard ChIP-Seq pipeline: In brief, the fastq files were first trimmed by cutadapt57 and aligned by BWA mem58, low MAPQ (<=10) and read duplicates were removed by samtools59 and picard (“Picard Toolkit.” 2019. Broad Institute, GitHub Repository. http://broadinstitute.github.io/picard/; Broad Institute.). The filtered bam files were used for peak calling by MACS256 for HA-REV-ERBα (FDR < 0.05 and FC > 2 over DKO) and E4BP4 (FDR < 0.05). ChIPseeker60 and HOMER61 were used for peak annotation and motif search and plots were visualized by customized R/python scripts.
Extracellular flux assay
Neonatal mouse cardiomyocytes were cultured on Seahorse 96-well plates (Agilent Technologies) in primary CM isolation medium. The night before the assay, the medium was switched to substrate-limited starvation medium (DMEM (Seahorse DMEM, that has no glucose) supplemented with 0.5 mM Glucose, 1 mM GlutaMAX, 0.5 mM carnitine and 1% FBS) and the cells were incubated for an additional 24 h to deplete endogenous substrates within the cells. The medium was switched to FAO assay buffer (KHB buffer, supplemented with 2.5mM Glucose, 0.5mM Carnitine, 5mM HEPES, pH=7.4) and right before the assay XF Palmitate-BSA (167μM) was added. For the mitochondrial stress test Oligomyicin (OM=1μM), Carbonyl cyanide-4 (trifluoromethoxy) phenylhydrazone (FCCP=0.8μM) and Antimycin/Rotenone (AM/Rot=1μM) were serially injected, using a Seahorse XF96 extracellular flux analyzer (Agilent Technologies). Oxygen consumption rate (OCR) values of 11–12 replicates per condition were assayed. Negative values were not included in the analysis.
Echocardiography
Ultrasound examination of the left ventricle was performed by the Mouse Cardiovascular Phenotyping Core at the University of Pennsylvania (Cardiovascular Institute) using a Fujifilm VisualSonics Ultrasound System (VisualSonics Inc, Toronto, ON, Canada). Mice were anesthetized with an I.P. injection of 0.005 ml/g of 2% Avertin (2,2,2-Tribromoethanol, Sigma-Aldrich, St. Louis, MO). Two-dimensional long-axis and short-axis M-Mode images were obtained. M Mode Images were analyzed for LV structure and function related parameters using Vevo Lab software (Visual Sonics Inc, Toronto, ON, Canada).
Histology
Hematoxylin and eosin (H&E), Masson’s trichrome, Picrosirius red and Wheat germ agglutinin (WGA) staining was performed by the Penn Histology and Gene Expression Core as previously described62. TUNEL staining was performed following manufacturer’s instructions (Roche). Images of cardiac tissue in cross-sectional orientation were acquired, and the average cardiomyocyte cross-sectional area of at least 35 cardiomyocytes/heart was calculated. WGA signal was used to delineate separate cells.
Electron microscopy
Tissues and cells for electron microscopic examination were fixed with 2.5% glutaraldehyde, 2.0% paraformaldehyde in 0.1 mol/L sodium cacodylate buffer, pH 7.4, overnight at 4°C. After subsequent buffer washes, the samples were post-fixed in 2.0% osmium tetroxide with 1.5% K3Fe(CN)6 for 1 hour at room temperature, and rinsed in DH2O prior to en bloc staining with 2% uranyl acetate. After dehydration through a graded ethanol series, the tissue was infiltrated and embedded in EMbed-812 (Electron Microscopy Sciences, Fort Washington, PA). Thin sections were stained with uranyl acetate and lead citrate and examined with a JEOL 1010 electron microscope fitted with a Hamamatsu digital camera and AMT Advantage image capture software.
GO/KEGG analysis
GO and KEGG analysis were performed on differentially expressed genes between control and CM-RevDKO hearts from 2-month-old mice, from bulk RNA-Seq and snRNA-Seq experiments using the molecular signatures database (https://www.gsea-msigdb.org63).
IMAGE analysis
IMAGE30 was used for prediction of causal transcription factors based on RNA-seq and H3K27Ac ChIP-Seq datasets. For gene expression profile, we supplied IMAGE with raw counts for each biological replicate (3 control, 3 CM-RevDKO) obtained from featureCounts for previously identified differentially expressed genes. For enhancer activity, we supplied IMAGE with normalized reads-in-peaks counts for H3K27ac in control and CM-RevDKO samples. The program was then executed with default parameters and multi-threading option.
GIGGLE score calculation
For transcription factor (TF) binding similarity screening analysis, 2-fold up and down H3K27ac enriched coordinates were used separately. CistromeDB31 was then applied to determine the similarity between these genomic coordinates and published cistromes. The following settings were used: species: mm10, Data type in Cistrome: transcription factor, chromatin regulator and Peak number of Cistrome sample to use: Top 1,000 peaks according to enrichment. The cistromes from WT and untreated mouse liver, heart and muscle tissues were selected for downstream analysis.
Statistics and reproducibility
All data are reported as mean±SEM and individual data points are shown. Data distribution was assumed to be normal but this was not formally tested. Statistical analyses were performed using Prism9 (GraphPad Software). No statistical methods were used to predetermine sample size. Where appropriate, statistical analyses were performed using an unpaired, two-tailed t-test (for comparison of two groups), one-way ANOVA (for comparison of three or more groups), or two-way ANOVA (for grouped analysis). Survival data were analyzed by using a Kaplan–Meier survival analysis with a log rank (Mantel-Cox) test. Multiple comparisons analysis was performed using Tukey’s methods (method was selected based on the recommendation of Prism9 for a given comparison). P values less than 0.05 were considered significant. For RNA-Seq analysis P and Adjusted P (False Discovery Rate (FDR) values were calculated via DESeq2. All experiments are represented by multiple biological replicates or independent experiments. The number of replicates per experiment are indicated in the legends.
Data availability
The authors declare that the data supporting the findings of this study are available within the paper and its supplementary information files. Source data are provided with this paper. The RNA, Cut&Run and ChIP-Sequencing datasets reported in this paper have been deposited in the Gene Expression Omnibus with the accession number GSE153014.
Extended Data
Extended Data Fig. 1. Additional validation of CM-RevDKO.
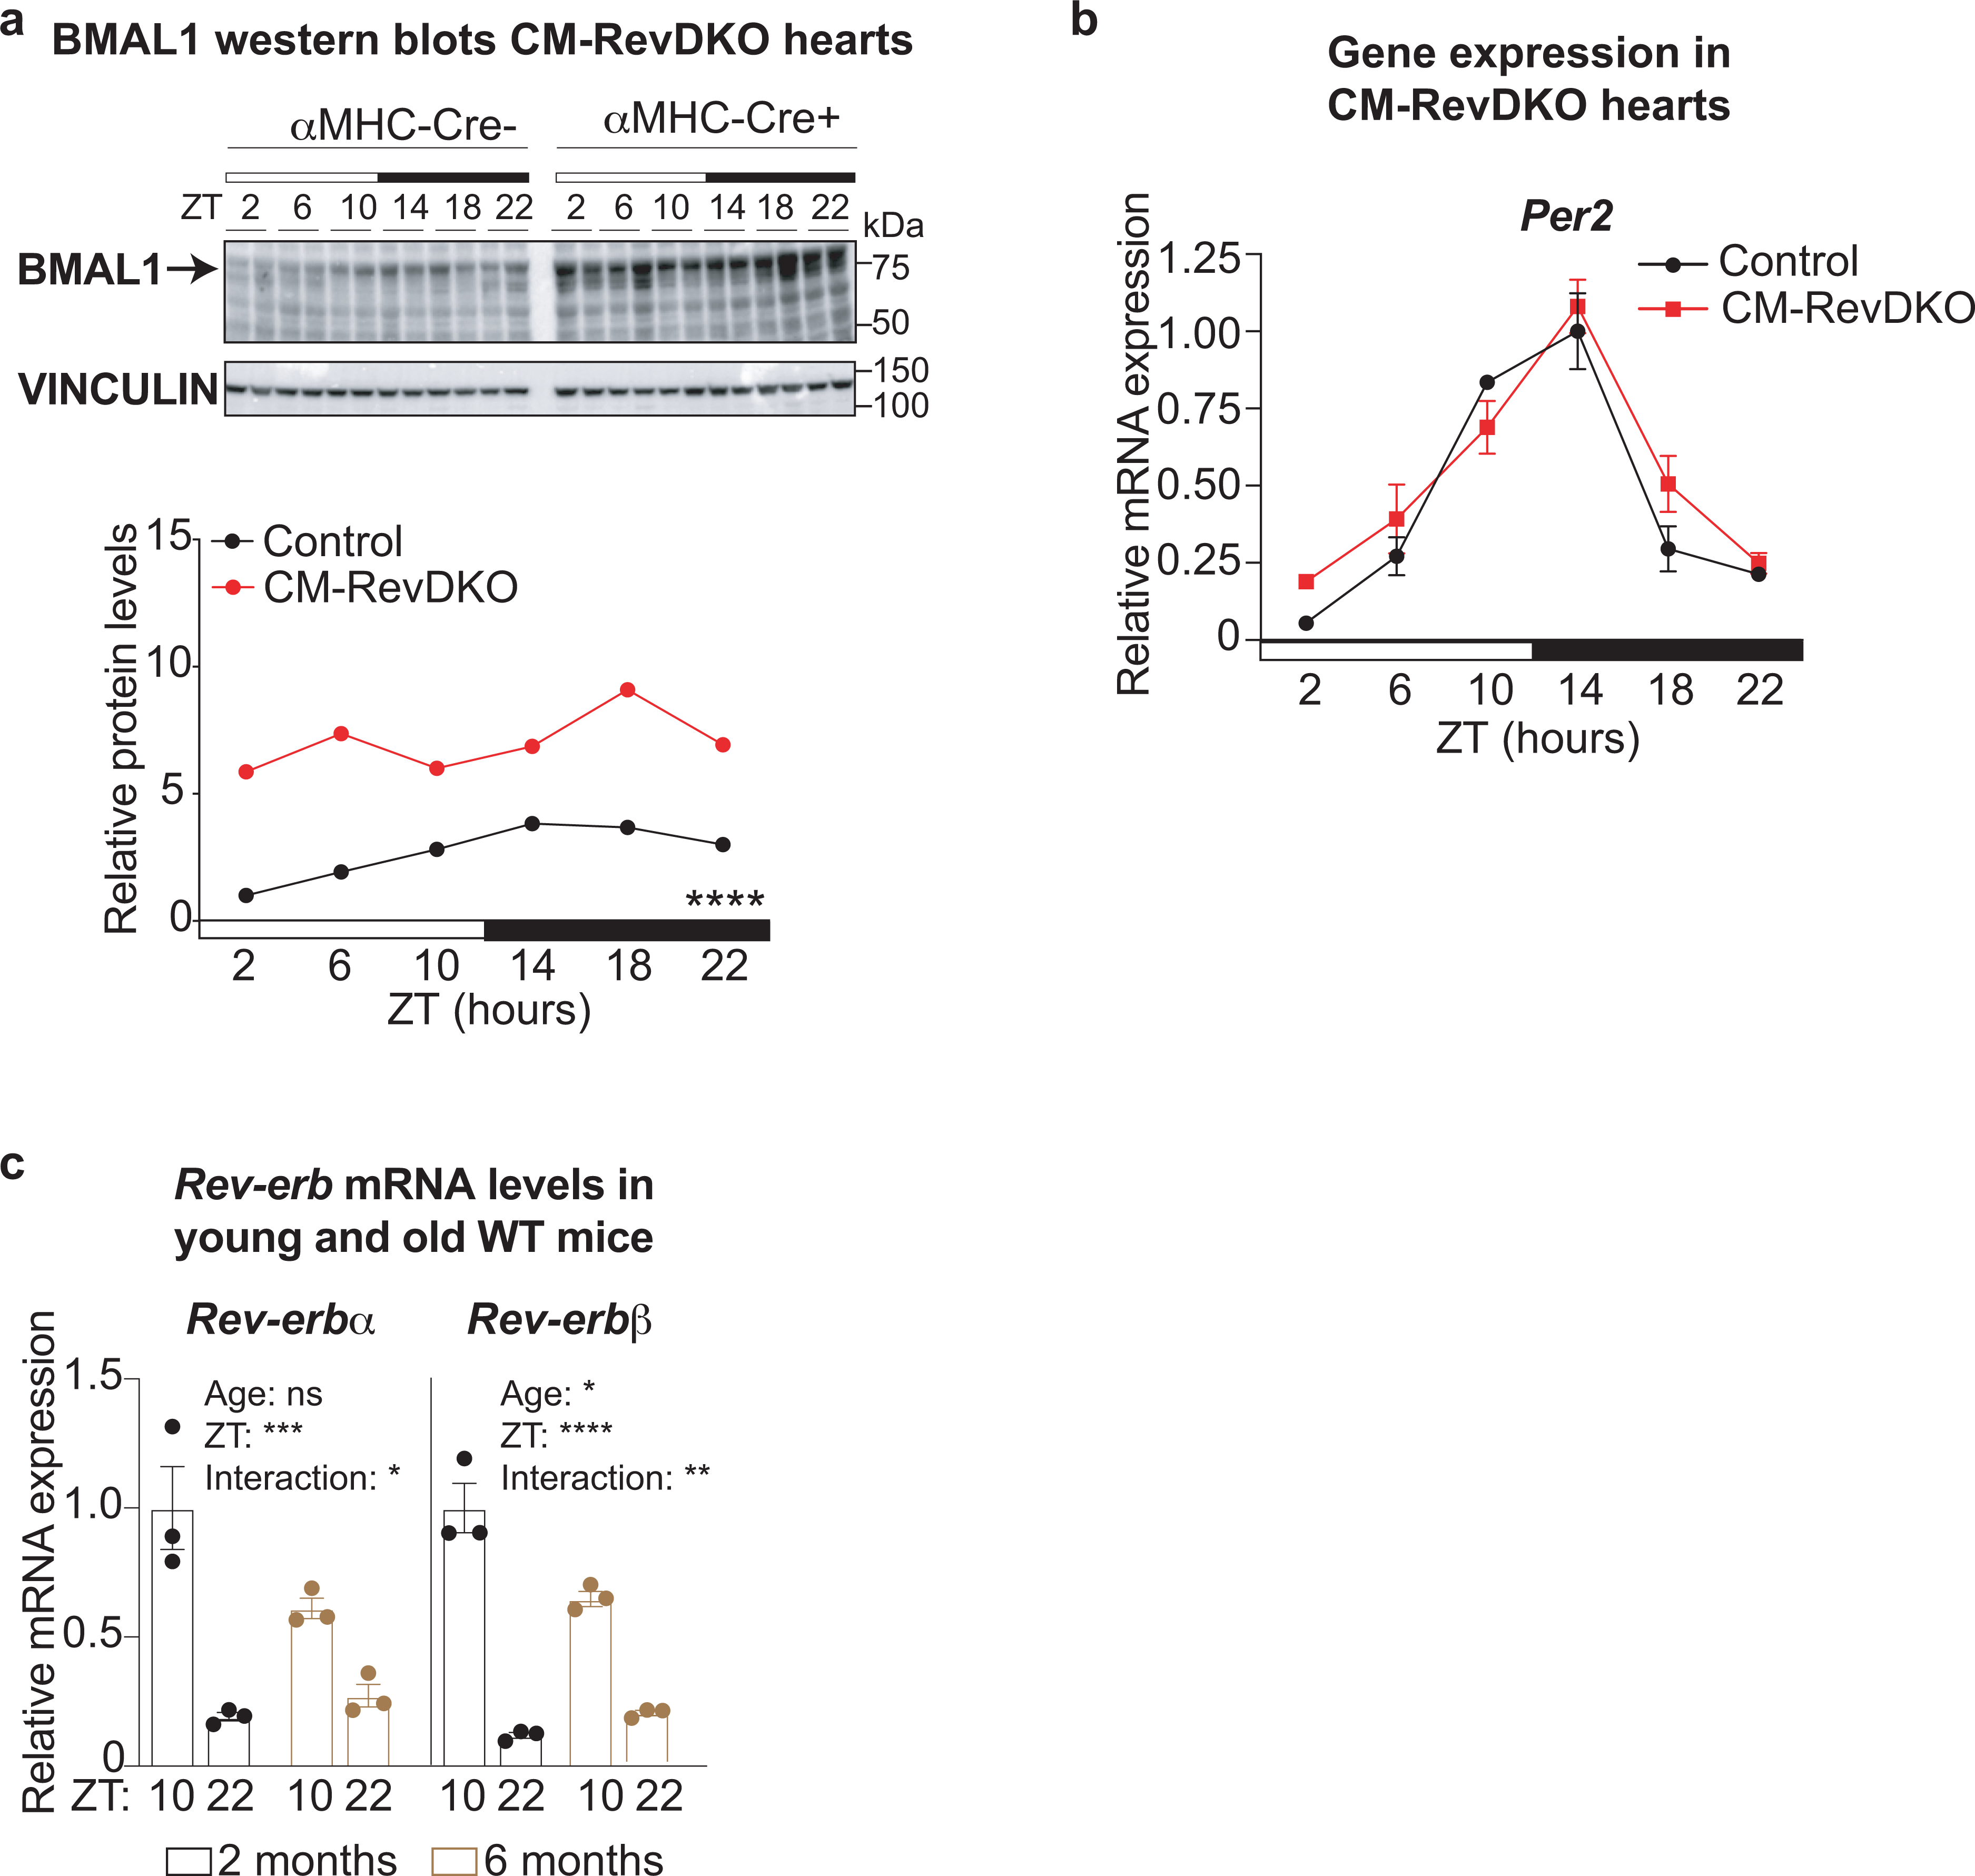
a, Immunoblot for BMAL1 with quantification from control (αMHC-Cre-) vs CM-RevDKO (αMHC-Cre+) hearts from 2-month-old male mice (n = 2/timepoint/genotype). b, Relative mRNA expression in control vs CM-RevDKO hearts from 2-month-old male mice (n = 3 hearts/genotype/timepoint except for n = 2 for ZT2 and n = 4 for ZT22 in CM-RevDKO) and c, young and old WT mice (n = 3/genotype). n represents biologically independent replicates. Data are presented as mean ± SEM, except for a. ns: non significant, * P <0.05, ** P <0.01, *** P <0.001, ****P < 0.0001, by 2-way ANOVA (exact P values are provided in the Source Data).
Extended Data Fig. 2. Age-dependent impairment of cardiac structure and function in CM-RevDKO mice.
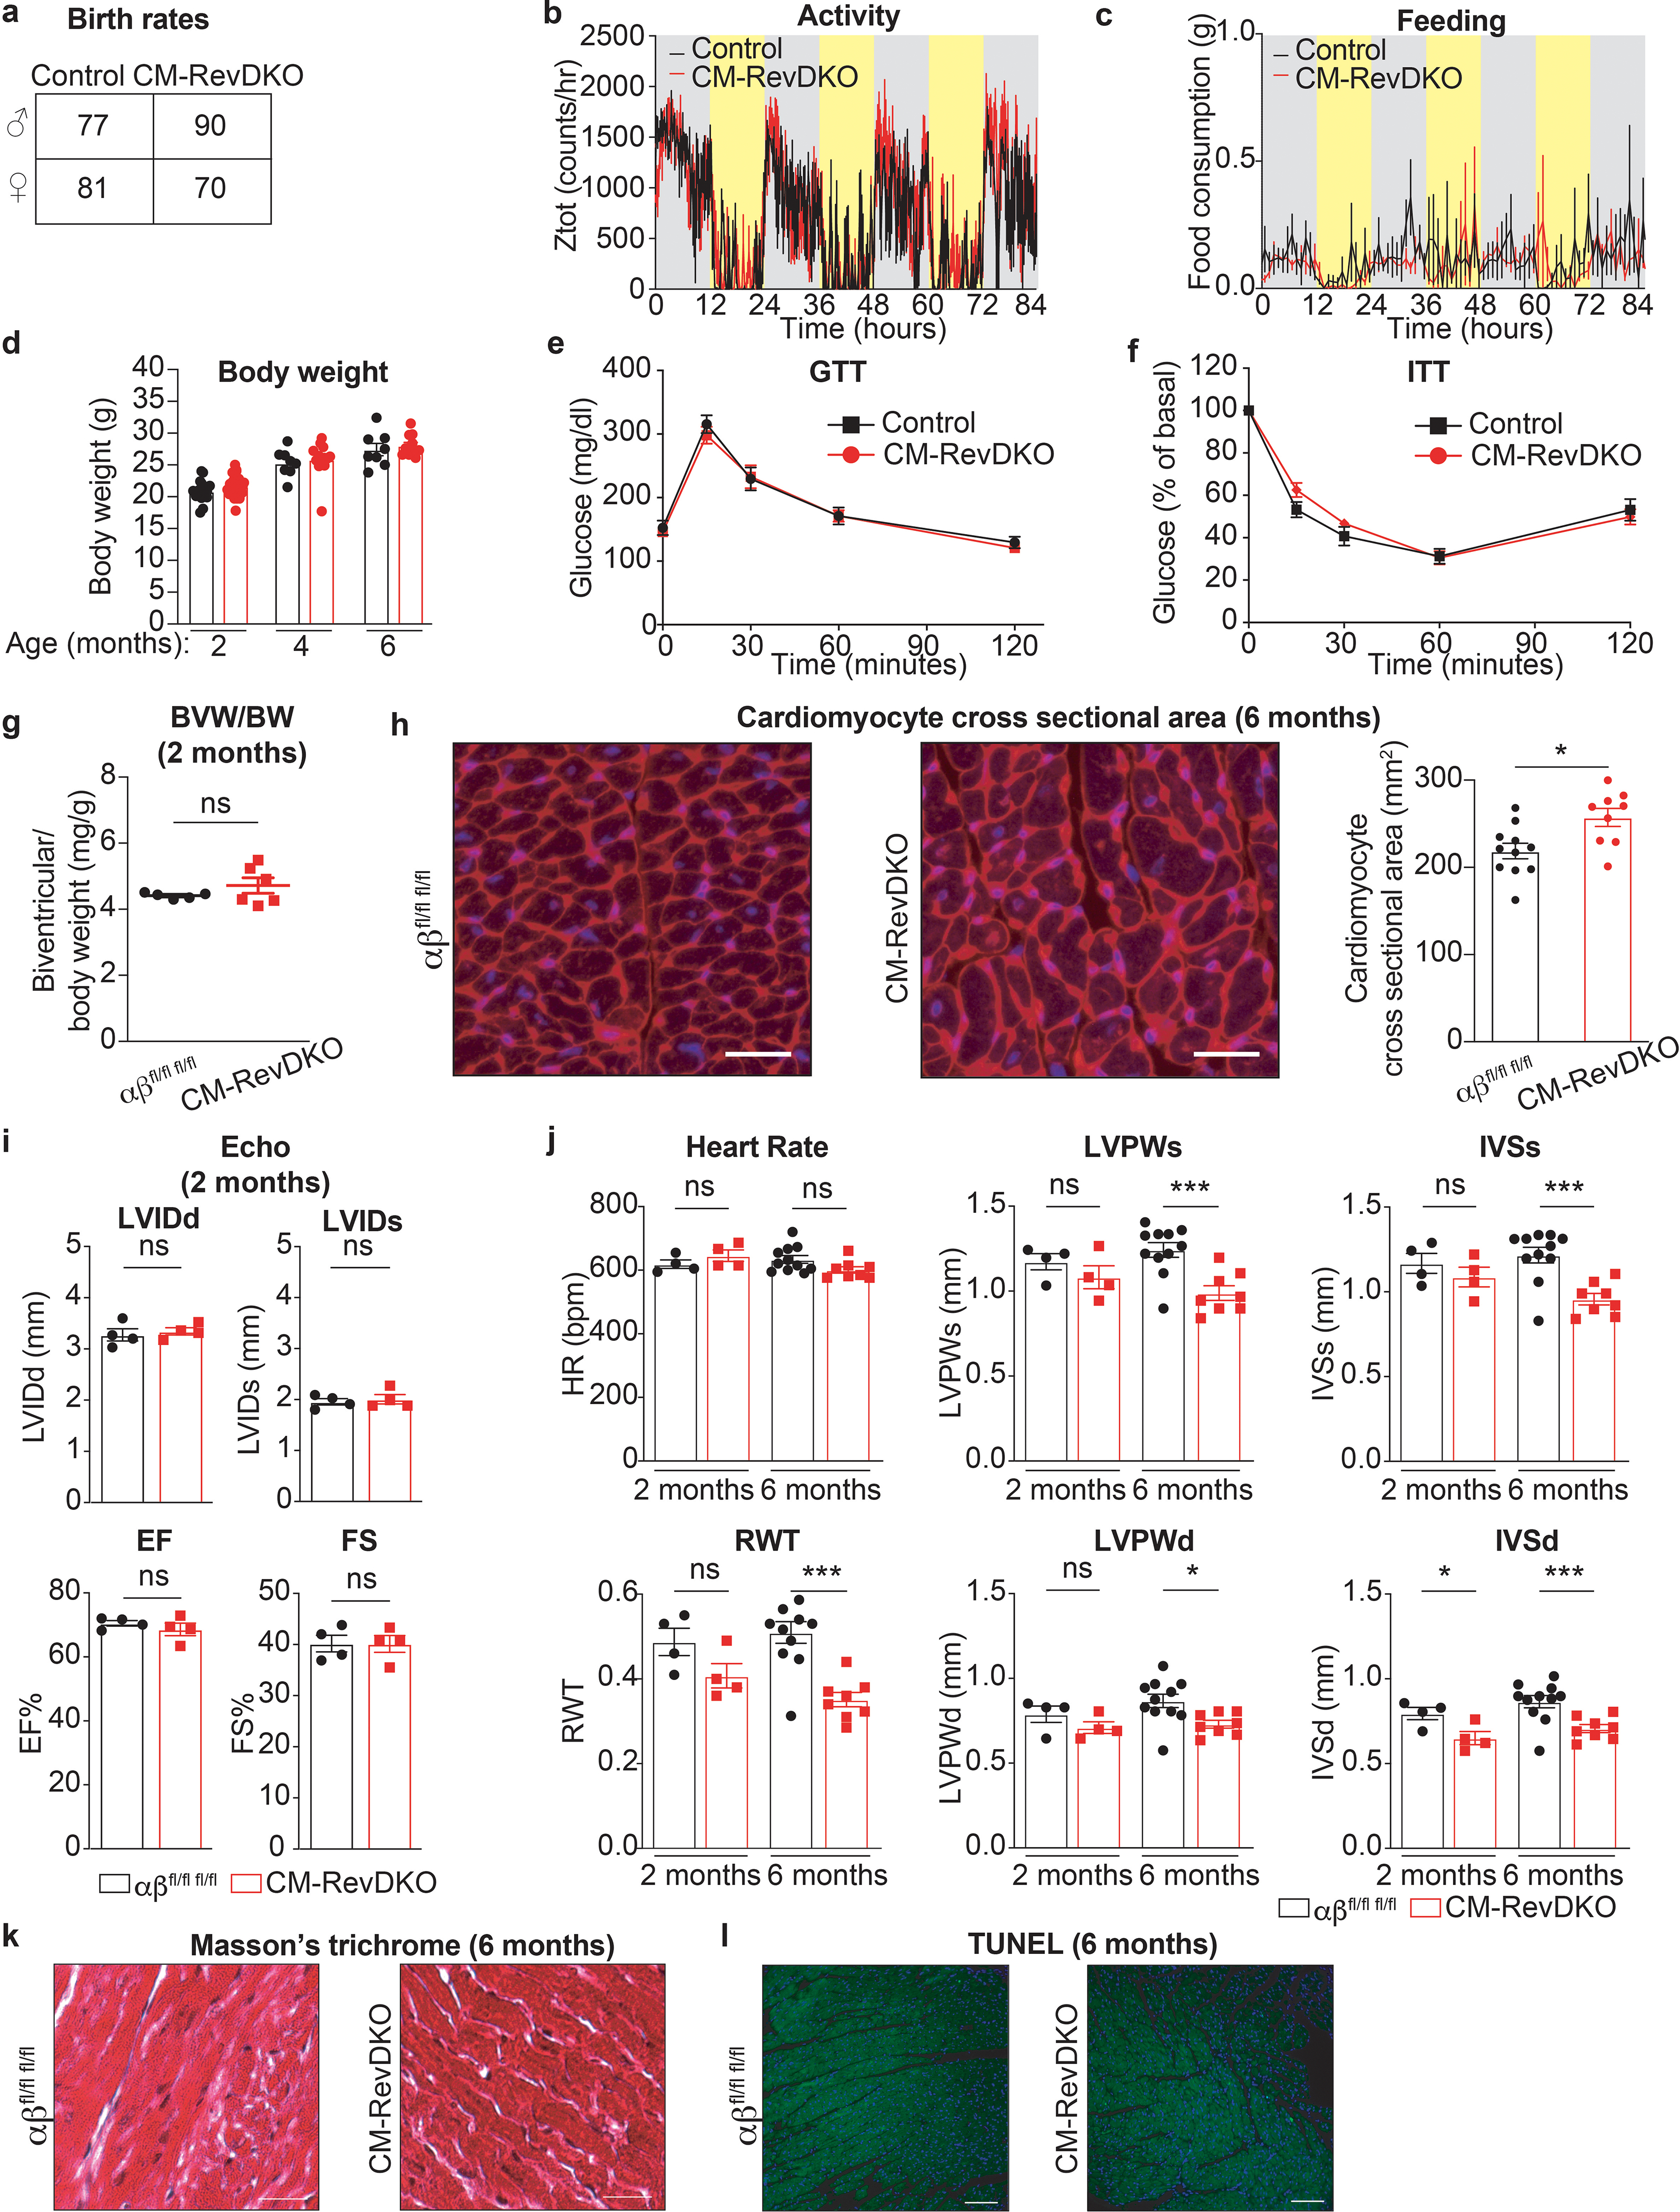
a, Birth rates for CM-RevDKO and littermate control animals. b, Locomotor activity and c, food consumption of 2-month-old male control (n = 3) and CM-RevDKO (n = 5) mice housed under 12:12 light:dark conditions. d, Body weight (in grams) of male control and CM-RevDKO mice at 2 (n = 17 for control and n = 34 for CM-RevDKO)-4 (n = 8 for control and n = 14 for CM-RevDKO)-6 (n = 8 for control and n = 11 for CM-RevDKO) months of age. e, Blood glucose concentrations of 6-months old male control (n = 6) and CM-RevDKO (n = 11) mice that underwent glucose tolerance test (GTT) and f, insulin tolerance test (ITT) (n=6 for control and n = 10 for CM-RevDKO). g, Biventricular to body weight (BVW/BW) ratios of from control (n = 5) and CM-RevDKO (n = 6) hearts. h, Cardiomyocyte size assesment of 6-month old control and CM-RevDKO hearts. Representative images (cardiac sarcolemma stained by WGA in red, nuclei by DAPI=blue) of 11 control and 9 CM-RevDKO hearts are shown. Scale bars, 50uM. i, Cardiac structure (LVIDd/s: Left ventricular internal diameter during diastole/systole) and function (EF: Ejection fraction and FS: Fractional shortening) data from 2-month-old control and CM-RevDKO mice obtained through echocardiagraphy (n = 4/genotype). j, Echocardiographic parameters from control vs CM-RevDKO mice age 2 months (n=4/genotype) versus 6 months (n = 11 for control and n = 8 for CM-RevDKO). (HR) Heart rate; (LVPWs/d) Left ventricular posterior wall during systole/diastole; (IVSs/d) Interventricular septum thickness during systole/diastole; (RWT) Relative wall thickness. k, Masson’s trichrome and l, TUNEL staining (green) on hearts of 6-month-old control and CM-RevDKO mice. Nuclei are stained with DAPI (blue). Representative images of n = 11 hearts for control and n = 9 hearts for CM-RevDKO are shown. Scale bars, (k) 50μM and (l), 100μM. n represents biologically independent replicates unless otherwise indicated. Data are presented as mean ± SEM. ns: non significant, *P < 0.05, ***P < 0.001, by 2-sided Student’s t test (exact P values are provided in the Source Data).
Extended Data Fig. 3. CM-RevDKO causes tissue specific deregulated expression of circadian genes.
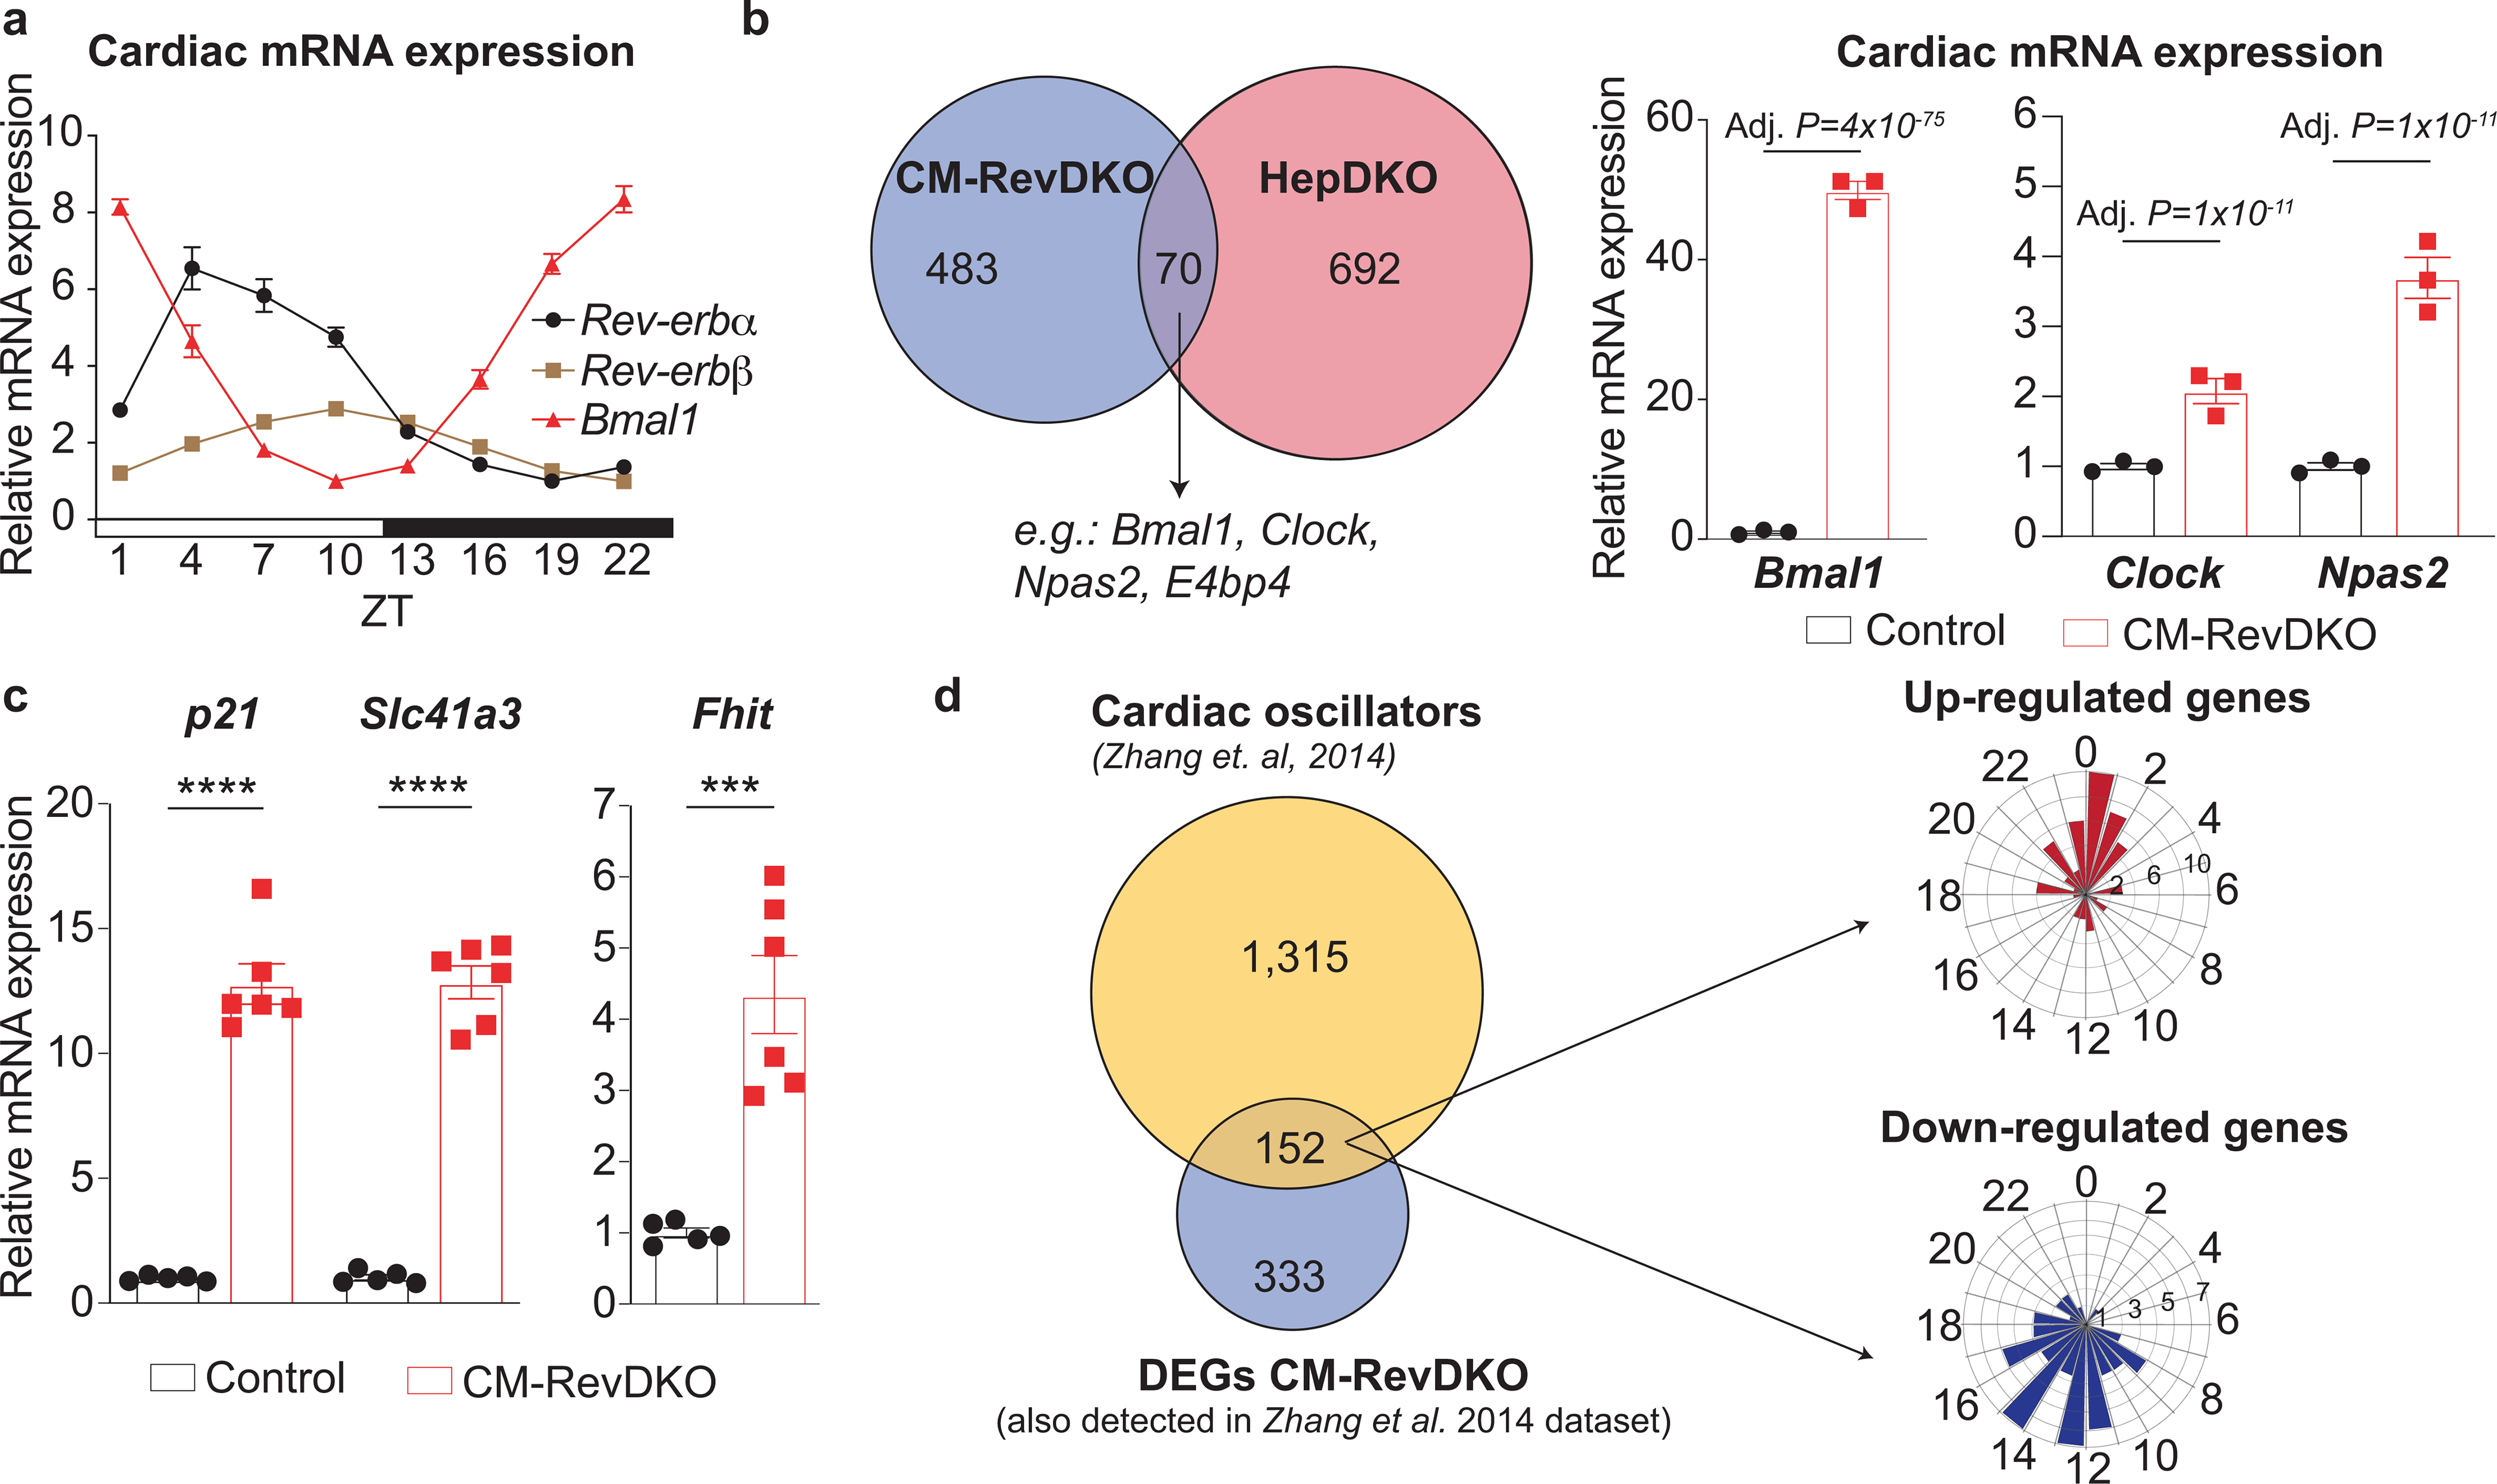
a, Circadian Rev-erbα/β and Bmal1 mRNA expression in 2-month-old male control hearts (n = 5 timepoint, except for ZT7, n = 4 and ZT10, n = 6). b, Left: Venn diagram showing overlap between DEGs in CM-RevDKO hearts and hepatocyte-specific Rev-erb DKO (HepDKO) livers22 (at ZT10). Right: relative mRNA expression of commonly (in both CM-RevDKO and Hep-RevDKO) deregulated clock genes in CM-RevDKO vs control hearts (n=3 hearts/genotype, harvested at ZT10). c, qRT-PCR validation of genes derepressed upon CM-RevDKO in the heart of 2-month-old male mice (n = 5 for control and n = 6 for CM-RevDKO). d, Left: Venn diagram showing overlap between cardiac oscillators published in24 and all DEGs in CM-RevDKO that were assessed in24. Right: phase plots of rhythmic, differentially expressed genes identified on the left. n represents biologically independent replicates. Data are presented as mean ± SEM. Adj. P values in b were calculated by DESeq2. ***P < 0.001, ****P < 0.0001, by 2-sided Student’s t test (exact P values are provided in the Source Data).
Extended Data Fig. 4. Mitochondrial size is affected in CM-RevDKO cardiomyocytes.
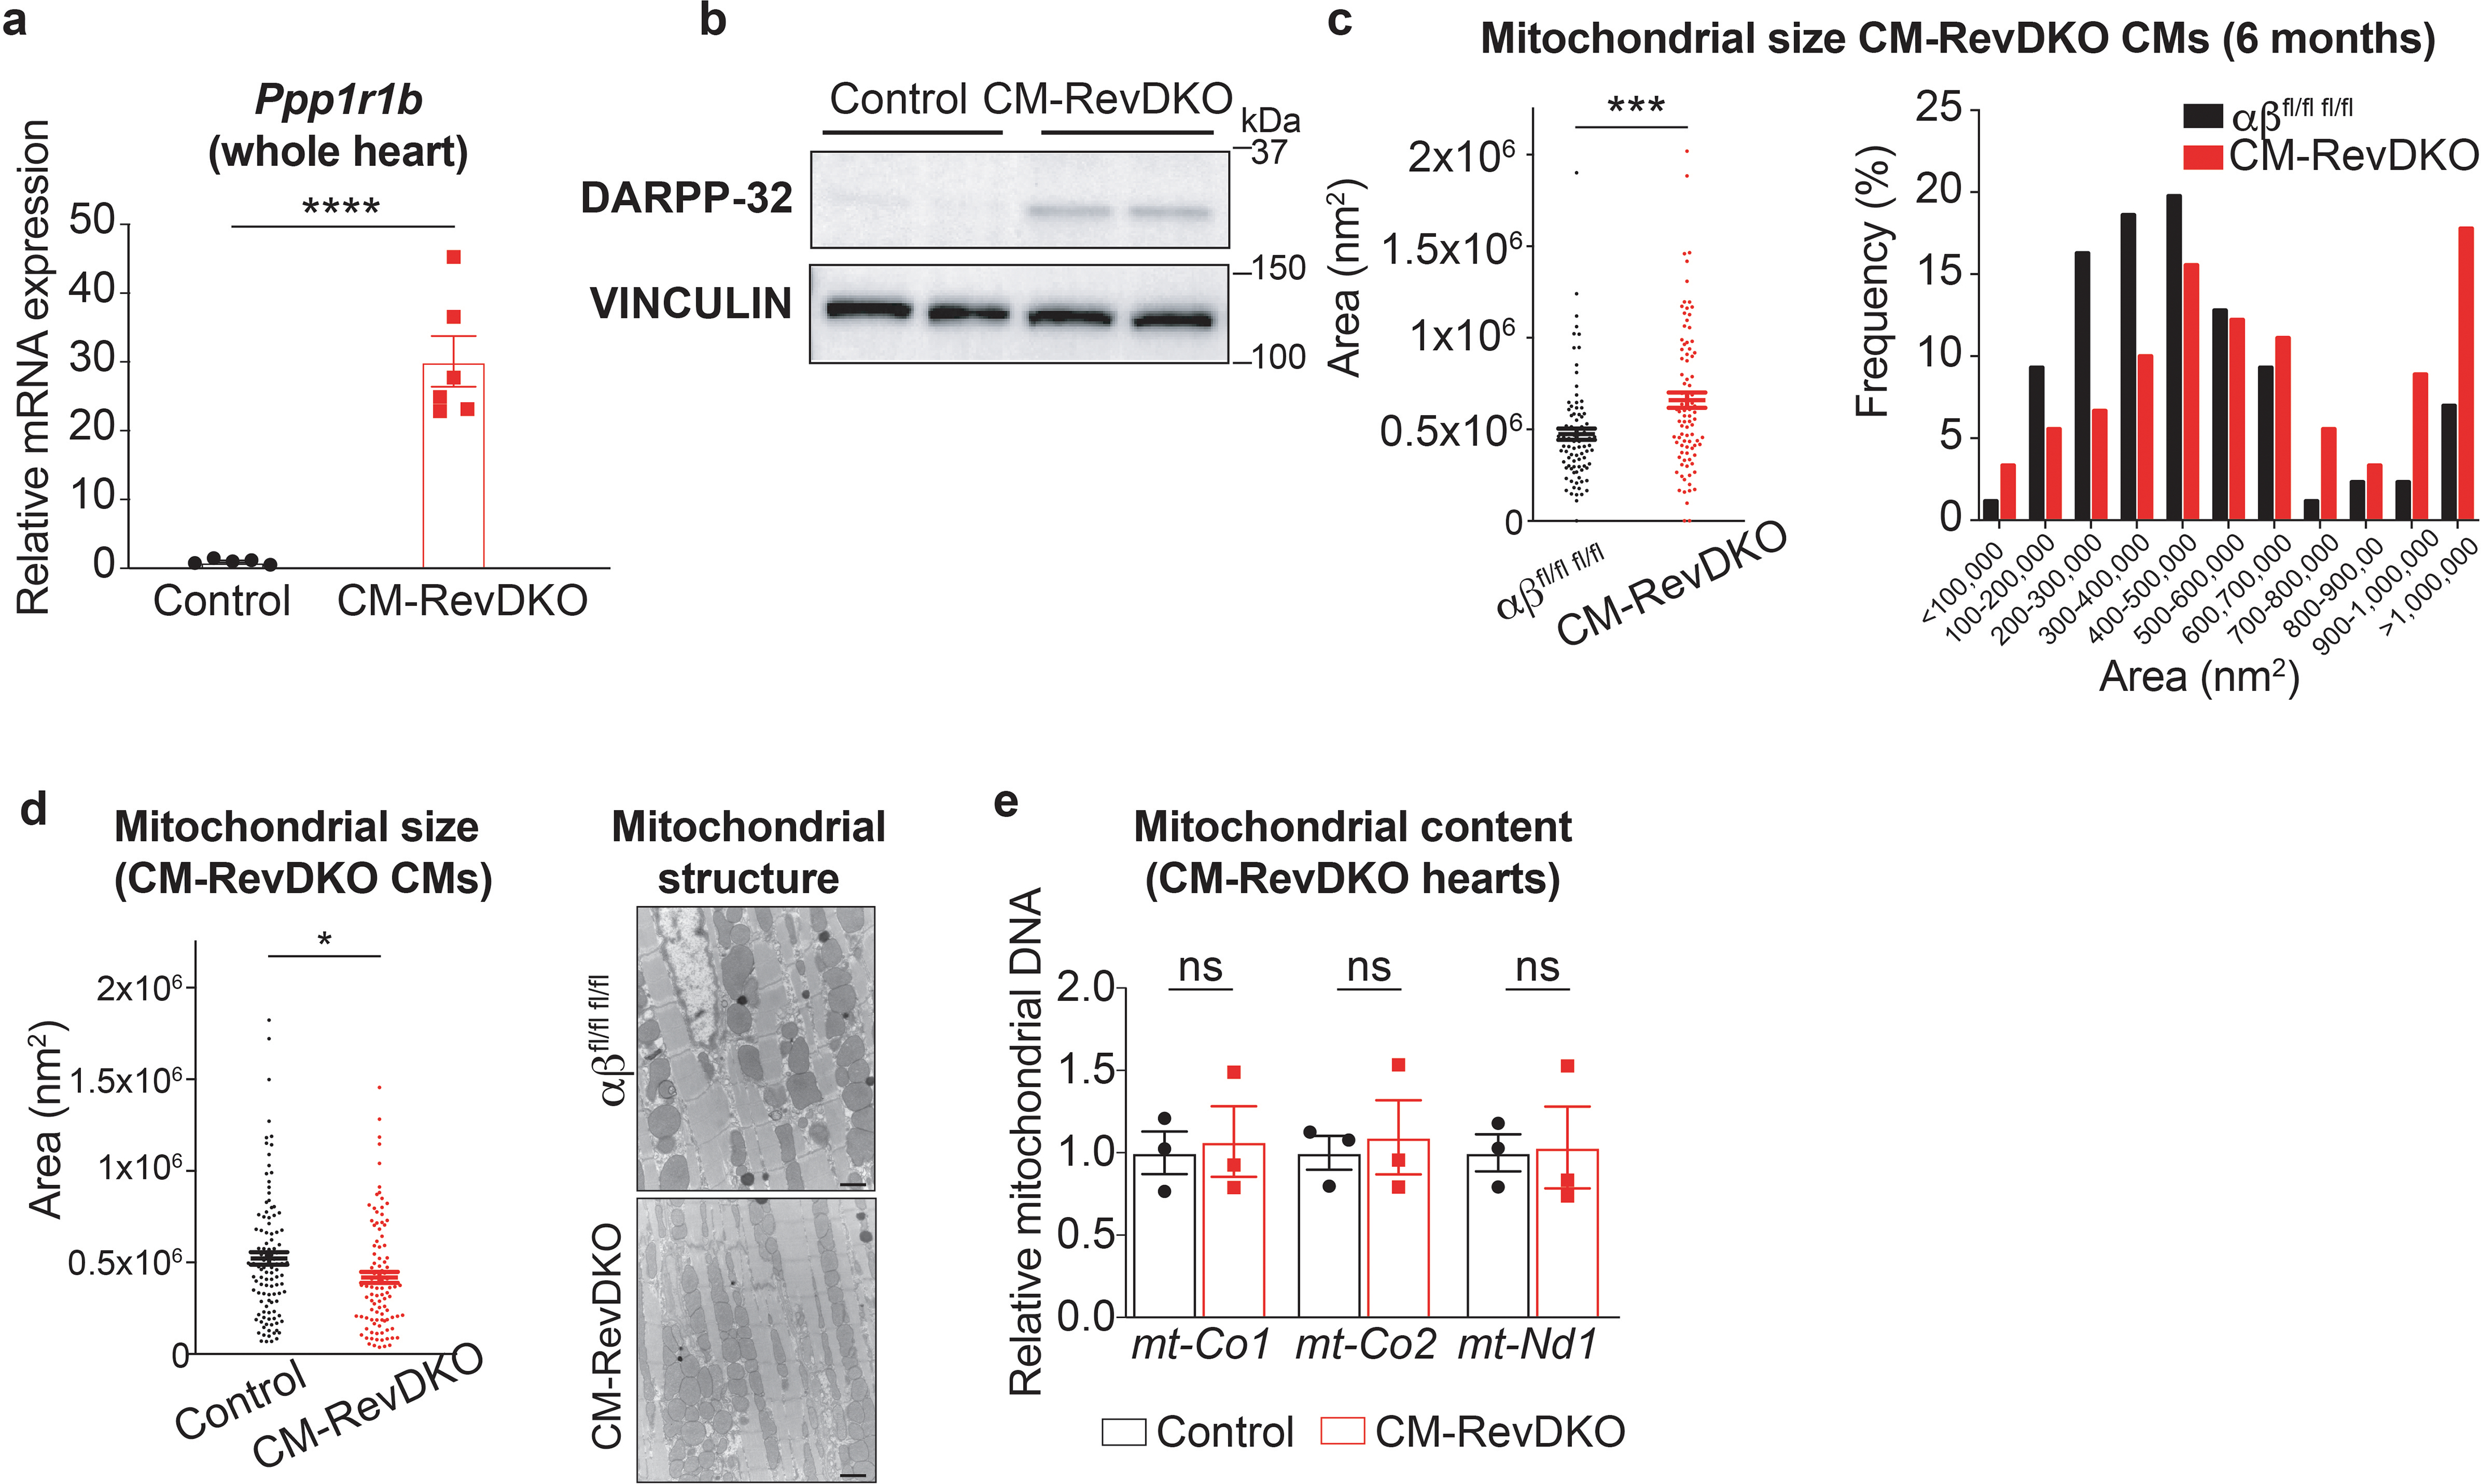
a, Relative Ppp1r1b mRNA expression in CM-RevDKO (n = 6) vs control (n = 5) hearts from 2-month-old male mice. b, Immunoblot for DARPP-32 in CM-RevDKO vs control hearts. c, Scatter plot and histogram of mitochondria area for ventricular CMs in control and CM-RevDKO hearts from 6-month-old male mice based on electron microscopy images (n = 86 mitochondria for control, measured from 5 images, n = 90 mitochondria for CM-RevDKO, measured from 7 images). d, Left: scatter plot of mitochondria area for ventricular CMs in control and CM-RevDKO hearts from 2-month-old mice. Right: Electron micrographs of ventricular tissue from control and CM-RevDKO hearts at 2 months (n = 108 mitochondria for control, measured from 7 images, n=100 mitochondria for CM-RevDKO, measured from 9 images). Scale bars, 1μM. e, Relative levels of mitochondrial DNA quantified by qRT-PCR. mtCo1/2 and mtNd1 levels were normalized to nuclear genomic βActin (n=3/genotype). n represents biologically independent replicates unless otherwise indicated. Data are presented as mean ± SEM. ns: non significant, *P < 0.05, ***P < 0.001, ****P < 0.0001, by 2-sided Student’s t test (exact P values are provided in the Source Data)
Extended Data Fig. 5. Characterization of the 3xHA-REV-ERBα cistrome in the heart.
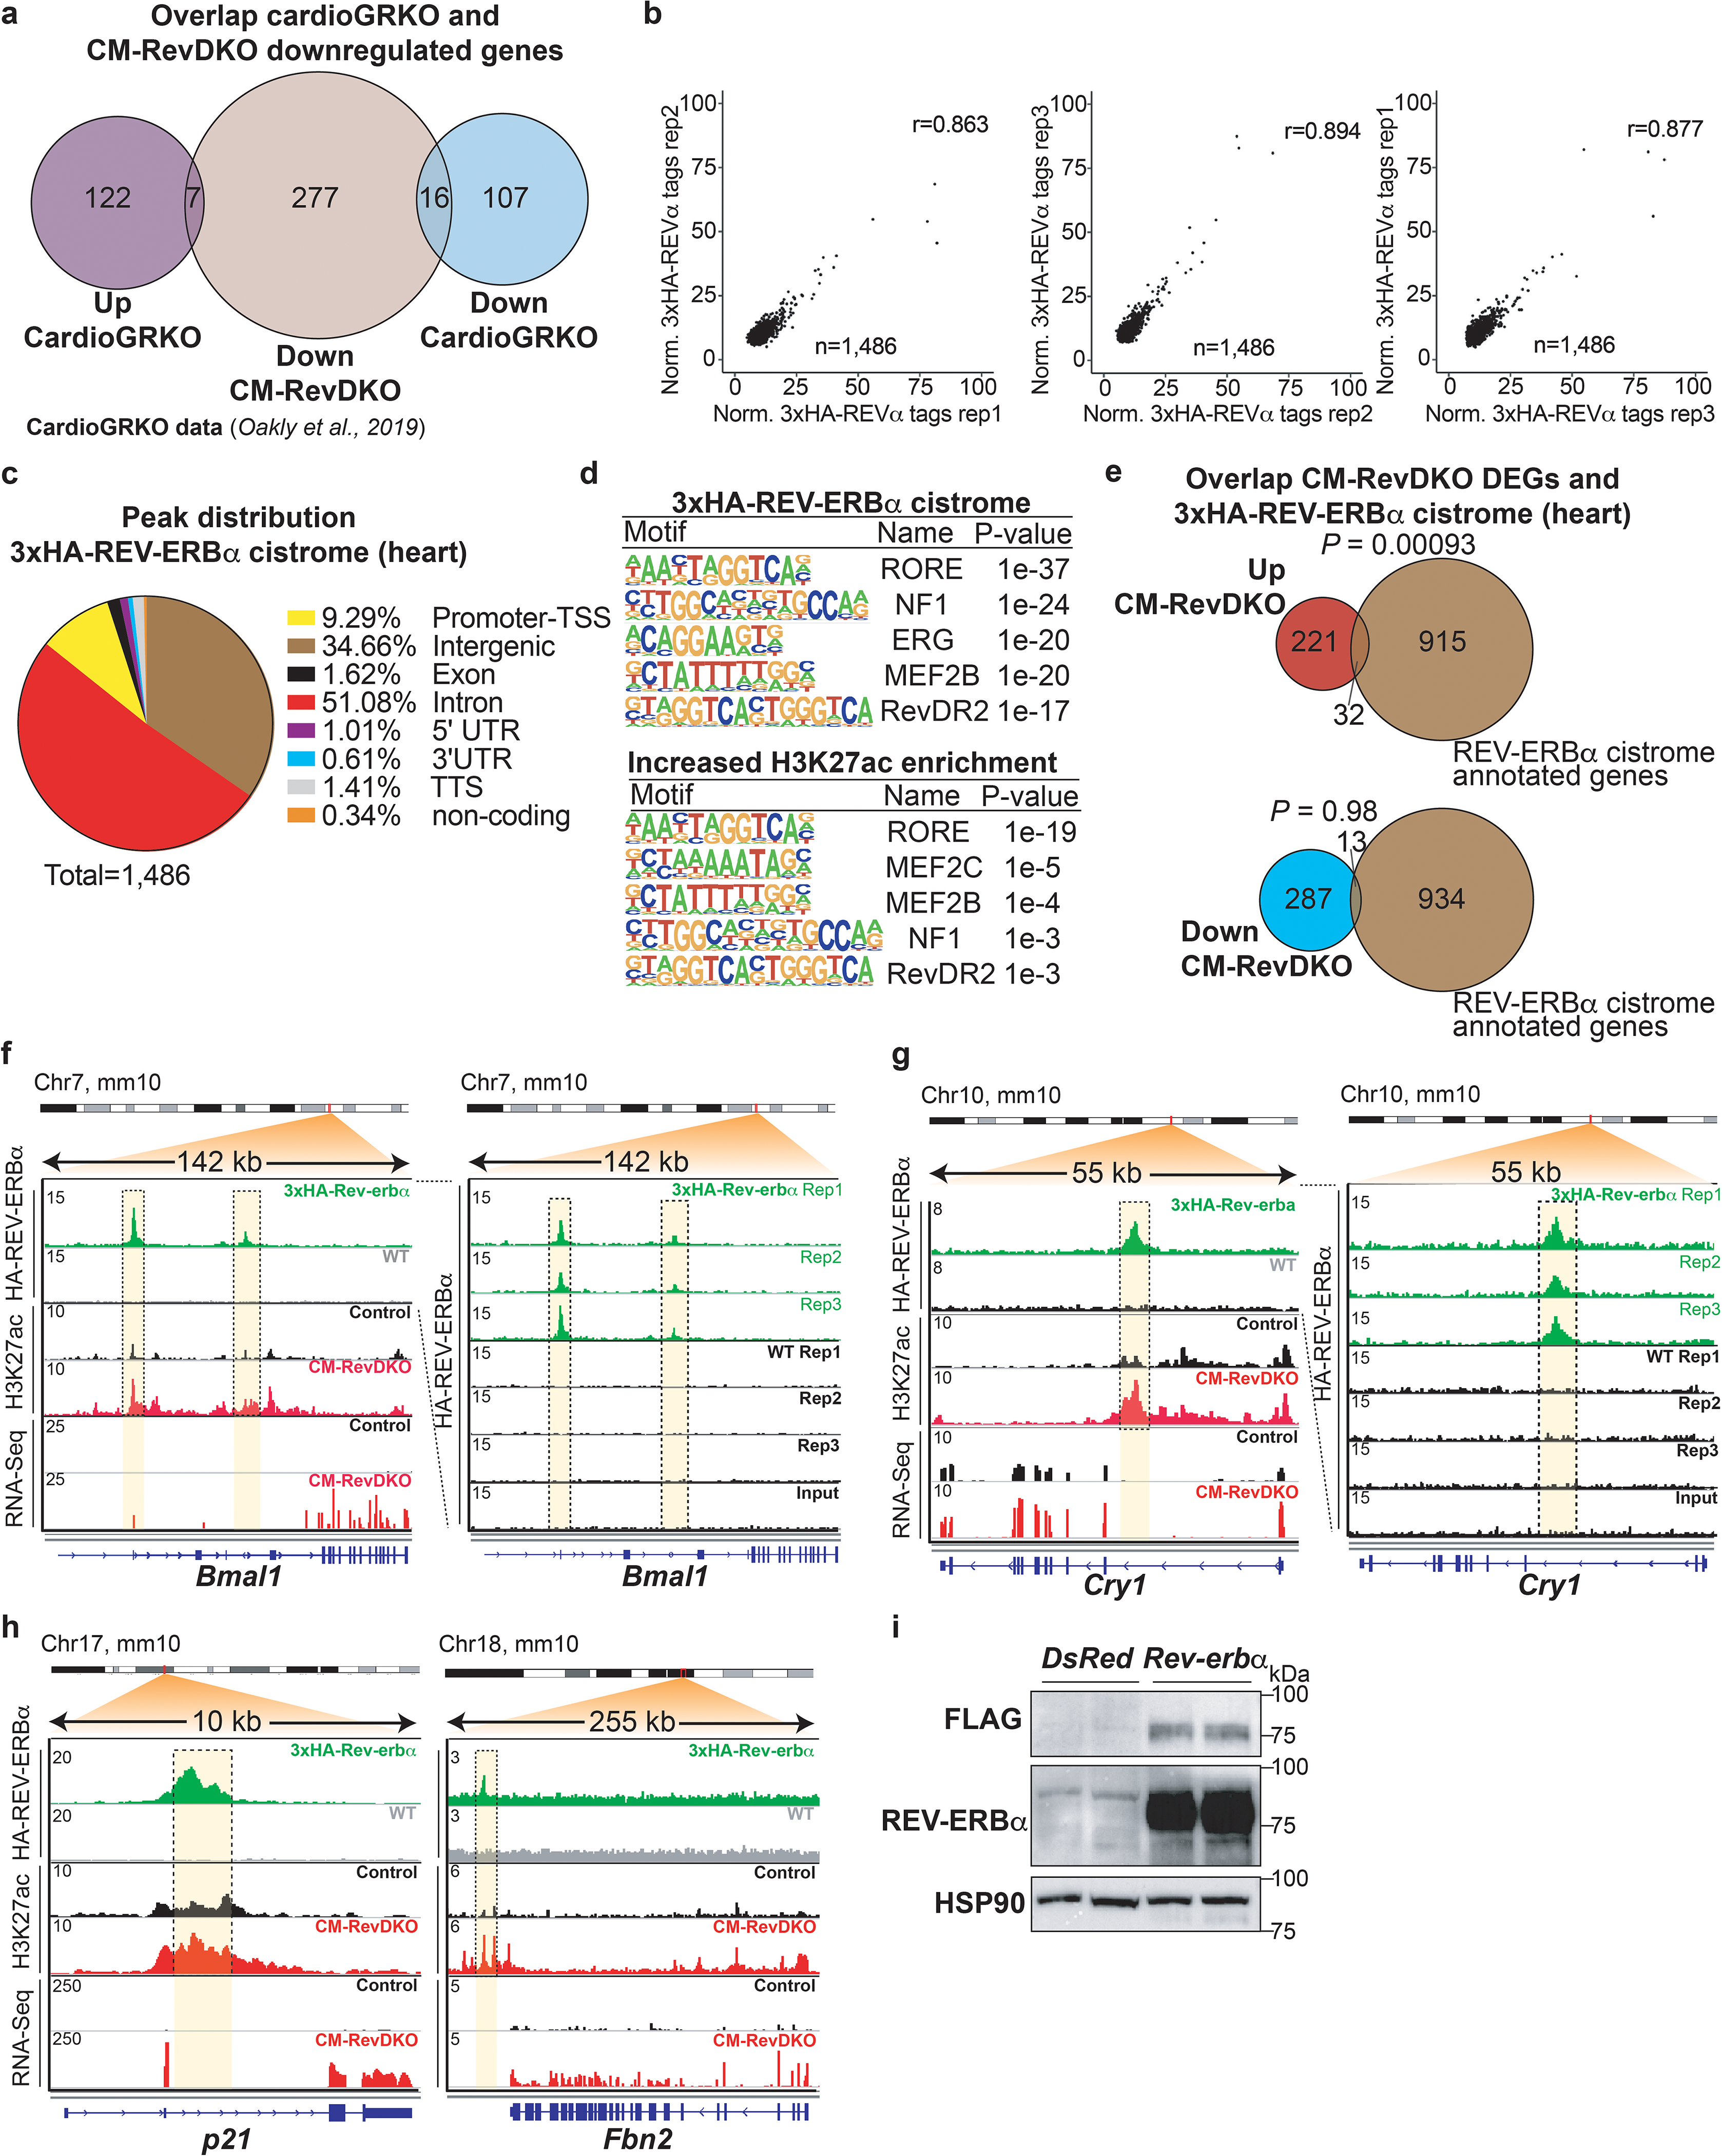
a, Venn diagram showing the overlap between the downregulated differentially expressed genes (DEGs) in CM-RevDKO hearts and up/downregulated genes in cardiomyocyte-specific glucocorticoid receptor (GR) KO hearts32. b, Pearson correlation plots comparing 3xHA ChIP-Seq replicate samples. c, Pie chart of annotated cardiac 3xHA-REV-ERBα ChIP-Seq peaks. d, Results of motif search at 3xHA-REV-ERBα ChIP-Seq peaks and enhancers that displayed increased H3K27ac Cut&Run signal (FC > 2) in CM-RevDKO vs control cardiomyocytes as reported by HOMER. e, Venn diagram showing overlap between DEGs in CM-RevDKO vs control hearts and annotated peaks from the cardiac 3xHA-REV-ERBα cistrome (at ZT10). f, ChIP-Seq, Cut&Run and RNA-Seq read distribution for REV-ERBα and H3K27ac near derepressed REV-ERBα canonical target genes Bmal1 and g, Cry1 and h, output genes p21 and Fbn2. i, Immunoblot and quantification for FLAG and REV-ERBα from DsRed (control) vs FLAG-Rev-erbα overexpressing plasmid transfected C2C12 cells (n = 2 independently transfected wells/condition). Significance of overlap in d is calculated via a hypergeometric test without multiple testing correction.
Extended Data Fig. 6. E4BP4-based repression is a unifying mechanism to explain transcriptional changes and cardiomyopathy common to the cardiac-specific loss of BMAL1 or REV-ERBs.
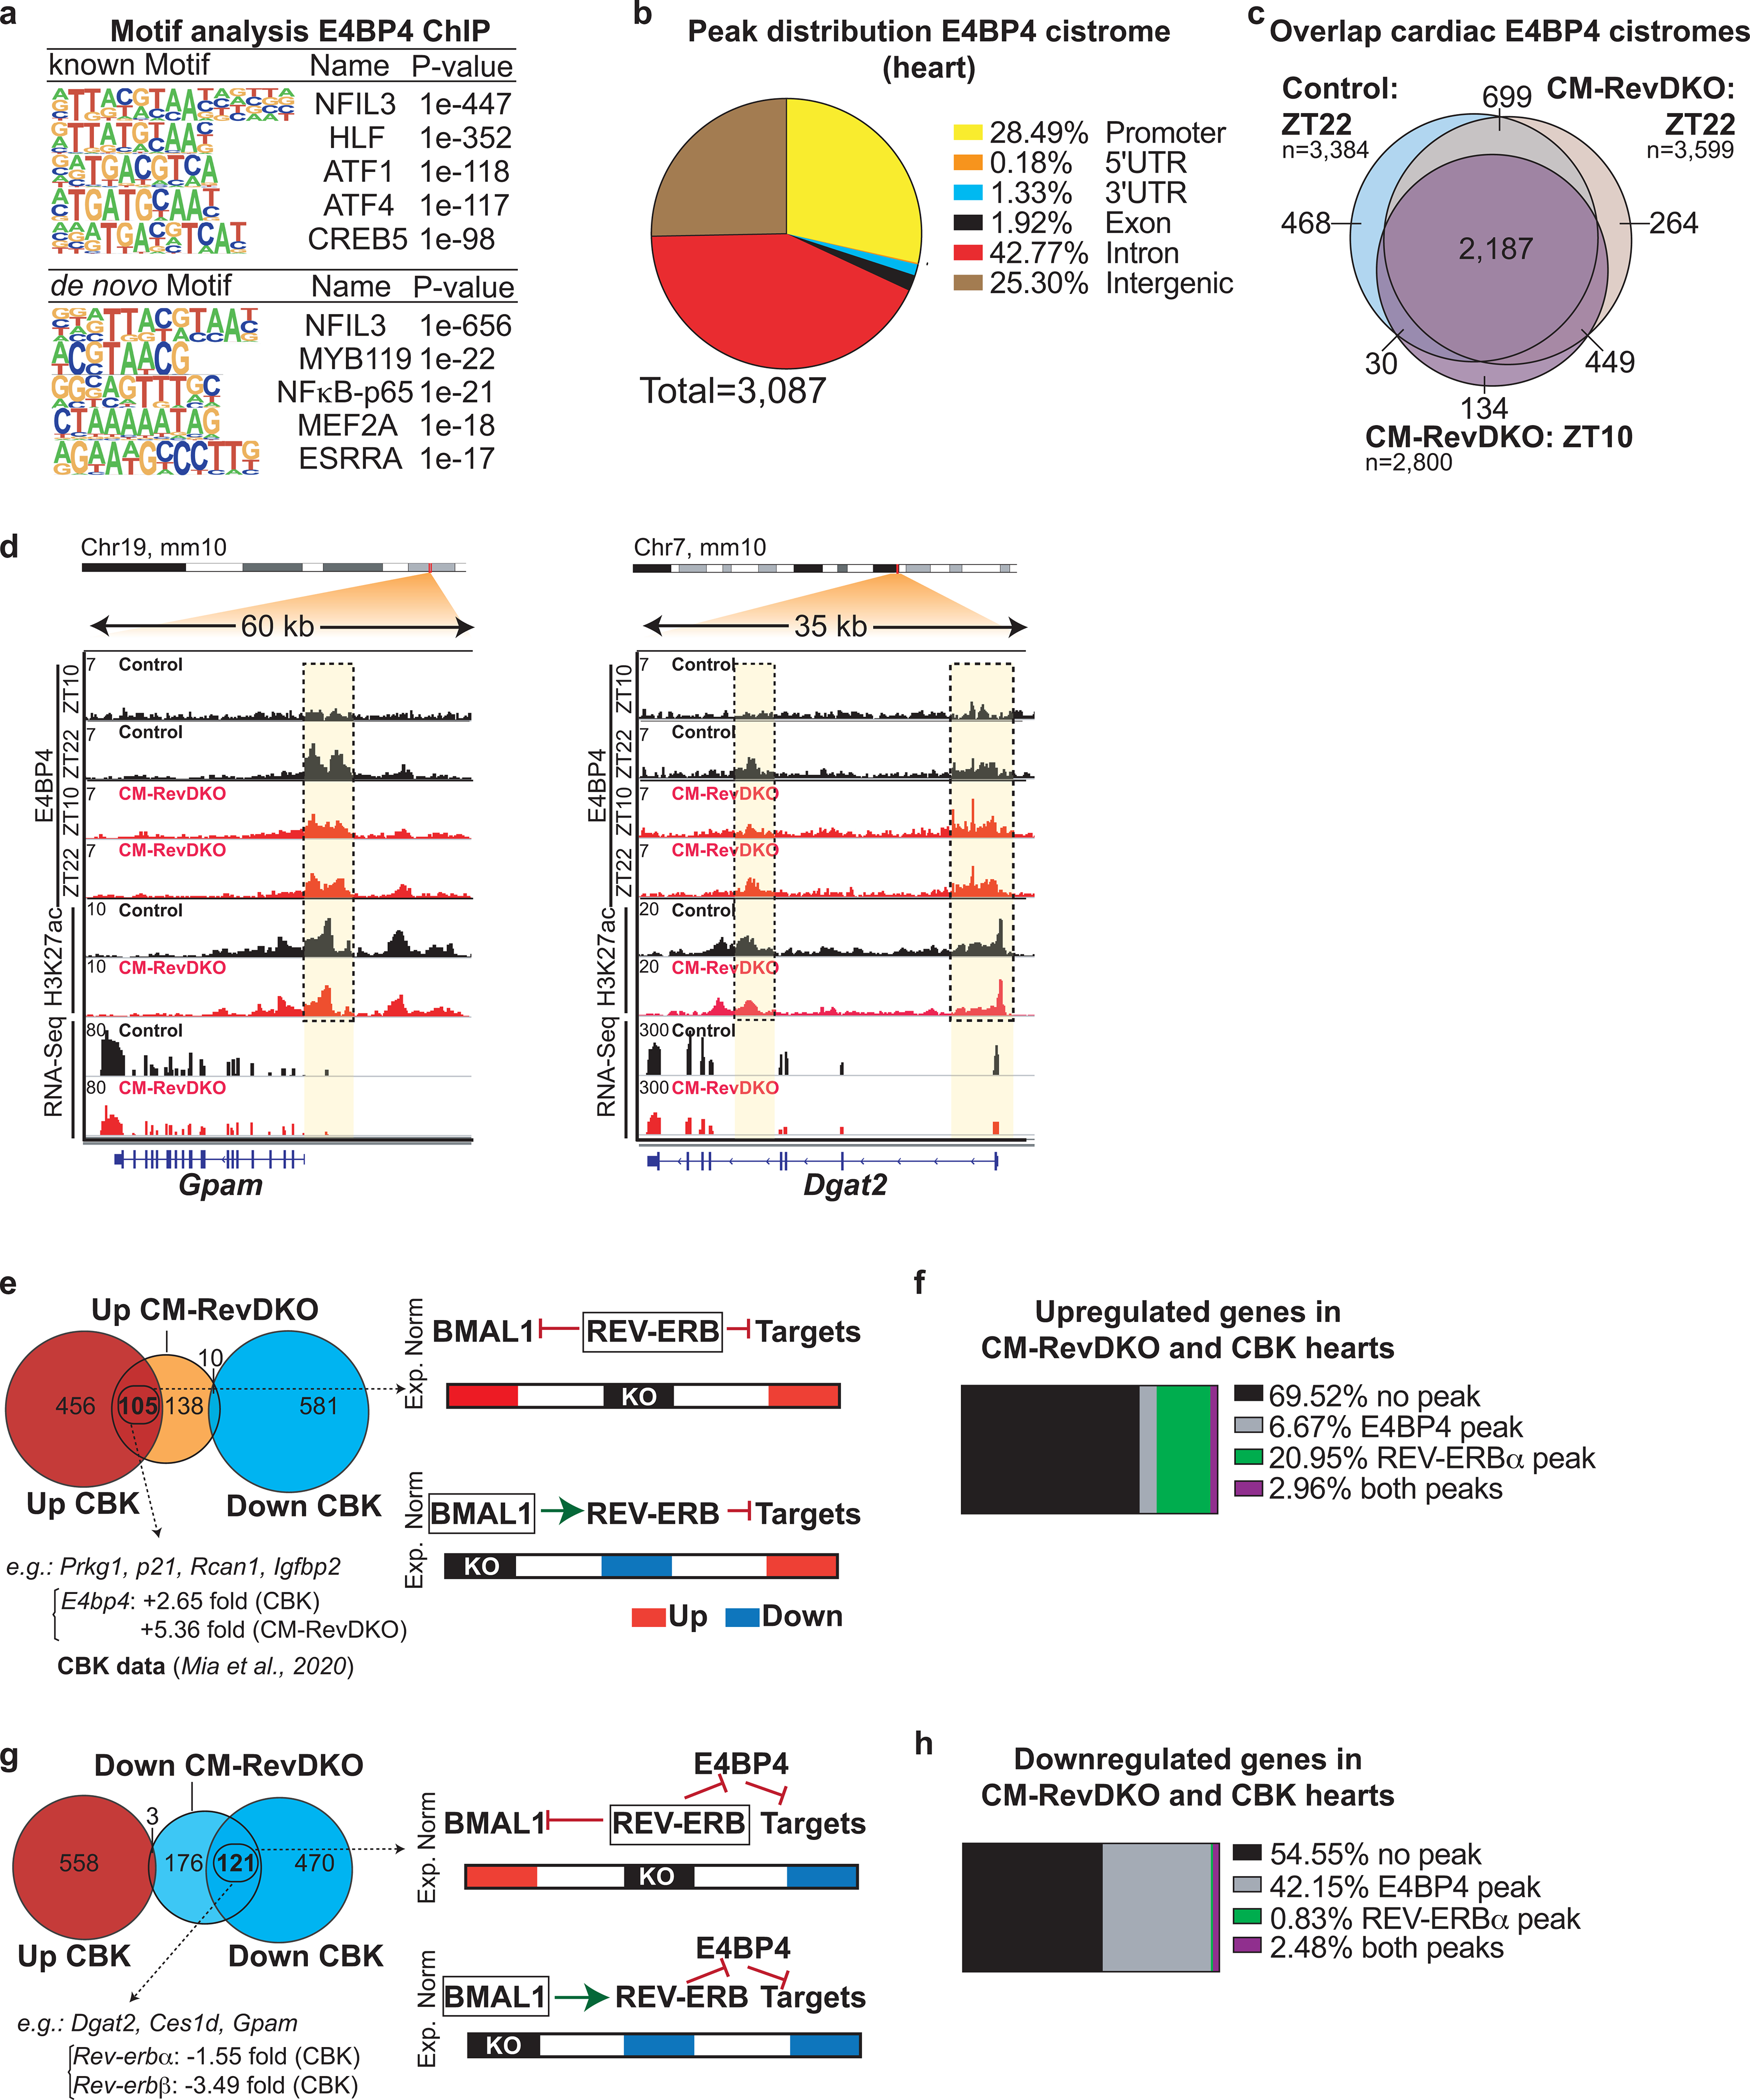
a, Results of motif search at cardiac E4BP4 ChIP-Seq peaks (Control at ZT22) as reported by HOMER. b, Pie chart of annotated cardiac E4BP4 ChIP-Seq peaks (control ZT22). c, Venn diagram showing overlap between annotated peaks from the cardiac control (at ZT22) and CM-RevDKO (at ZT10 and ZT22) E4BP4 cistromes. d, ChIP-Seq, Cut&Run and RNA-Seq read distribution for E4BP4 and H3K27ac near identified E4BP4 target genes in control and CM-RevDKO hearts. e, Overlap between upregulated and g, downregulated genes in CM-RevDKO hearts and cardiomyocyte-specific Bmal1 KO (CBK) hearts. Proposed models for normal (Norm) and experimental (Exp.) conditions are depicted on the right. f, Overlap between commonly upregulated and h, downregulated genes in CBK/CM-RevDKO hearts (identified in e and g respectively) and cardiac REV-ERBα/E4BP4 cistromes. CBK data in (e,f,g,h) was obtained from35.
Extended Data Fig. 7. Deletion of Rev-erbs in cardiomyocytes derepresses key metabolic regulators leading to mitochondrial abnormalities and loss of normal heart function.
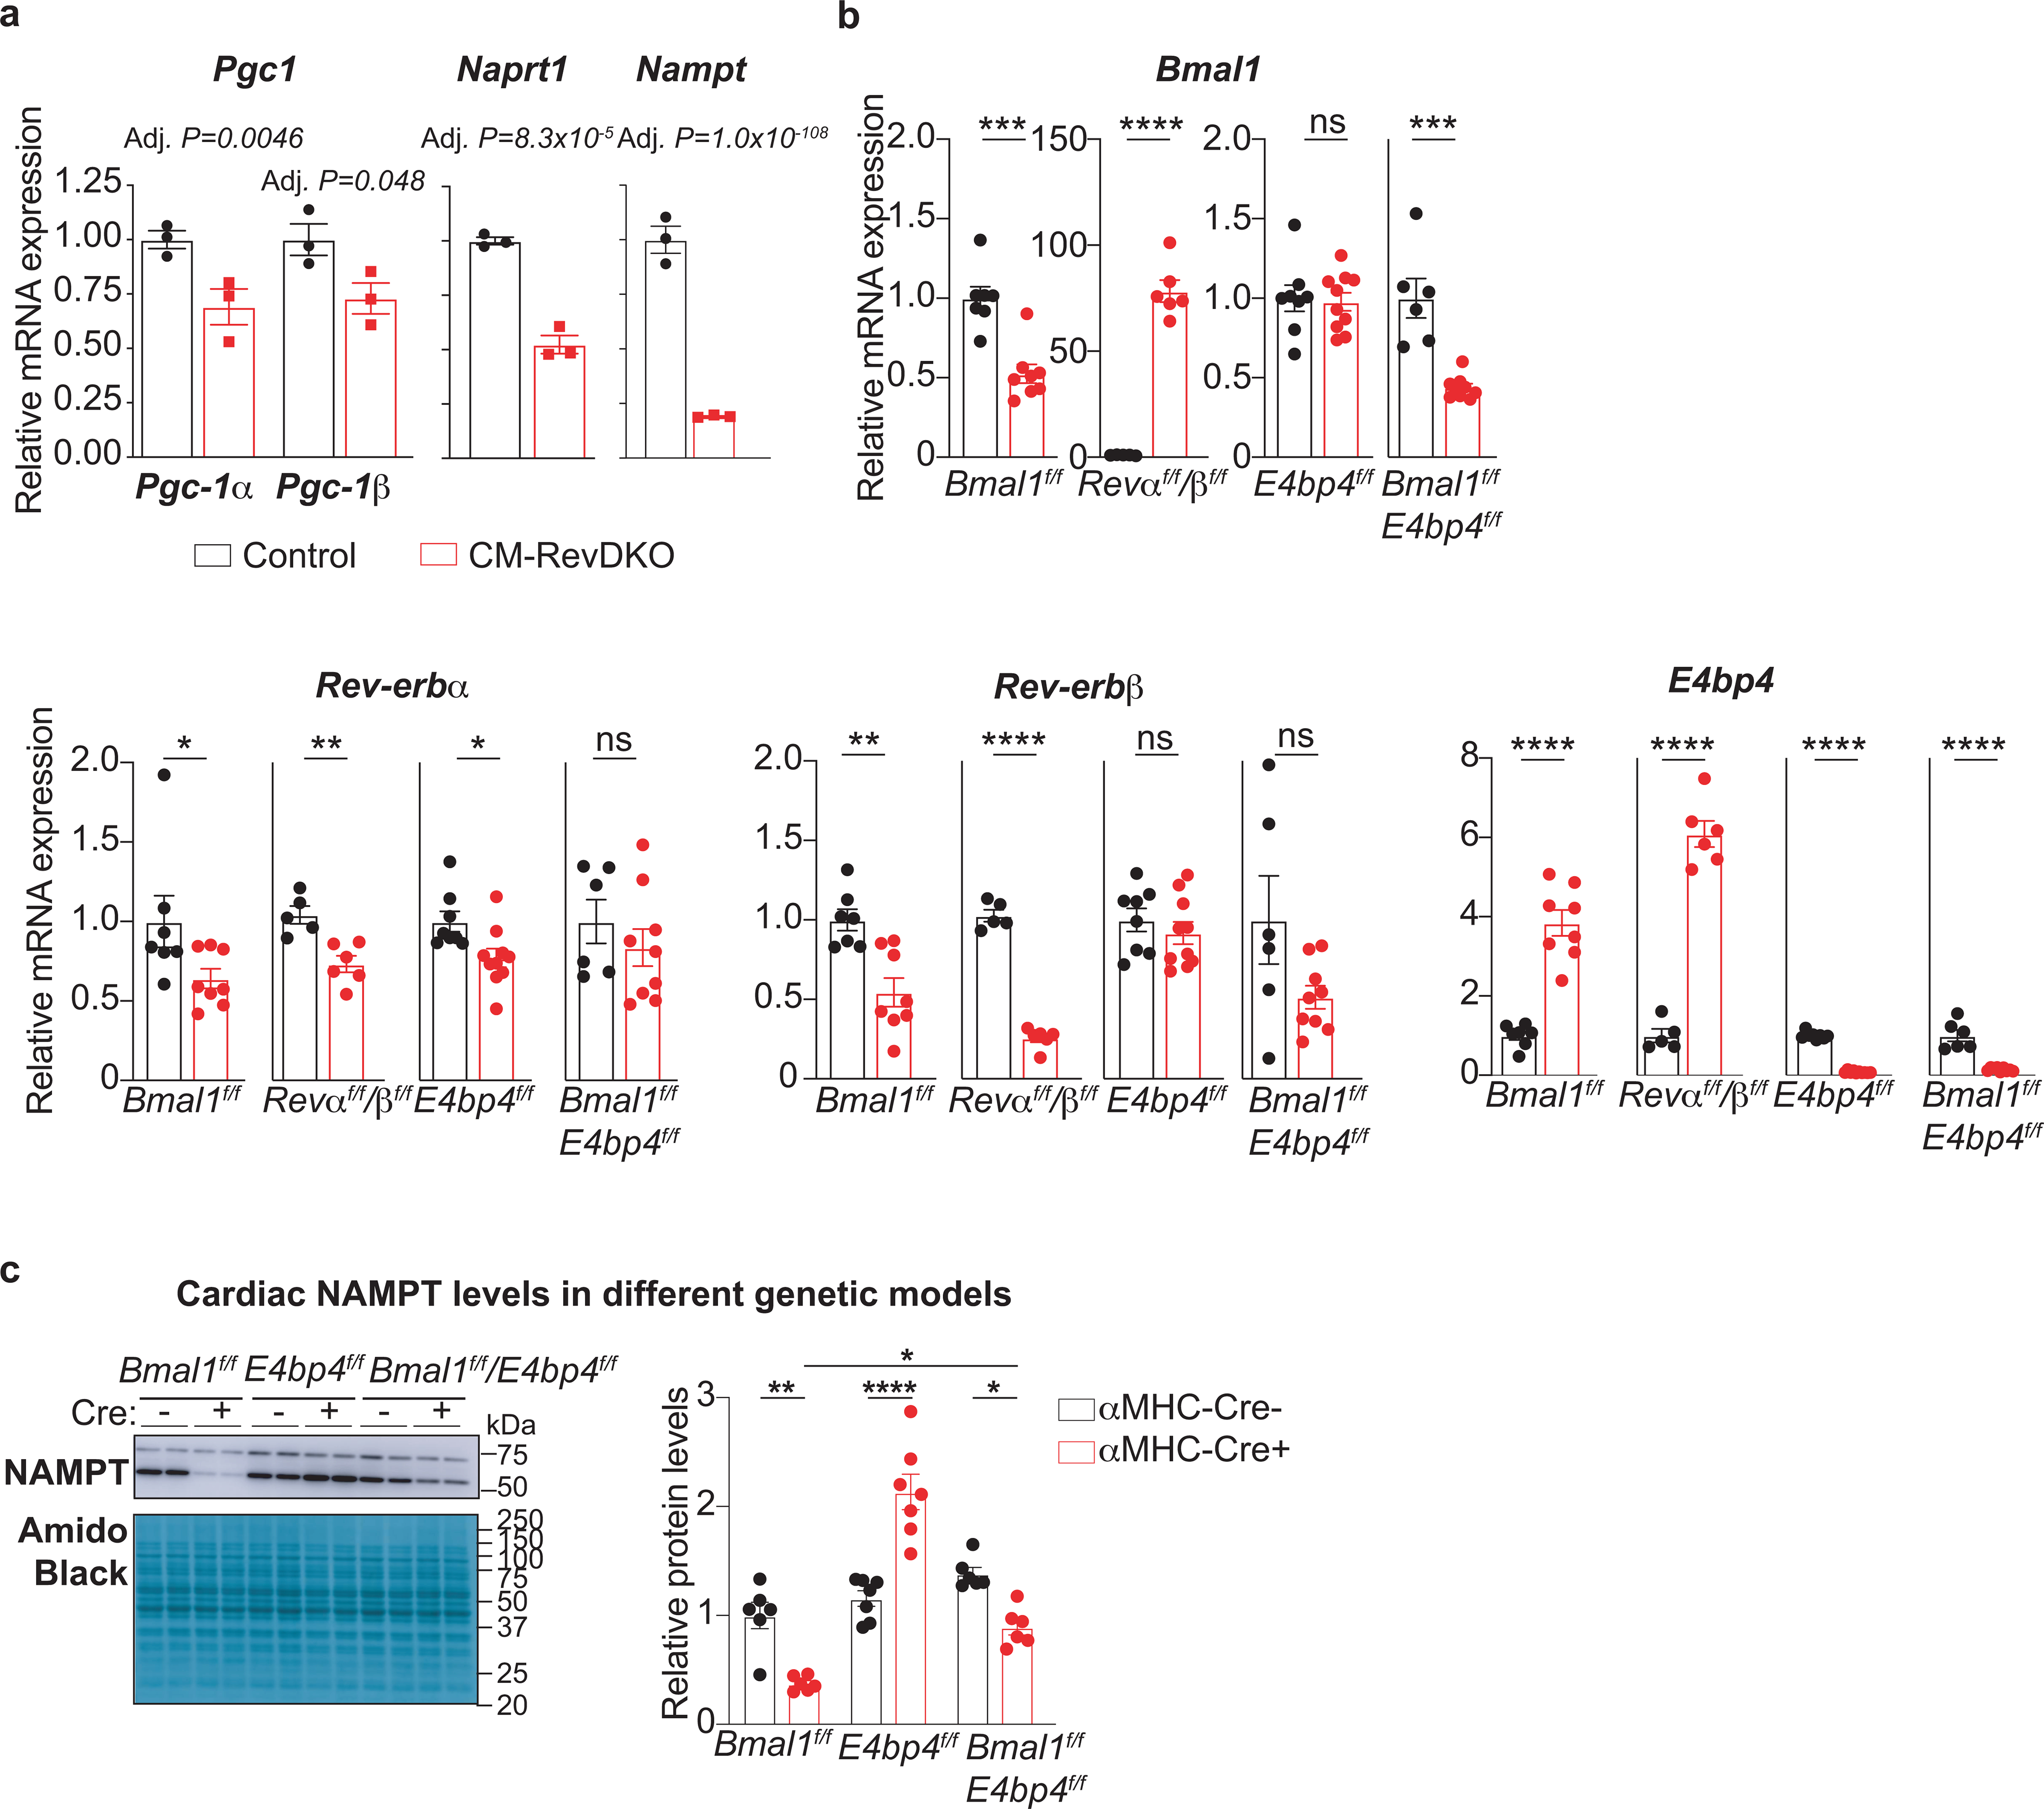
a, Relative Pgc-1α/β, Naprt1 and Nampt mRNA levels in CM-RevDKO and control hearts (n=3/genotype) from 2-month-old male mice. b, Relative Bmal1, Rev-erbα/β, and E4bp4 mRNA levels in CBK (n = 7 for control and n = 8 for KO), CM-RevDKO (n = 5 for control and n n = 6 for KO), E4bp4 (n = 8 for control and n = 10 for KO) and CBK/E4bp4 (double) KO (n = 6 for control and n = 9 for DKO) and control hearts from 2-month-old male mice for CM-RevDKO and control at ZT10 and from 3-month-old male mice for the rest at ZT12. c, Representative immunoblots and relative protein quantification for NAMPT in hearts from 3-month-old male mice with the following genetic background: CBK (n = 6/genotype), E4bp4 (n = 7/genotype), and CBK/E4bp4 (double) KO (n = 6/genotype), harvested at ZT12. n represents biologically independent replicates. All data are presented as mean ± SEM. Adj. P values in a were calculated by DESeq2, while ns: non significant, *P < 0.05, **P < 0.01,***P < 0.001,****P < 0.0001 by 2-sided Student’s t test in b and one-way ANOVA followed by a Tukey’s multiple comparisons test in c (exact P values are provided in the Source Data).
Supplementary Material
Acknowledgements
We thank Lan Cheng for help with histology. We thank the Functional Genomics Core of the Penn Diabetes Research Center (DK19525), Mouse Cardiovascular Phenotyping core (Dr. Swapnil Shewale) in the Penn Cardiovascular Institute, and the Electron Microscopy Resource Laboratory core. This work was supported by NIH R01DK45586, the JPB Foundation, and the Cox Institute for Medical Research (MAL), RO1 DK111495 and Department of Defense W81XWH20–1-0042 and W81XWH20–1-0089 (LP), NIH R01HL058493, R01HL128349 and R01HL151345 (DPK), NIH R01 DK098656 (JAB) and R01HL149159 (M.E.Y). P.D. was supported by a Netherlands Heart Institute postdoctoral fellowship and an American Heart Association postdoctoral fellowship (20POST35210738), M.W.V was supported by an EMBO long-term fellowship (ALTF 540–2018) and an American Heart Association postdoctoral fellowship (836074), Y.X. by an American Heart Association postdoctoral fellowship (827529), T.S.L by F32HL145923 and A.K.H by F32DK122684–01A1.
Competing Interests
M.A.L. receives research support from Pfizer for unrelated work, serves as an advisory board member for Pfizer and Flare Therapeutics, has consulted for Novartis, Madrigal, and Calico and Third Rock, and holds equity in KDAC Therapeutics and Flare Therapeutics. D.J.K. serves as an advisory board member for Pfizer and Amgen. J.A.B. is an inventor on a patent for using NAD+ precursors in liver injury, is a consultant for Pfizer and Cytokinetics, and has received research funding and materials from Elysium Health and Metro International Biotech, both of which have an interest in NAD+ precursors. No funds or materials from Elysium Health and metro International Biotech have been used to generate any data for this study. The remaining authors declare no competing interests.
Footnotes
Supplementary information
Supplementary information includes 7 extended data figures, 1 Supplementary Figure and 2 Supplementary Tables.
REFERENCES
- 1.Kummitha CM, Kalhan SC, Saidel GM & Lai N Relating tissue/organ energy expenditure to metabolic fluxes in mouse and human: experimental data integrated with mathematical modeling. Physiol Rep 2, e12159 (2014). [DOI] [PMC free article] [PubMed] [Google Scholar]
- 2.Cederroth CR et al. Medicine in the Fourth Dimension. Cell Metab. 30, 238–250 (2019). [DOI] [PMC free article] [PubMed] [Google Scholar]
- 3.Dierickx P, van Laake LW & Geijsen N Circadian clocks: from stem cells to tissue homeostasis and regeneration. EMBO Rep. 19, 18–28 (2017). [DOI] [PMC free article] [PubMed] [Google Scholar]
- 4.Dierickx P et al. in Stem Cells and Cardiac Regeneration 57–78 (Springer International Publishing, 2015). doi: 10.1007/978-3-319-25427-2_5 [DOI] [Google Scholar]
- 5.Crnko S, Pré, Du BC, Sluijter JPG & van Laake LW Circadian rhythms and the molecular clock in cardiovascular biology and disease. Nat Rev Cardiol 16, 437–447 (2019). [DOI] [PubMed] [Google Scholar]
- 6.Rana S, Prabhu SD & Young ME Chronobiological Influence Over Cardiovascular Function: The Good, the Bad, and the Ugly. Circulation Research 126, 258–279 (2020). [DOI] [PMC free article] [PubMed] [Google Scholar]
- 7.Ramsey KM et al. Circadian clock feedback cycle through NAMPT-mediated NAD+ biosynthesis. Science 324, 651–654 (2009). [DOI] [PMC free article] [PubMed] [Google Scholar]
- 8.Nakahata Y, Sahar S, Astarita G, Kaluzova M & Sassone-Corsi P Circadian control of the NAD+ salvage pathway by CLOCK-SIRT1. Science 324, 654–657 (2009). [DOI] [PMC free article] [PubMed] [Google Scholar]
- 9.Imai S-I & Guarente L It takes two to tango: NAD+ and sirtuins in aging/longevity control. NPJ Aging Mech Dis 2, 16017 (2016). [DOI] [PMC free article] [PubMed] [Google Scholar]
- 10.Rudic RD et al. BMAL1 and CLOCK, two essential components of the circadian clock, are involved in glucose homeostasis. PLoS Biol 2, e377 (2004). [DOI] [PMC free article] [PubMed] [Google Scholar]
- 11.Young ME et al. Cardiomyocyte-Specific BMAL1 Plays Critical Roles in Metabolism, Signaling, and Maintenance of Contractile Function of the Heart. Journal of Biological Rhythms 29, 257–276 (2014). [DOI] [PMC free article] [PubMed] [Google Scholar]
- 12.Schroder EA et al. The cardiomyocyte molecular clock, regulation of Scn5a, and arrhythmia susceptibility. Am. J. Physiol., Cell Physiol. 304, C954–65 (2013). [DOI] [PMC free article] [PubMed] [Google Scholar]
- 13.Lefta M, Campbell KS, Feng H-Z, Jin J-P & Esser KA Development of dilated cardiomyopathy in Bmal1-deficient mice. AJP: Heart and Circulatory Physiology 303, H475–85 (2012). [DOI] [PMC free article] [PubMed] [Google Scholar]
- 14.Bass J & Lazar MA Circadian time signatures of fitness and disease. Science 354, 994–999 (2016). [DOI] [PubMed] [Google Scholar]
- 15.Hoon Kim Y & Lazar MA Transcriptional Control of Circadian Rhythms and Metabolism: A Matter of Time and Space. Endocrine Reviews 41, (2020). [DOI] [PMC free article] [PubMed] [Google Scholar]
- 16.Yin L & Lazar MA The orphan nuclear receptor Rev-erbalpha recruits the N-CoR/histone deacetylase 3 corepressor to regulate the circadian Bmal1 gene. Mol. Endocrinol. 19, 1452–1459 (2005). [DOI] [PubMed] [Google Scholar]
- 17.Stujanna EN et al. Rev-erb agonist improves adverse cardiac remodeling and survival in myocardial infarction through an anti-inflammatory mechanism. PLoS ONE 12, e0189330 (2017). [DOI] [PMC free article] [PubMed] [Google Scholar]
- 18.Alibhai FJ et al. Disrupting the key circadian regulator CLOCK leads to age-dependent cardiovascular disease. Journal of Molecular and Cellular Cardiology 105, 24–37 (2017). [DOI] [PubMed] [Google Scholar]
- 19.Zhang L et al. REV-ERBα ameliorates heart failure through transcription repression. JCI Insight 2, (2017). [DOI] [PMC free article] [PubMed] [Google Scholar]
- 20.Dierickx P et al. SR9009 has REV-ERB-independent effects on cell proliferation and metabolism. Proc. Natl. Acad. Sci. U.S.A. 3, 201904226 (2019). [DOI] [PMC free article] [PubMed] [Google Scholar]
- 21.Agah R et al. Gene recombination in postmitotic cells. Targeted expression of Cre recombinase provokes cardiac-restricted, site-specific rearrangement in adult ventricular muscle in vivo. J. Clin. Invest. 100, 169–179 (1997). [DOI] [PMC free article] [PubMed] [Google Scholar]
- 22.Guan D et al. The hepatocyte clock and feeding control chronophysiology of multiple liver cell types. Science 369, 1388–1394 (2020). [DOI] [PMC free article] [PubMed] [Google Scholar]
- 23.Zhang Y et al. GENE REGULATION. Discrete functions of nuclear receptor Rev-erbα couple metabolism to the clock. Science 348, 1488–1492 (2015). [DOI] [PMC free article] [PubMed] [Google Scholar]
- 24.Zhang R, Lahens NF, Ballance HI, Hughes ME & Hogenesch JB A circadian gene expression atlas in mammals: implications for biology and medicine. Proc. Natl. Acad. Sci. U.S.A. 111, 16219–16224 (2014). [DOI] [PMC free article] [PubMed] [Google Scholar]
- 25.McGinnis GR et al. Genetic disruption of the cardiomyocyte circadian clock differentially influences insulin-mediated processes in the heart. Journal of Molecular and Cellular Cardiology 110, 80–95 (2017). [DOI] [PMC free article] [PubMed] [Google Scholar]
- 26.Meyer-Roxlau S et al. Differential regulation of protein phosphatase 1 (PP1) isoforms in human heart failure and atrial fibrillation. Basic Res. Cardiol. 112, 43 (2017). [DOI] [PubMed] [Google Scholar]
- 27.Skene PJ & Henikoff S An efficient targeted nuclease strategy for high-resolution mapping of DNA binding sites. elife 6, (2017). [DOI] [PMC free article] [PubMed] [Google Scholar]
- 28.Creyghton MP et al. Histone H3K27ac separates active from poised enhancers and predicts developmental state. Proc. Natl. Acad. Sci. U.S.A. 107, 21931–21936 (2010). [DOI] [PMC free article] [PubMed] [Google Scholar]
- 29.Rada-Iglesias A et al. A unique chromatin signature uncovers early developmental enhancers in humans. Nature 470, 279–283 (2011). [DOI] [PMC free article] [PubMed] [Google Scholar]
- 30.Madsen JGS et al. Integrated analysis of motif activity and gene expression changes of transcription factors. Genome Res. 28, 243–255 (2018). [DOI] [PMC free article] [PubMed] [Google Scholar]
- 31.Mei S et al. Cistrome Data Browser: a data portal for ChIP-Seq and chromatin accessibility data in human and mouse. Nucl. Acids Res. 45, D658–D662 (2017). [DOI] [PMC free article] [PubMed] [Google Scholar]
- 32.Oakley RH et al. Cardiomyocyte glucocorticoid and mineralocorticoid receptors directly and antagonistically regulate heart disease in mice. Science Signaling 12, (2019). [DOI] [PMC free article] [PubMed] [Google Scholar]
- 33.Preitner N et al. The orphan nuclear receptor REV-ERBalpha controls circadian transcription within the positive limb of the mammalian circadian oscillator. 110, 251–260 (2002). [DOI] [PubMed] [Google Scholar]
- 34.Rey G et al. Genome-wide and phase-specific DNA-binding rhythms of BMAL1 control circadian output functions in mouse liver. Plos Biol 9, e1000595 (2011). [DOI] [PMC free article] [PubMed] [Google Scholar]
- 35.Mia S et al. Differential effects of REV-ERBα/β agonism on cardiac gene expression, metabolism, and contractile function in a mouse model of circadian disruption. AJP: Heart and Circulatory Physiology 318, H1487–H1508 (2020). [DOI] [PMC free article] [PubMed] [Google Scholar]
- 36.Weng Y-J et al. E4BP4 is a cardiac survival factor and essential for embryonic heart development. Mol Cell Biochem 340, 187–194 (2010). [DOI] [PubMed] [Google Scholar]
- 37.Monnier V et al. dJun and Vri/dNFIL3 are major regulators of cardiac aging in Drosophila. PLoS Genet. 8, e1003081 (2012). [DOI] [PMC free article] [PubMed] [Google Scholar]
- 38.Walker MA & Tian R Raising NAD in Heart Failure: Time to Translate? Circulation 137, 2274–2277 (2018). [DOI] [PMC free article] [PubMed] [Google Scholar]
- 39.Rosa-Garrido M et al. High-Resolution Mapping of Chromatin Conformation in Cardiac Myocytes Reveals Structural Remodeling of the Epigenome in Heart Failure. Circulation 136, 1613–1625 (2017). [DOI] [PMC free article] [PubMed] [Google Scholar]
- 40.Yoshitane H et al. Functional D-box sequences reset the circadian clock and drive mRNA rhythms. Commun Biol 2, 1–10 (2019). [DOI] [PMC free article] [PubMed] [Google Scholar]
- 41.Covarrubias AJ, Perrone R, Grozio A & Verdin E NAD+ metabolism and its roles in cellular processes during ageing. Nature Reviews Molecular Cell Biology 22, 119–141 (2021). [DOI] [PMC free article] [PubMed] [Google Scholar]
- 42.Koronowski KB et al. Defining the Independence of the Liver Circadian Clock. Cell 177, 1448–1462.e14 (2019). [DOI] [PMC free article] [PubMed] [Google Scholar]
- 43.Nakao T et al. Impact of heart-specific disruption of the circadian clock on systemic glucose metabolism in mice. Chronobiol Int 35, 499–510 (2018). [DOI] [PubMed] [Google Scholar]
- 44.Durgan DJ et al. Evidence suggesting that the cardiomyocyte circadian clock modulates responsiveness of the heart to hypertrophic stimuli in mice. Chronobiol Int 28, 187–203 (2011). [DOI] [PMC free article] [PubMed] [Google Scholar]
- 45.Kohsaka A et al. The circadian clock maintains cardiac function by regulating mitochondrial metabolism in mice. PLoS ONE 9, e112811 (2014). [DOI] [PMC free article] [PubMed] [Google Scholar]
- 46.Bray MS et al. Disruption of the circadian clock within the cardiomyocyte influences myocardial contractile function, metabolism, and gene expression. Am J Physiol-Heart C 294, H1036–47 (2008). [DOI] [PubMed] [Google Scholar]
- 47.Mermet J, Yeung J & Naef F Oscillating and stable genome topologies underlie hepatic physiological rhythms during the circadian cycle. PLoS Genet. 17, e1009350 (2021). [DOI] [PMC free article] [PubMed] [Google Scholar]
- 48.Motomura Y et al. The transcription factor E4BP4 regulates the production of IL-10 and IL-13 in CD4+ T cells. Nat Immunol 12, 450–459 (2011). [DOI] [PMC free article] [PubMed] [Google Scholar]
- 49.Bugge A et al. Rev-erbα and Rev-erbβ coordinately protect the circadian clock and normal metabolic function. Genes & Development 26, 657–667 (2012). [DOI] [PMC free article] [PubMed] [Google Scholar]
- 50.Luongo TS et al. SLC25A51 is a mammalian mitochondrial NAD+ transporter. Nature 588, 174–179 (2020). [DOI] [PMC free article] [PubMed] [Google Scholar]
- 51.Kim D, Langmead B & Salzberg SL HISAT: a fast spliced aligner with low memory requirements. Nature Methods 12, 357–360 (2015). [DOI] [PMC free article] [PubMed] [Google Scholar]
- 52.Pertea M et al. StringTie enables improved reconstruction of a transcriptome from RNA-seq reads. Nature Biotechnology 33, 290–295 (2015). [DOI] [PMC free article] [PubMed] [Google Scholar]
- 53.Liao Y, Smyth GK & Shi W featureCounts: an efficient general purpose program for assigning sequence reads to genomic features. Bioinformatics 30, 923–930 (2014). [DOI] [PubMed] [Google Scholar]
- 54.Love MI, Huber W & Anders S Moderated estimation of fold change and dispersion for RNA-seq data with DESeq2. Genome Biol 15, 550 (2014). [DOI] [PMC free article] [PubMed] [Google Scholar]
- 55.Skene PJ, Henikoff JG & Henikoff S Targeted in situ genome-wide profiling with high efficiency for low cell numbers. Nature Protocols 13, 1006–1019 (2018). [DOI] [PubMed] [Google Scholar]
- 56.Zhang Y et al. Model-based analysis of ChIP-Seq (MACS). Genome Biol 9, R137 (2008). [DOI] [PMC free article] [PubMed] [Google Scholar]
- 57.Martin M Cutadapt removes adapter sequences from high-throughput sequencing reads. EMBnet.journal doi: 10.14806/ej.17.1.200 [DOI] [Google Scholar]
- 58.Li H Aligning sequence reads, clone sequences and assembly contigs with BWA-MEM. (2013).
- 59.Li H et al. The Sequence Alignment/Map format and SAMtools. Bioinformatics 25, 2078–2079 (2009). [DOI] [PMC free article] [PubMed] [Google Scholar]
- 60.Yu G, Wang L-G & He Q-Y ChIPseeker: an R/Bioconductor package for ChIP peak annotation, comparison and visualization. Bioinformatics 31, 2382–2383 (2015). [DOI] [PubMed] [Google Scholar]
- 61.Heinz S et al. Simple combinations of lineage-determining transcription factors prime cis-regulatory elements required for macrophage and B cell identities. Mol. Cell 38, 576–589 (2010). [DOI] [PMC free article] [PubMed] [Google Scholar]
- 62.Sakamoto T et al. A Critical Role for Estrogen-Related Receptor Signaling in Cardiac Maturation. Circulation Research 120, 941 (2020). [DOI] [PMC free article] [PubMed] [Google Scholar]
- 63.Liberzon A et al. The Molecular Signatures Database (MSigDB) hallmark gene set collection. Cell Syst 1, 417–425 (2015). [DOI] [PMC free article] [PubMed] [Google Scholar]
- 64.Durand NC et al. Juicebox Provides a Visualization System for Hi-C Contact Maps with Unlimited Zoom. Cell Syst 3, 99–101 (2016). [DOI] [PMC free article] [PubMed] [Google Scholar]
Associated Data
This section collects any data citations, data availability statements, or supplementary materials included in this article.
Supplementary Materials
Data Availability Statement
The authors declare that the data supporting the findings of this study are available within the paper and its supplementary information files. Source data are provided with this paper. The RNA, Cut&Run and ChIP-Sequencing datasets reported in this paper have been deposited in the Gene Expression Omnibus with the accession number GSE153014.


