

ABSTRACT
Background
Vitamin D status at birth is reliant on maternal–fetal transfer of vitamin D during gestation.
Objectives
We aimed to examine the vitamin D status of newborn infants in a diverse population and to subsequently identify the modifiable correlates of vitamin D status.
Methods
In this cross-sectional study, healthy mother–infant dyads (n = 1035) were recruited within 36 h after term delivery (March 2016–March 2019). Demographic and lifestyle factors were surveyed. Newborn serum 25-hydroxyvitamin D [25(OH)D] was measured (standardized chemiluminescence immunoassay) and categorized as deficient [serum 25(OH)D <30 nmol/L] or adequate (≥40 nmol/L). Serum 25(OH)D was compared among categories of maternal characteristics using ANOVA; each characteristic was tested in a separate model. Subgroups (use of multivitamins preconception and continued in pregnancy compared with during pregnancy only) were matched (n = 352/group) for maternal factors (ancestry, age, income, education, parity, and prepregnancy BMI) using propensity scores; logistic regression models were generated for odds of deficiency or adequacy.
Results
Infants’ mean serum 25(OH)D was 45.9 nmol/L (95% CI: 44.7, 47.0 nmol/L) (n = 1035), with 20.8% (95% CI: 18.3%, 23.2%) deficient and 60.7% (95% CI: 55.2%, 66.2%) adequate. Deficiency prevalence ranged from 14.6% of white infants to 41.7% of black infants. Serum 25(OH)D was higher (P < 0.0001) in infants of mothers with higher income, BMI < 25 kg/m2, exercise and sun exposure in pregnancy, and use of multivitamins preconception. In the matched-subgroup analysis, multivitamin supplementation preconception plus during pregnancy relative to only during pregnancy was associated with lower odds for vitamin D deficiency (ORadj: 0.55; 95% CI: 0.36, 0.86) and higher odds for adequate vitamin D status (ORadj: 1.47; 95% CI: 1.04, 2.07).
Conclusions
In this study most newborn infants had adequate vitamin D status, yet one-fifth were vitamin D deficient with disparities between population groups. Guidelines for a healthy pregnancy recommend maternal use of multivitamins preconception and continuing in pregnancy. An emphasis on preconception use may help to achieve adequate neonatal vitamin D status.
This trial was registered at clinicaltrials.gov as NCT02563015.
Keywords: vitamin D status, term pregnancy, 25-hydroxyvitamin D, newborn infant, population groups, maternal multivitamin use
Introduction
National surveillance data on the vitamin D status of newborn infants in Canada are not available. According to population standards for Canada and the United States, maintaining circulating 25-hydroxyvitamin D [25(OH)D] concentrations in the range of 40–50 nmol/L is desirable for infants, whereas the risk of vitamin D deficiency symptoms increases as 25(OH)D falls <30 nmol/L (1). The vitamin D status of the newborn infant is reliant on maternal–fetal transfer during gestation and achievement of maternal serum 25(OH)D concentrations ≥50 nmol/L appears protective against neonatal vitamin D deficiency (2). Based on regional cohort studies in Canada, 16%–32% of women in the third trimester of pregnancy have 25(OH)D concentrations <50 nmol/L (3–6). Similarly, 24%–35% of infants are born with 25(OH)D concentrations <50 nmol/L (7–9), whereas the proportion of infants with 25(OH)D concentrations <30 nmol/L appears more variable, ranging from 4% to 36% (7, 9–11). The majority of these studies reflect predominantly (87%–98%) European ancestry (7–9), and thus it is not clear whether disparities in neonatal vitamin D status exist between other population groups. This is important to acknowledge because 22% of the Canadian population is of a visible minority (12), and 30% of births are to women born outside of Canada (13). Consequently, participant bias and the associated validity of the modifiable determinants of neonatal vitamin D status and the relevance to all population groups in Canada are unclear. This makes it difficult to assess health equity and to achieve equality through improvements in public health policy by targeting modifiable factors.
Guidelines for a healthy pregnancy focus on modifiable factors for women of all population groups and include being physically active, achievement of a healthy prepregnancy BMI, and appropriate weight gain during pregnancy (14, 15). Dietary guidance specifies that all women who could become pregnant or are pregnant take a daily multivitamin containing folic acid (16). These lifestyle recommendations are highly relevant to women of reproductive age in Canada because 34% begin pregnancy with a BMI above the recommended range (17). Likewise, 40% of nonpregnant women have 25(OH)D < 50 nmol/L (18) and there is evidence of racial disparities in vitamin D status (19). Use of a multivitamin containing vitamin D increases maternal vitamin D status and consequently opportunity for the maternal–fetal transfer of vitamin D (5, 7, 20). In a pan-Canadian pregnancy cohort study, adherence to multivitamin supplementation was high (87%) and accordingly >85% achieved 25(OH)D ≥ 50 nmol/L (6). Multivitamin use was associated with higher vitamin D status across the range of prepregnancy BMI and appeared to be beneficial regardless of self-reported race. However, the sample was mainly of European ancestry and did not assess newborn vitamin D status, making it difficult to judge whether these modifiable lifestyle factors are influential in women and newborn infants from other population groups.
As highlighted already, pregnancy cohort studies are usually not representative of the general population of pregnant women (21). Recruitment of a representative longitudinal pregnancy and birth cohort is challenged by multiple barriers to participation including mistrust, cultural insensitivity, and language barriers (22). To assess the vitamin D status of newborn infants among population groups and identify tangible modifiable factors, alternative study designs are warranted. Such studies need to reflect representative diverse ancestry with the goal to inform the need for and design of more costly longitudinal cohort studies. Therefore, the objectives of this cross-sectional study were to examine vitamin D status among newborn infants of diverse population ancestry. We subsequently explored the relations between neonatal vitamin D status and sociodemographic variables, focusing on population groups among the nonmodifiable factors, as well as modifiable factors. We then aimed to determine whether the relations between neonatal vitamin D status and the most prominent modifiable factors persisted among population groups through use of propensity score matching and logistic regression.
Methods
Study population
All data were collected and analyzed as planned a priori to address the study objective and served as the newborn vitamin D screening phase of a double-blind, randomized, controlled, parallel-group trial on vitamin D supplementation (NCT02563015). From March 2016 through March 2019, mother–infant dyads were screened for eligibility within 36 h of delivery at the Lakeshore General Hospital in Montreal, Québec. Recruitment details that were consistent with the recommended strategies to enhance cultural safety (22) included that a health care worker, typically a nurse, conducted an initial screen for eligibility criteria and accordingly requested permission for a researcher to discuss the study with the family. The study team included multilingual researchers of multicultural ancestry. Inclusion criteria for this study were singleton pregnancies of any ancestry, and healthy term infants (37–42 weeks of gestation) of appropriate-for-gestational-age (AGA; 10th–90th percentiles) weight and sex (23). Exclusion criteria were factors that relate to altered maternal–fetal transfer of vitamin D, including maternal pre-eclampsia, gestational diabetes, Crohn disease, celiac disease, and liver or kidney disease, as well as infants born with small or large weight for gestational age (GA) and sex (<10th or >90th percentile) according to Canadian birth reference values (23). If an infant met the inclusion criteria, but had already had blood sampled for newborn clinical screening for inborn errors of metabolism, they were ineligible for this study. This approach ensured only 1 heel lance and blood sampling occurrence for both clinical testing and the research as another approach to ensure cultural safety. Signed informed consent was obtained from mothers before administration of a questionnaire and collection of a capillary blood sample from the newborn. All study materials were available in English and French.
Ethical approval
This study was reviewed and approved by the St. Mary's Hospital Research Ethics Board that administers ethics at the recruiting hospital (SMHC 15-34). The Health Canada Research Ethics Board (REB 2019-033H) and Privacy Management Division (HC-PR-2019-000024) also reviewed and approved the use of the data in this report.
Demographic/lifestyle questionnaire and pregnancy history
Population groups
Demographic information was surveyed before discharge from the hospital. Mothers self-reported which population groups they identify with; data were subsequently categorized into population groups using proposed standards for race-based data in Canada (24). Population groups were white (European descent); black (African, Afro-Caribbean, African Canadian descent); East/Southeast Asian (Chinese, Korean, Japanese, Taiwanese or Filipino, Vietnamese, Cambodian, Thai, Indonesian, or other Southeast Asian descent); Latino (Latin American, Hispanic descent); Middle Eastern (Arab, Persian, West Asian descent, e.g., Afghan, Egyptian, Iranian, Lebanese, Turkish, Kurdish); South Asian (South Asian descent, e.g., East Indian, Pakistani, Bangladeshi, Sri Lankan, Indo-Caribbean); or other (all others including mixed ancestry, and where mothers did not identify as white and stated other or unknown). Country of birth (Canada compared with elsewhere) was also surveyed as a factor related to vitamin D status in pregnancy (25, 26). These data were collected to better inform actions and to help reduce health inequities (24).
Other sociodemographic nonmodifiable factors
Maternal age (actual years) was obtained from the hospital record, whereas education and income were surveyed. Data were categorized as maternal age (≤30, >30 y) to align with the Dietary Reference Intake life stage groups (1); maternal highest level of education completed (high school, college, or university); and family income was categorized (<70,000, ≥70,000 Canadian dollars, or not reported) based on the median income of Canadian families/households with children (27).
History of the current pregnancy
Mother's prepregnancy weight, weight at delivery, and height from the hospital record were used to calculate prepregnancy BMI and gestational weight gain. Gestational weight gain was evaluated based on prepregnancy BMI (in kg/m2) status (underweight: <18.5; healthy: 18.5–24.9; overweight: 25.0–29.9; and obese: ≥30) and according to weight gain guidelines (inadequate, adequate, excess) (28). Type of delivery, parity (1, ≥2), as well as infant GA at birth, birth weight, and Apgar scores were obtained from hospital records. Weight z scores were calculated using the WHO growth standards (29).
Lifestyle variables
Maternal vitamin and multivitamin supplement use (yes, no) during the 3 mo before conception or during pregnancy were surveyed separately along with frequency of use and continuance thereafter, and were categorized as compliant (every day, almost every day) or not compliant (2–3/wk or less). Where brand was reported, the dose of vitamin D (IU) was extracted from the Drug Products and Natural Health Products Databases of Health Canada. Other variables included smoking history (never, past, current), alcohol consumption during pregnancy (yes, no), and any indoor or outdoor physical activity during pregnancy (yes, no). Sun exposure in the third trimester was surveyed using questions adapted from the Canadian Health Measures Survey (19), including time spent outdoors between 10:00 and 16:00 (0, ≤15, 16–30, >30 min/d) with skin directly exposed to sunlight. From these data a variable for exposure to ultraviolet β (UVB) for ≥15 min/d with at least hands and face exposed was created (yes, no); if all the third trimester occurred between 1 November and 31 March the participant was assigned to the no category. Use of any sun protection factor (SPF) products, including make-up creams, was surveyed (yes, no); a response of yes was considered separately from no UVB exposure because use of SPF does not fully prevent synthesis of vitamin D (30). As a proxy for maternal UVB exposure, a UVB category was created to represent the vitamin D synthesizing (1 April–31 October) and nonsynthesizing (1 November–31 March) periods for Canada (31) based on date of birth. Season at birth was defined using yearly equinox and solstice dates for each year [e.g., 2018 winter (21 December–19 March), spring (20 March–20 June), summer (21 June–22 September), and fall (23 September–21 December)].
Blood sample collection and 25(OH)D analysis
A 400- to 500-μL capillary blood sample (Capiject, Terumo Corp.) was collected from the heel of infants within 36 h of birth. Samples were stored at 4°C until being transported to McGill University, then centrifuged (3000 × g for 20 min at 6°C) to obtain serum. Serum (175–250 μL) that was not analyzed immediately was stored at −80°C until measurement of total 25(OH)D using an automated chemiluminescence immunoassay (CLIA; Liaison, Diasorin Inc.). Samples (n = 12) with 25(OH)D below the lower limit of quantification of 10 nmol/L were assigned a value of 5 nmol/L (32). Based on a pooled laboratory sample, the mean intra- and interassay CVs across this study were <10%. The laboratory maintained certificates of proficiency from the Vitamin D External Quality Assessment Scheme (DEQAS) to ensure reliability of the assay and used National Institute of Standards and Technology (NIST) Standard Reference Materials (SRM) 972a Level 1–4 quality control samples to confirm accuracy of measurements during the study period. Across the study period, 75 NIST SRM concentrations were 98.2% (CV%: 10.3) of certified values, and 190 DEQAS samples were 99.5% (CV%: 12.4) of NIST-certified values. The certified NIST concentrations were used to standardize infant serum 25(OH)D concentrations according to the Vitamin D Standardization Program (VDSP) protocols (33, 34), and using Deming regression (standardized concentration = 0.9586 CLIA concentration + 3.399 nmol/L) to fit the CLIA-measured 25(OH)D values to NIST reference measurement procedures. Neonatal serum 25(OH)D concentrations were then classified according to recommendations (1) using the cutoff for adequacy of vitamin D status for infants at ≥40 nmol/L given the recommended range of 40–50 nmol/L, which aligns with targets for population assessments or groups of pregnant women. Infants were also categorized as being deficient (<30 nmol/L). The proportions (95% CIs) of infants with serum 25(OH)D <30, 30–39.9, 40–49.9, and 50–125 nmol/L were used in describing the population distribution.
Statistical analyses
The sample size estimate for this study was n = 2000 eligible infants invited to the study as the recruitment pool for a trial. As mentioned earlier, ≤35% of infants in studies of mainly European ancestry are born with serum 25(OH)D concentrations < 50 nmol/L based on previous studies in Canada (3, 7, 9, 20). In the absence of data on the prevalence of vitamin D status at the recommended cutoff for adequacy (≥40 nmol/L) for population groups, a sample size of 576 would be sufficient to detect a prevalence of ≤60%, assuming 4% precision of the estimate and a 95% CI (35).
To evaluate the potential for participant bias, continuous data of those included in the analysis were compared with those excluded (e.g., owing to lack of a serum sample or missing information) using a mixed-model ANOVA accounting for fixed effects of inclusion/exclusion and infant study number as a random variable. Differences in proportions between included/excluded groups were tested using chi-square tests and when cell counts were <10, Fisher's exact test was reported.
The distribution of vitamin D status was described for the full sample using mean ± SEM (95% CI of the mean) as well as within the various vitamin D status categories using proportions (%; 95% CI). Vitamin D intake from supplements was described as median (95% range). Characteristics according to vitamin D status categories [<30, 30–39.9, and ≥40 nmol 25(OH)D/L] were compared using a mixed-model ANOVA accounting for fixed effects of maternal characteristics (e.g., age ≤30 compared with >30 y) and infant study number as a random variable for continuous variables and using chi-square or Fisher's exact tests for proportions. Data are reported as mean ± SEM or n (%). For differences among characteristics with ≥3 categories (e.g., population groups), post hoc testing using Tukey's t tests was conducted, and adjusted for multiple comparisons using Tukey–Kramer adjustment.
To help inform future studies and health policy, propensity score methodology was used to analyze the data as a nonrandomized study (36). Maternal use of multivitamins preconception (n = 404) compared with during pregnancy (n = 561) was selected as the lifestyle-based treatment given high compliance with multivitamin use overall and because it is more readily modifiable than reducing prepregnancy BMI into the recommended range of 18.5–24.9. Participants not taking multivitamins (n = 70) were removed as were those with prepregnancy BMI < 18.5 (n = 23) before matching, because these are not consistent with guidelines for a healthy pregnancy (14–16). Groups were then matched in a hierarchical process, first (n = 291/group) using propensity scores generated on the basis of greedy matching of binary variables including maternal prepregnancy BMI (<25 compared with ≥25), parity (1 compared with ≥2), age (≤30 compared with >30 y), population group (white compared with any other group), education (high school compared with greater), and income (<70,000 compared with ≥70,000 Canadian dollars). A separate matching procedure was conducted for participants where income was not reported (n = 61/group) using the same approach; both data sets were subsequently combined to form a database with n = 352/group. For both propensity score matches, a standardized difference (caliper) of 0 (exact) was applied for population group and prepregnancy BMI category and <0.1 was accepted for the other variables. Differences between the 2 groups (n = 352/group) of maternal multivitamin supplement use (preconception compared with pregnancy) were compared using a mixed-model ANOVA accounting for the fixed effect of group and matched pair as a random variable. The same model was also conducted for serum 25(OH)D concentration according to maternal characteristics as a fixed effect (age, actual maternal population group, prepregnancy BMI, income, education, season at delivery, exercise during pregnancy, prepregnancy BMI, and parity). For differences between groups and according to maternal characteristics with ≥3 categories (e.g., population groups), post hoc testing using Tukey's t tests was conducted, and adjusted for multiple comparisons using Tukey–Kramer adjustment. Differences in proportions between multivitamin use groups were tested using chi-square or Fisher's exact test. ORs for having infant serum 25(OH)D <30 or ≥40 nmol/L were calculated according to maternal multivitamin use groups using logistic regression models (crude and adjusted for multiple covariates). The reference group for each OR was based on either recommended practices (e.g., achievement of recommended BMI, exercise, or multivitamin use in pregnancy) or a large data set (e.g., postsecondary education). Covariates considered in the adjusted ORs included those associated with endogenous synthesis or metabolism of vitamin D (maternal population group, exercise during pregnancy, season at delivery, use of SPF products, and exposure to UVB), maternal sociodemographic factors (age, income, education, and Canadian-born), and pregnancy factors (parity, prepregnancy BMI, and weight gain). Data for the multivitamin use groups are reported as mean ± SEM or n (%).
All statistical analyses were performed using SAS version 9.4 (SAS Institute Inc.). A P < 0.05 (2-sided) including Tukey–Kramer adjustments was used to guide the interpretation of the data.
Results
Summary of participants
Of the mother–infant dyads screened for eligibility (Figure 1), 79.7% were eligible. Of these, 35% gave consent and fully met the study inclusion criteria including that the neonatal blood sample volume was sufficient to test for 25(OH)D concentration. By design, all infants were born at term and of AGA weight (Supplemental Table 1). Mother–infant dyads excluded from this report owing to incomplete data or a missed blood sample more frequently did not report income but were otherwise not different from those included.
FIGURE 1.

Participant flow diagram for all newborn infants assessed for study eligibility and participating in the assessment of vitamin D status as well as maternal use of multivitamin groups matched based on propensity scores. LGA, large for gestational age; SGA, small for gestational age.
Vitamin D status at birth
Mean neonatal (n = 1035) serum 25(OH)D concentration was 45.9 ± 0.6 nmol/L (95% CI: 44.7, 47.0 nmol/L) with no differences between male and female infants (P = 0.99). The distribution of serum 25(OH)D (Figure 2) spanned 8–124 nmol/L with 60.7% (95% CI: 55.2%, 66.2%) ≥40 nmol/L; the distribution of neonatal serum 25(OH)D (Supplemental Figure 1) and characteristics among population groups were explored (Supplemental Table 2). The proportion of infants in these status categories (Table 1) varied as a function of all sociodemographic characteristics except for maternal age and education. Serum 25(OH)D was higher (P < 0.0001) in infants of white mothers than in those of all other groups. Higher 25(OH)D concentration was also observed in infants born to mothers born in Canada, or according to higher income. There were no differences according to family type (data not shown).
FIGURE 2.
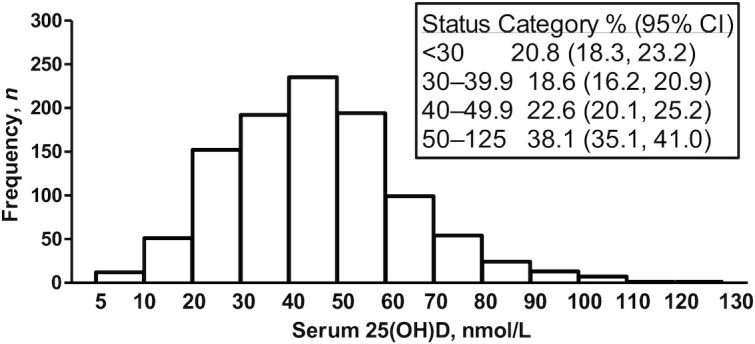
Frequency distribution of serum 25(OH)D in newborn infants (n = 1035); insert shows the proportion (95% CI) with serum 25(OH)D in each status category: <30 nmol/L (n = 215), 30–39.9 nmol/L (n = 192), 40–49.9 nmol/L (n = 234), and 50–125 nmol/L (n = 394). 25(OH)D, 25-hydroxyvitamin D.
TABLE 1.
Neonatal vitamin D status according to maternal demographic, obstetric, and lifestyle characteristics1
| Neonatal serum 25(OH)D, nmol/L | |||||||
|---|---|---|---|---|---|---|---|
| Variable | <30 (n = 215) (20.8%) | 30.0–39.9 (n = 192) (18.6%) | ≥40.0 (n = 628) (60.7%) | P value | n | Neonatal serum 25(OH)D, nmol/L | P value |
| Age, y | 31.4 ± 0.37 | 32.5 ± 0.3 | 32.5 ± 0.2 | 0.0077 | 0.22 | ||
| ≤30 | 74 (34.4) | 59 (30.7) | 178 (28.3) | 0.24 | 311 | 44.8 ± 1.1 | |
| >30 | 141 (65.6) | 133 (69.3) | 450 (71.7) | 724 | 46.3 ± 0.7 | ||
| Maternal population group2 | <0.0001 | <0.0001 | |||||
| Black | 30 (14.0) | 15 (7.8) | 27 (4.3) | 72 | 36.2 ± 1.9 | ||
| East/Southeast Asian | 18 (8.4) | 14 (7.3) | 26 (4.1) | 58 | 38.4 ± 1.9 | ||
| Latino | 11 (5.1) | 15 (7.8) | 21 (4.3) | 47 | 41.5 ± 2.4 | ||
| Middle Eastern | 27 (12.6) | 22 (11.5) | 47 (7.5) | 96 | 40.6 ± 1.6 | ||
| South Asian | 24 (11.2) | 17 (8.9) | 35 (5.6) | 76 | 38.1 ± 1.7 | ||
| Mixed or unknown heritage | 13 (6.1) | 12 (6.3) | 32 (5.1) | 57 | 43.5 ± 2.3 | ||
| White | 92 (42.8) | 97 (50.5) | 440 (70.1) | 629 | 49.9 ± 0.73 | ||
| Maternal country of birth | <0.0001 | <0.0001 | |||||
| Canada | 97 (45.1) | 105 (54.7) | 437 (69.6) | 639 | 49.1 ± 0.7 | ||
| Elsewhere | 118 (54.9) | 87 (45.3) | 191 (30.4) | 396 | 40.6 ± 0.9 | ||
| Education | 0.27 | 0.37 | |||||
| High school or less | 46 (21.4) | 30 (15.6) | 95 (15.1) | 171 | 44.1 ± 1.5 | ||
| College/undergraduate degree | 51 (23.7) | 46 (24.0) | 167 (26.6) | 264 | 46.0 ± 1.1 | ||
| Graduate degree | 118 (54.9) | 116 (60.4) | 366 (58.3) | 600 | 46.3 ± 0.7 | ||
| Family income, CAD | <0.0001 | <0.0001 | |||||
| <70,000 | 86 (40.0) | 57 (29.7) | 145 (23.0) | 288 | 42.1 ± 1.1 | ||
| ≥70,000 | 94 (43.7) | 93 (48.4) | 359 (57.2) | 546 | 48.2 ± 0.83 | ||
| Not reported/known | 35 (16.3) | 42 (21.9) | 124 (19.8) | 201 | 44.9 ± 1.2 | ||
| Prepregnancy BMI, kg/m2 | 25.6 ± 0.4 | 25.0 ± 0.4 | 24.2 ± 0.2 | 0.0015 | <0.0001 | ||
| <18.5 | 8 (3.7) | 5 (2.6) | 20 (3.2) | 0.0027 | 33 | 42.8 ± 2.6 | |
| 18.5–24.9 | 97 (45.1) | 106 (55.2) | 396 (63.1) | 599 | 47.8 ± 0.7 | ||
| 25.0–29.9 | 69 (32.1) | 48 (25.0) | 136 (21.7) | 253 | 43.6 ± 1.24 | ||
| ≥30.0 | 35 (16.3) | 29 (15.1) | 67 (10.7) | 131 | 42.7 ± 1.74 | ||
| Data not available | 6 (2.8) | 4 (2.1) | 9 (1.4) | 19 | 43.0 ± 4.9 | ||
| Weight gain in pregnancy, kg | 13.7 ± 0.5 | 13.6 ± 0.4 | 14.0 ± 0.2 | 0.68 | |||
| Appropriate weight gain | 0.90 | 0.88 | |||||
| Below | 41 (19.1) | 41 (21.4) | 124 (19.8) | 206 | 46.7 ± 1.3 | ||
| Within | 67 (31.2) | 61 (31.8) | 215 (34.2) | 343 | 45.8 ± 1.0 | ||
| Above | 99 (46.1) | 86 (44.8) | 272 (43.3) | 457 | 45.5 ± 0.9 | ||
| Data not available | 8 (3.7) | 4 (2.0) | 17 (2.7) | 29 | 46.1 ± 4.0 | ||
| Parity | 0.0193 | 0.08 | |||||
| Primiparous | 81 (37.7) | 71 (37.0) | 290 (46.2) | 442 | 47.0 ± 0.8 | ||
| Multiparous | 134 (62.3) | 121 (63.0) | 338 (53.8) | 593 | 45.0 ± 0.8 | ||
| Multivitamin use5 | <0.0001 | <0.0001 | |||||
| None | 32 (14.9) | 16 (8.3) | 22 (3.5) | 70 | 35.4 ± 2.23 | ||
| Pregnancy | 126 (58.6) | 106 (55.2) | 329 (52.4) | 561 | 44.9 ± 0.73 | ||
| Preconception and pregnancy | 57 (26.5) | 70 (36.5) | 277 (44.1) | 404 | 49.0 ± 0.93 | ||
| SPF products used6 | <0.0001 | <0.0001 | |||||
| Yes | 16 (7.4) | 26 (13.5) | 127 (20.2) | 169 | 52.1 ± 1.4 | ||
| No | 199 (92.6) | 166 (86.5) | 501 (79.8) | 866 | 44.6 ± 0.6 | ||
| Sun exposure (hands/face)6 | 0.0002 | <0.0001 | |||||
| Yes | 63 (29.3) | 65 (33.9) | 277 (44.1) | 405 | 48.9 ± 0.9 | ||
| No | 152 (70.7) | 127 (66.1) | 351 (55.9) | 630 | 43.9 ± 0.7 | ||
| Exercised in pregnancy7 | <0.0001 | <0.0001 | |||||
| Yes | 88 (40.9) | 67 (34.9) | 333 (53.0) | 488 | 48.4 ± 0.8 | ||
| No | 127 (59.1) | 125 (65.1) | 295 (47.0) | 547 | 43.6 ± 0.8 | ||
| Season at birth8 | <0.0001 | <0.0001 | |||||
| Winter | 70 (32.6) | 46 (24.0) | 135 (21.5) | 251 | 43.5 ± 1.2 | ||
| Spring | 59 (27.4) | 68 (35.4) | 158 (25.2) | 285 | 43.7 ± 0.9 | ||
| Summer | 33 (15.4) | 35 (18.2) | 200 (31.9) | 268 | 53.0 ± 1.23 | ||
| Fall | 53 (24.7) | 43 (22.4) | 135 (21.5) | 231 | 42.7 ± 1.0 | ||
| Born in UVB period | 0.0001 | <0.0001 | |||||
| 1 April–31 October | 101 (47.0) | 110 (57.3) | 397 (63.2) | 608 | 48.0 ± 0.7 | ||
| 1 November–31 March | 114 (53.0) | 82 (42.7) | 231 (36.8) | 427 | 42.8 ± 0.9 | ||
Values are mean ± SEM or n (%) unless otherwise indicated. CAD, Canadian dollars; SPF, sun protection factor; UVB, ultraviolet β; 25(OH)D, 25-hydroxyvitamin D.
Maternal self-reported population group according to ancestral origin.
Significant difference (P < 0.01) compared with other age groups, population subgroup, lower income, other seasons, and other multivitamin use groups.
Significant difference (P < 0.05) compared with the BMI 18.5–24.9 kg/m2 category.
Surveyed as multivitamin used in the 3 mo before conceiving; and used during pregnancy.
Surveyed to reflect third-trimester sun exposure behavior.
Any exercise during pregnancy included any indoor or outdoor activity.
Seasons according to equinox and solstice dates.
Among the obstetric and lifestyle variables (Table 1), those that were associated with a lower proportion with 25(OH)D < 30 nmol/L included primiparous women, BMI in the recommended range, use of multivitamins preconception, summer season at birth, exposure to sun, use of SPF products, and exercise in pregnancy resulting in higher serum 25(OH)D concentrations. Pregnancy weight gain did not associate with infant vitamin D status; nor did maternal smoking behavior, delivery mode, or infant GA or weight at birth (data not shown).
Potential modifiable factors associated with vitamin D status
Of the lifestyle variables suitable for consideration in future studies, use of multivitamins was prominent (93.3%; 95% CI: 91.8%, 94.9%). The majority of mothers were of a recommended prepregnancy BMI of 18.5–24.9 (57.9%; 95% CI: 54.9%, 60.9%) with fewer in the 25.0–29.9 range (24.4%; 95% CI: 21.8%, 27.1%) or ≥30 (12.7%; 95% CI: 10.6%, 14.7%). In contrast, 47.1% (95% CI: 44.1%, 50.2%) were physically active during pregnancy. In the maternal multivitamin use subgroups, 6.8% (95% CI: 5.2%, 8.3%) did not adhere to multivitamin use in pregnancy, 54.2% (95% CI: 51.2%, 57.2%) of mothers took a multivitamin supplement during pregnancy, and 39.0% (95% CI: 36.1%, 42.0%) took a supplement in the 3 mo before as well as during pregnancy. Compliance to daily multivitamin supplement use was high, with 90.0% (95% CI: 87.5%, 92.5%) of the group taking supplements during pregnancy doing so daily/almost daily; in the group taking supplements before and during pregnancy, daily/almost daily use was 92.1% (95% CI: 89.5%, 94.7%) before and 93.8% (95% CI: 91.5%, 96.2%) during pregnancy. Multivitamin brand name was reported by 85.1% (n = 821 of 965), whereas the remaining 14.9% who reported prenatal multivitamin use could not recall a specific brand name. Based on brand name and product composition, the median dosage of vitamin D was 400 IU/d (95% range: 250–400 IU/d) both before pregnancy and during pregnancy. Very few (5.0%; 95% CI: 3.7%, 6.4%) mothers took an additional vitamin D supplement during pregnancy.
Propensity score–matched analyses
Among the propensity-matched multivitamin supplement use groups (n = 352/group), the mean propensity score was not different (P = 0.97) between mothers using multivitamin supplements before and during pregnancy and those using multivitamins in pregnancy (Table 2). Mothers were evenly matched based on the criteria used in the propensity procedure (age, population group, education, income, prepregnancy BMI, and parity). However, mothers in the preconception group were more often born in Canada, and fewer delivered their infant during the summer season (Table 2). There were no differences in other maternal characteristics. Family structure (P = 1.00), smoking history (P = 0.26), type of delivery (P = 0.92), and infant birth weight (P = 0.62) were not different between maternal supplement use groups (data not shown).
TABLE 2.
Characteristics according to use of multivitamins preconception and during pregnancy or during pregnancy only in subgroups matched based on propensity scores1
| Variable | Pregnancy only (n = 352) | Preconception + pregnancy (n = 352) | P value | n | Neonatal serum 25(OH)D, nmol/L | P value |
|---|---|---|---|---|---|---|
| Age, y | 32.7 ± 0.2 | 33.2 ± 0.2 | 0.12 | |||
| ≤30 | 81 (23.0) | 87 (24.7) | 0.60 | 168 | 47.2 ± 1.4 | 0.91 |
| >30 | 271 (77.0) | 265 (75.3) | 536 | 48.0 ± 0.8 | ||
| Maternal population group2 | 0.87 | <0.0001 | ||||
| Black | 18 (5.1) | 18 (5.1) | 36 | 36.2 ± 2.33 | ||
| East/Southeast Asian | 18 (5.1) | 17 (4.8) | 35 | 37.4 ± 2.33 | ||
| Latino | 13 (3.7) | 14 (4.0) | 27 | 44.9 ± 3.4 | ||
| Middle Eastern | 32 (9.1) | 29 (8.2) | 61 | 40.0 ± 1.93 | ||
| South Asian | 18 (5.1) | 24 (6.8) | 42 | 42.6 ± 2.13 | ||
| Mixed or unknown heritage | 20 (5.7) | 17 (4.8) | 37 | 47.4 ± 3.0 | ||
| White | 233 (66.2) | 233 (66.2) | 466 | 51.3 ± 0.8 | ||
| Maternal country of birth | 0.0317 | <0.0001 | ||||
| Canada | 218 (61.9) | 246 (69.9) | 464 | 50.4 ± 0.8 | ||
| Elsewhere | 134 (38.1) | 106 (30.1) | 240 | 42.9 ± 1.1 | ||
| Education | 0.81 | 0.82 | ||||
| High school or less | 37 (10.5) | 39 (11.1) | 76 | 47.3 ± 2.2 | ||
| College/university degree | 315 (89.5) | 313 (88.9) | 628 | 47.9 ± 0.7 | ||
| Family income, CAD | 1.00 | 0.0018 | ||||
| <70,000 | 67 (19.0) | 67 (19.0) | 134 | 43.5 ± 1.5 | ||
| ≥70,000 | 224 (63.6) | 224 (63.6) | 448 | 49.5 ± 0.93 | ||
| Not reported/known | 61 (17.3) | 61 (17.3) | 122 | 46.4 ± 1.5 | ||
| Prepregnancy BMI, kg/m2 | 24.6 ± 0.2 | 24.6 ± 0.2 | 0.94 | |||
| <25 | 218 (61.9) | 219 (62.2) | 1.00 | 437 | 49.0 ± 0.8 | 0.0325 |
| ≥25 | 134 (38.1) | 133 (37.8) | 267 | 45.8 ± 1.1 | ||
| Prepregnancy BMI, kg/m2 | 0.84 | 0.08 | ||||
| 18.5–24.9 | 218 (61.9) | 219 (62.2) | 437 | 49.0 ± 0.8 | ||
| 25–29.9 | 100 (28.4) | 95 (27.0) | 195 | 45.4 ± 1.2 | ||
| ≥30.0 | 34 (9.7) | 38 (10.8) | 72 | 47.0 ± 2.3 | ||
| Pregnancy weight gain, kg | 14.3 ± 0.3 | 13.9 ± 0.3 | 0.33 | |||
| Appropriate weight gain | 0.56 | 0.18 | ||||
| Below | 69 (19.6) | 63 (17.9) | 132 | 50.0 ± 1.6 | ||
| Within | 109 (31.0) | 122 (34.7) | 231 | 48.1 ± 1.1 | ||
| Above | 174 (49.3) | 167 (47.4) | 341 | 46.8 ± 1.0 | ||
| Parity | 0.60 | 0.41 | ||||
| Primiparous | 159 (45.2) | 167 (47.4) | 326 | 48.7 ± 0.9 | ||
| Multiparous | 193 (54.8) | 185 (52.6) | 378 | 47.0 ± 0.9 | ||
| SPF products used4 | 0.55 | 0.0004 | ||||
| Yes | 56 (15.9) | 63 (17.9) | 119 | 53.4 ± 1.6 | ||
| No | 296 (84.1) | 289 (82.1) | 585 | 46.7 ± 0.7 | ||
| Sun exposure (hands/face)4 | 0.25 | 0.0002 | ||||
| Yes | 149 (42.3) | 133 (37.8) | 282 | 50.5 ± 1.1 | ||
| No | 203 (57.7) | 219 (62.2) | 422 | 46.0 ± 0.8 | ||
| Exercised in pregnancy5 | 0.33 | 0.0073 | ||||
| Yes | 171 (48.6) | 185 (52.6) | 356 | 49.9 ± 1.0 | ||
| No | 181 (51.4) | 167 (47.4) | 348 | 45.7 ± 0.9 | ||
| Season at birth6 | 0.0203 | <0.0001 | ||||
| Winter | 75 (21.3) | 88 (25.0) | 163 | 46.6 ± 1.5 | ||
| Spring | 84 (23.9) | 104 (29.6) | 188 | 44.9 ± 1.2 | ||
| Summer | 110 (31.3) | 75 (21.3) | 185 | 54.6 ± 1.43 | ||
| Fall | 83 (23.6) | 85 (24.2) | 168 | 44.8 ± 1.1 | ||
| UVB exposure months at birth | 0.40 | 0.0010 | ||||
| 1 April–31 October | 218 (60.8) | 202 (57.4) | 420 | 49.6 ± 0.9 | ||
| 1 November–31 March | 138 (39.2) | 150 (42.6) | 288 | 45.3 ± 1.0 | ||
| Infant serum 25(OH)D, nmol/L | 46.1 ± 0.9 | 49.6 ± 1.0 | 0.0083 | <0.0001 | ||
| <30 | 68 (19.3) | 46 (13.0) | 0.07 | 114 | 23.1 ± 0.4 | |
| 30–39.9 | 63 (17.9) | 64 (18.2) | 127 | 35.5 ± 0.2 | ||
| ≥40 | 221 (62.8) | 242 (68.8) | 463 | 57.3 ± 0.6 | ||
| Propensity score | 0.4540 ± 0.0059 | 0.4543 ± 0.0059 | 0.97 |
Values are mean ± SEM or n (%) unless otherwise indicated. CAD, Canadian dollars; SPF, sun protection factor; UVB, ultraviolet β; 25(OH)D, 25-hydroxyvitamin D.
Maternal self-reported population group according to ancestral origin.
Significant difference (P < 0.05) compared with white, lower income, or other seasons.
Surveyed to reflect third-trimester sun exposure behavior.
Any exercise during pregnancy included any indoor or outdoor activity.
Seasons according to equinox and solstice dates.
Even though the multivitamin use groups were matched for multiple demographic factors, infant serum 25(OH)D varied according to maternal population group with white mothers having infants born with higher concentrations than for black, East/Southeast Asian, Middle Eastern, and South Asian mothers, but not those of Latino or mixed/unknown heritage (Table 2). Other factors associated with higher serum 25(OH)D included Canadian-born mothers, above-median income, having a prepregnancy BMI in the recommended range, and exercising in pregnancy along with use of SPF products, sun exposure, and season of birth. Factors not associated with infant serum 25(OH)D included maternal age, education, weight gain during pregnancy, parity, as well as when prepregnancy BMI was tested as 3 categories (18.5–24.9, 25–29.9, ≥30). Use of multivitamins preconception was associated with higher infant serum 25(OH)D (Table 2). It remained higher in the preconception group (P = 0.0007) when tested in a multivariable model including maternal population group (P < 0.0001), season at birth (P < 0.0001), exercise in pregnancy (P = 0.0475), recommended prepregnancy BMI (<25 compared with above, P = 0.0271), pregnancy weight gain (P = 0.07), age category (P = 0.10), education (P = 0.65), income (P = 0.68), and parity (P = 0.14). Maternal country of birth was explored but did not contribute to the model (P = 0.59), thus it was excluded from the final analysis.
The proportion of infants with serum 25(OH)D < 30 nmol/L (Table 3) in the matched subgroups was lower with maternal preconception use of multivitamins, prepregnancy BMI in the recommended range, summer season at birth, white population groups, and above-median income. Similarly, the proportion of infants with serum 25(OH)D ≥ 40 nmol/L was higher when maternal prepregnancy BMI was in the recommended range, with exercise in pregnancy, summer season at birth, primiparity, and white population groups. In univariate logistic regression, similar factors were observed to influence the odds of having infant serum 25(OH)D < 30 (deficient) or ≥40 nmol/L (adequate). Of the modifiable factors tested together in the multivariable regression, use of prenatal multivitamins was protective against having an infant born with serum 25(OH)D < 30 nmol/L and improved the odds of having serum 25(OH)D ≥ 40 nmol/L, as with achievement of prepregnancy BMI in the recommended range. Exercise was also a protective factor for achieving serum 25(OH)D ≥ 40 nmol/L. Other protective factors against serum 25(OH)D being <30 nmol/L, or in support of achieving serum 25(OH)D ≥ 40 nmol/L, that emerged in the multivariable models included white heritage, maternal age >30 y, and summer season at birth, as well as primiparity for serum 25(OH)D ≥ 40 nmol/L.
TABLE 3.
Protective factors against infants being born with serum 25(OH)D <30 or <40 nmol/L1
| Serum 25(OH)D < 30 nmol/L | Serum 25(OH)D ≥ 40 nmol/L | ||||||||
|---|---|---|---|---|---|---|---|---|---|
| Factor | n | % | P value | Unadjusted OR (95% CI) | Adjusted OR (95% CI)2 | % | P value | Unadjusted OR (95% CI) | Adjusted OR (95% CI)2 |
| Multivitamin use3 | 0.0244 | 0.10 | |||||||
| Preconception + pregnancy | 352 | 13.1 | 0.63 (0.42, 0.94) | 0.55 (0.36, 0.86) | 68.8 | 1.30 (0.95, 1.78) | 1.47 (1.04, 2.07) | ||
| Pregnancy only | 352 | 19.3 | Reference | Reference | 62.8 | Reference | Reference | ||
| Prepregnancy BMI, kg/m2 | 0.0152 | 0.0070 | |||||||
| <25 | 437 | 13.5 | Reference | Reference | 69.6 | Reference | Reference | ||
| ≥25 | 267 | 20.6 | 1.66 (1.11, 2.49) | 1.82 (1.18, 2.81) | 59.6 | 0.64 (0.47, 0.89) | 0.59 (0.42, 0.83) | ||
| Exercise in pregnancy4 | 0.25 | 0.0007 | |||||||
| Yes | 356 | 14.6 | Reference | Reference | 71.6 | Reference | Reference | ||
| No | 348 | 17.8 | 1.27 (0.85, 1.90) | 1.08 (0.69, 1.68) | 59.8 | 0.59 (0.43, 0.81) | 0.69 (0.49, 0.97) | ||
| Season at birth5 | 0.0100 | 0.0002 | |||||||
| Winter | 163 | 22.1 | 2.80 (1.51, 5.21) | 3.58 (1.84, 6.94) | 60.7 | 0.43 (0.27, 0.68) | 0.34 (0.21, 0.57) | ||
| Spring | 188 | 18.1 | 2.18 (1.17, 4.06) | 2.61 (1.34, 5.09) | 58.0 | 0.38 (0.24, 0.60) | 0.31 (0.19, 0.51) | ||
| Summer | 185 | 9.2 | Reference | Reference | 78.4 | Reference | Reference | ||
| Fall | 168 | 16.1 | 1.89 (0.99, 3.61) | 2.40 (1.21, 4.79) | 65.5 | 0.52 (0.33, 0.84) | 0.39 (0.23, 0.65) | ||
| Parity | 0.61 | 0.0468 | |||||||
| Primiparous | 326 | 15.3 | Reference | Reference | 69.6 | Reference | Reference | ||
| Multiparous | 378 | 16.9 | 1.13 (0.75, 1.69) | 1.27 (0.79, 2.05) | 62.4 | 0.73 (0.53, 0.99) | 0.67 (0.46, 0.96) | ||
| Maternal population group6 | <0.0001 | <0.0001 | |||||||
| Black | 36 | 36.1 | 4.74 (2.26, 9.96) | 5.58 (2.50, 12.47) | 36.1 | 0.20 (0.10, 0.40) | 0.16 (0.07, 0.34) | ||
| East/Southeast Asian | 35 | 34.3 | 4.38 (2.05, 9.34) | 5.22 (2.25, 12.10) | 40.0 | 0.23 (0.11, 0.47) | 0.20 (0.09, 0.42) | ||
| Latino | 27 | 18.5 | 1.91 (0.69, 5.26) | 2.09 (0.72, 6.04) | 51.9 | 0.37 (0.17, 0.81) | 0.38 (0.17, 0.87) | ||
| Middle Eastern | 67 | 28.4 | 3.32 (1.81, 6.10) | 3.81 (1.94, 7.46) | 46.3 | 0.30 (0.18, 0.50) | 0.25 (0.14, 0.45) | ||
| South Asian | 42 | 19.1 | 1.97 (0.87, 4.50) | 2.64 (1.10, 6.35) | 59.5 | 0.51 (0.27, 0.97) | 0.36 (0.18, 0.72) | ||
| Mixed or unknown | 37 | 21.6 | 2.31 (1.00, 5.34) | 2.63 (1.08, 6.38) | 64.9 | 0.64 (0.31, 1.29) | 0.50 (0.24, 1.07) | ||
| White | 460 | 10.7 | Reference | Reference | 74.4 | Reference | Reference | ||
| Maternal age, y | 0.19 | 0.3071 | |||||||
| ≤30 | 168 | 19.6 | 1.37 (0.88, 2.15) | 1.75 (1.03, 2.97) | 26.1 | 1.21 (0.84, 1.73) | 0.60 (0.39, 0.91) | ||
| >30 | 536 | 15.1 | Reference | Reference | 33.2 | Reference | Reference | ||
| Maternal education | 0.41 | 0.90 | |||||||
| High school or less | 76 | 19.7 | 0.76 (0.42, 1.39) | 0.84 (0.43, 1.65) | 32.9 | 1.07 (0.65, 1.77) | 0.84 (0.47, 1.48) | ||
| Postsecondary | 628 | 15.8 | Reference | Reference | 34.4 | Reference | Reference | ||
| Family income, CAD | 0.0056 | 0.11 | |||||||
| <70,000 | 134 | 25.4 | 2.04 (1.27, 3.27) | 1.11 (0.65, 1.91) | 41.8 | 1.53 (1.03, 2.28) | 1.17 (0.74, 1.85) | ||
| ≥70,000 | 448 | 14.3 | Reference | Reference | 31.9 | Reference | Reference | ||
| Not reported | 122 | 13.1 | 0.91 (0.50, 1.63) | 0.53 (0.28, 1.02) | 34.4 | 1.12 (0.73, 1.71) | 1.53 (0.94, 2.50) | ||
Values are n and row percentages or ORs (95% CIs) unless otherwise indicated. CAD, Canadian dollars; 25(OH)D, 25-hydroxyvitamin D.
Adjusted for all other independent variables in the table.
Surveyed as multivitamin used in the 3 mo before conceiving; and used during pregnancy.
Any exercise during pregnancy included any indoor or outdoor activity.
Seasons according to equinox and solstice dates.
Maternal self-reported population group according to ancestral origin.
Discussion
The vitamin D status of infants remains a public health concern in Canada and globally (37). Reports regarding the vitamin D status of newborns in Canada reflect predominantly European heritage. The present report of infants from a diverse sociodemographic population highlights that the majority were born with adequate vitamin D stores, defined as a serum 25(OH)D concentration ≥ 40 nmol/L (1). Nonetheless, a concerning proportion (20.8%) were born with serum 25(OH)D in the deficient range <30 nmol/L, with evidence of health inequity based on higher proportions of infants having vitamin D deficiency in all population groups than for those of white mothers. This is important because exposure to adequate vitamin D is implicated in neurodevelopment (38), tooth enamel formation (39), body composition (40), and preventing nutritional rickets (41).
Adherence to current public health recommendations for a healthy pregnancy including being physically active, achievement of the recommended BMI (14, 15), and use of multivitamin supplements (16) was associated with higher newborn vitamin D status in our study. The majority of mothers in all population groups had a prepregnancy BMI in the recommended range (52.6%–63.8%) and showed higher receptivity for multivitamin use (86.1%–96.9%) than for exercise (38.9%–56.1%). The US NHANES is among few to report on the vitamin D status of a large sample of pregnant women of diverse ancestry (42). Although ethnic disparities were clearly evident, overall, the proportion of women using a multivitamin increased during pregnancy (61%–86%) and by the third trimester, 82% had 25(OH)D ≥ 50 nmol/L, which has been shown to protect against neonatal vitamin D deficiency (2). The authors concluded that higher dosages or a longer duration of supplementation may be required, although vitamin D status of the newborn was not assessed. The most prominent modifiable factor that increases maternal vitamin D status, and consequently maternal–fetal transfer of vitamin D, is prenatal use of a multivitamin containing vitamin D (5, 7, 20).
In Canada, compliance with multivitamin use in pregnancy is high at 90% (43), and typically these contain 400 IU vitamin D, as found in our study and others (7, 44). Less information is available for preconception use of multivitamins (43). Our study adds that use of multivitamins before pregnancy varied (29.2%–43.6%) according to population group. This practice was ∼8%–14% higher in white than in all other population groups in association with 8%–27% fewer infants of white mothers having vitamin D deficiency, which suggests an advantage due to a longer exposure of infants to maternal supplementation and improvements in vitamin D status before pregnancy. In a recent trial, maternal vitamin D supplementation (400–800 IU/d) from ∼13 weeks of pregnancy to term corresponded to cord serum 25(OH)D < 30 nmol/L in the majority of pregnancies with baseline 25(OH)D < 50 nmol/L (45). Although multivitamins are well-received by women planning a pregnancy (46), the benefit to neonatal vitamin D status requires further study.
In the absence of a randomized controlled trial testing for the benefits of maternal multivitamin use preconception compared with during pregnancy on vitamin D status, we conducted a nonrandomized analysis using propensity scores to minimize the impact of sociodemographic characteristics (36). Compared with infants of mothers who used multivitamins during pregnancy, using a multivitamin both before and during pregnancy was more likely to protect against vitamin D deficiency and aligned more strongly with adequate vitamin D status. Protection remained evident in multivariable analyses that accounted for other important variables including maternal population group, prepregnancy BMI, exercise, age, parity, and season at birth. This underscores the importance of national dietary guidance (16) that advises women who could become (i.e., preconception) or are pregnant to take a daily multivitamin.
Exogenous intakes of vitamin D are important when endogenous synthesis is limited (1) because of residing at higher latitudes (i.e., shorter summers) or higher amounts of melanin in the skin as is characteristic of many population groups (47). It is accepted that SPF product application does not fully prevent vitamin D synthesis (30), which is consistent with our observations that SPF product use and sun exposure were associated with 5- to 7.5-nmol/L higher serum 25(OH)D. Serum 25(OH)D in summer-born infants was ∼10 nmol/L higher than for all other seasons, a disparity of similar magnitude to the differences between population groups. Canadian surveys report 16-nmol/L differences in 25(OH)D between population groups, and 10-nmol/L differences in 25(OH)D from winter to summer (19). In agreement with pregnancy cohorts (3, 7), maternal exercise (in- or outdoors) was a correlate of neonatal vitamin D status. Exercise may reflect other healthy behaviors that cluster in pregnancy (48), potentially mobilization of vitamin D stores (49), and is encouraged as part of a healthy lifestyle in pregnant women without contraindications (14).
Most guidelines for a healthy pregnancy do not specifically recommend vitamin D supplementation for women with elevated BMI (15, 50), rather these suggest a nutritional consultation to establish if additional supplementation is required. There is evidence (51) that pregnant women with elevated BMI do not adhere to multivitamins, and that serum 25(OH)D is lower in both mother (5, 7, 52, 53) and infant (7, 54). In our study, prepregnancy BMI ≥ 25 was also associated with lower (by 4.9 nmol/L) neonatal 25(OH)D concentration. Recent studies have demonstrated that women with elevated BMI and using multivitamins have adequate vitamin D status (55, 56). The benefits of initiating multivitamins preconception were further suggested in our study and confirmed in the matched-subgroup analysis where BMI was not different between groups. Thus, recommendations for a healthy pregnancy should include a multivitamin before or as soon as possible during pregnancy for women of all BMI categories (46).
This study has several limitations including a single center, healthy mothers, and term-born AGA infants. Infant birth weight approximated the mean birth weight for newborns born at 39–40 weeks of gestation from Quebec (3489 g; 95% CI: 3489, 3491 g) and Canada (3509 g; 95% CI: 3509, 3510 g) (13). Maternal age and parity paralleled Canadian statistics (57), 52.7% had above the median Canadian income at the time of the study (27), and the proportion of infants born to immigrant women in the present study and Canada in 2016 surpassed 30% (13). In contrast, mothers were more highly educated in our study than reported for Canada (57). Pregnancy history was from the medical record; although the accuracy of maternal prepregnancy BMI is unclear, the proportion with a BMI ≥ 30 (12.7%) was consistent with national data (12.1%; 95% CI: 10.9%, 13.4%) (43). The retrospective survey precluded verification of supplement dose and exact timing of initiation and is thus subject to recall bias, and maternal vitamin D status was not assessed at delivery. The assay used to measure serum 25(OH)D is not the gold-standard and may overestimate 25(OH)D in cord blood samples (58). To mitigate this, we used rigorous quality assurance measures and standardized 25(OH)D concentrations to NIST reference materials (33, 34) and capillary sampling.
This study of newborn infants from a large metropolitan center enabled us to evaluate multiple maternal and sociodemographic factors associated with neonatal vitamin D status. The mean serum 25(OH)D was within the recommended 40–50 nmol/L for infants and 20.8% were at risk of vitamin D deficiency symptoms (<30 nmol/L) (1). Maternal preconception use of a multivitamin supplement is a readily modifiable factor associated with greater odds of newborn infants having adequate vitamin D status. Studies to establish whether public health policy should specifically encourage multivitamins containing vitamin D in women of reproductive age before as well as during pregnancy would be of value to help improve the vitamin D status of newborn infants and to reduce health inequity among all population groups.
Supplementary Material
Acknowledgments
We thank the following people for their long-standing contributions to the research for recruitment (Veronique Menard, Erika de Risi, Kristina Mullahoo, Laura Glenn, and Zahra Farahnak) or laboratory measurements (Paula Lavery and Sherry Agellon). The authors’ responsibilities were as follows—HAW, CAV, DM, and SQW: designed the research; HAW, CAV, NG, MR, and SP: conducted the research; HAW and CAV: analyzed the data or performed the statistical analysis; HAW, DM, and SQW: wrote the paper; HAW: had primary responsibility for the final content; and all authors: contributed to the development of the overall research plan and/or study oversight and read and approved the final manuscript.
Notes
Supported by Canadian Institutes of Health Research grant MOP-142391 (to HAW). At the time of the research (2015–2018), HAW was supported by Canada Research Chairs Program salary award 950-230633; NG and MR received Graduate Excellence Fellowships from McGill University; and SP received a Fonds de recherche santé Québec scholarship. The funding agencies had no role in the design or conduct of the research.
Author disclosures: the authors report no conflicts of interest.
HAW is a member of the Journal's Editorial Board.
Supplemental Figure 1 and Supplemental Tables 1 and 2 are available from the “Supplementary data” link in the online posting of the article and from the same link in the online table of contents at https://academic.oup.com/jn/.
Abbreviations used: AGA, appropriate for gestational age; CLIA, chemiluminescence immunoassay; DEQAS, Vitamin D External Quality Assessment Scheme; GA, gestational age; NIST, National Institute of Standards and Technology; SPF, sun protection factor; SRM, Standard Reference Materials; UVB, ultraviolet β; 25(OH)D, 25-hydroxyvitamin D.
Contributor Information
Hope A Weiler, Nutrition Research Division, Bureau of Nutritional Sciences, Health Products and Food Branch, Health Canada, Ottawa, Ontario, Canada; School of Human Nutrition, McGill University, Ste Anne de Bellevue, Québec, Canada.
Catherine A Vanstone, School of Human Nutrition, McGill University, Ste Anne de Bellevue, Québec, Canada.
Maryam Razaghi, School of Human Nutrition, McGill University, Ste Anne de Bellevue, Québec, Canada.
Nathalie Gharibeh, School of Human Nutrition, McGill University, Ste Anne de Bellevue, Québec, Canada.
Sharina Patel, School of Human Nutrition, McGill University, Ste Anne de Bellevue, Québec, Canada.
Shu Q Wei, Québec National Institute of Public Health, Montréal, Québec, Canada.
Dayre McNally, Division of Critical Care, Department of Pediatrics, University of Ottawa, Ottawa, Ontario, Canada.
Data Availability
The data described in the article will not be made available because permission to share data was not requested at the time of obtaining participant consent.
References
- 1. Institute of Medicine (US) Committee to Review Dietary Reference Intakes for Vitamin D and Calcium; Ross AC, Taylor CL, Yaktine AL, Del Valle HB editors. Dietary Reference Intakes for calcium and vitamin D. Washington (DC): National Academies Press; 2011. [PubMed] [Google Scholar]
- 2. O'Callaghan KM, Hennessy A, Hull GLJ, Healy K, Ritz C, Kenny LC, Cashman KD, Kiely ME. Estimation of the maternal vitamin D intake that maintains circulating 25-hydroxyvitamin D in late gestation at a concentration sufficient to keep umbilical cord sera ≥25–30 nmol/L: a dose-response, double-blind, randomized placebo-controlled trial in pregnant women at northern latitude. Am J Clin Nutr. 2018;108(1):77–91. [DOI] [PMC free article] [PubMed] [Google Scholar]
- 3. Kramer CK, Ye C, Swaminathan B, Hanley AJ, Connelly PW, Sermer M, Zinman B, Retnakaran R. The persistence of maternal vitamin D deficiency and insufficiency during pregnancy and lactation irrespective of season and supplementation. Clin Endocrinol (Oxf). 2016;84(5):680–6. [DOI] [PubMed] [Google Scholar]
- 4. Li W, Green TJ, Innis SM, Barr SI, Whiting SJ, Shand A, von Dadelszen P. Suboptimal vitamin D levels in pregnant women despite supplement use. Can J Public Health. 2011;102(4):308–12. [DOI] [PMC free article] [PubMed] [Google Scholar]
- 5. Perreault M, Moore CJ, Fusch G, Teo KK, Atkinson SA. Factors associated with serum 25-hydroxyvitamin D concentration in two cohorts of pregnant women in Southern Ontario, Canada. Nutrients. 2019;11(1):123. [DOI] [PMC free article] [PubMed] [Google Scholar]
- 6. Weiler HA, Brooks SPJ, Sarafin K, Fisher M, Massarelli I, Luong TM, Johnson M, Morisset AS, Dodds L, Taback S et al. Early prenatal use of a multivitamin diminishes the risk for inadequate vitamin D status in pregnant women: results from the Maternal-Infant Research on Environmental Chemicals (MIREC) cohort study. Am J Clin Nutr. 2021;114(3):1238–50. [DOI] [PMC free article] [PubMed] [Google Scholar]
- 7. Woolcott CG, Giguère Y, Weiler HA, Spencer A, Forest JC, Armson BA, Dodds L. Determinants of vitamin D status in pregnant women and neonates. Can J Public Health. 2016;107(4–5):e410–16. [DOI] [PMC free article] [PubMed] [Google Scholar]
- 8. Aghajafari F, Field CJ, Rabi D, Kaplan BJ, Maggiore JA, O'Beirne M, Hanley DA, Eliasziw M, Dewey D, Ross S et al. Plasma 3-epi-25-hydroxycholecalciferol can alter the assessment of vitamin D status using the current reference ranges for pregnant women and their newborns. J Nutr. 2016;146(1):70–5. [DOI] [PubMed] [Google Scholar]
- 9. Newhook LA, Sloka S, Grant M, Randell E, Kovacs CS, Twells LK. Vitamin D insufficiency common in newborns, children and pregnant women living in Newfoundland and Labrador, Canada. Matern Child Nutr. 2009;5(2):186–91. [DOI] [PMC free article] [PubMed] [Google Scholar]
- 10. Waiters B, Godel JC, Basu TK. Perinatal vitamin D and calcium status of northern Canadian mothers and their newborn infants. J Am Coll Nutr. 1999;18(2):122–6. [DOI] [PubMed] [Google Scholar]
- 11. Weiler H, Fitzpatrick-Wong S, Veitch R, Kovacs H, Schellenberg J, McCloy U, Yuen CK. Vitamin D deficiency and whole-body and femur bone mass relative to weight in healthy newborns. Can Med Assoc J. 2005;172(6):757–61. [DOI] [PMC free article] [PubMed] [Google Scholar]
- 12. Statistics Canada. Census profile. 2016 Census. Catalogue no. 98-316-X2016001. [Internet]. Ottawa, Canada: Statistics Canada; 2017 (accessed April 22, 2020). Available from: https://www12.statcan.gc.ca/census-recensement/2016/dp-pd/prof/details/page.cfm?Lang=E&Geo1=PR&Code1=01&Geo2=PR&Code2=01&SearchText=01&SearchType=Begins&SearchPR=01&B1=Visible%20minority&TABID=3&type=1. [Google Scholar]
- 13. Boram Lee J, Hinds A, Urquia ML. Provincial variations in birth outcomes according to maternal country of birth, 2000 to 2016. Health Rep. 2020;31(4):13–21. [DOI] [PubMed] [Google Scholar]
- 14. Davies GAL, Wolfe LA, Mottola MF, MacKinnon C. No. 129-Exercise in pregnancy and the postpartum period. J Obstet Gynaecol Can. 2018;40(2):e58–65. [DOI] [PubMed] [Google Scholar]
- 15. Vitner D, Harris K, Maxwell C, Farine D. Obesity in pregnancy: a comparison of four national guidelines. J Matern Fetal Neonatal Med. 2019;32(15):2580–90. [DOI] [PubMed] [Google Scholar]
- 16. Health Canada. Prenatal nutrition guidelines for health professionals. Ottawa, Canada: Health Canada; 2009. [Google Scholar]
- 17. Kowal C, Kuk J, Tamim H. Characteristics of weight gain in pregnancy among Canadian women. Matern Child Health J. 2012;16(3):668–76. [DOI] [PubMed] [Google Scholar]
- 18. Sarafin K, Durazo-Arvizu R, Tian L, Phinney KW, Tai S, Camara JE, Merkel J, Green E, Sempos CT, Brooks SP. Standardizing 25-hydroxyvitamin D values from the Canadian Health Measures Survey. Am J Clin Nutr. 2015;102(5):1044–50. [DOI] [PMC free article] [PubMed] [Google Scholar]
- 19. Brooks SPJ, Greene-Finestone L, Whiting S, Fioletov VE, Laffey P, Petronella N. An analysis of factors associated with 25-hydroxyvitamin D levels in white and non-white Canadians. J AOAC Int. 2017;100(5):1345–54. [DOI] [PubMed] [Google Scholar]
- 20. Aghajafari F, Field CJ, Kaplan BJ, Rabi DM, Maggiore JA, O'Beirne M, Hanley DA, Eliasziw M, Dewey D, Weinberg A et al. The current recommended vitamin D intake guideline for diet and supplements during pregnancy is not adequate to achieve vitamin D sufficiency for most pregnant women. PLoS One. 2016;11(7):e0157262. [DOI] [PMC free article] [PubMed] [Google Scholar]
- 21. Arbuckle TE, Fraser WD, Fisher M, Davis K, Liang CL, Lupien N, Bastien S, Velez MP, von Dadelszen P, Hemmings DG et al. Cohort profile: the Maternal-Infant Research on Environmental Chemicals research platform. Paediatr Perinat Epidemiol. 2013;27(4):415–25. [DOI] [PubMed] [Google Scholar]
- 22. Goldstein E, Bakhireva LN, Nervik K, Hagen S, Turnquist A, Zgierska AE, Marquez LE, McDonald R, Lo J, Chambers C. Recruitment and retention of pregnant women in prospective birth cohort studies: a scoping review and content analysis of the literature. Neurotoxicol Teratol. 2021;85:106974. [DOI] [PMC free article] [PubMed] [Google Scholar]
- 23. Kramer MS, Platt RW, Wen SW, Joseph KS, Allen A, Abrahamowicz M, Blondel B, Bréart G; Fetal/Infant Health Study Group of the Canadian Perinatal Surveillance System . A new and improved population-based Canadian reference for birth weight for gestational age. Pediatrics. 2001;108(2):e35. [DOI] [PubMed] [Google Scholar]
- 24. Canadian Institute for Health Information (CIHI). Proposed standards for race-based and indigenous identity data collection and health reporting in Canada. Ottawa, Canada: CIHI; 2020. [Google Scholar]
- 25. Schneuer FJ, Roberts CL, Guilbert C, Simpson JM, Algert CS, Khambalia AZ, Tasevski V, Ashton AW, Morris JM, Nassar N. Effects of maternal serum 25-hydroxyvitamin D concentrations in the first trimester on subsequent pregnancy outcomes in an Australian population. Am J Clin Nutr. 2014;99(2):287–95. [DOI] [PubMed] [Google Scholar]
- 26. Krieger J-P, Cabaset S, Canonica C, Christoffel L, Richard A, Schröder T, von Wattenwyl BL, Rohrmann S, Lötscher KQ. Prevalence and determinants of vitamin D deficiency in the third trimester of pregnancy: a multicentre study in Switzerland. Br J Nutr. 2018;119(3):299–309. [DOI] [PubMed] [Google Scholar]
- 27. Statistics Canada. Table 11-10-0190-01 Market income, government transfers, total income, income tax and after-tax income by economic family type. Ottawa, Canada: Statistics Canada; 2018. [Google Scholar]
- 28. Rasmussen KM, Catalano PM, Yaktine AL. New guidelines for weight gain during pregnancy: what obstetrician/gynecologists should know. Curr Opin Obstet Gynecol. 2009;21(6):521–6. [DOI] [PMC free article] [PubMed] [Google Scholar]
- 29. World Health Organization. WHO AnthroPlus for personal computers manual: software for assessing growth of the world's children and adolescents. [Internet]. Geneva, Switzerland: WHO; 2009 (accessed April 22, 2020). Available from: http://www.who.int/growthref/tools/en/. [Google Scholar]
- 30. Young AR, Narbutt J, Harrison GI, Lawrence KP, Bell M, O'Connor C, Olsen P, Grys K, Baczynska KA, Rogowski-Tylman M et al. Optimal sunscreen use, during a sun holiday with a very high ultraviolet index, allows vitamin D synthesis without sunburn. Br J Dermatol. 2019;181(5):1052–62. [DOI] [PMC free article] [PubMed] [Google Scholar]
- 31. Webb AR, DeCosta BR, Holick MF. Sunlight regulates the cutaneous production of vitamin D3 by causing its photodegradation. J Clin Endocrinol Metab. 1989;68(5):882–7. [DOI] [PubMed] [Google Scholar]
- 32. Cohen M, Ryan B. Observations less than the analytical limit of detection: a new approach. JAPCA. 1989;39(3):328–9. [Google Scholar]
- 33. Cashman KD, Kiely M, Kinsella M, Durazo-Arvizu RA, Tian L, Zhang Y, Lucey A, Flynn A, Gibney MJ, Vesper HW et al. Evaluation of Vitamin D Standardization Program protocols for standardizing serum 25-hydroxyvitamin D data: a case study of the program's potential for national nutrition and health surveys. Am J Clin Nutr. 2013;97(6):1235–42. [DOI] [PMC free article] [PubMed] [Google Scholar]
- 34. Phinney KW, Sempos CT, Tai SS-C, Camara JE, Wise SA, Eckfeldt JH, Hoofnagle AN, Carter GD, Jones J, Myers GL et al. Baseline assessment of 25-hydroxyvitamin D reference material and proficiency testing/external quality assurance material commutability: a Vitamin D Standardization Program study. J AOAC Int. 2017;100(5):1288–93. [DOI] [PubMed] [Google Scholar]
- 35. Pourhoseingholi MA, Vahedi M, Rahimzadeh M. Sample size calculation in medical studies. Gastroenterol Hepatol Bed Bench. 2013;6(1):14–17. [PMC free article] [PubMed] [Google Scholar]
- 36. Austin PC. An introduction to propensity score methods for reducing the effects of confounding in observational studies. Multivariate Behav Res. 2011;46(3):399–424. [DOI] [PMC free article] [PubMed] [Google Scholar]
- 37. Sotunde OF, Laliberte A, Weiler HA. Maternal risk factors and newborn infant vitamin D status: a scoping literature review. Nutr Res. 2019;63:1–20. [DOI] [PubMed] [Google Scholar]
- 38. Mutua AM, Mogire RM, Elliott AM, Williams TN, Webb EL, Abubakar A, Atkinson SH. Effects of vitamin D deficiency on neurobehavioural outcomes in children: a systematic review. Wellcome Open Res. 2020;5:28. [DOI] [PMC free article] [PubMed] [Google Scholar]
- 39. Schroth RJ, Christensen J, Morris M, Gregory P, Mittermuller B-A, Rockman-Greenberg C. The influence of prenatal vitamin D supplementation on dental caries in infants. J Can Dent Assoc. 2020;86:k13. [PubMed] [Google Scholar]
- 40. Ma K, Wei SQ, Bi WG, Weiler HA, Wen SW. Effect of vitamin D supplementation in early life on children's growth and body composition: a systematic review and meta-analysis of randomized controlled trials. Nutrients. 2021;13(2):524. [DOI] [PMC free article] [PubMed] [Google Scholar]
- 41. Critch JN, Canadian Paediatric Society, Nutrition and Gastroenterology Committee . Nutrition for healthy term infants, six to 24 months: an overview. Paediatr Child Health. 2014;19(10):547–52. [PMC free article] [PubMed] [Google Scholar]
- 42. Ginde AA, Sullivan AF, Mansbach JM, Camargo CA Jr. Vitamin D insufficiency in pregnant and nonpregnant women of childbearing age in the United States. Am J Obstet Gynecol. 2010;202(5):436.e1–8. [DOI] [PMC free article] [PubMed] [Google Scholar]
- 43. Public Health Agency of Canada. What mothers say: the Canadian Maternity Experiences Survey. Ottawa, Canada: Public Health Agency of Canada; 2009. [Google Scholar]
- 44. Morisset AS, Weiler HA, Dubois L, Ashley-Martin J, Shapiro GD, Dodds L, Massarelli I, Vigneault M, Arbuckle TE, Fraser WD. Rankings of iron, vitamin D, and calcium intakes in relation to maternal characteristics of pregnant Canadian women. Appl Physiol Nutr Metab. 2016;41(7):749–57. [DOI] [PubMed] [Google Scholar]
- 45. Alhomaid RM, Mulhern MS, Strain J, Laird E, Healy M, Parker MJ, McCann MT. Maternal obesity and baseline vitamin D insufficiency alter the response to vitamin D supplementation: a double-blind, randomized trial in pregnant women. Am J Clin Nutr. 2021;114(3):1208–18. [DOI] [PMC free article] [PubMed] [Google Scholar]
- 46. Green-Raleigh K, Lawrence JM, Chen H, Devine O, Prue C. Pregnancy planning status and health behaviors among nonpregnant women in a California managed health care organization. Perspect Sex Reprod Health. 2005;37(4):179–83. [DOI] [PubMed] [Google Scholar]
- 47. Mendes MM, Darling AL, Hart KH, Morse S, Murphy RJ, Lanham-New SA. Impact of high latitude, urban living and ethnicity on 25-hydroxyvitamin D status: a need for multidisciplinary action?. J Steroid Biochem Mol Biol. 2019;188:95–102. [DOI] [PubMed] [Google Scholar]
- 48. Jawad A, Patel D, Brima N, Stephenson J. Alcohol, smoking, folic acid and multivitamin use among women attending maternity care in London: a cross-sectional study. Sex Reprod Healthc. 2019;22:100461. [DOI] [PubMed] [Google Scholar]
- 49. Hengist A, Perkin O, Gonzalez JT, Betts A, Hewison M, Manolopoulos KN, Jones KS, Koulman A, Thompson D. Mobilising vitamin D from adipose tissue: the potential impact of exercise. Nutr Bull. 2019;44:25–35. [DOI] [PMC free article] [PubMed] [Google Scholar]
- 50. Hynes C, Jesurasa A, Evans P, Mitchell C. Vitamin D supplementation for women before and during pregnancy: an update of the guidelines, evidence, and role of GPs and practice nurses. Br J Gen Pract. 2017;67(662):423–4. [DOI] [PMC free article] [PubMed] [Google Scholar]
- 51. Masho SW, Bassyouni A, Cha S. Pre-pregnancy obesity and non-adherence to multivitamin use: findings from the National Pregnancy Risk Assessment Monitoring System (2009–2011). BMC Pregnancy Childbirth. 2016;16(1):210. [DOI] [PMC free article] [PubMed] [Google Scholar]
- 52. Burris HH, Thomas A, Zera CA, McElrath TF. Prenatal vitamin use and vitamin D status during pregnancy, differences by race and overweight status. J Perinatol. 2015;35(4):241–5. [DOI] [PMC free article] [PubMed] [Google Scholar]
- 53. Tomedi LE, Chang C-CH, Newby PK, Evans RW, Luther JF, Wisner KL, Bodnar LM. Pre-pregnancy obesity and maternal nutritional biomarker status during pregnancy: a factor analysis. Public Health Nutr. 2013;16(8):1414–18. [DOI] [PMC free article] [PubMed] [Google Scholar]
- 54. Josefson JL, Reisetter A, Scholtens DM, Price HE, Metzger BE, Langman CB, HAPO Study Cooperative Research Group . Maternal BMI associations with maternal and cord blood vitamin D levels in a North American subset of Hyperglycemia and Adverse Pregnancy Outcome (HAPO) study participants. PLoS One. 2016;11(3):e0150221. [DOI] [PMC free article] [PubMed] [Google Scholar]
- 55. Perreault M, Atkinson SA, Meyre D, Fusch G, Mottola MF, BHIP Study Team . Summer season and recommended vitamin D intake support adequate vitamin D status throughout pregnancy in healthy Canadian women and their newborns. J Nutr. 2020;150(4):739–46. [DOI] [PubMed] [Google Scholar]
- 56. Savard C, Bielecki A, Plante A-S, Lemieux S, Gagnon C, Weiler H, Morisset A-S. Longitudinal assessment of vitamin D status across trimesters of pregnancy. J Nutr. 2021;151(7):1937–46. [DOI] [PMC free article] [PubMed] [Google Scholar]
- 57. Bushnik T, Yang S, Kaufman JS, Kramer MS, Wilkins R. Socioeconomic disparities in small-for-gestational-age birth and preterm birth. Health Rep. 2017;28(11):3–10. [PubMed] [Google Scholar]
- 58. Lu M, Hollis BW, Carey VJ, Laranjo N, Singh RJ, Weiss ST, Litonjua AA. Determinants and measurement of neonatal vitamin D: overestimation of 25(OH)D in cord blood using CLIA assay technology. J Clin Endocrinol Metab. 2020;105(4):e1085–92. [DOI] [PMC free article] [PubMed] [Google Scholar]
Associated Data
This section collects any data citations, data availability statements, or supplementary materials included in this article.
Supplementary Materials
Data Availability Statement
The data described in the article will not be made available because permission to share data was not requested at the time of obtaining participant consent.