Abstract
The pathogenesis of severe acute respiratory syndrome coronavirus 2 (SARS-CoV-2) is not completely understood. SARS-CoV-2 infection frequently causes significant immune function consequences including reduced T cell numbers and enhanced T cell exhaustion that contribute to disease severity. The extent to which T cell effects are directly mediated through infection or indirectly result from infection of respiratory-associated cells is unclear. We show that primary human T cells express sufficient levels of angiotensin converting enzyme 2 (ACE-2), the SARS-CoV-2 receptor, to mediate viral binding and entry into T cells. We further show that T cells exposed to SARS-CoV-2 particles demonstrate reduced proliferation and apoptosis compared to uninfected controls, indicating that direct interaction of SARS-CoV-2 with T cells may alter T cell growth, activation, and survival. Regulation of T cell activation and/or turnover by SARS-CoV-2 may contribute to impaired T cell function observed in patients with severe disease.
Keywords: ACE2, SARS-CoV-2, T lymphocytes
No specific interaction between SARS-CoV-2 and T-cells is described. SARS-CoV-2 receptor (ACE-2) mRNA and protein were expressed in T-cells, and expression increased following T-cell activation. ACE-2 also mediated SARS-CoV-2 and spike protein entry, resulting in altering T-cell proliferation and apoptosis.
Severe acute respiratory syndrome coronavirus 2 (SARS-CoV-2) infection ranges in clinical severity from asymptomatic infection to severe respiratory distress [1]. While SARS-CoV-2 infection is often characterized by inflammation-related respiratory tract damage, extrapulmonary effects, including cytokine storm and dysregulation of T-cell differentiation, are also described [2–4]. A hallmark of severe SARS-CoV-2 infection is lymphopenia and T-cell exhaustion. Direct interactions of SARS-CoV-2 with T cells could contribute to this reduced T-cell number and exhaustion accompanying coronavirus disease 2019 (COVID-19) disease [5, 6].
SARS-CoV-2 binds to cells via interactions between its spike protein and the cell surface receptor angiotensin-converting enzyme 2 (ACE2) [7]. Expression of ACE2 in various respiratory-associated cell populations has been extensively studied [8, 9]; however, the expression of ACE2 by T lymphocytes is not known conclusively. Although some flow cytometry and RNA sequencing studies have found that most immune cells, including T lymphocytes, contain low or undetectable expression of ACE2 [10, 11], other studies have demonstrated ACE2 expression on human T cells using either flow cytometry [12] or single-cell RNA sequencing [13]. A 2020 report in medRxiv suggested that low levels of ACE2, in conjunction with transmembrane serine protease 2 (TMPRSS2) and CD4, mediates SARS-CoV-2 entry into CD4+ T lymphocytes [14]. In that study, interleukin 10 expression was impaired following entry of SARS-CoV-2 into T cells, suggesting that direct T-cell interactions may contribute to the poor adaptive immune response observed in many patients with COVID-19 [14, 15].
To further characterize T cells for ACE2 expression and assess potential functional consequences of SARS-CoV-2 binding to T-cell ACE2, we directly measured ACE2 RNA and protein expression in primary human T lymphocytes and in an immortalized CD4+ T-cell line (Jurkat). We found that T cells express approximately 1000 ACE2 molecules on their surface and interestingly, T-cell activation, either by stimulation of the T-cell receptor (TCR) or by nonspecific mitogen (phorbol myristate acetate [PMA] and ionomycin), significantly increased ACE2 expression levels. ACE2 levels on T lymphocytes were sufficient to mediate SARS-CoV-2 binding and entry, and this SARS-CoV-2 internalization significantly reduced T-cell proliferation and apoptosis. These data indicate that SARS-CoV-2 directly interacts with T cells via ACE2, and this may contribute to the immune dysregulation observed in COVID-19 illness.
METHODS
Human Subjects
All protocols involving human subjects were reviewed and approved by the University of Iowa Institutional Review Board (IRB-01). All human subjects were adults who provided written informed consent.
Cells
Vero E6 (provided by Wendy Maury, PhD, University of Iowa), Vero (American Type Culture Collection), Ramos-B (American Type Culture Collection), and Jurkat E6.1 T cells were maintained in medium, as described elsewhere [16]. Human peripheral blood mononuclear cells (PBMCs) were obtained from healthy blood donors, as described elsewhere, or from the University of Iowa DeGowin Blood Center and were prepared using Histopaque (Sigma-Aldrich) purification [17]. CD3+ or CD4+ T cells were further purified (>90%) from PBMCs by negative selection (R&D Systems), with purity assessed by means of flow cytometry (Supplementary Figure 1). Jurkat cells were activated with 1-µg/mL anti-CD3 (Invitrogen) and anti-CD28 (BD Biosciences) or 50-ng/mL PMA (Tocris Bioscience) and 1-µg/mL ionomycin (Alfa Aesar). Primary cells (1 million cells/mL) were activated with 200-ng/mL anti-CD3 (Invitrogen) or 5-ng/mL PMA and 100-ng/mL ionomycin. Cell activation was assessed by measuring interleukin 2 release 16 hours after stimulation, using enzyme-linked immunosorbent assay (BD Biosciences) as described elsewhere [18, 19].
Viruses
SARS-CoV-2 (Seattle, Washington, strain MN985325; provided by Stanley Perlman, MD, PhD, University of Iowa) and vesicular stomatitis virus (VSV; VSV-glycoprotein and VSV–CoV-2 spike protein; provided by Wendy Maury, PhD, University of Iowa) [16, 20] were included in these studies. Viruses were expanded in Vero E6 or Vero cells for SARS-CoV-2 and VSV, respectively. SARS-CoV-2 studies were completed in the University of Iowa biosafety level 3 core facility.
Quantitative Reverse-Transcription Polymerase Chain Reaction
Cellular RNA was extracted using TRIzol reagent (Invitrogen) isolation method before complementary DNA synthesis (High-Capacity, cDNA Reverse Transcription Kit, Applied Biosystems). Viral RNA was extracted from supernatants using the QIAamp Viral RNA kit (Qiagen) and the Platinum Quantitative RT-PCR ThermoScript One-Step System (Invitrogen), as described elsewhere [21]. Gene-specific primers were used to identify Glyceraldehyde 3-phosphate Dehydrogenase (GAPDH) [22], ACE2 [23], and SARS-CoV-2 [24] from 1 million cells, and experiments were repeated ≥3 times.
ACE2 Protein Expression
Cell lysates (100 000 cell equivalents per well) were probed with antibodies to GAPDH (R&D Systems), β-actin (Sigma-Aldrich), and ACE2 (Novus Biologicals). The appropriate secondary horseradish peroxidase antibodies were used for imaging with an iBright 1500 system (Invitrogen), and ImageJ (Version 1.49 23) software was used for quantification. Cell surface expression was measured by means of flow cytometry using ACE2–phycoerythrin (PE) (Novus Biologicals), as recommended by the manufacturer. Primary cell populations were incubated with CD19-PacificBlue (BioLegend), CD3–fluorescein isothiocyanate (FITC), CD4-FITC, CD8-FITC, CD14– allophycocyanin (APC), and CD56-AlexaFluor700 (all BD Biosciences). Primary cells were treated with human immunoglobulin G (10 µg/1 million cells) to block Fc receptors on B cells. Data were acquired on an LSR II flow cytometer using a single-stained AbC bead kit (ThermoFisher) for compensation [17]. Viable cells were gated based on forward and side scatter, doublets were excluded, and “fluorescence minus 1” controls were assessed. PE quantitation beads (BD Quantibrite) were analyzed, according to the manufacturer’s instructions, to quantify ACE2 molecules per cell. At least 10 000 total events were collected in each experiment and the FlowJo program (Tree Star) was used for data analysis.
SARS-CoV-2 Spike Recombinant Protein
Recombinant trimeric SARS-CoV-2 spike recombinant protein (AcroBiosystems) was labeled with the FITC Conjugation Kit (Fast)-Lightning-Link (Abcam), according to the manufacturer’s instructions. Unlabeled protein was detected by means of fixation/permeabilization (BD Biosciences) and anti–spike 1 (S1) (GeneTex) and anti-rabbit APC (BioLegend) antibodies. ACE2 binding was blocked with 2-µg/mL anti-ACE2 (R&D Systems) for 3 hour before spike recombinant protein addition [7]. Cells were treated with 2.5 µg/mL recombinant protein, and cell viability was verified using the MTT assay (Sigma-Aldrich; not shown).
SARS-CoV-2 Binding and Entry
To quantify binding, 1 × 10⁶ cells were incubated at 4ºC for 1 hour before addition of SARS-CoV-2 (multiplicity of infection, 1.0) at 4ºC for 3 hours in triplicate. Cells were then washed 3 times with cold phosphate-buffered saline before cell lysis in TRIzol reagent. To quantify entry, virus was added to cells for 3 hours at 37ºC. Cells were then incubated in 0.25% trypsin– ethylenediaminetetraacetic acid (EDTA; Gibco) and washed 3 times with phosphate-buffered saline. Cells were resuspended in growth media and incubated at 37ºC for 5 days, after which supernatants were collected for viral RNA extraction or titering on Vero E6 cells and cells were lysed in TRIzol reagent. Experiments were repeated 3 times.
Cell Proliferation and Apoptosis
Cell proliferation was determined with Ki67-PE (BioLegend) staining 24 hours after infection. Apoptosis was measured with the EnzChek Caspase-3 Assay Kit #1 (Invitrogen) 5 days after infection, according to the manufacturer’s instruction.
Statistical Analysis
Statistical analysis were performed using GraphPad software (version 9.0.0; GraphPad Software). Two-sided Student t tests were used to compare results between test and controls, and differences were considered statistically significant P < .05.
RESULTS
Up-regulation of ACE2 Expression on T Cells During Cell Activation
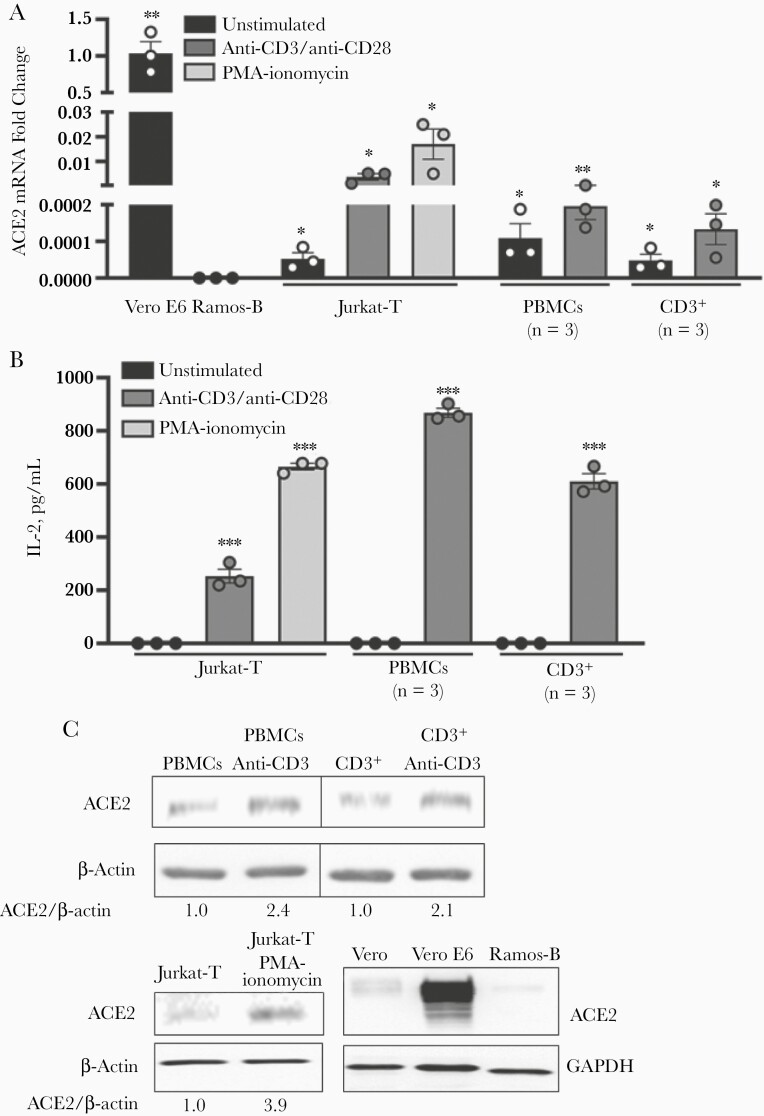
To address the conflicting descriptions of ACE2 expression and T cells [10–13], multiple approaches were used to detect ACE2 expression in resting and activated Jurkat-T and primary human T cells. Quantitative reverse-transcription polymerase chain reaction (PCR) showed that Jurkat-T, PBMCs, and purified CD3+ T cells contained detectable ACE2 RNA (Figure 1A). As expected, positive control Vero E6 cells with high expression of ACE2 contained significantly (approximately 1000-fold) more ACE2 RNA than the Jurkat-T-cell line or primary PBMCs and enriched CD3+ T cells [25–27]. ACE2 RNA was not detected in immortalized Ramos-B cells (Figure 1A); thus, we used Ramos-B as negative controls thereafter.
Figure 1.
Angiotensin-converting enzyme 2 (ACE2) expression on T cells is up-regulated during cell activation. A, Relative ACE2 messenger RNA (mRNA) levels in T cells determined with quantitative reverse-transcription polymerase chain reaction. B, Interleukin 2 (IL-2) levels released by cells following activation. C, ACE2 protein detected in T cells with immunoblot analysis. Image is representative of 3 biological replicates. Jurkat cells were activated with anti-CD3 and anti-CD28 and primary T cells with anti-CD3 antibodies. Alternatively, T cells were activated by phorbol myristate acetate (PMA) and ionomycin for 24 hours before analysis. Vero E6 cells were used as a positive control and Vero or Ramos-B cells as a negative control. ∗P < .05; ∗∗P < .01; ∗∗∗P < .001. Error bars represent standard errors of the mean from biological replicates. Abbreviation: PBMCs, peripheral blood mononuclear cells.
Unexpectedly, ACE2 RNA levels were significantly increased 10–100-fold in Jurkat-T and purified CD3+ T cells after activation through the T-cell receptor (TCR) with anti-CD3/CD28 or after stimulation with PMA and ionomycin (Figure 1A). T-cell activation was confirmed by measuring cellular interleukin 2 release (Figure 1B). In addition to messenger RNA (mRNA) expression, ACE2 protein was detected in PBMCs, purified CD3+ T cells, and Jurkat-T cells in immunoblot analysis (Figure 1C). In findings similar to the mRNA results, Vero cells had considerably more ACE2 protein. and Ramos-B cells had negligible ACE2 (Figure 1C). ACE2 protein levels also increased with cell activation (Figure 1C includes the fold increase in ACE2 relative to actin).
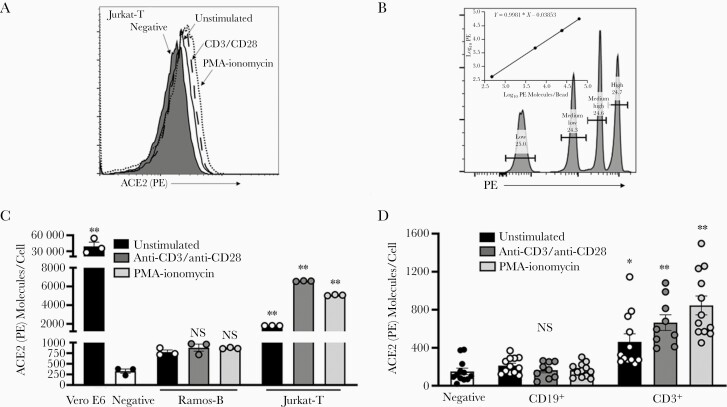
To examine ACE2 cell surface expression, we used flow cytometric analysis and confirmed that Jurkat-T cells express low levels of ACE2 and that levels increase with cell activation (Figure 2A). Based on the shift of the entire curve compared with >5% of the unstained negative control cells, it appears that the entire cell population expresses at least some ACE2 (Figure 2A). To quantify the number of ACE2 receptors on the surface of T cells, we used fluorescence quantitation beads containing a known number of fluorescent molecules per bead w. Linear regression analysis was used to calculate the number of receptor molecules per cell (Figure 2B).
Figure 2.
Quantification of angiotensin-converting enzyme 2 (ACE2) receptor molecules on T cells. A, Flow cytometry analysis of ACE2 surface expression on Jurkat-T cells. B, Quantification of BD Quantibrite phycoerythrin (PE) bead fluorescence by flow cytometry. The value for log10 PE molecules per bead was provided to generate quantitation curve as recommended by the manufacturer. B–D, Quantification of ACE2 molecules per cell in immortalized B (Ramos) and T (Jurkat) cells (C) and primary cells (D) was determined using the linear regression curve generated for BD Quantibrite bead fluorescence (B). Cells were activated with anti-CD3 and anti-CD28 antibodies or phorbol myristate acetate (PMA) and ionomycin for 24 hours before analysis. Vero E6 cells were used as the positive control, and Ramos-B or CD19+ cells as the negative control. ∗P < .05; ∗∗P < .01; NS, not significant. Error bars represent standard errors of the mean from biological replicates.
Based on the quantification curve, approximately 50 000 ACE2 receptors were present on Vero E6 control cells (Figure 2C). The background fluorescence was set for Ramos-B cells or primary CD19+ B cells. Subtracting background fluorescence, Jurkat-T cells had approximately 1000 ACE2 receptors per cell, and detection was enhanced after T-cell activation by either TCR or PMA and ionomycin (Figure 2C). Examination of a healthy blood donor’s primary PBMCs found that CD3+ T cells contained approximately 353 ACE2 surface molecules per cell, and expression also significantly increased to 579 or 765 molecules per cell after stimulation with TCR or PMA and ionomycin, respectively (Figure 2D).
SARS-CoV-2 Spike Protein Binding of T Cells
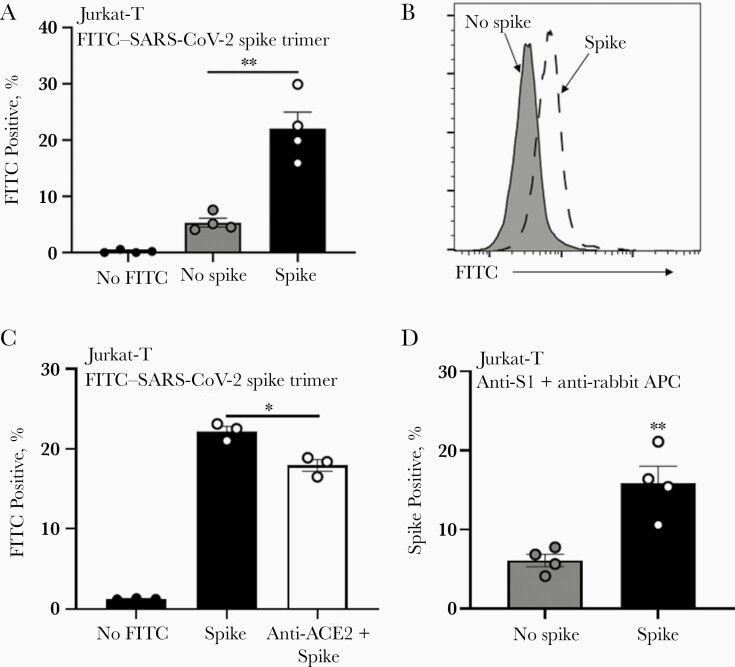
Because the SARS-CoV-2 spike protein mediates binding to ACE2 in permissive cells, we evaluated whether the level of ACE2 present on T cells was sufficient to mediate binding to SARS-CoV-2 spike protein. To address this, we used flow cytometry to determine the amount of FITC-labeled SARS-CoV-2 trimeric spike protein bound to Jurkat-T cells compared with nonspecific FITC binding (Figure 3A and 3B). This interaction was partially dependent on ACE2, because blocking of ACE2 with anti-ACE2 antibody [7] moderately, but significantly, reduced spike protein binding levels in Jurkat-T cells (Figure 3C). Detection of bound spike protein after anti-ACE2 blocking may indicate incomplete antibody blocking or interaction between spike protein and alternative surface molecules, as suggested by others [14]. The binding of the FITC-labeled spike trimers to Jurkat-T cells was not due to protein alterations during fluorescent labeling, as SARS-CoV-2–specific antibodies detected unlabeled SARS-CoV-2 trimeric protein incubated with T cells (Figure 3D).
Figure 3.
Severe acute respiratory syndrome coronavirus 2 (SARS-CoV-2) spike protein binds T cells through angiotensin-converting enzyme 2 (ACE2). A, B, Fluorescein isothiocyanate (FITC)–labeled SARS-CoV-2 spike recombinant protein was applied to T cells and detected by flow cytometry. C, Levels of FITC-labeled SARS-CoV-2 spike recombinant protein in T cells were reduced by anti-ACE2 blocking antibody. D, Unlabeled SARS-CoV-2 spike recombinant protein bound T cells as detected by anti–spike 1 (S1) and secondary anti–allophycocyanin (APC) antibody using flow cytometry; 2.5-µg/mL recombinant protein was added to Jurkat-T cells 24 hours before detection by flow cytometry. ∗P < .05; ∗∗P < .01. Error bars represent standard errors of the mean from biological replicates.
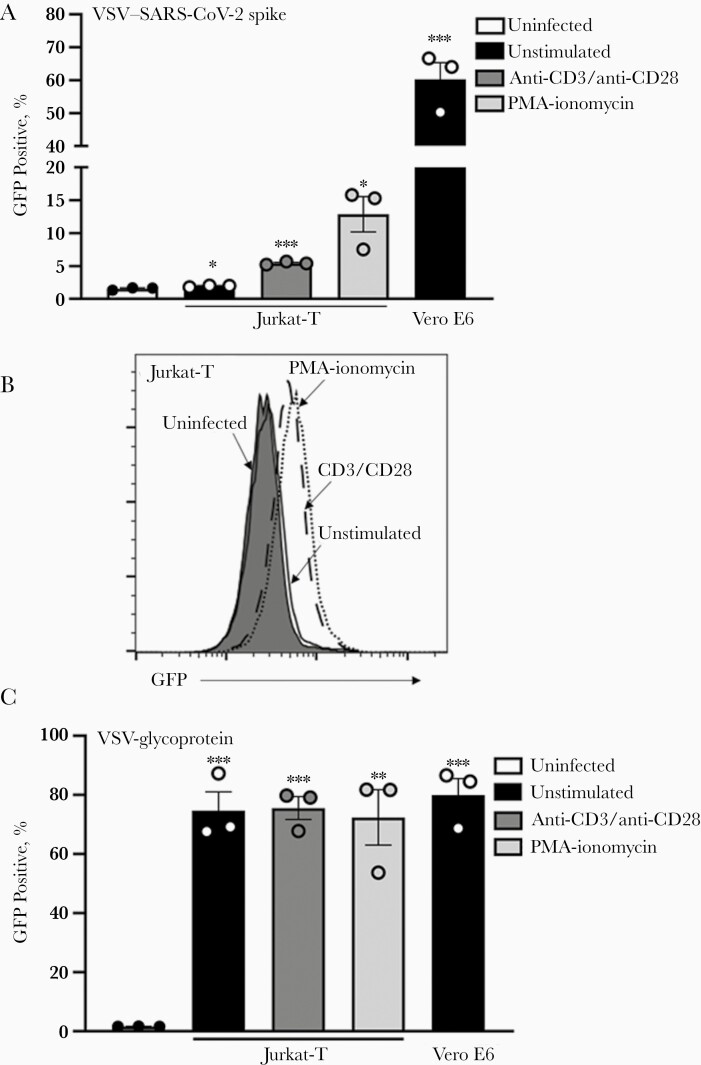
Furthermore, infection of Jurkat cells was demonstrated using a SARS-CoV-2 spike protein pseudotyped VSV (VSV–CoV-2 spike) containing a green fluorescent protein (GFP) reporter gene [20, 28]. Measuring virus by GFP expression, VSV-spike infection increased in Jurkat-T cells compared with uninfected control cells, and infection (as determined by GFP levels) was enhanced when infection followed TCR-mediated cell activation (Figure 4A and 4B). The increase in VSV–CoV-2 spike infection of activated Jurkat-T cells was correlated with ACE2 levels. In contrast, VSV-glycoprotein did not show an increase with T-cell activation (Figure 4C). These results do not reflect a defect in VSV–CoV-2 spike binding ability, as cell-associated virus levels in Vero E6 cells were similar to that observed with VSV-glycoprotein (Figure 4A and 4C).
Figure 4.
A, B, Severe acute respiratory syndrome coronavirus 2 (SARS-CoV-2) spike protein binds T cells. Jurkat-T (A, B) and Vero E6 (A) cells were infected with green fluorescent protein (GFP)–expressing vesicular stomatitis virus (VSV) particles pseudotyped with SARS-CoV-2 spike protein. C, Alternatively, Jurkat-T and Vero E6 cells were infected with GFP-expressing VSV particles pseudotyped with VSV-glycoprotein. Cells were activated with anti-CD3 and anti-CD28 antibodies or phorbol myristate acetate (PMA) and ionomycin for 24 hours before infection. GFP expression was determined with flow cytometry 24 hours after infection. ∗P < .05; ∗∗P < .01; ∗∗∗P < .001. Error bars represent standard errors of the mean from biological replicates.
SARS-CoV-2 Particles Binding, Entry, and Infection
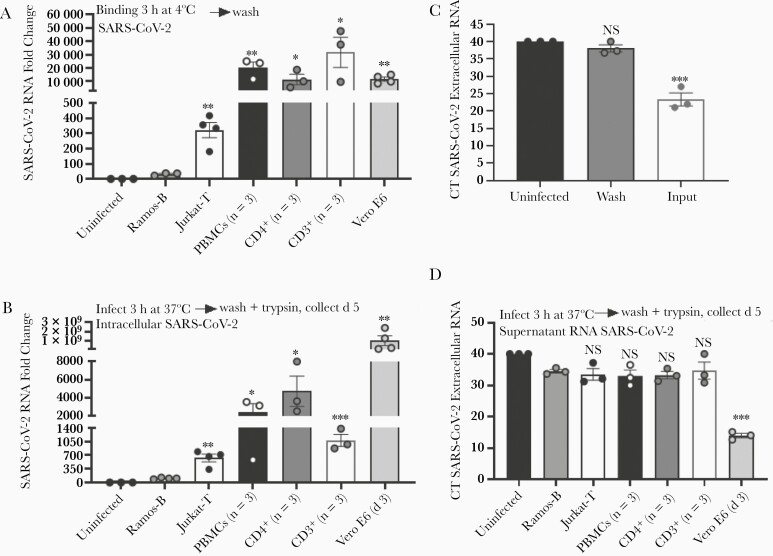
To determine whether replication-competent SARS-CoV-2 binds to T lymphocytes, SARS-CoV-2 particles were incubated with Jurkat-T cells, PBMCs, and purified CD4+ and purified CD3+ primary lymphocytes at 4ºC for 3 hours to allow virus binding while preventing internalization events [21]. Subsequent washing and evaluation of SARS-CoV-2 RNA present in cells found significant SARS-CoV-2 bound to Jurkat-T cells, PBMCs, purified CD4+ T cells, and purified CD3+ T cells compared with Ramos-B cells (Figure 5A). Surprisingly, virus binding levels in primary cell populations were comparable to levels in Vero E6 cells (Figure 5A) containing significantly more ACE2 (Figure 1). These data strongly suggest that low levels of ACE2 are sufficient to mediate SARS-CoV-2 binding to cells.
Figure 5.
Severe acute respiratory syndrome coronavirus 2 (SARS-CoV-2) particles bind and enter T cells but do not produce infectious virus. A, SARS-CoV-2 particles were applied to T cells maintained at 4ºC and binding determined after washing by means of quantitative reverse-transcription polymerase chain reaction (qRT-PCR). B, SARS-CoV-2 entry into T cells detected 5 days after inoculation. Cells were trypsinized before measurement of intracellular viral RNA. C, Input virus removal assessed after trypsin treatment and washing of surface-associated virus. D, SARS-CoV-2 RNA released from infected cells 5 days after infection. Vero E6 cells served as the positive control, and Ramos-B cells as the negative control. SARS-CoV-2 was quantified using qRT-PCR. ∗P < .05; ∗∗P < .01; ∗∗∗P < .001. Error bars represent standard errors of the mean from biological replicates. Abbreviations: CT, PCR cycle threshold; NS, not significant; PBMCs, peripheral blood mononuclear cells.
Significant levels of intracellular SARS-CoV-2 RNA were detected in Jurkat-T cells, PBMCs, and purified CD4+ and CD3+ T cells, compared with Ramos-B cells (Figure 5B); however, intracellular virus levels were orders of magnitude lower than that detected in Vero E6 cells 3 days after infection (Figure 5B). To evaluate internalization of SARS-CoV-2, cells were incubated with SARS-CoV-2 particles at 37ºC for 3 hours. They were then treated with 0.25% trypsin-EDTA and washed to remove surface-associated virus. Complete removal of input virus was verified by evaluating SARS-CoV-2 extracellular RNA remaining in the final wash (Figure 5C). Release of SARS-CoV-2 RNA from these cells was measured in cell culture supernatants 5 days after infection. Extracellular or supernatant viral RNA levels in PBMC and T-cell models were not different from levels in Ramos-B cells (Figure 5D). Furthermore, these PBMC and T-cell supernatants were not able to infect Vero E6 cells (not shown), while Vero E6 supernatants contained infectious virus (median tissue culture infective dose, 106 infectious particles/mL; not shown). Together, these data indicate that SARS-CoV-2 particles bind and enter into T cells but cannot replicate or produce detectable infectious particles.
Effect of SARS-CoV-2 Particles on T-Cell Proliferation and Apoptosis
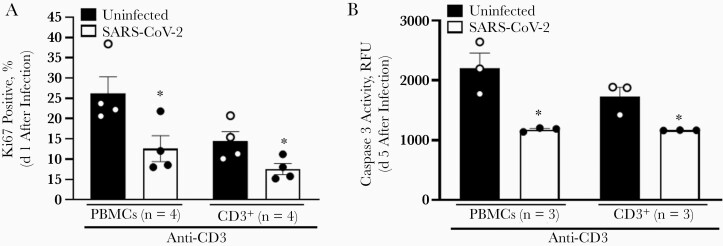
Previous reports identified reduced T-cell numbers in patients with severe COVID-19, and this has been hypothesized to be related to enhanced apoptosis [5, 6, 29]. To examine potential functional consequences of SARS-CoV-2 internalization on the T-cell growth cycle, we evaluated T-cell proliferation and apoptosis in T cells aft4r incubation with SARS-CoV-2. Ki67 surface staining was used as an indicator of cell proliferation, and SARS-CoV-2–infected PBMCs and purified CD3+ T cells had significantly reduced proliferation compared with uninfected controls (Figure 6A). Similarly, caspase 3 activity was measured as a marker of T-cell apoptosis. Caspase 3 levels were significantly reduced in infected cells (Figure 6B), demonstrating that SARS-CoV-2–infected T cells are proliferating at a reduced rate and have reduced apoptosis in vitro. Thus, T-cell turnover may be reduced during SARS-CoV-2 infection, contributing to reduced cell numbers. This contribution is likely small; however, because the cells are resistant to apoptosis, the surviving cells likely contribute to the massive inflammatory milieu observed in patients with severe disease.
Figure 6.
Severe acute respiratory syndrome coronavirus 2 (SARS-CoV-2) particles reduce T-cell proliferation and apoptosis. A, Effect of SARS-CoV-2 on primary human T-cell proliferation 1 day after infection, as determined by expression of Ki67 using flow cytometry. B, SARS-CoV-2 reduced apoptosis, as measured by caspase 3 activity levels in primary human T cells 5 days after SARS-CoV-2 infection. Caspase 3 levels were determined using relative fluorescence units (RFU). T cells were activated with anti-CD3 antibody 1 day before infection. ∗P < .05. Error bars represent standard errors of the mean from biological replicates. Abbreviation: PBMCs, peripheral blood mononuclear cells.
DISCUSSION
Multiple studies have described alterations in T-cell responses and T-cell immunity in SARS-CoV-2–infected individuals, and this is generally attributed to an indirect regulation of T-cell homeostasis following SARS-CoV-2 infection [30–32]. However, few studies have evaluated direct effects of SARS-CoV-2 in T cells, and there are conflicting reports on the expression of ACE2 receptor levels on human T cells [10–14]. Our data support findings of others that both immortalized and ex vivo human T cells contain detectable levels of ACE2 RNA and protein (Figure 1) [12, 13]. The level of ACE2 measured was sufficient to mediate SARS-CoV-2 spike protein trimer binding (Figures 3 and 4) and virus binding and entry (Figure 5). Of note, T cells did not produce infectious virus; thus, replication appears to be restricted at a postentry replication cycle step (Figure 5).
Similar results identified SARS-CoV-2 binding and uptake in CD4+ T cells [14], and a separate study reported low but detectable levels of SARS coronavirus 1 (SARS-CoV-1)–specific genomic RNA [33]. Consistent with our finding that T cells do not produce infectious virus, SARS-CoV-1 replicating (minus strand) RNA was not found in PBMCs [33]. A potential corollary is that influenza A virus may cause abortive infection in macrophages and dendritic cells; however, some strains seem to lead to productive infection [34]. It has been suggested that this may contribute to viral amplification and dissemination, and understanding strain differences may provide insights into pathogenicity and immunogenicity.
Although few studies have evaluated T-cell turnover in coronavirus infections, a SARS-CoV-1 study reported low expression of apoptosis indicators in infected Jurkat-T and PBMCs [33]. In contrast to our results with SARS-CoV-2, no significant differences in apoptosis measurements were observed in SARS-CoV-1–infected cells compared with mock-infected controls [33]. However, similar to our in vitro results, a COVID-19 clinical study did not identify significant increases in the apoptosis-associated indicator, caspase 3 in T cells [34, 35]. Thus, T-cell apoptosis, as measured by caspase 3 activation, does not appear to be increased during SARS-CoV-2 infection (Figure 6B), and enhanced apoptosis may not be responsible for the reduced T-cell numbers observed in infected patients.
Bulk PBMC and purified CD3+ T cells infected with SARS-CoV-2 showed reduced proliferation (Figure 6). These data are consistent with findings by others demonstrating significantly reduced CD4+ and CD8+ T-cell proliferation in healthy PBMCs treated with a cocktail of SARS-CoV-2 spike, nucleoprotein, and protease recombinant proteins [36]. In addition, proliferation of circulating CD4+ and CD8+ T cells obtained from patients with COVID-19 was significantly reduced in patients with prolonged hospitalization (≥5 days) [36]. Interestingly, even patients in the most prolonged hospitalization group (>20 days) who tested negative for virus by PCR at the time of lymphocyte collection had reduced T-cell proliferation [36,37]. This is consistent with our finding that productive viral replication was not required to alter normal T-cell function, and that T-cell interaction with viral proteins appears sufficient to interfere with proliferation.
Our data suggest that longitudinal assessment of T-cell ACE2 expression in patients with different COVID-19 disease severity is warranted. If higher levels of ACE2 are correlate with T-cell activation in persons with severe disease, this may suggest a link between ACE2 and inflammation, contributing to immunopathogenesis underlying severe SARS-CoV-2 infection. This may be true in other infections as well, as studies of T cells obtained from human immunodeficiency virus (HIV)–suppressed patients found reduced proliferation rates compared with uninfected controls [38]. The authors of that study hypothesized that low but persistent HIV infection in these cells may prolong the half-life of T cells through reduced proliferation, which may in turn maintain the infected cell population [38].
Supplementary Data
Supplementary materials are available at The Journal of Infectious Diseases online. Supplementary materials consist of data provided by the author that are published to benefit the reader. The posted materials are not copyedited. The contents of all supplementary data are the sole responsibility of the authors. Questions or messages regarding errors should be addressed to the author.
Notes
Acknowledgments. We thank James McLinden, PhD for critical discussions and review of the manuscript, Thomas Kaufman for assistance with flow cytometry, and Stanley Perlman, MD, PhD and Wendy Maury, PhD for reagents.
Financial support. This work was supported by Veterans Affairs(merit review grant BX000207 to J. T. S.), the University of Iowa Carver College of Medicine (pilot grant to J. C. D. H. and J. T. S.), the National Institutes of Health (training grant (5T32AI343 to J. T. S.), and the National Cancer Institute, National Institutes of Health (grant P30CA086862). Flow cytometry data were obtained at the Flow Cytometry Facility, a core research facility at the University of Iowa, funded through user fees and support from the Carver College of Medicine, Holden Comprehensive Cancer Center, and the Iowa City Veteran’s Administration Medical Center.
Potential conflicts of interest. All authors: No reported conflicts of interest. All authors have submitted the ICMJE Form for Disclosure of Potential Conflicts of Interest. Conflicts that the editors consider relevant to the content of the manuscript have been disclosed.
References
- 1. Bourgonje AR, Abdulle AE, Timens W, et al. . Angiotensin-converting enzyme 2 (ACE2), SARS-CoV-2 and the pathophysiology of coronavirus disease 2019 (COVID-19). J Pathol 2020; 251:228–48. [DOI] [PMC free article] [PubMed] [Google Scholar]
- 2. Gupta A, Madhavan MV, Sehgal K, et al. . Extrapulmonary manifestations of COVID-19. Nat Med 2020; 26:1017–32. [DOI] [PubMed] [Google Scholar]
- 3. Zhang Y, Geng X, Tan Y, et al. . New understanding of the damage of SARS-CoV-2 infection outside the respiratory system. Biomed Pharmacother 2020; 127:110195. [DOI] [PMC free article] [PubMed] [Google Scholar]
- 4. De Biasi S, Meschiari M, Gibellini L, et al. . Marked T cell activation, senescence, exhaustion and skewing towards TH17 in patients with COVID-19 pneumonia. Nat Commun 2020; 11:3434. [DOI] [PMC free article] [PubMed] [Google Scholar]
- 5. Chen Z, John Wherry E.. T cell responses in patients with COVID-19. Nat Rev Immunol 2020; 20:529–36. [DOI] [PMC free article] [PubMed] [Google Scholar]
- 6. Diao B, Wang C, Tan Y, et al. . Reduction and functional exhaustion of T cells in patients with coronavirus disease 2019 (COVID-19). Front Immunol 2020; 11:827. [DOI] [PMC free article] [PubMed] [Google Scholar]
- 7. Hoffmann M, Kleine-Weber H, Schroeder S, et al. . SARS-CoV-2 cell entry depends on ACE2 and TMPRSS2 and is blocked by a clinically proven protease inhibitor. Cell 2020; 181:271–80.e8. [DOI] [PMC free article] [PubMed] [Google Scholar]
- 8. Zamorano Cuervo N, Grandvaux N.. ACE2: evidence of role as entry receptor for SARS-CoV-2 and implications in comorbidities. Elife 2020; 9:e61390. [DOI] [PMC free article] [PubMed] [Google Scholar]
- 9. Hamming I, Timens W, Bulthuis ML, Lely AT, Navis G, van Goor H.. Tissue distribution of ACE2 protein, the functional receptor for SARS coronavirus: a first step in understanding SARS pathogenesis. J Pathol 2004; 203:631–7. [DOI] [PMC free article] [PubMed] [Google Scholar]
- 10. Song X, Hu W, Yu H, et al. . Little to no expression of angiotensin-converting enzyme-2 on most human peripheral blood immune cells but highly expressed on tissue macrophages. Cytometry A 2020. doi: 10.1002/cyto.a.24285. [DOI] [PubMed] [Google Scholar]
- 11. Wang Y, Wang Y, Luo W, et al. . A comprehensive investigation of the mRNA and protein level of ACE2, the putative receptor of SARS-CoV-2, in human tissues and blood cells. Int J Med Sci 2020; 17:1522–31. [DOI] [PMC free article] [PubMed] [Google Scholar]
- 12. Osman IO, Melenotte C, Brouqui P, et al. . Expression of ACE2, soluble ACE2, angiotensin I, angiotensin II and angiotensin-(1-7) is modulated in COVID-19 patients. Front Immunol 2021; 12:625732. [DOI] [PMC free article] [PubMed] [Google Scholar]
- 13. Xu H, Zhong L, Deng J, et al. . High expression of ACE2 receptor of 2019-nCoV on the epithelial cells of oral mucosa. Int J Oral Sci 2020; 12:8. [DOI] [PMC free article] [PubMed] [Google Scholar]
- 14. Davanzo GG, Codo AC, Brunetti NS, et al. . SARS-CoV-2 uses CD4 to infect T helper lymphocytes. medRxiv [Preprint: not peer reviewed]. 28 September 2020. Available from: https://www.medrxiv.org/content/10.1101/2020.09.25.20200329v1. [Google Scholar]
- 15. Arunachalam PS, Wimmers F, Mok CKP, et al. . Systems biological assessment of immunity to mild versus severe COVID-19 infection in humans. Science 2020; 369:1210–20. [DOI] [PMC free article] [PubMed] [Google Scholar]
- 16. Welch JL, Xiang J, Mackin SR, et al. . Inactivation of severe acute respiratory coronavirus virus 2 (SARS-CoV-2) and diverse RNA and DNA viruses on three-dimensionally printed surgical mask materials. Infect Control Hosp Epidemiol 2020; 1:8. [DOI] [PMC free article] [PubMed] [Google Scholar]
- 17. Welch JL, Kaufman TM, Stapleton JT, Okeoma CM.. Semen exosomes inhibit HIV infection and HIV-induced proinflammatory cytokine production independent of the activation state of primary lymphocytes. FEBS Lett 2020; 594:695–709. [DOI] [PMC free article] [PubMed] [Google Scholar]
- 18. McLinden JH, Bhattarai N, Stapleton JT, et al. . Yellow fever virus, but not Zika virus or dengue virus, inhibits T-cell receptor-mediated T-cell function by an RNA-based mechanism. J Infect Dis 2017; 216:1164–75. [DOI] [PMC free article] [PubMed] [Google Scholar]
- 19. Chivero ET, Bhattarai N, Rydze RT, Winters MA, Holodniy M, Stapleton JT.. Human pegivirus RNA is found in multiple blood mononuclear cells in vivo and serum-derived viral RNA-containing particles are infectious in vitro. J Gen Virol 2014; 95:1307–19. [DOI] [PMC free article] [PubMed] [Google Scholar]
- 20. Case JB, Rothlauf PW, Chen RE, et al. . Neutralizing antibody and soluble ACE2 inhibition of a replication-competent VSV-SARS-CoV-2 and a clinical isolate of SARS-CoV-2. Cell Host Microbe 2020; 28:475–85.e5. [DOI] [PMC free article] [PubMed] [Google Scholar]
- 21. Welch JL, Xiang J, Okeoma CM, Schlievert PM, Stapleton JT.. Glycerol monolaurate, an analogue to a factor secreted by lactobacillus, is virucidal against enveloped viruses, including HIV-1. mBio 2020; 11:e00686-20. [DOI] [PMC free article] [PubMed] [Google Scholar]
- 22. Welch JL, Kaddour H, Schlievert PM, Stapleton JT, Okeoma CM.. Semen exosomes promote transcriptional silencing of HIV-1 by disrupting NF-kappaB/Sp1/tat circuitry. J Virol 2018; 92:e00731-18. [DOI] [PMC free article] [PubMed] [Google Scholar]
- 23. Lamers MM, Beumer J, van der Vaart J, et al. . SARS-CoV-2 productively infects human gut enterocytes. Science 2020; 369:50–4. [DOI] [PMC free article] [PubMed] [Google Scholar]
- 24. Toptan T, Hoehl S, Westhaus S, et al. . Optimized qRT-PCR approach for the detection of intra- and extra-cellular SARS-CoV-2 RNAs. Int J Mol Sci 2020; 21:4396. [DOI] [PMC free article] [PubMed] [Google Scholar]
- 25. Wurtz N, Penant G, Jardot P, Duclos N, La Scola B.. Culture of SARS-CoV-2 in a panel of laboratory cell lines, permissivity, and differences in growth profile. Eur J Clin Microbiol Infect Dis 2021; 40:477–84. [DOI] [PMC free article] [PubMed] [Google Scholar]
- 26. Ren X, Glende J, Al-Falah M, et al. . Analysis of ACE2 in polarized epithelial cells: surface expression and function as receptor for severe acute respiratory syndrome-associated coronavirus. J Gen Virol 2006; 87:1691–5. [DOI] [PubMed] [Google Scholar]
- 27. Hattermann K, Muller MA, Nitsche A, Wendt S, Donoso Mantke O, Niedrig M.. Susceptibility of different eukaryotic cell lines to SARS-coronavirus. Arch Virol 2005; 150:1023–31. [DOI] [PMC free article] [PubMed] [Google Scholar]
- 28. Yahalom-Ronen Y, Tamir H, Melamed S, et al. . A single dose of recombinant VSV-G-spike vaccine provides protection against SARS-CoV-2 challenge. Nat Commun 2020; 11:6402. [DOI] [PMC free article] [PubMed] [Google Scholar]
- 29. Cizmecioglu A, Akay Cizmecioglu H, Goktepe MH, et al. . Apoptosis-induced T-cell lymphopenia is related to COVID-19 severity. J Med Virol 2021; 93:2867–74. [DOI] [PubMed] [Google Scholar]
- 30. Le Bert N, Tan AT, Kunasegaran K, et al. . SARS-CoV-2-specific T cell immunity in cases of COVID-19 and SARS, and uninfected controls. Nature 2020; 584:457–62. [DOI] [PubMed] [Google Scholar]
- 31. Altmann DM, Boyton RJ.. SARS-CoV-2 T cell immunity: specificity, function, durability, and role in protection. Sci Immunol 2020; 5:eabd6160. [DOI] [PubMed] [Google Scholar]
- 32. Sattler A, Angermair S, Stockmann H, et al. . SARS-CoV-2-specific T cell responses and correlations with COVID-19 patient predisposition. J Clin Invest 2020; 130:6477–89. [DOI] [PMC free article] [PubMed] [Google Scholar]
- 33. Chan PK, Chen GG.. Mechanisms of lymphocyte loss in SARS coronavirus infection. Hong Kong Med J 2008; 14:21–6. [PubMed] [Google Scholar]
- 34. Short KR, Brooks AG, Reading PC, Londrigan SL.. The fate of influenza A virus after infection of human macrophages and dendritic cells. J Gen Virol 2012; 93:2315–25. [DOI] [PubMed] [Google Scholar]
- 35. Zhu L, Yang P, Zhao Y, et al. . Single-cell sequencing of peripheral mononuclear cells reveals distinct immune response landscapes of COVID-19 and influenza patients. Immunity 2020; 53:685–96.e3. [DOI] [PMC free article] [PubMed] [Google Scholar]
- 36. Kalfaoglu B, Almeida-Santos J, Tye CA, Satou Y, Ono M.. T-cell dysregulation in COVID-19. Biochem Biophys Res Commun 2021; 538:204–10. [DOI] [PMC free article] [PubMed] [Google Scholar]
- 37. Avendano-Ortiz J, Lozano-Rodriguez R, Martin-Quiros A, et al. . Proteins from SARS-CoV-2 reduce T cell proliferation: a mirror image of sepsis. Heliyon 2020; 6:e05635. [DOI] [PMC free article] [PubMed] [Google Scholar]
- 38. Bacchus-Souffan C, Fitch M, Symons J, et al. . Relationship between CD4 T cell turnover, cellular differentiation and HIV persistence during ART. PLoS Pathog 2021; 17:e1009214. [DOI] [PMC free article] [PubMed] [Google Scholar]
Associated Data
This section collects any data citations, data availability statements, or supplementary materials included in this article.


