

SUMMARY
Antigenic stimulation promotes T cell metabolic reprogramming to meet increased biosynthetic, bioenergetic, and signaling demands. We show that the one-carbon (1C) metabolism enzyme Methylenetetrahydrofolate Dehydrogenase-2 (MTHFD2) regulates de novo purine synthesis and signaling in activated T cells to promote proliferation and inflammatory cytokine production. In pathogenic T helper-17 (Th17) cells, MTHFD2 prevented aberrant upregulation of the transcription factor FoxP3 along with inappropriate gain of suppressive capacity. MTHFD2 deficiency also promoted regulatory T (Treg) cell differentiation. Mechanistically, MTHFD2 inhibition led to depletion of purine pools, accumulation of purine biosynthetic intermediates, and decreased nutrient sensor mTORC1 signaling. MTHFD2 was also critical to regulate DNA and histone methylation in Th17 cells. Importantly, MTHFD2 deficiency reduced disease severity in multiple in vivo inflammatory disease models. MTHFD2 is thus a metabolic checkpoint to integrate purine metabolism with pathogenic effector cell signaling and is a potential therapeutic target within 1C metabolism pathways.
eTOC/In Brief
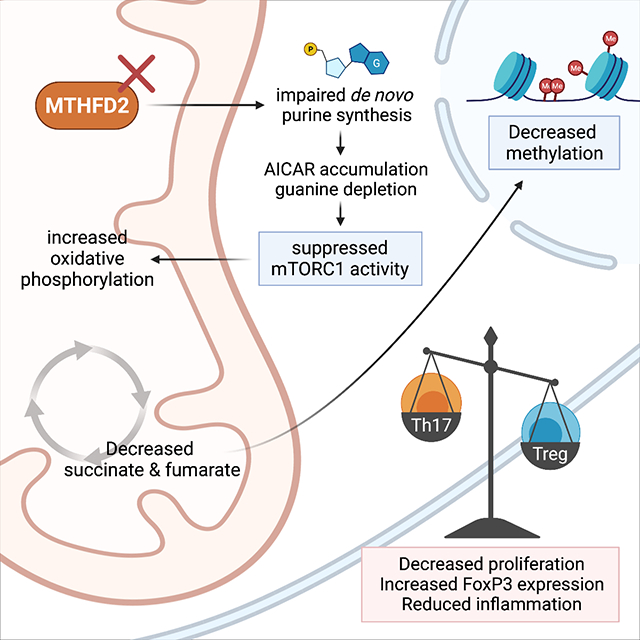
Nucleotide synthesis is required to support rapid T cell proliferation. Sugiura et al. show de novo purine metabolism signals to direct T cell differentiation and function, and identify MTHFD2 as a metabolic checkpoint and therapeutic target for inflammatory diseases.
Graphical Abstract
INTRODUCTION
Effective mobilization of the adaptive immune response requires robust activation of CD4+ T cells to undergo rapid cell growth and proliferation. This involves metabolic reprogramming driven by the nutrient sensor mTORC1, from a catabolic resting state to an anabolic growth state, with increased biosynthetic, bioenergetic, and signaling demands. Depending on the cytokine milieu, CD4+ T cells differentiate into effector as well as regulatory subsets which have distinct metabolic programs driving their effector functions (Bantug et al., 2018; Buck et al., 2015). The balance of these subsets is critical for normal immunity while preventing inflammatory and autoimmune diseases. For example, Multiple Sclerosis (MS) is characterized by increased IL-17-producing Th17 cells and decreased or ineffective suppressive regulatory T (Treg) cells (Dendrou et al., 2015). Targeting the specific metabolic programs of these T cell subsets offers an alternative approach to immunotherapy.
Cell-metabolism based therapeutics began in 1948, when anti-folate chemotherapeutics were shown effective in children with acute lymphoblastic leukemia (Farber et al., 1948). Folate contributes to one-carbon (1C) metabolism for purine biosynthesis, generation of methyl donors, and maintenance of cellular redox balance (Ducker and Rabinowitz, 2017; Yang and Vousden, 2016). Many drugs, including methotrexate (MTX), fluorouracil (5-FU), and mercaptopurine (6-MP), have since been developed to target this pathway. Rapidly proliferating cells, including cancer cells and activated T cells, share dependencies on these pathways to synthesize DNA and RNA. MTX remains commonly used to treat autoimmune diseases like rheumatoid arthritis (RA) (Brown et al., 2016). However, due to the broad expression of the targeted enzymes, these therapeutics are associated with common and potentially severe adverse effects. Identifying metabolic enzyme targets that are selectively important in cell populations of interest could lead to development of safer and more efficacious immunotherapies.
1C metabolism includes the folate and methionine cycles with transfer of single carbon units. Serine serves as a 1C donor to activate tetrahydrofolate (THF) to 5,10-methyleneTHF, with concomitant glycine production. 5,10-methyleneTHF can then be oxidized using NAD(P) to generate the purine precursor 10-formylTHF. Alternatively, 10-formylTHF can be synthesized from formate and THF in an ATP-dependent manner. In the cytosolic pathway, 10-fomylTHF production is mediated by Methylenetetrahydrofolate Dehydrogenase 1 (MTHFD1). Loss of MTHFD1 starves cells for cytosolic 10-formylTHF ablating purine biosynthetic capacity and mutations in MTHFD1 cause Severe Combined Immunodeficiency (SCID) (Field et al., 2015). The mitochondrial pathway relies on mitochondrial Methylenetetrahydrofolate Dehydrogenase (MTHFD2) and MTHFD1-Like (MTHFD1L).
MTHFD2 is one of the most highly induced and overexpressed genes in all tumors (Nilsson et al., 2014). While broadly upregulated during embryogenesis, MTHFD2 has little to no expression in most adult tissues (Nilsson et al., 2014). In anti-cancer therapy (Zhu and Leung, 2020), MTHFD2 inhibition may lead to increased oxidative stress (Ju et al., 2019; Wan et al., 2020), glycine dependency (Koufaris et al., 2016), and insufficient purine synthesis (Ben-Sahra et al., 2016; Pikman et al., 2016). MTHFD2 deficiency can also suppress mTORC1 activity through multiple mechanisms, including through guanine depletion and subsequent inhibition of the mTORC1 activating GTPase Rheb (Emmanuel et al., 2017). MTHFD2 deficiency also causes accumulation of purine synthesis pathway intermediates including the adenosine monophosphate (AMP) analog, 5-aminoimidazole carboxamide ribonucleotide (AICAR) (Ducker et al., 2016), which can activate AMP activated Protein Kinase (AMPK) to inhibit mTORC1 (Su et al., 2019).
Because 1C metabolism integrates multiple nutrient inputs and is therapeutically tractable, we examined the role of 1C metabolism in CD4+ T effector (Teff) and Treg cell subsets. Through unbiased in vivo CRISPR/Cas9-based targeted screening in primary murine T cells, we identified MTHFD2 as a hit that was also consistently upregulated in patients with inflammatory disorders. Notably, MTHFD2 deficiency impaired Teff proliferation and function. MTHFD2 deficiency also promoted aberrant FoxP3 expression and suppressive activity in Th17 cells, while promoting Treg cell differentiation. These effects were associated with accumulation of AICAR, reduced purine concentrations, downregulation of mTORC1 signaling, increased mitochondrial metabolism, and altered DNA and histone methylation. In vivo, targeting MTHFD2 protected against multiple inflammatory disease models. These data show that MTHFD2 serves as a metabolic checkpoint in Th17 and Treg cells and highlight the potential of this enzyme as a target for anti-inflammatory immunotherapy.
RESULTS
1C metabolism and purine synthesis is differentially active in CD4+ T cell subsets.
We hypothesized that nucleotide synthesis may differ across CD4+ T cell subsets. CD4+ T cells were differentiated in vitro into Th1, Th17, and Treg cells and collected after 72 hours for mass spectrometry. Nucleotide species amounts were generally elevated in all subsets compared to naïve cells (Figure 1A). Notably, purine synthesis intermediates were differentially abundant, with highest accumulation of glycinamide ribonucleotide (GAR), 1-(phosphoribosyl) imidazolecarboxamide (SAICAR), and AICAR in Th17 cells (Figure S1A).
Figure 1: 1C metabolism and MTHFD2 are upregulated in activated CD4+ T cells and in the context of EAE.

(A) Change in nucleotide metabolism species in in vitro differentiated CD4+ T cell subsets compared to naïve cells measured by mass spectrometry (n=3 biological replicates).
(B) Workflow for targeted CRISPR screening in in vivo lung inflammation model.
(C) Change in gRNA abundance from 1C metabolism-targeted in vivo CRISPR screening in primary CD4+ T cells (statistical analysis performed by MAGeCK, n=3 biological replicates).
(D) mRNA expression of genes identified in (C) during T cell development and activation. Data from ImmGen RNA-seq databrowser.
(E) Protein expression of genes identified in (C) in naïve and activated CD4+ T cells. Data from Immunological Proteome Resource (ImmPRes).
(F) mRNA expression of genes identified in (C) in whole blood of patients with indicated inflammatory disorders relative to healthy control patients (Aune et al., 2017). (RA-MTX = RA under MTX treatment, SLE = systemic lupus erythematosus, MS-Tx Naïve = treatment-naïve MS at time of diagnosis, MS-Established = MS under treatment and in disease remission; n=3–8 patient donors).
(G) IHC showing CD3 and MTHFD2 staining in the cauda equina segment of the spinal cord of mice with symptomatic EAE at 200x (top, scale bar = 100μm) and 400x (bottom, scale bar = 50μm) magnification (data representative of two independent experiments).
(H-I) Relative (H) mean fluorescence intensity (MFI) and (I) mRNA expression of MTHFD2 in CD4+ T cells from spleen and spinal cord of mice with symptomatic EAE and spleen of control mice (one-way ANOVA, data representative of two independent experiments with n=6 total biological replicates).
(J) MTHFD2 mRNA expression in undifferentiated CD4+ T cells at 0, 5, and 24 hours post activation with anti-CD3 and anti-CD28 antibodies (one-way ANOVA, n=3 biological replicates).
(K) Relative MTHFD2 MFI over 5 days post activation in CD4+ T cell subsets, normalized to resting cells (n=3 biological replicates).
See also Figure S1.
To test the dependence of CD4+ T cells on enzymes in 1C metabolism, we performed an in vivo CRISPR/Cas9-based screen in primary CD4+ T cells (Figure 1B). A custom guide RNA (gRNA) library was constructed to target enzymes in 1C metabolism, along with Tuberous Sclerosis Complex 2 (TSC2) as a positive control and non-targeting negative controls (NTCs). CD4+ T cells isolated from ovalbumin (OVA)-specific T cell receptor (TCR) transgenic OT-II Cas9 double-transgenic mice were transduced with this library and intravenously transferred into Rag1−/− hosts. Mice were then immunized with intranasal OVA to induce lung inflammation. T cells recovered from the lungs of these mice were sequenced and enrichment or depletion of gRNAs were established relative to input frequencies. TSC2 gRNA was enriched, supporting the inhibitory role of this protein in T cells. In contrast, PPAT, AHCY, MAT2A and MTHFD1 gRNA were significantly depleted and GART, DHFR, DNMT1, MTRR, MTR, SHMT2, and MTHFD2 gRNA were reduced to a lesser extent to indicate these genes contribute to T cell proliferation and inflammatory function in vivo (Figure 1C, S1B).
We next examined the expression profile of the genes identified from the screen. While all were coordinately upregulated in developing thymocytes, MTHFD2 mRNA and protein were most strongly induced in stimulated peripheral T cells (Figure 1D, E). Moreover, in a separately published RNAseq dataset from the whole blood of patients with a variety of inflammatory and autoimmune diseases (Aune et al., 2017), MTHFD2 was consistently overexpressed across multiple conditions including ulcerative colitis, Crohn’s disease, Celiac’s disease, RA, systemic lupus erythematosus (SLE), psoriasis, psoriatic arthritis, Sjogren’s syndrome, and MS (Figure 1F). Notably, patients with recently diagnosed MS had significantly elevated MTHFD2 expression relative to healthy donors or MS patients undergoing therapy with disease remission (Figure S1C). Thus, CD4+ T cells proliferation and survival are dependent on certain 1C metabolism genes, and the expression of these genes differ through the stages of T cell development, activation, and differentiation as well as in the setting of pathological inflammation.
MTHFD2 is highly upregulated in CNS-infiltrating CD4+ T cells in Experimental Autoimmune Encephalomyelitis (EAE) and in activated CD4+ T cells in vitro.
Regulation of MTHFD2 has not been well described in CD4+ T cells. To measure the expression of MTHFD2 in inflammatory lesions in vivo, CD4+ T cells from myelin-specific T cell receptor (TCR) transgenic 2D2 mice were activated and adoptively transferred into Rag1−/− mice to induce EAE. After mice began exhibiting hind-leg paralysis, the cauda equina segment of spinal cords were analyzed by immunohistochemistry (IHC). Mice that received 2D2 T cells showed enrichment of MTHFD2 and CD3+ positive cells that was absent in the control (Figure 1G). To directly determine if CD4+ T cells upregulated MTHFD2 in inflamed lesions, T cells from spleen and spinal cord of mice subjected to a myelin oligodendrocyte glycoprotein (MOG) and pertussis toxin (PTX)-induced model of EAE were collected for analysis. CNS-infiltrating CD4+ T cells overexpressed MTHFD2 compared to matched splenic CD4+ T cells from control and EAE mice as measured by flow cytometry (Figure 1H) and RT-qPCR (Figure 1I). The kinetics of MTHFD2 expression in CD4+ T cells in vitro was next measured. Robust upregulation of MTHFD2 mRNA was detected after 5 hours of stimulation and began to decrease by 24 hours (Figure 1J), while differentiated CD4+ T cell subsets attained the highest expression of MTHFD2 protein 48 hours post activation (Figure 1K). These data show that MTHFD2 is upregulated in CD4+T cells with activation in vitro and at the site of inflammation in vivo.
CD4+ T cell subsets differentially require MTHFD2 for activation, proliferation, survival, and cytokine production.
We next tested the role of MTHFD2 in CD4+ T cell subset activation, differentiation, proliferation, and function. CD4+ T cells were activated in vitro in the presence of cytokines for optimal Th1, Th17, and Treg cell differentiation and vehicle or an MTHFD2 inhibitor (MTHFD2i; DS18561882) (Kawai et al., 2019). After 72 hours, all subsets had reduced proliferation (Figure 2A) and numbers of live cycling cells (Figure S2A–B). Viability was reduced in Th1 and Th17 cells (Figure 2B) and activation, as measured by CD25 expression, was reduced in all subsets (Figure 2C). Lineage-characterizing transcription factor (TF) expression was reduced in Th1 cells (T-bet+), but unchanged in Th17 cells (RORγt+) and minimally changed in Treg cells (FoxP3+) (Figure 1D). To measure Teff cell function, cells were re-stimulated with PMA and ionomycin. Significantly fewer Th1 cells expressed interferon-γ (IFNγ) and fewer Th17 cells expressed IL-17 when differentiated in the presence of MTHFD2i (Figure 2E). This was not due to impaired initial activation as these phenotypes were maintained when drug exposure was delayed until 24 hours post activation, although lineage-characterizing TF expression was unaltered in this setting (Figure S2C–F). MTHFD2 is thus required for maximal CD4+ T cell activation, proliferation, survival, and cytokine production.
Figure 2: MTHFD2 deficiency impairs CD4+ T cell proliferation and function.

(A-D) Proliferation measured by (A) CTV dilution, (B) viability, (C) CD25 expression, and (D) TF expression in CD4+ T cell subsets treated with MTHFD2i for 72hrs post activation (one-way ANOVA, data representative of three independent experiments with n=9 total biological replicates).
(E) Cytokine expression in Th1 and Th17 cells treated with vehicle or 500nM MTHFD2i for 4 days and stimulated with PMA and ionomycin (unpaired t-test, data representative of three independent experiments with n=9 total biological replicates).
(F) MTHFD2 expression in CD4+ T cells isolated from WT and CD4ΔMthfd2 littermates, activated with anti-CD3 and anti-CD28 antibodies, and cultured for 72hrs (data representative of n=3 biological replicates).
(G) Frequency of CD4+ T cells in the spleen of treatment-naïve WT and CD4ΔMthfd2 littermates (unpaired t-test, n=3 biological replicates).
(H-K) Live (H) cell count, (I) CD25 expression, (J) TF expression, and (K) cytokine expression in Th1 and Th17 cells from WT and CD4ΔMthfd2 littermates 4 days post activation (unpaired t-test, data representative of three independent experiments with n=9 biological replicates).
See also Figure S2.
To validate these pharmacological effects genetically, we generated a Mthfd2fl/fl mouse strain and crossed it with Cd4-cre transgenic mice to achieve conditional genetic deletion. As anticipated, activated CD4+ T cells from Mthfd2fl/fl Cd4-cre+ (CD4ΔMthfd2) mice had lower MTHFD2 expression compared to cells from Mthfd2fl/fl Cd4-cre− (WT) littermates (Figure 2F). At baseline, CD4ΔMthfd2 mice had slightly fewer CD4+ T cells in the spleen compared to WT (Figure 2G). Upon in vitro activation and differentiation, cell numbers and viability of CD4ΔMthfd2 Th17 cells, and Treg cells to a lesser extent, were significantly lower (Figure 2H). In addition, CD25 expression was decreased in Th17 and Treg cells, and trended lower in Th1 cells (Figure 2I). Finally, CD4ΔMthfd2 Th1 and Th17 cells had lower expression of T-bet and RORγt, respectively. FoxP3 in Treg cells, however, was unchanged (Figure 2J). Despite changes in TF expression, those Teff cells that did differentiate produced normal amounts of cytokines (Figure 2K). Differences in results between the pharmacological and genetic approaches may be attributed to the timing and completeness of enzyme function loss during development and potential compensatory mechanisms.
MTHFD2i induces FoxP3 expression in Th17 cells and enhances Treg cell differentiation.
Given the dependence of Teff cells on MTHFD2, we tested MTHFD2i regulation of FoxP3 and Treg cells. Notably, MTHFD2i treatment induced aberrant upregulation of FoxP3 in Th1 and more prominently in Th17 cells in a dose-dependent manner (Figure 3A). This also occurred when treatment was delayed until 24 hours post activation (Figure 3B). A similar trend was observed in the CD4ΔMthfd2 Th17 cells (Figure 3C). This FoxP3 upregulation was functional, as MTHFD2i-treated Th17 cells gained suppressive capacity when co-cultured with CD8+ T cells (Figure 3D). MTHFD2i can thus promote FoxP3 and Treg cell-like phenotypes in Th17 cells. MTHFD2i also enhanced differentiation of induced Treg cells. Treg cells were differentiated with a range of TGFß concentrations in the presence of MTHFD2i. At every concentration tested except the highest, FoxP3 expression increased with MTHFD2i (Figure 3E–F). This phenotype was also maintained with delayed MTHFD2i treatment (Figure 3G).
Figure 3: MTHFD2 deficiency induces FoxP3 expression and promotes a shift toward oxidative phosphorylation.

(A) FoxP3 expression in MTHFD2i-treated Th1 and Th17 cells 72hrs post activation (one-way ANOVA, data representative of three independent experiments with n=9 total biological replicates).
(B) FoxP3 expression in Th1 and Th17 cells activated for 24hrs and then treated with vehicle or 500nM MTHFD2i for 48hrs (unpaired t-test, data representative of three independent experiments with n=9 total biological replicates).
(C) FoxP3 expression in Th1 and Th17 cells from WT and CD4ΔMthfd2 littermates 72hrs post activation (unpaired t-test, data representative of three independent experiments with n=9 total biological replicates).
(D) Suppression assay measuring aberrant suppressive capacity of MTHFD2i-treated Th17 cells. Pre-treated Th17 cells were co-cultured with CTV-stained CD8+ T cells to measure proliferation upon activation with anti-CD3 and anti-CD28 antibodies (one-way ANOVA, n=3 biological replicates).
(E) FoxP3 expression in Treg cells differentiated with a range of TGFß concentrations treated with MTHFD2i (unpaired t-test, data representative of three independent experiments with n=9 total biological replicates).
(F) Flow cytometric plots for data tabulated in (E).
(G) FoxP3 expression in Treg cells activated and differentiated with low concentrations of TGFß for 24hrs and then treated with MTHFD2i for 48hrs (unpaired t-test, data representative of three independent experiments with n=9 total biological replicates).
(H) Seahorse XF Cell Mito Stress Test performed on MTHFD2i-treated Th17 and Treg cells.
(I) Basal ECAR, basal OCR, max OCR, and basal OCR/ECAR ratio measured in (H) (unpaired t-test, data representative of two independent experiments with n=6 total biological replicates).
Treg cells have greater mitochondrial metabolism than Th17 cells (Michalek et al., 2011). To determine the metabolic consequences of MTHFD2i, Th17 and Treg cells were assessed by extracellular flux analyses. MTHFD2i increased basal and maximal oxygen consumption rate (OCR) of Th17 cells to indicate a shift towards mitochondrial respiration (Figure 3H). Conversely, both Th17 and Treg cells had decreased basal extracellular acidification rate (ECAR) with MTHFD2i to suggest reduced glycolysis (Figure 3I). The basal ratio of OCR to ECAR was significantly increased in both Th17 and Treg cells as MTHFD2i shifted the metabolic program from glycolysis toward oxidative phosphorylation. These data show that MTHFD2i enhances FoxP3 expression in Th17 cells and Treg cells differentiated in low TGFß conditions and shifts Th17 cells to a more Treg-like metabolism.
MTHFD2 deficiency in human CD4+ T cells decreases Th17 cell proliferation and viability while increasing FOXP3 expression and dampening mTORC1 activity.
To test the translatability of the above findings in human cells, CD4+ T cells isolated from peripheral blood of healthy donors were in vitro differentiated into Th1, Th17, and Treg cells and treated with vehicle or MTHFD2i from the time of activation. Proliferation was significantly decreased in MTHFD2i-treated Th17 and Treg cells (Figure 4A), and Th17 cells also exhibited increased apoptosis (Figure 4B). Decreased proliferation in Th17 cells was recapitulated with a genetic approach using siRNA (Figure 4C, S2G). Similar to murine cells, FOXP3 expression was higher in the MTHFD2i-treated human Th17 cells, and trended higher in MTHFD2i-treated human Treg cells (Figure 4D, S2H). Given that the mTORC1-AMPK axis is critical to Th17 and Treg cell differentiation, phosphorylation of the mTORC1 target ribosomal protein S6 (phospho-S6) was also measured. This showed decreased mTORC1 activity in Th17 cells with either MTHFD2i or siMTHFD2 (Figure 4E). Thus, both the loss of proliferative capacity and induction of FOXP3 expression in Th17 and Treg cells can be recapitulated in primary human CD4+ T cells.
Figure 4: MTHFD2 deficiency impairs proliferation and induces FOXP3 expression in human Th17 cells.

(A) Proliferation measured by CTV dilution in human CD4+ T cell subsets treated with vehicle or 2μM MTHFD2i for 72hrs post activation with anti-CD3 and anti-CD28 antibodies (paired t-test, data representative of three independent experiments with n=5–6 healthy patient donors).
(B) Apoptosis measured by Annexin V in human CD4+ T cells treated with MTHFD2i for 72hrs (paired t-test, data representative of three independent experiments with n=5–6 healthy patient donors).
(C) Ki-67 expression in human CD4+ T cells transduced with NTC or siMTHFD2 (paired t-test, data representative of three independent experiments with n=4 healthy patient donors).
(D) FOXP3 expression in human CD4+ T cells treated with MTHFD2i for 72hrs (paired t-test, data representative of three independent experiments with n=6–10 healthy patient donors).
(E) Change in phospho-S6 expression in human CD4+ T cells treated with MTHFD2i for 72hrs or transduced with siMTHFD2 (one sample t-test, data representative of three independent experiments with n=4–6 healthy patient donors).
T cells rely on MTHFD2 enzymatic function and phenotypes can be rescued by product.
MTHFD2 is required for the maintenance of the mitochondrial formate pool for purine synthesis (Ma et al., 2017), but may also play non-enzymatic roles. Supporting an essential enzymatic activity, MTHFD2i treatment led to compensatory uptake of formate from the media in CD4+ T cell subsets (Figure 5A). The 1C unit used for formate synthesis is provided by the conversion of serine to glycine and intracellular serine accumulated while glycine was depleted with MTHFD2i treatment in all subsets (Figure 5B). Methionine concentrations were also slightly increased suggesting inhibition of the methionine cycle. As expected, given that the serine-glycine conversion step is upstream of MTHFD2, these changes were not rescued by provision of formate in the media.
Figure 5: MTHFD2i effects on T cell subsets are rescued by exogenous formate.

(A) Formate uptake measured by 1H-MRS in CD4+ T cell subsets treated with vehicle or 500nM MTHFD2i for 72 hours post activation (unpaired t-test, data representative of two independent experiments with n=6 total biological replicates).
(B) Change in serine, glycine, and methionine concentrations in CD4+ T cells treated with 500nM MTHFD2i or 500nM MTHFD2i+1mM formate for 4–6hrs compared to vehicle measured by mass spectrometry (n=3 biological replicates).
(C) Live cell count, viability, and CD25 expression in MTHFD2i-treated CD4+ T cells rescued with 1mM formate or 60μM adenine and guanine purine solution for 72hrs post activation (one-way ANOVA, data representative of three independent experiments with n=9 total biological replicates).
(D) Live cell count, viability, and CD25 expression in CD4+ T cells from WT or CD4ΔMthfd2 littermates rescued with formate or purines for 72hrs post activation (one-way ANOVA, n=3 biological replicates).
(E) Cytokine expression in Th1 and Th17 cells treated with MTHFD2i±formate or purines for 4 days post activation (one-way ANOVA, data representative of three independent experiments with n=9 total biological replicates).
(F) FoxP3 expression in Th17 and Treg cells differentiated with low concentrations of TGFß, treated with MTHFD2i±formate or purines for 72hrs post activation (one-way ANOVA, data representative of three independent experiments with n=9 total biological replicates).
We next tested if addition of formate or an adenine and guanine purine solution could rescue deficient enzymatic function and reverse downstream effects of MTHFD2 deficiency. Indeed, 1mM formate restored proliferation, viability, and activation in MTHFD2i treated cells (Figure 5C). Purine supplementation rescued proliferation in all subsets and activation in Th1 and Th17 cells, but not viability in all subsets and activation in Treg cells. Formate also rescued proliferation, viability, and activation in CD4ΔMthfd2 T cells (Figure 5D). Impaired cytokine production in MTHFD2i-treated Th1 and Th17 cells was reversed to vehicle amounts with either formate or purine addition (Figure 5E). Notably, aberrant upregulation of FoxP3 in Th17 cells was rescued by purine addition but not formate, while both formate and purine addition reduced FoxP3 expression to baseline in Treg cells differentiated with low concentrations of TGFß (Figure 5F). MTHFD2i phenotypes appear dependent on MTHFD2 maintenance of the mitochondrial formate or purine pools.
MTHFD2 regulates mTORC1 activity and DNA and histone methylation in CD4+ T cells.
In immortalized cancer cells, MTHFD2 deficiency can lead to accumulation of purine synthesis intermediates GAR, SAICAR, and AICAR, which are upstream of 10-formylTHF-mediated formylation steps (Ducker et al., 2016). CD4+ T cell subsets were cultured for 72 hours before exposure to MTHFD2i for four to six hours. This short timeframe was chosen to avoid any secondary effects including compensatory changes. Transient MTHFD2i resulted in accumulation of GAR, SAICAR, and AICAR in all subsets (Figure 6A). This effect was fully rescued by addition of 1mM formate, supporting an enzymatic role for MTHFD2. Nucleotides and nucleobases, including guanine, were also depleted by MTHFD2i and rescued by formate in Th17 and Treg cells (Figure 6B).
Figure 6: MTHFD2i results in accumulation of purine synthesis intermediates, dampened mTORC1 activity, and altered DNA and histone methylation.

(A) Change in GAR, SAICAR, and AICAR concentrations in CD4+ T cells treated with 500nM MTHFD2i or 500nM MTHFD2i+1mM formate for 4–6hrs relative to vehicle measured by mass spectrometry (one-way ANOVA, n=3 biological replicates).
(B) Change in nucleotide metabolism species in Th17 and Treg cells treated with MTHFD2i±formate for 4–6hrs relative to vehicle measured by mass spectrometry (n=3 biological replicates).
(C) Immunoblot of phospho-S6, S6, Rheb, phospho-ACC, ACC, HIF-1α, and ß-actin in CD4+ T cells treated with MTHFD2i±formate for 72hrs post activation (data representative of three independent experiments with n=3 biological replicates).
(D) Change in TCA cycle metabolites in Th17 cells treated with MTHFD2i±formate for 6hrs relative to vehicle measured by mass spectrometry (one-way ANOVA, n=3 biological replicates).
(E) Heat maps of H3K27me3 to IgG control ratio in +/− 10 kb regions around promoters of UCSC known genes in Th17 and Treg cells treated with MTHFD2i measured by CUT&RUN (Data pooled from n=3 biological replicates).
(F) Heatmap of median DNA methylation frequency of Foxp3 locus by CpG site in Th1 and Th17 cells treated with vehicle or 500nM MTHFD2i and in nTreg cells from WT or CD4ΔMthfd2 littermates (Mood’s test, n=3 biological replicates).
(G) Tabulation of (F) by proximal promoter, distal promoter, and TSDR (paired t-test).
AICAR and nucleotides are established regulators of the mTORC1-AMPK axis (Emmanuel et al., 2017; Kim et al., 2016). Indeed, phospho-S6 expression was decreased with MTHFD2i in all subsets and fully restored by addition of formate (Figure 6C, S3A). The GTP-binding protein Rheb, which is an obligate activator of mTORC1, can be sensitive to intracellular guanine availability (Emmanuel et al., 2017) and Rheb expression was dampened with MTHFD2i (Figure 6C, S3B). AICAR is an adenosine analog and AMPK activator (Rae and Mairs, 2019; Su et al., 2019). However, at 72 hours post activation, phosphorylation of AMPK or its targets, Acetyl-CoA Carboxylase (phospho-ACC) and Unc-51 like autophagy activating kinase (phospho-ULK1), did not change with MTHFD2i (Figure 6C, S3C–D). mTORC1 activity promotes Th17 and attenuates Treg cell differentiation in part through induction of HIF-1α - dependent glycolytic metabolism (Shi et al., 2011). Consistent with this, HIF-1α expression was decreased in both MTHFD2i-treated and CD4ΔMthfd2 Th17 cells (Figure 6C, S3E–F). These changes in mTORC1 activity were not associated with any deficits in TCR signaling as measured by Nur77 expression with and without re-stimulation (Figure S3G). Signal Transducer And Activator Of Transcription 3 (STAT3) activity, which is critical for Th17 cell development, was unchanged or modestly increased with MTHFD2i (Figure S3H). Decreased mTORC1 activity and a shift from glycolysis toward oxidative phosphorylation with MTHFD2i suggested changes in relative abundance of TCA cycle metabolites. Succinate and fumarate concentrations were significantly reduced by MTHFD2i but rescued by formate (Figure 6D).
TCA metabolites are known inhibitors of DNA and histone demethylases (Su et al., 2016) and depletion of succinate and fumarate pools may support a hypomethylated state. H3K27 tri-methylation (H3K27me3) across the genome was measured by CUT&RUN (Cleavage Under Targets and Release Using Nuclease) sequencing (Skene and Henikoff, 2017). Indeed MTHFD2i-treated Th17 cells had reduced H3K27me3 compared to vehicle (Figure 6E, S4A). DNA methylation at the Foxp3 locus was also measured by bisulfate sequencing to determine whether differential methylation contributed to MTHFD2i-induced FoxP3 upregulation. While several CpG loci differed in methylation frequency between vehicle and MTHFD2i conditions, there was no discernable pattern in the Treg-Specific Demethylated region (TSDR). There were also no differences between the nTreg (CD4+CD25+) isolated from WT and CD4ΔMthfd2 mice (Figure 6F), although the purity of each enriched population was low (Figure S4B). However, there was a significant decrease in DNA methylation frequency over the Foxp3 proximal promoter region in MTHFD2i-treated Th17 cells compared to vehicle (Figure 6G), indicating possible enhancement in transcription with MTHFD2i.
In addition to maintaining intracellular formate pool, MTHFD2 activity contributes to cellular redox balance through conversion of NAD+ to NADH and NADP+ to NADPH (Shin et al., 2017) and support of the transsulfuration pathway and subsequent glutathione synthesis. MTHFD2i-treated Th17 cells had decreased concentrations of NAD+, NADH, NADP+, and NADPH, which was rescued with formate (Figure S4C). However, NAD+/NADH and NADP+/NADPH ratios were unchanged across conditions. This, combined with the lack of change in cellular reactive oxygen species (ROS) and mitochondrial superoxide (Figure S4D), suggest that changes the redox state are unlikely to be a major contributor to the MTHFD2i phenotype.
MTHFD2 deficiency in vivo reduces severity of multiple inflammatory diseases.
The efficacy of MTHFD2 as a therapeutic target was next tested in an in vivo T-cell dependent Delayed Type Hypersensitivity (DTH) model. Mice were immunized and challenged on the ear with Keyhole limpet hemocyanin (KLH) to induce local inflammation and treated with oral vehicle or MTHFD2i. Treatment showed no overt toxicity, as animals maintained their weight (Figure S5A). Importantly, ear thickness and weight were each increased in control DTH mice but not in inhibitor-treated animals, indicating protection from inflammation upon MTHFD2i (Figure 7A–B, Figure S5B). KLH-specific IgG was also reduced at the highest dose of inhibitor, indicating potential effects extending to B cell function (Figure 7C).
Figure 7: Targeting MTHFD2 in vivo reduces disease severity in DTH, EAE, and IBD models.

(A-B) Ear (A) relative thickness and (B) biopsy weight 10 days post KLH with CFA immunization and 3 days post KLH challenge to induce DTH (one-way ANOVA). Mice were treated twice daily with oral 0, 100, or 300mg/kg MTHFD2i (mean±SEM, n=8 biological replicates).
(C) KLH-specific IgG concentrations on day 10 of KLH-induced DTH (mean±SEM, Kruskal-Wallis tes, n=8 biological replicates).
(D) Average clinical score overtime in WT and CD4ΔMthfd2 littermates immunized with MOG with CFA and PTX to induce EAE (mean±SEM, multiple Mann-Whitney tests, data representative of two independent experiments each with n=5 biological replicates).
(E) Cell count and frequency of CD4+ T cells in the spinal cord of EAE mice at peak disease severity (mean±SEM, unpaired t-test, data representative of two independent experiments with n=9 total biological replicates).
(F) CD25 and CD44 expression in CD4+ T cells from the spinal cord of EAE mice (mean±SEM, unpaired t-test, n=4 biological replicates).
(G&H) Cell count of (G) T-bet+, RORγt+, FoxP3+, FoxP3+/T-bet+ ratio, FoxP3+/RORγt+ ratio, (H) IL-17+, IFNγ+, and IL-17+IFNγ+ CD4+ T cells from the spinal cord of EAE mice (mean±SEM, unpaired t-test, data representative of two independent experiments with n=9 total biological replicates).
(I) H&E, anti-CD3 IHC, and Luxol Fast Blue (LFB) staining for myelin in the spinal cord of WT mouse with no immunization and WT and CD4ΔMthfd2 littermates with EAE at peak disease (200x magnification, representative of n=5 biological replicates).
(J) Change in body weight over time of Rag1−/− mice i.p. injected with WT or CD4ΔMthfd2 naïve CD4+ T cells to induce IBD colitis (mean±SEM, multiple t-tests, n=8 biological replicates).
(K&L) Cell count of (K) total CD4+ T cells and (L) T-bet+, RORγt+, and FoxP3+ CD4+ T cells from MLNs of IBD mice (mean±SEM, unpaired t-test n=8 biological replicates).
Similarly, dual MTHFD1/2 inhibitor LY345899 (Gustafsson et al., 2017) was efficacious in ameliorating disease in an EAE model. EAE was induced with MOG and PTX and mice were treated daily with intraperitoneal (i.p.) injection of DMSO or LY345899. Inhibitor treatment led to significantly reduced disease severity and cumulative clinical score compared to vehicle (Figure S5C–D). Mice were sacrificed on day 26 and spinal cord infiltrating cells were collected for immune profiling. Notably, significantly fewer CD45+, CD4+, and CD8+ cells infiltrated the spinal cord of LY345899-treated mice (Figure S5E–G). There were no changes in frequency of RORγt+ or FoxP3+ cells among the infiltrating CD4+ T cells (Figure S5H). However, there was a decrease in the frequency of IFNγ+IL17+ double-positive cells and an increase in IL17+ single-positive cells (Figure S5I), suggesting a possible switch to a less pathogenic phenotype.
To directly test T cell intrinsic dependence on MTHFD2 in vivo, WT and CD4ΔMthfd2 littermates were subjected to three different models – EAE, inflammatory bowel disease (IBD), and allergic airway disease. EAE was again induced with MOG and PTX and, similar to the inhibitor experiment, CD4ΔMthfd2 mice had significantly reduced disease severity over 26 days (Figure 7D). A separate cohort was euthanized at peak disease on day 15 post induction for T cell phenotyping (Figure S6A–B). While CD4+ or CD8+ T cell counts were unchanged in the spleen (Figure S6C), CD4+ T cell infiltration into the spinal cord was significantly decreased (Figure 7E). Spinal cord-infiltrating CD4+ T cells in CD4ΔMthfd2 mice had similar CD25 expression as WT, but reduced expression of CD44 pointing to partly impaired activation (Figure 7F). The numbers of T-bet+, RORγt+, and FoxP3+ cells (Figure 7G) as well as IL-17+ and IFNγ+ cells (Figure 7H) were also reduced in the spinal cord of CD4ΔMthfd2 mice relative to WT. Notably, the ratios of FoxP3+ to T-bet+ and RORγt+ cells were elevated in the CD4ΔMthfd2 mice than WT at peak disease, mirroring the in vitro findings of increased FoxP3 expression with MTHFD2 deficiency (Figure 7G). While the frequency of TF expressing cells among infiltrating cells overall trended higher, the frequency of cytokine expression was unchanged (Figure S6D–E). Histology of the spinal cord of control mice without EAE and WT and CD4ΔMthfd2 mice with EAE showed increased cellularity and CD3 positivity in the spinal cord in WT mice that was associated with demyelination as stained by Luxol Fast Blue (Figure 7I). These changes were absent in the no EAE control and CD4ΔMthfd2 mice.
The role of MTHFD2 was next tested in IBD and allergic airway disease models. WT and CD4ΔMthfd2 naïve CD4+ T cells were transferred to Rag1−/− recipients to initiate IBD. While mice that received WT cells began losing weight as IBD progressed, recipients of CD4ΔMthfd2 T cells continued gaining weight (Figure 7J). Significantly fewer number and frequency of CD4ΔMthfd2 T cells were found in spleens (Figure S6F) and mesenteric lymph nodes (MLNs) draining the colon (Figure 7K, S6G). Numbers of T-bet+, RORγt+, and FoxP3+ CD4ΔMthfd2 T cells were also decreased In the MLNs, though frequency of FoxP3+ cells was increased (Figure 7L, S6H). However, there were no differences in FoxP3/T-bet and FoxP3/RORγt cell count ratios in the MLNs at this late-stage timepoint (Figure S6I). Similar to findings of MTHFD2 as a modest hit in the in vivo airway inflammation CRISPR screen (Figure 1C), CD4ΔMthfd2 mice subjected to Alternaria-induced allergic airway disease had a trend for decreased neutrophil abundance in the bronchioalveolar lavage fluid (BALF), although no changes were observed in BALF lymphocyte, eosinophil, and macrophage counts (Figure S7A).
Finally, the effect of MTHFD2i was tested on general immune activity. OVA-specific OT-II CD45.2+CD4+ T cells were adoptively transferred into CD45.1+ mice, which were then immunized with subcutaneous emulsion of OVA with Complete Freund’s Adjuvant (CFA) and treated daily with oral vehicle or MTHFD2i. Body weight was unchanged in all conditions (Figure S7B). Expansion of the transferred OT-II CD45.2+ cells was slightly delayed in the immunized MTHFD2i-treated mice but reached vehicle numbers by day 7 (Figure S7C–E). However, the frequency of IFNγ+ cells was reduced in the draining LNs (Figure S7F). These data show that in vivo MTHFD2i treatment allows antigen-specific T cell expansion following acute stimulation, although with dampened inflammatory cytokine production.
DISCUSSION
T cell activation, differentiation, and function require appropriate metabolic reprogramming to meet the cells increased demands for energy, biosynthetic building blocks, and signaling molecules. In this study, we investigated the function of 1C metabolism in primary CD4+ T cells. Using a combination of in vivo primary T cell CRISPR-based screening and gene expression data, MTHFD2 was identified as a potential target for anti-inflammatory therapies. MTHFD2 inhibition or deficiency generally led to decreased CD4+ T cell proliferation. Notably, this was associated with induction of FoxP3 expression and suppressive function in Th17 cells as well as enhanced Treg differentiation. These data suggest that MTHFD2 may function as a metabolic checkpoint in the Th17-Treg cell axis, with MTHFD2i skewing the balance from a pathogenic to a more anti-inflammatory phenotype. Indeed, MTHFD2 inhibition or genetic deficiency ameliorated disease severity in multiple in vivo models of autoimmunity and hypersensitivity.
1C metabolism consists of serine-glycine metabolism, the folate cycle, and the methionine cycle, and is central to several processes including de novo purine synthesis, methyl-donor generation, and redox regulation (Yang and Vousden, 2016). 1C metabolism is robustly engaged with TCR stimulation (Tan et al., 2017) and is required to support T cell expansion (Ma et al., 2017). The folate cycle is compartmentalized into cytosolic and mitochondrial components. In the cytosol, MTHFD1 interconverts 5,10-methyleneTHF, 10-formylTHF, and formate. In the mitochondria, the same reactions are accomplished by MTHFD2 and MTHFD1L. These resulting intermediates are used to support formylation steps in de novo purine synthesis. MTHFD1 and MTHFD2 can also modulate redox state through NAD(H) and NADP(H) generation (Ducker and Rabinowitz, 2017). While some cell types display flexibility in switching to the cytosolic source under settings of mitochondrial pathway dysfunction (Ducker et al., 2016), T cells have been previously proposed to predominantly depend on the mitochondrial pathway to provide 1C units and reductive species (Ron-Harel et al., 2016). T cells have also been shown to rely on serine uptake and in vivo immune responses can be modulated by dietary serine amounts. The effects of serine starvation are mediated by limiting purine biosynthesis even in the presence of intact salvage pathways and can be bypassed by provision of glycine and formate (Ma et al., 2017). Our data add to these findings and point to MTHFD2 as a critical regulator that influences both CD4+ T cell proliferation and differentiation.
While 1C metabolism plays a broad role in cell metabolism, we found some functions were distinct to select T cell subsets. All human and mouse T cells proliferated to a lesser extent with MTHFD2 deficiency, indicating a shared function for MTHFD2 to support T cell growth and division. The effects of MTHFD2 deficiency on T cell differentiation and effector function, however, differed in each subset tested. Th1 cells showed impaired differentiation with reduced induction of T-bet and decreased cytokine production. Th17 cells also had altered differentiation and decreased cytokine production. While RORγt was not altered, MTHFD2-deficient Th17 cells upregulated the Treg cell transcription factor, FoxP3, and gained an ability to suppress proliferation of activated CD8+ T cells. Treg cells exhibited enhanced differentiation in low TGFß conditions. It is now well established that each of these subsets can have distinct metabolic requirements (Bantug et al., 2018; Buck et al., 2015). Our data show that MTHFD2 is also selectively required for Teff while promoting Treg cell fate and functions. It is notable that these outcomes differ from GLUT1, GLS, or ASCT2 deficiencies that impair or alter Teff differentiation while having modest effects to directly promote Treg differentiation or trans-differentiation of Th17 to Treg cells (Johnson et al., 2018; Macintyre et al., 2014; Nakaya et al., 2014).
These distinct T cell fates appear dependent on the enzymatic activity of MTHFD2 as the effects of MTHFD2 deficiency were rescued with formate or purine nucleobases. While we found no significant effect of altered redox balance with MTHFD2 deficiency, altered de novo purine synthesis appears critical. MTHFD2i led to decreased purine concentrations, particularly guanine, while also inducing accumulation of the purine synthesis intermediates GAR, SAICAR, and AICAR. These intermediates require formylation for further biosynthesis and the effects were rescued when the MTHFD2-derived metabolite formate was added to the media, supporting an on target biochemical mechanism for MTHFD2i. De novo nucleotide synthesis to support DNA and RNA synthesis is essential for T cell proliferation (Quéméneur et al., 2003, 2004). Thus, a component of the mechanism by which MTHFD2i impairs T cell expansion appears to be through insufficient generation of nucleotides.
Failure to synthesize adequate nucleotides may suppress effector T cells through multiple mechanisms. AMPK and mTORC1 are major drivers of metabolic reprogramming with generally opposing roles in Teff and Treg cells (Bantug et al., 2018; Buck et al., 2015). We show that MTHFD2i in T cells led to acute accumulation of AICAR, a metabolite notable as an adenosine analog and AMPK activator (Rae and Mairs, 2019; Su et al., 2019). However, there was no evidence of increased AMPK activity at the selected time points. This may reflect additional regulation of AMPK, but AICAR can also have AMPK-independent effects (Dembitz et al., 2019). mTORC1 is also sensitive to purine concentrations, as decreased guanine availability suppresses activity of the mTORC1 activator Rheb (Emmanuel et al., 2017; Hoxhaj et al., 2017). AICAR accumulation and reduction in mTORC1 activity may thus contribute to impaired generation of MTHFD2i-treated Th1 and Th17 cells and enhanced generation of Treg cells. Suppression of mTORC1 signaling may also contribute to shift in the metabolic program from glycolysis to mitochondrial respiration and altered TCA metabolite abundance in MTHFD2i-treated Th17 cells. The mTORC1 pathway plays a central role to promote anabolic metabolism and can drive accumulation of the transcription factor ATF4, which in turn can induce MTHFD2 expression (Ben-Sahra et al., 2016).
Metabolic flux is tied to epigenetic regulation as metabolites contribute to many epigenetic modifications (Sharma and Rando, 2017), including 1C metabolism to generate the universal methyl-donor SAM for protein and DNA methylation. Carbon tracing experiments in activated T cells, however, suggest that 1C units derived from glucose-derived and exogenous serine do not meaningfully contribute to the methionine cycle and methylation (Ma et al., 2017). Metabolic flux may also affect methylation patterns through changes in the abundance of TCA metabolites, including alpha-ketoglutarate, fumarate, and succinate. Specifically, fumarate and succinate inhibit DNA and histone demethylases (Su et al., 2016). Consistent with depletion of these metabolites in MTHFD2i-treated Th17 cells, H3K27me3 was widely reduced across the genome and DNA methylation was reduced specifically at the Foxp3 proximal promoter, which may be contributing to the trans-differentiation phenotype. It is also noted that the Th17 cell trans-differentiation phenotype was not rescued by formate supplementation indicating that additional pathways are likely contributing to FoxP3 regulation, such as through activity of other nucleotide-concentration sensing mechanisms.
MTHFD2 has also been reported to play non-enzymatic roles that may contribute to the pro-inflammatory actions of this enzyme. In cancer cells, MTHFD2 can have nuclear functions, co-localizing with DNA replication sites to promote cell cycle progression (Sheppard et al., 2015). In murine stem cells, MTHFD2 was shown to modulate DNA repair to maintain genomic stability (Yue et al., 2020). In renal cell carcinoma, MTHFD2 was found to be crucial for metabolic reprogramming via mRNA methylation (Green et al., 2019). While these roles for MTHFD2 are not mutually exclusive with our findings, the ability of formate to rescue many of the phenotypes of MTHFD2 deficiency in T cells suggest that MTHFD2 enzymatic activity is the primary driver of T cell proliferation and fate.
MTHFD2 has been largely considered as a drug target in anti-cancer settings. It may also provide a promising anti-inflammatory target and offer fewer adverse effects compared to currently available anti-folates given low expression in most adult tissues. For instance, one target of MTX, DHFR, is expressed extensively in adult tissues (Nilsson et al., 2014). As such, MTX can be associated with a variety of adverse effects including gastrointestinal toxicities. Moreover, the mechanism of action of MTX remains poorly understood despite its extensive history (Cronstein and Aune, 2020). The highly regulated expression of MTHFD2 and potential for redundancy with the cytosolic MTHFD1 pathway may result in selective dependencies of specific cell populations on MTHFD2. Together our findings identify MTHFD2 as a critical metabolic checkpoint in CD4+ T cells. While there is broad overlap between cancer cell biology and the biology of rapidly proliferating T cells, we find that CD4+ T cell subsets display an additional sensitivity through modulation of cell differentiation and function. It is likely that targeting MTHFD2 in cancer therapies may restrain anti-tumor immunity. However, settings such as colorectal carcinoma, where Th17 cell-mediated inflammation contributes to disease, may be well suited to MTHFD2 inhibitors. T cell sensitivity to MTHFD2 inhibitors may provide effective form of immunotherapy in settings of CD4+ T-cell driven inflammation beyond cancer, and lead to fewer adverse effects than currently available therapeutics.
Limitations of Study
The MTHFD2i used in this study has an IC50 value of 0.0063 μM for MTHFD2 and 0.57 μM for MTHFD1, and therefore minor off-targeted effects of MTHFD2 and MTHFD1 dual inhibition cannot be excluded. Given that the aberrant FoxP3 upregulation in Th17 cells was not rescued by provision of formate but mTORC1 activity was, the mechanism underlying this phenotype requires further investigation. Additionally, all in vivo models were performed with MTHFD2i or genetic ablation from the time of disease induction and T-cell phenotyping was performed at a single time point. To better characterize the effect of MTHFD2 deficiency on disease pathogenesis, further studies should include time course experiments with serial characterization of T cell populations to more definitively determine whether CD4+ T cell subsets are differentially affected in vivo. Finally, to improve the relevance of this study to clinical applications, the efficacy of MTHFD2i started after disease onset should be tested.
STAR METHODS
Resource Availability
Lead Contact:
Further information and requests for resources and reagents should be directed to and will be fulfilled upon completion of appropriate MTA by the Lead Contact, Dr. Jeffrey Rathmell (jeff.rathmell@vumc.org).
Materials Availability:
Plasmids and mouse lines generated in this study will be made available upon completion of appropriate MTA upon request.
Data and code availability:
CUT&RUN sequencing data have been deposited at GEO and are publicly available as of the date of publication (GSE180356). Microscopy data and original western blot images reported in this paper will be shared by the lead contact upon request. Any additional information required to reanalyze the data reported in this paper is available from the lead contact upon request.
Experimental Model and Subject Details
Mice:
All experiments were performed at Vanderbilt University, University of Iowa, or Fidelta animal facility in accordance with Institutional Animal Care and Utilization Committee (IACUC)-approved protocols and conformed to all relevant regulatory standards. Mice were housed in pathogen-free facilities in ventilated cages with ad libitum food and water and at most 5 animals per cage. Eight- to sixteen-week-old male and female mice were used for all animal experiments. All mice except Mthfd2fl/fl mice described below were obtained from Jackson Laboratory and were treatment-naive until the start of study.
OT-II mice were crossed to Cas9 mice to generate OT-II Cas9 double-transgenic strain. Animals were genotyped for transgenic TCR and Cas9 allele. Mthfd2fl/fl mice were generated from C57BL/6N-Atm1Brd Mthfd2tm1a(EUCOMM)Wtsi/BayMmucd by Mutant Mouse Resource & Research Centers (MMRRC) at UC Davis. These mice were first crossed to FLPo mice. The F1 mice were then crossed to Cd4-cre mice for several generations to obtain a strain with Mthfd2fl/fl Cd4-cre+ conditional gene deletion and Mthfd2fl/fl Cd4-cre− WT littermates. Animals were genotyped for floxed and cre alleles.
Human T cells:
PBMCs were collected under an approved IRB from anonymous healthy blood donors. Naïve CD4+ T cells were isolated using the Naïve CD4 T Cell Isolation Kit II (Miltenyi) according to the manufacturer’s instructions.
Cell Lines:
Plat-E retroviral packaging cell line was maintained at 37°C with 5% CO2 in DMEM media supplemented with 10% FBS, 100U/mL penicillin/streptomycin, 1μg/mL puromycin, and 10μg/mL blasticidin to maintain expression of viral packaging genes. HEK293T cell line was maintained in DMEM media supplemented with 10% FBS.
Method Details
In vitro mouse CD4+ T cell activation and differentiation:
Primary murine CD4+ T cells were isolated from the spleens and lymph nodes of mice using a negative isolation kit according to the manufacturer’s instructions. The cells were cultured at 37°C with 5% CO2 in RPMI 1640 media supplemented with 10mM HEPES, 50μM 2-mercaptoethanol, 100U/mL penicillin/streptomycin, and 2mM glutamine, unless otherwise stated. Primary CD4+ T cells were activated using plate-bound anti-CD3 (3μg/mL) and anti-CD28 (5μg/mL) antibodies at 125,000 cells/well for 96-well plate and 1 million cells/well for 24-well plate. Cells were cultured for 3 to 4 days as specified with subset-specific cytokines and antibodies to promote differentiation - Th1 cells: IL-12p70 (10ng/mL), IL-2 (100U/mL), anti-IL-4 (10μg/mL), anti-IFNγ (1μg/mL); Th17 cells: IL-6 (50ng/mL), TGFβ (1ng/mL), IL-23 (10ng/mL), IL-1b (10ng/mL), anti-IL4 (10μg/mL), anti-IFNγ (10μg/mL); Treg cells: TGFβ (1.5ng/mL; 0.3ng/mL for low TGFß conditions), IL-2 (100U/mL), anti-IL4 (10μg/mL), anti-IFNγ (10μg/mL). DS18561882 (MTHFD2i) was dosed at 500nM for murine cells and 2μM for human cells unless otherwise specified. Rescue experiments were performed with 1mM sodium formate or 60μM adenine and guanine purine solution. For intracellular and transcription factor stains, cells were first stained with viability dye, fixed and permeated using appropriate kits, then stained for proteins. For cytokine stains, cells were stimulated with 12-myristate 13-acetate (PMA) and ionomycin in the presence of GolgiPlug for four hours, then processed as other intracellular stains. For MTHFD2 staining, cells were fixed in Fixation/Permeabilization Solution (BD Sciences) followed by ice-cold methanol.
Th17 cell suppression assay:
Primary CD4+ T cells were activated and differentiated to Th17 cells for 72 hours with 0nM, 100nM, or 500nM DS18561882. Th17 cells were then collected, washed, and re-seeded into fresh complete media with responder CD8+ T cells at equal numbers on anti-CD3 and anti-CD28 antibody-coated plates. Responder CD8+ T cells were isolated from the spleens and lymph nodes of mice using a negative isolation kit and stained with 5μM CellTrace Violet (CTV) cell proliferation dye. CTV dilution was assessed by flow cytometry after 72 hours of co-culture.
In vitro human CD4+ T cell culture conditions:
Naïve CD4+ T cells were isolated using the Naïve CD4 T Cell Isolation Kit II (Miltenyi) according to the manufacturer’s instructions. All human T cells were cultured at 37°C with 5% CO2 in human plasma-like medium (HPLM) (Cantor et al., 2017) supplemented with 10% dialyzed FBS. In MTHFD2i experiments, T cells were activated in the presence of either DMSO control or 2μM DS18561882. Th1 cell cultures were activated with CD2, CD3, and CD28 activation beads (Human T cell Activation/Expansion kit, Miltenyi) at a 2:1 ratio of cells to beads with anti-IL-4 (2μg/mL), IL-2 (100U/mL), and IL-12p70 (5ng/mL). Th17 cell cultures were activated with non-tissue culture treated plates with plate-bound anti-CD3 (3μg/mL), anti-CD28 (1μg/mL), and anti-ICOS (1μg/mL) antibodies. Media was supplemented with anti-IL-4 (2μg/mL), anti-IFNγ (2μg/mL), IL-23 (50ng/mL), IL-1β (50ng/mL), TGFβ1 (5ng/mL), IL-21 (25ng/mL) and IL-6 (40ng/mL). iTreg cell cultures were activated similarly with plate-bound anti-CD3 (4μg/mL) and anti-CD28 (3μg/mL) antibodies in media supplemented with anti-IL-4 (2μg/mL), anti-IFNγ (2μg/mL), TGFβ1 (5ng/mL), IL-2 (100U/mL), and all-trans retinoic acid (ATRA, 10nM). Th1 and iTreg cultures were also supplemented with IL-2 from day 3.
For siRNA silencing experiments, cells were differentiated for 3 days and then transduced with lentiviral vectors consisting of siRNA specific for MTHFD2 (siMTHFD2), or a scramble siRNA control (NTC). Lentiviruses were packaged by transfecting HEK293T cells with pCMV-VSV-G and psPAX2 diluted in Opti-MEM. Transfections were conducted using X-tremeGENE HP DNA transfection reagent according to the manufacturer’s instructions and viral supernatants were collected and filtered 72 hours later. For transduction, viral supernatants were centrifuged at 2,000×g for 2 hours at 32°C on retronectin-coated plates. Activated T cells were then layered onto plates and centrifuged for an additional 15 minutes. Silencing efficiencies were determined by RT-qPCR after 3 days. All downstream flow cytometric analyses were conducted by gating on live GFP+ cells to select for transduced T cells.
CRISPR screening:
1C metabolism gRNA library was curated by referencing the Mouse CRISPR Knockout Pooled Library (Brie) (Addgene, Pooled Library #73632). Four gRNA sequences for each gene and ten non-targeting controls, flanked by the following adapter sequences were purchased as an oligo pool from Twist Bioscience: GGAAAGGACGAAACACCGXXXXXXXXXXXXXXXXXXXXGTTTTAGAGCTAGAAATAGCAAGTTAAAATAAGGC. The library was further prepared for transduction following published methods (Anderson et al., 2017; Shalem et al., 2014) with several modifications. Briefly, additional sequences were attached by PCR using Array primers and Herculase II Fusion DNA Polymerase. After purification by gel extraction using QIAquick Gel Extraction Kit, the fragment was cloned into the retroviral expression vector pMx-U6-gRNA-GFP using Gibson Assembly Master Mix. The resultant plasmid pool was amplified by electroporation into ElectroMAX DH10B Cells and plated on ampicillin plates to obtain enough colonies for 50-fold coverage of the library. DNA was isolated using GeneJET Plasmid Maxiprep Kit.
DNA was transfected into Plat-E retroviral packaging cell line using Polyplus jetPRIME DNA and siRNA transfection reagent. Media was changed 24 hours post transfection, and viral supernatant was collected after an additional 48 hours of culture. Meanwhile, CD4+ T cells were isolated from the spleen and lymph nodes of OT-II Cas9 double-transgenic mice and activated with splenocytes irradiated at 30 Gy and OVA peptide (10μg/mL). 48 hours post T cell activation, the viral supernatant was spun onto retronectin treated non-tissue culture plates at 2000xg for 2 hours at 32°C. Activated T cells were transferred to the plates and spun for an additional 15 minutes, then replaced in the incubator. On day 3 post T cell activation, a sample of the cells were collected at 1000-fold representation of the library. Additionally, 3 million live GFP+ cells were adoptively transferred into each Rag1−/− mice by tail vein injection. On days 1, 3, 5, and 7 post adoptive transfer, mice were sensitized with intranasal ovalbumin protein. On day 8 post adoptive transfer, lungs and spleens were collected, and T cells isolated by positive selection using CD4 (L3T4) microbeads.
Genomic DNA from cells were extracted with Kapa Express Extract Kit. gRNA sequences were amplified by two rounds of PCR with two technical replicates: first round with Adapter primers and second round with barcoded Illumina sequencing primers. The amplicons were then purified by gel extraction, combined at equimolar, and sequenced for 150 cycles in paired-end mode on the Illumina Novaseq 6000 platform at the Vanderbilt Technologies for Advanced Genomics (Vantage). At least 1000-fold representation of the library was maintained throughout the process. FASTQ files were analyzed using the Model-based Analysis of Genome-wide CRISPR/Cas9 Knockout (MAGeCK v0.5.0.3) method (Li et al., 2014) for statistical analysis. Briefly, files are first median normalized by read count. Then, gRNA abundance across samples is compared using a negative binomial model to generate p-values. Here, we compared the gRNA frequency in the CD4+ T cells isolated from the lungs of three biological replicates (day 8) to the gRNA frequency in the CD4+ T cells at the time of adoptive transfer (day 0).
Mass spectrometry metabolomics:
Cultured cells were collected and washed with PBS. Each sample was resuspended in precooled extraction buffer (by volume, 40% methanol, 40% acetonitrile, 20% water, and 0.5% formic acid) at the ratio of 75μL of buffer per 1 million cells. The samples were then neutralized by 15% NH4HCO3 aqueous solution at 8.8 vol% of the extraction buffer. Cell extracts were stored in −80°C freezers prior to analysis. Samples were thawed on ice, and insoluble contents were pelleted by centrifugation (16,000×g, 10 minutes) at 4°C. To further precipitate proteins, 40μL of supernatant was diluted in 40μL of methanol, followed by incubation on dry ice for 1 hour. Then the samples were spun down (16,000×g for 10 minutes) at 4°C and supernatants were transferred into vials and stored at 4°C until analysis. Samples were analyzed by Q Exactive Plus Quadrupole-Orbitrap Mass Spectrometer (Thermo Scientific) coupled with hydrophilic interaction chromatography (HILIC). 10μL of each sample was injected into the LC system. Metabolites were separated by a XBridge BEH Amide Column (2.5μM, 150mm × 2.1mm, Waters) with a 25 minutes gradient from Solvent B (acetonitrile) to Solvent A (95 vol% H2O and 5 vol% acetonitrile solution with 20 mM NH4OAc, 20 mM NH3·H2O, pH 9.4). LC-MS method was reported in Anal. Chem. 2019, 91, 3, 1838–1846 (Wang et al., 2019). Raw data were converted into .mzXML format, and data analysis was performed using El-MAVEN (v0.8.0).
Proton nuclear magnetic resonance spectroscopy (1H-MRS):
Conditioned culture media and cells were collected following 72 hours of culture and processed as previously reported (Govindaraju et al., 2000). Briefly, for quantification of metabolites from conditioned supernatant, a total of 50μL D2O and 50μL of 0.75% sodium 3-trimethylsilyl-2,2,3,3-tetradeuteropropionate (TSP) in D2O was added to 500μL media and transferred to 5-mm NMR tubes (Wilmad-LabGlass, Kingsport, TN). For quantification of intracellular metabolites, a total of 180μL of a master mix of D2O and of 0.75% TSP in D2O were added to dried soluble cell extract and transferred to 3-mm NMR tubes (Wilmad-LabGlass, Kingsport, TN). 1H-MRS spectra were acquired on an Avance III 600 MHz spectrometer equipped with a Triple Resonance CryoProbe (TCI) (Bruker) at 298 K with 7500-Hz spectral width, 32,768 time domain points, 32 scans (supernatant) or 256 scans (cell extracts), and a relaxation delay of 2.7 seconds. The water resonance was suppressed by a gated irradiation centered on the water frequency. The spectra were phased, baseline corrected, and referenced to TSP using Chenomx NMR Suite. Spectral assignments were based on literature values.
Immunoblotting:
Cells were lysed with base lysis buffer containing 1% IGEPAL CA-630, 200mM NaCl, and 50mM Tris pH 8.0 on ice for 30 minutes. The base lysis buffer was supplemented with the protease inhibitors aprotinin (5ug/mL), leupeptin (5ug/mL), sodium fluoride (0.9mM), dithiothreitol (DTT, 1mM), sodium vanadate (1mM), and beta-glycerophosphate (20mM). Lysates were centrifuged for 15 minutes at 4°C to recover supernatant and quantified for protein concentration using Protein Assay Dye Reagent Concentrate. 40ug of protein was loaded per well for polyacrylamide gel electrophoresis using Mini-PROTEAN Precast Polyacrylamide Gels (Bio-Rad). Western blotting was performed using low fluorescence PVDF membrane (Bio-Rad). Transfer was accomplished using 1X Towbin Transfer Buffer Containing 20% methanol at 300mA for 1 hour. Blots were blocked for 1 hour using Intercept (TBS) Blocking Buffer (LI-COR Biosciences), before incubation with primary antibody overnight at 4°C. Blots were incubated for 1hr at room temperature with IRDye Secondary antibodies and were visualized by near infrared fluorescence via Li-COR Odyssey CLx imager. The antibodies used for westerns were: ß-actin (1:1000), phospho-S6 (Ser235/236) (1:2000), S6 (1:1000), phospho-ACC (1:1000), ACC (1:1000), phospho-AMPK (1:1000), AMPK (1:1000), phospho-ULK1 (Ser777) (1:700), HIF-1α (1:1000), and phospho-STAT3 (1:2000).
CUT&RUN:
CUT&RUN was performed using CUT&RUN kit with magnetic based method. Briefly, 200,000 cells were harvested by centrifugation at 600xg for 3 minutes and washed twice with the wash buffer provided in the kit. The cells were resuspended in 100μl wash buffer and mixed with 10μl pre-activated ConA beads on rotator for 5 minutes to bind cells to the magnetic beads. The beads were then transferred to antibody binding buffer containing 2.5μl H3K27me3 antibody or 5μl IgG control antibody and incubated for 2 hours at 4°C on a rotator. After incubation, beads were washed in 1ml digitonin buffer to remove unbound antibody and then resuspended in 100μl digitonin buffer containing 1.5μl pA-MNase and incubated at 1 hour at 4°C on a rotator. After 2 washes with 1ml digitonin buffer to remove unbound pA-MNase, the beads were resuspended in 150μl digitonin buffer and 3μl CaCl2 was added to a final concentration of 2mM. This was incubated in an ice/water mix for 30 minutes to complete the digestion. The reaction was quenched by the addition of 150μl stop buffer. Cleaved fragments were liberated into the supernatant by incubating the beads at 37°C for 10 minutes. DNA fragments were extracted from the supernatant and used for the construction of sequencing libraries using KAPA HyperPrep Kit. Libraries were sequenced for 150 cycles in paired-end mode on the Illumina Novaseq 6000 platform at the Vanderbilt Technologies for Advanced Genomics (Vantage).
CUT&RUN data analysis was performed by first trimming paired-end fragments with Trimmomatic (v0.39) to remove adapter and low-quality nucleotides. Fragments were then mapped onto the mouse genome GRCm38.p6 using bowtie2 (v2.3.5.1) with the following options: --local --very-sensitive-local --no-unal --no-mixed --no-discordant --phred33 -k 1 -I 10 -X 700. Then alignment SAM files were transformed to BAM and BIGWIG files using samtools (v1.9) and deeptools (v3.3.1) for data analysis and visualization. For mapping signal around gene promoters, the gene annotation track (geocode v23 known genes track) was downloaded from the UCSC table browser as a bed file and used as reference for heatmaps. MACS2 (v2.2.7.1) was used for calling peaks with the following options: --broad -p 1e-5 -f BAMPE -keep-dup all. R package DiffBind (v2.16.2) was used for comparing differential peaks between treatment and making the MA plots. Data are available at GSE180356.
EpigenDx Targeted NextGen Bisulfite Sequencing:
FoxP3 gene sequence was acquired from Ensembl genome browser and annotated. The target EPIC array probe sequences were re-evaluated against UCSC genome browser for repeat sequences including LINE, SINE, LTR elements, and other DNA repeats. Sequences containing repetitive elements, low sequence complexity, high thymidine content and overall CpG density were excluded for in silico design process.
Cell pellet samples were lysed using M-digestion Buffer (Zymo Research) and 5–10μl of protease K (20mg/Ml) with a final M-digestion concentration of 1X. The samples were incubated at 65°C for a minimum of 2 hours. For DNA bisulfite modification, 20μL of the supernatant from the sample lysates were bisulfite modified using EZ-96 DNA Methylation-Direct Kit (Zymo Research) as per the manufacturer’s protocol with minor modification. The bisulfite modified DNA samples were eluted using M-elution buffer in 4μl. Bisulfite-modified DNA samples were amplified using separate multiplex or simplex PCRs. PCRs included 0.5 units of Qiagen HotStarTaq, 0.2μM primers, and 3μl of bisulfite-treated DNA in a 20μl reaction with the following program: 95°C 15min; 45 x (95°C 30s; Ta°C 30s; 68°C 30s); 68°C 5min; 4°C ∞. All PCR products were verified and quantified using the QIAxcel Advanced System. Prior to library preparation, PCR products from the same sample were pooled and purified using QIAquick PCR Purification Kit.
Libraries were prepared using a custom Library Preparation method created by EpigenDx. Next, library molecules were purified using Agencourt AMPure XP beads and quantified using the QIAxcel Advanced System (Qiagen). Barcoded samples were then pooled in an equimolar fashion before template preparation and enrichment were performed on the Ion Chef system (Thermo Fisher) using Ion 520 & Ion 530 ExT Chef reagents. Following this, enriched, template-positive library molecules were then sequenced on the Ion S5TM sequencer using an Ion 520 or Ion 530 sequencing chip (Thermo Fisher). FASTQ files from the Ion Torrent S5 server were aligned to the local reference database using open-source Bismark Bisulfite Read Mapper with the Bowtie2 alignment algorithm. Methylation frequencies were calculated in Bismark by dividing the number of methylated reads by the total number of reads.
In vivo EAE models for IHC and flow cytometry:
2 separate methods of EAE induction were used. In the first method, female C57BL/6 mice aged 8–12 weeks were injected subcutaneously with 0.2mL MOG with CFA emulsion and i.p. 100ng PTX. The PTX injection was repeated 24 hours later. For the in vivo EAE experiment with WT and CD4ΔMthfd2 littermates, female mice aged 8–12 weeks were immunized with 0.2mL MOG with CFA emulsion and 150ng PTX injections (Hooke Laboratories). In the second method, CD4+ T cells were isolated from 2D2 mice aged 8–12 weeks. Cells were activated with splenocytes irradiated at 30Gy and MOG peptide (10μg/mL) and Th17 cytokines. On day 4 post activation, cells were transferred to fresh media with IL-23 (20ng/mL) to rest for an additional 3 days. On day 7 post activation, cells were re-stimulated with plate-bound anti-CD3 and anti-CD28 antibodies. 48 hours post restimulation, 10 million live cells were resuspended in 100μl PBS with 2% FBS and injected into Rag1−/− mice by tail vein injection. Mice were observed daily for clinical severity.
Once mice started exhibiting paralysis of both hind limbs, they were sacrificed for further analysis. For histology, sample preparation was completed by the Vanderbilt Translational Pathology Shared Resource (TPSR) core. For T cell isolation, the spinal cord was dissected out and digested in 300U/mL Collagenase IA and 50U/mL DNase I at 37 °C for 45 minutes. The digested cord was filtered through a 70μm filter and spun on a 18.6%/62.4% Percoll gradient at 2400rpm for 30 minutes at room temperature. Immune cells were collected from the middle layer, washed, and stained for flow cytometry.
In vivo LY345899 treatment in EAE model:
Female C57BL/6 mice aged 8–12 weeks were purchased from Jackson Laboratories and maintained at the University of Iowa animal facility in accordance with NIH and institutional guidelines. EAE was induced in mice by subcutaneous immunization in both flanks with 100μg of MOG peptides emulsified in CFA containing Mycobacterium tuberculosis H37Ra (100μg/mouse). PTX (100 ng) was administered i.p. at days 0 and 2 post immunization (Shahi et al., 2019). Animals were divided into two groups and treated i.p with 10mg/kg LY345899 or DMSO and PBS vehicle control every day starting day 4 post EAE induction till the end of the experiment. Mice were observed daily for clinical severity and scored according to the following scale: 0- no clinical disease, 1- loss of tail tonicity, 2- hind limb weakness, 3- partial hind limb paralysis, 4- complete hind limb paralysis, and 5- moribund/death. Mice were euthanized at score of 4 for analysis.
In vivo DS18561882 treatment in DTH model:
Female BALB/c mice aged 8 weeks were purchased from Charles River and maintained at Fidelta animal facility in accordance with AAALAC and institutional guidelines. KLH-DTH was induced by subcutaneous immunization on day 0 with 100μL of 4mg/mL KLH and 0.5mg/mL CFA emulsion. Mice were challenged on day 7 in the pinna of the left ear with 4mg/mL KLH antigen dissolved in 0.9% NaCl solution, while the right ear pinna was challenged with 0.9% NaCl solution. Animals were treated from days 0–10 twice daily orally with 10 mL/kg vehicle (5% DMSO and 95% (0.5%)HPMC/(0.1%)Tween80 in distilled water) or DS18561882 at a dose of 100 and 300 mg/kg and 10 mL/kg. Body weight was measured daily from days 0–10, ear thickness was measured on day 7 prior to challenge and then on days 8–10. On day 10 terminal blood was collected by carotid artery bleeding. Serum was prepared from coagulated blood samples by centrifugation at 3500rpm for 15 minutes, separated and stored at −80 °C for subsequent KLH-IgG analysis by ELISA. ELISAs were performed in accordance with the manufacturer’s instructions. Postmortem, a circular piece of both ear pinna, 8mm in diameter, was cut out with a biopsy punch, weighed on a precise analytical balance and recorded.
In vivo IBD model with WT and CD4ΔMthfd2 littermates:
Donor cells were prepared by isolating naïve CD4+ T cells (CD4+CD25−CD45RBhi) by magnetic bead isolation (Miltenyi) from WT and CD4ΔMthfd2 littermates aged 8–12 weeks. 400,000 naïve CD4+ T cells were i.p. injected into recipient male Rag1−/− mice aged 8 weeks to induce colitis. Mice were weighed twice weekly to monitor disease progression. Mice were euthanized after 7 weeks and spleen and mesenteric lymph nodes were collected for T cell phenotyping.
In vivo allergic airway disease model with WT and CD4ΔMthfd2 littermates:
WT and CD4ΔMthfd2 littermates aged 8–12 weeks were anesthetized with isoflurane and challenged intranasally with 8μg Alternaria Extract (Lot 338869) or PBS vehicle every 3 days for 4 total challenges as previously described (Palmer et al., 2019). 24 hours after the last challenge, mice were sacrificed using a fatal dose of i.p. phenobarbital. BALF was collected by instilling and withdrawing 800μL of saline through a tracheostomy tube into the lungs. Cells from the BALF were then adhered to a slide and stained using Epredia Richard-Allan Scientific Three-Step Stain Kit (Thermo Fisher). Identification and quantification of eosinophils, neutrophils, lymphocytes, and macrophages was completed using light microscopy as previously described (Fuseini et al., 2018).
In vivo DS18561882 treatment in OVA immunization model:
Donor cells were prepared by isolating CD4+ T cells by magnetic bead isolation from male OT-II mice aged 8 weeks. 1 million OT-II CD4+ T cells were tail-vein injected into recipient male CD45.1 mice aged 8 weeks. Recipient mice were immunized next day with OVA/CFA emulsion (Hooke Laboratories). Mice were treated with either 300mg/kg DS18561882 or vehicle (1% hydroxyethylcellulose, 0.25% Tween 80, 0.05% antifoam) daily by oral gavage for 9 days. Blood was collected via cheek bleed by lancet puncture (Goldenrod) into heparinized collection tubes (Fischer, Cat# 02–668-10) and ACK lysed. Mice were euthanized on day 9 post immunization to harvest spleen and lymph nodes for T cell phenotyping.
Quantification and Statistical Analysis
Statistical analyses were performed with Prism software (v8). Statistically significant results are labelled (* p < 0.05, ** p < 0.01, *** p < 0.001, **** p ≤ 0.001). Error bars show mean ± standard deviation unless otherwise indicated. All experiments were carried out in triplicate biological replicates unless otherwise stated. Flow cytometric plots shown are representative of biological replicates.
Supplementary Material
Key Resources Table.
| Reagent or Resource | Source | Identifier |
|---|---|---|
| Antibodies | ||
| Anti-IFNγ | Thermo Fisher Scientific | Cat# 16-7311-38, RRID:AB_2637490 |
| Anti-IL-4 | Thermo Fisher Scientific | Cat# 16-7041-95, RRID:AB_2573101 |
| Mouse Anti-CD3e | Thermo Fisher Scientific | Cat# 16-0031-86, RRID:AB_468849 |
| Mouse Anti-CD28 | Thermo Fisher Scientific | Cat# 16-0281-86, RRID:AB_468923 |
| Human anti-CD3 | BD Biosciences | Cat# 555336, RRID:AB_395742 |
| Human anti-CD28 | BD Biosciences | Cat# 555725, RRID:AB_396068 |
| Anti-MTHFD2 | Thermo Fisher Scientific | Cat# PA5-30407, RRID:AB_2547881 |
| Anti-IFNγ APC | BD Biosciences | Cat# 554413; RRID:AB_398551 |
| Anti-IL-17A PE | Thermo Fisher Scientific | Cat# 12-7177-81, RRID:AB_763582 |
| Anti-IL-2 PE | BD Biosciences | Cat# 554428, RRID:AB_395386 |
| Anti-CD25 APC | Thermo Fisher Scientific | Cat# 17-0251-81, RRID:AB_469365 |
| Anti-CD25 PE | BioLegend | Cat# 101904, RRID:AB_312847 |
| Anti-CD3 APC | BioLegend | Cat# 100236, RRID:AB_2561456 |
| Anti-CD4 AF488 | Thermo Fisher Scientific | Cat# 53-0041-82, RRID:AB_469893 |
| Anti-CD4 eFluor 450 | Thermo Fisher Scientific | Cat# 48-0041-82 RRID:AB_10718983 |
| Anti-CD4 PE | BioLegend | Cat# 100512, RRID:AB_312715 |
| Anti-CD45.2 BV510 | BioLegend | Cat# 109838, RRID:AB_2650900 |
| Anti-CD8a PE | Thermo Fisher Scientific | Cat# 12-0081-82 RRID:AB_465530 |
| Anti- FoxP3 APC | Thermo Fisher Scientific | Cat# 17-5773-82, RRID:AB_469457 |
| Anti-FoxP3 eFluor 450 | Thermo Fisher Scientific | Cat# 48-5773-82, RRID:AB_1518812 |
| Anti-FoxP3 FITC | Thermo Fisher Scientific | Cat# 11-4777-42 RRID:AB_11149498 |
| Anti-T-bet APC | Thermo Fisher Scientific | Cat# 17-5825-82, RRID:AB_2744712 |
| Anti-T-bet PE | Thermo Fisher Scientific | Cat# 12-5825-82, RRID:AB_925761 |
| Anti-RORγt PE | Thermo Fisher Scientific | Cat# 12-6988-82, RRID:AB_1834470 |
| Anti-Ki-67 eFIuor 450 | Thermo Fisher Scientific | Cat# 48-5698-82, RRID:AB_11149124 |
| Anti-human Ki-67 PacificBlue | BioLegend | Cat# 350511 RRID:AB_10895904 |
| Anti-Nur77 PE | Thermo Fisher Scientific | Cat# 12-5965-82, RRID:AB_1257209 |
| Anti-phospho-S6 APC | Thermo Fisher Scientific | Cat# 17-9007-42, RRID:AB_2573270 |
| Anti-Annexin V APC | BioLegend | Cat# 640920 |
| Isotype PE control | Thermo Fisher Scientific | Cat#12-4714-42, RRID:AB_1944423 |
| Anti-phospho-S6 | Cell Signaling Technology | Cat# 4858, RRID:AB_916156 |
| Anti-S6 | Cell Signaling Technology | Cat# 2317, RRID:AB_2238583 |
| Anti-HIF-1α | Cell Signaling Technology | Cat# 14179, RRID:AB_2622225 |
| Anti-β-actin | Cell Signaling Technology | Cat# 4970, RRID:AB_2223172 |
| Anti-phospho ACC | Cell Signaling Technology | Cat# 3661, RRID:AB_330337 |
| Anti-ACC | Cell Signaling Technology | Cat# 3662, RRID:AB_2219400 |
| Anti-phospho ULK1 (Ser777) | Sigma-Aldrich | Cat#: ABC213, RRID:AB_2861423 |
| Anti-phospho AMPK | Cell Signaling Technology | Cat#: 2535, RRID:AB_331250 |
| Anti-AMPK | Cell Signaling Technology | Cat#: 2793, RRID:AB_915794 |
| Anti-phospho-STAT3 | Cell Signaling Technology | Cat# 9145, RRID:AB_2491009 |
| Anti-CD16/CD32 | BD Biosciences | Cat# 553142, RRID:AB_394657 |
| Anti-H3K27me3 | Cell Signaling Technology | Cat# 9733, RRID:AB_2616029 |
| IRDye 800CW Secondary | LI-COR Biosciences | Cat# 926-32211, RRID:AB_621843 |
| IRDye 680LT Secondary | LI-COR Biosciences | Cat# 926-68020, RRID:AB_10706161 |
| Experimental Models: Organisms/Strains | ||
| Mouse: C57BL/6J | Jackson Laboratory | JAX: 000664 |
| Mouse: Rag1−/− (B6.129S7-Rag1tm1Mom/J) | Jackson Laboratory | JAX: 002216 |
| Mouse: OT-II (B6.Cg-Tg(TcraTcrb)425Cbn/J) | Jackson Laboratory | JAX: 004194 |
| Mouse: 2D2 (C57BL/6-Tg(Tcra2D2,Tcrb2D2)1Kuch/J) | Jackson Laboratory | JAX: 006912 |
| Mouse: CD45.1 (B6.SJL-Ptprca Pepcb/BoyJ) | Jackson Laboratory | JAX: 002014 |
| Mouse: Cas9 (Gt(ROSA)26Sortm1.1(CAG-cas9*,EGFP)Fezh/J) | Jackson Laboratory | JAX: 024858 |
| Mouse: FLPo (B6.129S4-Gt(ROSA)26Sortm2(FLP*)Sor/J) | Jackson Laboratory | JAX: 012930 |
| Mouse: CD4-Cre (B6.Cg-Tg(Cd4-cre)1Cwi/BfluJ) | Jackson Laboratory | JAX: 022071 |
| Mouse: MTHFD2fl/fl | MMRRCC at UC Davis | Generated from RRID:MMRRC_041551-UCD |
| Experimental Models: Cell Lines | ||
| Plat-E retroviral packaging cell line | Cell Biolabs | Cat# RV-101, RRID:CVCL_B488 |
| HEK293T cell line | ATCC | Cat# CRL-3216 RRID:CVCL_0063 |
| Chemicals, Peptides, and Recombinant Proteins | ||
| Recombinant murine IL-12p70 | Thermo Fisher Scientific | Cat# 14-8121-62 |
| Recombinant murine IL-6 | Miltenyi Biotec | Cat# 130-096-683 |
| Recombinant murine IL-23 | Miltenyi Biotec | Cat# 130-096-676 |
| Recombinant murine IL-1β | Miltenyi Biotec | Cat# 130-101-681 |
| Recombinant human IL-12p70 | Peprotech | Cat# 200-12H |
| Recombinant human IL-2 | NCI | Cat# Ro 23-6019 |
| Recombinant human IL-6 | Peprotech | Cat# 200-06 |
| Recombinant human IL-23 | Peprotech | Cat# 200-23 |
| Recombinant human IL-21 | Peprotech | Cat# 200-21 |
| Recombinant human IL-1β | Thermo Fisher Scientific | Cat# 201-LB-010 |
| Recombinant human TGFβ1 | Peprotech | Cat# 100-21 |
| All-trans retinoic acid (ATRA) | Sigma-Aldrich | Cat# R2625 |
| FBS | Avantor | Cat# 97068-085 |
| Dialyzed FBS | Sigma-Aldrich | Cat# F0392 |
| RPMI 1640 | Corning | Cat# 10-040-CV |
| DMEM | Thermo Fisher Scientific | Cat# 11965-092 |
| HPLM | (Cantor et al., 2017) | n/a |
| HEPES | Thermo Fisher Scientific | Cat# 15630-080 |
| Penicillin/streptomycin | Thermo Fisher Scientific | Cat# 15140-122 |
| Puromycin | Santa Cruz Biotechnology | Cat# sc-205821 |
| Blasticidin | Thermo Fisher Scientific | Cat# A11139-03 |
| Glutamine | Thermo Fisher Scientific | Cat# 25030-149 |
| 2-mercaptoethanol | Thermo Fisher Scientific | Cat# 21985-023 |
| EDTA | Corning | Cat# 46-034-CI |
| DS18561882 | MedChemExpress | Cat# HY-130251 |
| LY345899 | MedChemExpress | Cat# HY-101943 |
| PMA | Sigma-Aldrich | Cat# P8139 |
| Ionomycin | Sigma-Aldrich | Cat# IO634 |
| GolgiPlug | BD Biosciences | Cat# 555029 |
| Acetonitrile, LC/MS grade | Thermo Fisher Scientific | Cat# A955 |
| Methanol, LC/MS grade | Thermo Fisher Scientific | Cat# A456 |
| Formic acid, LC/MS grade | Thermo Fisher Scientific | Cat# A11750 |
| Ammonium bicarbonate, LC/MS grade | Honeywell Fluka | Cat# 40867 |
| Water, LC/MS grade | Thermo Fisher Scientific | Cat# 7732-18-5 |
| Retronectin | Takara Bio | Cat# T100A |
| ACK Lysing Buffer | Thermo Fisher Scientific | Cat# A1049201 |
| MOG35-55 peptide | GenScript | Cat# RP10245 |
| CFA | BD Biosciences | Cat# 263810 |
| Mycobacterium tuberculosis H37Ra | BD Biosciences | Cat# 231141 |
| OVA323-339 (chicken, Japanese quail) | Sigma-Aldrich | Cat# O1641 |
| EndoFit Ovalbumin | InVivoGen | Cat# vac-pova |
| Alternaria Alternata Extract | Greer Laboratories | Cat# XPM1C3A25 |
| IGEPAL CA-630 | Sigma-Aldrich | Cat# I8896 |
| Bio-Rad Protein Assay Dye Reagent Concentrate | Bio-Rad | Cat# 5000006 |
| Intercept (TBS) Blocking Buffer | LI-COR Biosciences | Cat# 927-60001 |
| D2O | Sigma-Aldrich | Cat# 151882 |
| D2O+TSP | Sigma-Aldrich | Cat# 293040 |
| Chelex 100 | Sigma-Aldrich | Cat# C7901 |
| KLH | Sigma-Aldrich | Cat# H7017 |
| (Hydroxypropyl)methyl cellulose | Sigma-Aldrich | Cat# H8384 |
| TWEEN 80 | Sigma-Aldrich | Cat# P4780 |
| Collagenase Type IA | Sigma-Aldrich | Cat# C2674 |
| DNase I | Sigma-Aldrich | Cat# DN25 |
| Hydroxyethyl-cellulose | Sigma-Aldrich | Cat# 54290 |
| Antifoam | Sigma-Aldrich | Cat# A6426 |
| Linear Acrylamide | Thermo Fisher Scientific | Cat# AM9520 |
| Phenol:Chloroform:Isoamyl (pH8.0) | Thermo Fisher Scientific | Cat# 15593031 |
| Critical Commercial Assays | ||
| CD4 T Cell Isolation Kit, mouse | Miltenyi Biotec | Cat# 130-104-454 |
| CD8a T Cell Isolation Kit, mouse | Miltenyi Biotec | Cat# 130-104-075 |
| Mouse CD4 (L3T4) MicroBeads | Miltenyi Biotec | Cat# 130-117-043 |
| Naïve CD4 T Cell Isolation Kit II, human | Miltenyi Biotec | Cat# 130-094-131 |
| T cell Activation/Expansion Kit, human | Miltenyi Biotec | Cat# 130-091-441 |
| EasyStep Mouse CD4 T Cell Isolation Kit | STEMCELL Technologies | Cat# 19852 |
| CellTrace Violet Cell Proliferation Kit | Thermo Fisher Scientific | Cat# C34557 |
| Fixation/Permeabilization Solution Kit | BD Biosciences | Cat# 554714 |
| Foxp3/Transcription Factor Staining Buffer Set | Thermo Fisher Scientific | Cat# 00-5523-00 |
| KAPA Mouse Gentoyping Kits | Roche Diagnostics | Cat# 07961804001 |
| QIAquick Gel Extraction Kit | Qiagen | Cat# 28706 |
| GeneJET Plasmid Maxiprep Kit | Thermo Fisher Scientific | Cat# K0491 |
| Herculase II Fusion DNA Polymerase | Agilent | Cat# 600675 |
| Gibson Assembly Master Mix | NEB | Cat# E2611 |
| Polyplus jetPRIME DNA and siRNA transfection reagent | VWR | Cat# 89129-922 |
| X-tremeGENE HP DNA Transfection Reagent | Sigma-Aldrich | Cat# 6366236001 |
| EAE induction kit | Hooke Labs | Cat# EK-2110 |
| OVA/CFA Emulsion | Hooke Labs | Cat# EK-0301 |
| Mouse anti-KLH IgG ELISA Kit | Alpha Diagnostic | Cat# 700-150-VAG |
| CUT&RUN Assay Kit | Cell Signaling Technology | Cat# 86652 |
| KAPA HyperPrep Kits | Roche | Cat# 07962363001 |
| AMPure XP Beads | Beckman Coulter | Cat# #A63881 |
| Epredia Richard-Allan Scientific Three-Step Stain Kit | Thermo Fisher Scientific | Cat# 22-050-272 |
| Ghost Dye Red 780 Viability Dye | Cell Signaling Technology | Cat# 18452 |
| Fixable Viability Dye eFluor 450 | Thermo Fisher Scientific | Cat# 65-0863-14 |
| LIVE/DEAD Fixable Aqua Dead Cell Stain Kit | Thermo Fisher Scientific | Cat# L34957 |
| M-Digestion Buffer (2X) | Zymo Research | Cat# D5020-9 |
| EZ-96 DNA Methylation-Direct Kit | Zymo Research | Cat# D5022 |
| HotStarTaq Master Mix Kit | Qiagen | Cat# 203443 |
| Ion 520 & Ion 530 ExT Kit-Chef | Thermo Fisher Scientific | Cat# A30670 |
| Bacterial and Virus Strains | ||
| ElectroMAX DH10B Cells | Thermo Fisher Scientific | Cat#: 18290015 |
| Oligonucleotides | ||
| Array primers: Forward – TAACTTGAAAGTATTTCGATTTCTTGGCTTTATATATCTTGTGGAAAGGACGAAACACCG Reverse - ACTTTTTCAAGTTGATAACGGACTAGCCTTATTTTAACTTGCTATTTCTAGCTCTAAAAC |
(Shalem et al., 2014) | n/a |
| Adapter primers: Forward – AATGGACTATCATATGCTTACCGTAACTTGAAAGTATTTCG Reverse - ACGGCATCGCAGCTTGGATACA |
Modified from (Shalem et al., 2014) | n/a |
| Sequencing primers: Forward – AATGATACGGCGACCACCGAGATCTACACTCTTTCCCTACACGACGCTCTTCCGATCTNNNNNNNNNTCTTGTGGAAAGGACGAAACACCG Reverse - CAAGCAGAAGACGGCATACGAGATXXXXXXXXGTGACTGGAGTTCAGACGTGTGCTCTTCCGATCTACGGCATCGCAGCTTGGATACA |
Modified from (Shalem et al., 2014) | n/a |
| 1C metabolism gRNA library | This paper | n/a |
| TruSeq DNA UD Indexes | IDT | Cat# 20020590 |
| MTHFD2 (human) qPCR primers: Forward - GGGAAGAATGTGGTTGTGGC Reverse - ATGACTGCTGCTCCTTCCTT |
This paper | n/a |
| GAPDH (human) qPCR primers: Forward – TGATGACATCAAGAAGGTGGTGAAG Reverse - TCCTTGGAGGCCATGTGGGCCAT |
n/a | |
| Recombinant DNA | ||
| pMx-U6-empty-GFP plasmid | (Toffalini et al., 2009) | n/a |
| MTHFD2-set siRNA/shRNA/RNAi Lentivector (Human) | Applied Biological Materials | Cat# 308880910296 |
| Scrambled siRNA GFP Lentivector Target Sequence - GGGTGAACTCACGTCAGAA | Applied Biological Materials | Cat# LV015-G |
| pCMV-VSV-G | Addgene | Cat# 8454 RRID:Addgene_8454 |
| psPAX2 | Addgene | Cat# 12260 RRID:Addgene_12260 |
| Software and Algorithms | ||
| Prism v9 | GraphPad Software | https://www.graphpad.com; RRID: SCR_002798 |
| FlowJo v10 | FlowJo | https://www.flowjo.com; RRID: SCRJD08520 |
| El-MAVEN v0.8.0 | Elucidata | https://resources.elucidata.io/elmaven#resources |
| Chenomx NMR Suite v8.4 | Chenomx | https://www.chenomx.com |
| MAGeCK v0.5.0.3 | (Li et al., 2014) | |
| Trimmomatic v0.39 | ||
| bowtie2 v2.3.5.1 | ||
| samtools v1.9 | ||
| deeptools v3.3.1 | ||
| MACS2 v 2.2.7.1 | ||
| DiffBind v2.16.2 | ||
| Bismark Bisulfite Read Mapper | ||
HIGHLIGHTS.
MTHFD2 is critical for activated CD4 T cells to maintain de novo purine synthesis.
Insufficient MTHFD2 promotes Treg-like phenotypes and metabolism in Th17 cells.
Inhibition of MTHFD2 suppresses mTORC1 signaling and alters histone methylation.
MTHFD2 can be targeted to protect against inflammation and autoimmunity in vivo.
ACKNOWLEDGEMENTS
We thank members of the Rathmell lab for contributing to this project. We thank Thomas Aune for providing RNAseq data and J. Cools (VIB) for providing the pMx-U6-gRNA-GFP construct. We thank Max R. Van Belkum for designing the MTHFD2 qPCR primers. We thank Nello Mainolfi, Vipin Suri, Adam Friedman, and Mark Manfredi from Raze Therapeutics, Inc. (Boston, MA) for providing Raze 1459 compound, which was used to corroborate findings (data not shown). Diagrams were created with Biorender.com. We acknowledge the Translational Pathology Shared Resource supported by NCI/NIH Cancer Center Support Grant 5P30 CA68485-19 and The Shared Instrumentation Grant S10 OD023475-01A1 for the Leica Bond RX. This work was supported by the William E. Paul Distinguished Innovator Award for the Lupus Research Alliance (J.C.R.), R01s DK105550 (J.C.R.), HL136664 (J.C.R., D.C.N.), CA217987 (J.C.R.), and AI153167 (J.C.R.), AI137075 (A.K.M.), T32 DK101003 (K.V.), and T32 GM007347 (A.S.).
DIVERSITY STATEMENT
We worked to ensure sex balance in the selection of non-human subjects. One or more of the authors of this paper self-identifies as an underrepresented ethnic minority in science. While citing references scientifically relevant for this work, we also actively worked to promote gender balance in our reference list. The author list of this paper includes contributors from the location where the research was conducted who participated in the data collection, design, analysis, and/or interpretation of the work.
AUTHOR DISCLOSURES
J.C.R. is a founder, scientific advisory board member, and stockholder of Sitryx Therapeutics, a scientific advisory board member and stockholder of Caribou Biosciences, a member of the scientific advisory board of Nirogy Therapeutics, has consulted for Merck, Pfizer, and Mitobridge within the past three years, and has received research support from Incyte Corp., Calithera Biosciences, and Tempest Therapeutics. J.D.R. is a co-founder and stockholder in Raze Therapeutics, Toran, Serien Therapeutics, and Farber Partners, and advisor and stockholder in Agios Pharmaceuticals, Kadmon Pharmaceuticals, Bantam Pharmaceuticals, Colorado Research Partners, Rafael Holdings, Barer Institute, and L.E.A.F. Pharmaceuticals, has received consulting fees and research funding from Pfizer and Rafael and is the inventor of patents held by Princeton University. A.M.C., P.F., T.B. are employees of Sitryx Therapeutics.
Footnotes
Publisher's Disclaimer: This is a PDF file of an unedited manuscript that has been accepted for publication. As a service to our customers we are providing this early version of the manuscript. The manuscript will undergo copyediting, typesetting, and review of the resulting proof before it is published in its final form. Please note that during the production process errors may be discovered which could affect the content, and all legal disclaimers that apply to the journal pertain.
REFERENCES
- Anderson GR, Winter PS, Lin KH, Nussbaum DP, Cakir M, Stein EM, Soderquist RS, Crawford L, Leeds JC, Newcomb R, et al. (2017). A Landscape of Therapeutic Cooperativity in KRAS Mutant Cancers Reveals Principles for Controlling Tumor Evolution. Cell Reports 20, 999–1015. [DOI] [PMC free article] [PubMed] [Google Scholar]
- Aune TM, Crooke PS, Patrick AE, Tossberg JT, Olsen NJ, and Spurlock CF (2017). Expression of long non-coding RNAs in autoimmunity and linkage to enhancer function and autoimmune disease risk genetic variants. Journal of Autoimmunity 81, 99–109. [DOI] [PMC free article] [PubMed] [Google Scholar]
- Bantug GR, Galluzzi L, Kroemer G, and Hess C (2018). The spectrum of T cell metabolism in health and disease. Nat Rev Immunol 18, 19–34. [DOI] [PubMed] [Google Scholar]
- Ben-Sahra I, Hoxhaj G, Ricoult SJH, Asara JM, and Manning BD (2016). mTORC1 induces purine synthesis through control of the mitochondrial tetrahydrofolate cycle. Science 351, 728–733. [DOI] [PMC free article] [PubMed] [Google Scholar]
- Brown PM, Pratt AG, and Isaacs JD (2016). Mechanism of action of methotrexate in rheumatoid arthritis, and the search for biomarkers. Nat Rev Rheumatol 12, 731–742. [DOI] [PubMed] [Google Scholar]
- Buck MD, O’Sullivan D, and Pearce EL (2015). T cell metabolism drives immunity. Journal of Experimental Medicine 212, 1345–1360. [DOI] [PMC free article] [PubMed] [Google Scholar]
- Cantor JR, Abu-Remaileh M, Kanarek N, Freinkman E, Gao X, Louissaint A, Lewis CA, and Sabatini DM (2017). Physiologic Medium Rewires Cellular Metabolism and Reveals Uric Acid as an Endogenous Inhibitor of UMP Synthase. Cell 169, 258–272.e17. [DOI] [PMC free article] [PubMed] [Google Scholar]
- Cronstein BN, and Aune TM (2020). Methotrexate and its mechanisms of action in inflammatory arthritis. Nat Rev Rheumatol 16, 145–154. [DOI] [PubMed] [Google Scholar]
- Dembitz V, Tomic B, Kodvanj I, Simon JA, Bedalov A, and Visnjic D (2019). The ribonucleoside AICAr induces differentiation of myeloid leukemia by activating the ATR/Chk1 via pyrimidine depletion. J. Biol. Chem. 294, 15257–15270. [DOI] [PMC free article] [PubMed] [Google Scholar]
- Dendrou CA, Fugger L, and Friese MA (2015). Immunopathology of multiple sclerosis. Nat Rev Immunol 15, 545–558. [DOI] [PubMed] [Google Scholar]
- Ducker GS, and Rabinowitz JD (2017). One-Carbon Metabolism in Health and Disease. Cell Metabolism 25, 27–42. [DOI] [PMC free article] [PubMed] [Google Scholar]
- Ducker GS, Chen L, Morscher RJ, Ghergurovich JM, Esposito M, Teng X, Kang Y, and Rabinowitz JD (2016). Reversal of Cytosolic One-Carbon Flux Compensates for Loss of the Mitochondrial Folate Pathway. Cell Metabolism 23, 1140–1153. [DOI] [PMC free article] [PubMed] [Google Scholar]
- Emmanuel N, Ragunathan S, Shan Q, Wang F, Giannakou A, Huser N, Jin G, Myers J, Abraham RT, and Unsal-Kacmaz K (2017). Purine Nucleotide Availability Regulates mTORC1 Activity through the Rheb GTPase. Cell Reports 19, 2665–2680. [DOI] [PubMed] [Google Scholar]
- Farber S, Diamond LK, Mercer RD, Sylvester RF, and Wolff JA (1948). Temporary Remissions in Acute Leukemia in Children Produced by Folic Acid Antagonist, 4-Aminopteroyl-Glutamic Acid (Aminopterin). N Engl J Med 238, 787–793. [DOI] [PubMed] [Google Scholar]
- Field MS, Kamynina E, Watkins D, Rosenblatt DS, and Stover PJ (2015). New insights into the metabolic and nutritional determinants of severe combined immunodeficiency. Rare Dis 3, e1112479. [DOI] [PMC free article] [PubMed] [Google Scholar]
- Fuseini H, Yung JA, Cephus JY, Zhang J, Goleniewska K, Polosukhin VV, Peebles RS, and Newcomb DC (2018). Testosterone Decreases House Dust Mite-Induced Type 2 and IL-17A-Mediated Airway Inflammation. J Immunol 201, 1843–1854. [DOI] [PMC free article] [PubMed] [Google Scholar]
- Govindaraju V, Young K, and Maudsley AA (2000). Proton NMR chemical shifts and coupling constants for brain metabolites. NMR Biomed 13, 129–153. [DOI] [PubMed] [Google Scholar]
- Green NH, Galvan DL, Badal SS, Chang BH, LeBleu VS, Long J, Jonasch E, and Danesh FR (2019). MTHFD2 links RNA methylation to metabolic reprogramming in renal cell carcinoma. Oncogene 38, 6211–6225. [DOI] [PMC free article] [PubMed] [Google Scholar]
- Gustafsson R, Jemth A-S, Gustafsson NMS, Färnegårdh K, Loseva O, Wiita E, Bonagas N, Dahllund L, Llona-Minguez S, Häggblad M, et al. (2017). Crystal Structure of the Emerging Cancer Target MTHFD2 in Complex with a Substrate-Based Inhibitor. Cancer Research 77, 937–948. [DOI] [PubMed] [Google Scholar]
- Hoxhaj G, Hughes-Hallett J, Timson RC, Ilagan E, Yuan M, Asara JM, Ben-Sahra I, and Manning BD (2017). The mTORC1 Signaling Network Senses Changes in Cellular Purine Nucleotide Levels. Cell Reports 21, 1331–1346. [DOI] [PMC free article] [PubMed] [Google Scholar]
- Johnson MO, Wolf MM, Madden MZ, Andrejeva G, Sugiura A, Contreras DC, Maseda D, Liberti MV, Paz K, Kishton RJ, et al. (2018). Distinct Regulation of Th17 and Th1 Cell Differentiation by Glutaminase-Dependent Metabolism. Cell. [DOI] [PMC free article] [PubMed] [Google Scholar]
- Ju H-Q, Lu Y-X, Chen D-L, Zuo Z-X, Liu Z-X, Wu Q-N, Mo H-Y, Wang Z-X, Wang D-S, Pu H-Y, et al. (2019). Modulation of Redox Homeostasis by Inhibition of MTHFD2 in Colorectal Cancer: Mechanisms and Therapeutic Implications. JNCI: Journal of the National Cancer Institute 111, 584–596. [DOI] [PMC free article] [PubMed] [Google Scholar]
- Kawai J, Toki T, Ota M, Inoue H, Takata Y, Asahi T, Suzuki M, Shimada T, Ono K, Suzuki K, et al. (2019). Discovery of a Potent, Selective, and Orally Available MTHFD2 Inhibitor (DS18561882) with in Vivo Antitumor Activity. J. Med. Chem. 62, 10204–10220. [DOI] [PubMed] [Google Scholar]
- Kim J, Yang G, Kim Y, Kim J, and Ha J (2016). AMPK activators: mechanisms of action and physiological activities. Exp Mol Med 48, e224–e224. [DOI] [PMC free article] [PubMed] [Google Scholar]
- Koufaris C, Gallage S, Yang T, Lau C-H, Valbuena GN, and Keun HC (2016). Suppression of MTHFD2 in MCF-7 Breast Cancer Cells Increases Glycolysis, Dependency on Exogenous Glycine, and Sensitivity to Folate Depletion. J. Proteome Res. 15, 2618–2625. [DOI] [PubMed] [Google Scholar]
- Li W, Xu H, Xiao T, Cong L, Love MI, Zhang F, Irizarry RA, Liu JS, Brown M, and Liu XS (2014). MAGeCK enables robust identification of essential genes from genome-scale CRISPR/Cas9 knockout screens. Genome Biol 15, 554. [DOI] [PMC free article] [PubMed] [Google Scholar]
- Ma EH, Bantug G, Griss T, Condotta S, Johnson RM, Samborska B, Mainolfi N, Suri V, Guak H, Balmer ML, et al. (2017). Serine Is an Essential Metabolite for Effector T Cell Expansion. Cell Metabolism 25, 345–357. [DOI] [PubMed] [Google Scholar]
- Macintyre AN, Gerriets VA, Nichols AG, Michalek RD, Rudolph MC, Deoliveira D, Anderson SM, Abel DE, Chen BJ, Hale LP, et al. (2014). The Glucose Transporter Glut1 Is Selectively Essential for CD4 T Cell Activation and Effector Function. 20. [DOI] [PMC free article] [PubMed] [Google Scholar]
- Michalek RD, Gerriets VA, Jacobs SR, Macintyre AN, MacIver NJ, Mason EF, Sullivan SA, Nichols AG, and Rathmell JC (2011). Cutting edge: distinct glycolytic and lipid oxidative metabolic programs are essential for effector and regulatory CD4+ T cell subsets. J Immunol 186, 3299–3303. [DOI] [PMC free article] [PubMed] [Google Scholar]
- Nakaya M, Xiao Y, Zhou X, Chang J-H, Chang M, Cheng X, Blonska M, Lin X, and Sun S-C (2014). Inflammatory T Cell Responses Rely on Amino Acid Transporter ASCT2 Facilitation of Glutamine Uptake and mTORC1 Kinase Activation. Immunity 40, 692–705. [DOI] [PMC free article] [PubMed] [Google Scholar]
- Nilsson R, Jain M, Madhusudhan N, Sheppard NG, Strittmatter L, Kampf C, Huang J, Asplund A, and Mootha VK (2014). Metabolic enzyme expression highlights a key role for MTHFD2 and the mitochondrial folate pathway in cancer. Nature Communications 5, 3128. [DOI] [PMC free article] [PubMed] [Google Scholar]
- Palmer LD, Maloney KN, Boyd KL, Goleniewska AK, Toki S, Maxwell CN, Chazin WJ, Peebles RS, Newcomb DC, and Skaar EP (2019). The Innate Immune Protein S100A9 Protects from T-Helper Cell Type 2-mediated Allergic Airway Inflammation. Am J Respir Cell Mol Biol 61, 459–468. [DOI] [PMC free article] [PubMed] [Google Scholar]
- Pikman Y, Puissant A, Alexe G, Furman A, Chen LM, Frumm SM, Ross L, Fenouille N, Bassil CF, Lewis CA, et al. (2016). Targeting MTHFD2 in acute myeloid leukemia. Journal of Experimental Medicine 213, 1285–1306. [DOI] [PMC free article] [PubMed] [Google Scholar]
- Quéméneur L, Gerland L-M, Flacher M, Ffrench M, Revillard J-P, and Genestier L (2003). Differential Control of Cell Cycle, Proliferation, and Survival of Primary T Lymphocytes by Purine and Pyrimidine Nucleotides. The Journal of Immunology 170, 4986–4995. [DOI] [PubMed] [Google Scholar]
- Quéméneur L, Beloeil L, Michallet M-C, Angelov G, Tomkowiak M, Revillard J-P, and Marvel J (2004). Restriction of De Novo Nucleotide Biosynthesis Interferes with Clonal Expansion and Differentiation into Effector and Memory CD8 T Cells. J Immunol 173, 4945–4952. [DOI] [PubMed] [Google Scholar]
- Rae C, and Mairs RJ (2019). AMPK activation by AICAR sensitizes prostate cancer cells to radiotherapy. Oncotarget 10, 749–759. [DOI] [PMC free article] [PubMed] [Google Scholar]
- Ron-Harel N, Santos D, Ghergurovich JM, Sage PT, Reddy A, Lovitch SB, Dephoure N, Satterstrom FK, Sheffer M, Spinelli JB, et al. (2016). Mitochondrial Biogenesis and Proteome Remodeling Promote One-Carbon Metabolism for T Cell Activation. Cell Metabolism 24, 104–117. [DOI] [PMC free article] [PubMed] [Google Scholar]
- Shahi SK, Freedman SN, Murra AC, Zarei K, Sompallae R, Gibson-Corley KN, Karandikar NJ, Murray JA, and Mangalam AK (2019). Prevotella histicola, A Human Gut Commensal, Is as Potent as COPAXONE® in an Animal Model of Multiple Sclerosis. Front. Immunol 10, 462. [DOI] [PMC free article] [PubMed] [Google Scholar]
- Shalem O, Sanjana NE, Hartenian E, Shi X, Scott DA, Mikkelsen TS, Heckl D, Ebert BL, Root DE, Doench JG, et al. (2014). Genome-Scale CRISPR-Cas9 Knockout Screening in Human Cells. Science 343, 84–87. [DOI] [PMC free article] [PubMed] [Google Scholar]
- Sharma U, and Rando OJ (2017). Metabolic Inputs into the Epigenome. Cell Metabolism 25, 544–558. [DOI] [PubMed] [Google Scholar]
- Sheppard NG, Jarl L, Mahadessian D, Strittmatter L, Schmidt A, Madhusudan N, Tegnér J, Lundberg EK, Asplund A, Jain M, et al. (2015). The folate-coupled enzyme MTHFD2 is a nuclear protein and promotes cell proliferation. Scientific Reports 5, 15029. [DOI] [PMC free article] [PubMed] [Google Scholar]
- Shi LZ, Wang R, Huang G, Vogel P, Neale G, Green DR, and Chi H (2011). HIF1α–dependent glycolytic pathway orchestrates a metabolic checkpoint for the differentiation of T H17 and T regcells. 208. [DOI] [PMC free article] [PubMed] [Google Scholar]
- Shin M, Momb J, and Appling DR (2017). Human mitochondrial MTHFD2 is a dual redox cofactor-specific methylenetetrahydrofolate dehydrogenase/methenyltetrahydrofolate cyclohydrolase. Cancer & Metabolism 5, 11. [DOI] [PMC free article] [PubMed] [Google Scholar]
- Skene PJ, and Henikoff S (2017). An efficient targeted nuclease strategy for high-resolution mapping of DNA binding sites. ELife 6, e21856. [DOI] [PMC free article] [PubMed] [Google Scholar]
- Su C-C, Hsieh K-L, Liu P-L, Yeh H-C, Huang S-P, Fang S-H, Cheng W-C, Huang K-H, Chiu F-Y, Lin I-L, et al. (2019). AICAR Induces Apoptosis and Inhibits Migration and Invasion in Prostate Cancer Cells Through an AMPK/mTOR-Dependent Pathway. IJMS 20, 1647. [DOI] [PMC free article] [PubMed] [Google Scholar]
- Su X, Wellen KE, and Rabinowitz JD (2016). Metabolic control of methylation and acetylation. Current Opinion in Chemical Biology 30, 52–60. [DOI] [PMC free article] [PubMed] [Google Scholar]
- Tan H, Yang K, Li Y, Shaw TI, Wang Y, Blanco DB, Wang X, Cho J-H, Wang H, Rankin S, et al. (2017). Integrative Proteomics and Phosphoproteomics Profiling Reveals Dynamic Signaling Networks and Bioenergetics Pathways Underlying T Cell Activation. Immunity 46, 488–503. [DOI] [PMC free article] [PubMed] [Google Scholar]
- Wan X, Wang C, Huang Z, Zhou D, Xiang S, Qi Q, Chen X, Arbely E, Liu C-Y, Du P, et al. (2020). Cisplatin inhibits SIRT3-deacetylation MTHFD2 to disturb cellular redox balance in colorectal cancer cell. Cell Death Dis 11, 649. [DOI] [PMC free article] [PubMed] [Google Scholar]
- Wang L, Xing X, Chen L, Yang L, Su X, Rabitz H, Lu W, and Rabinowitz JD (2019). Peak Annotation and Verification Engine for Untargeted LC–MS Metabolomics. Anal. Chem. 91, 1838–1846. [DOI] [PMC free article] [PubMed] [Google Scholar]
- Yang M, and Vousden KH (2016). Serine and one-carbon metabolism in cancer. Nat Rev Cancer 16, 650–662. [DOI] [PubMed] [Google Scholar]
- Yue L, Pei Y, Zhong L, Yang H, Wang Y, Zhang W, Chen N, Zhu Q, Gao J, Zhi M, et al. (2020). Mthfd2 Modulates Mitochondrial Function and DNA Repair to Maintain the Pluripotency of Mouse Stem Cells. Stem Cell Reports 15, 529–545. [DOI] [PMC free article] [PubMed] [Google Scholar]
- Zhu Z, and Leung GKK (2020). More Than a Metabolic Enzyme: MTHFD2 as a Novel Target for Anticancer Therapy? Frontiers in Oncology 10, 658. [DOI] [PMC free article] [PubMed] [Google Scholar]
Associated Data
This section collects any data citations, data availability statements, or supplementary materials included in this article.
Supplementary Materials
Data Availability Statement
CUT&RUN sequencing data have been deposited at GEO and are publicly available as of the date of publication (GSE180356). Microscopy data and original western blot images reported in this paper will be shared by the lead contact upon request. Any additional information required to reanalyze the data reported in this paper is available from the lead contact upon request.