

ABSTRACT
Aims/Introduction
Several cross‐sectional studies have shown that delayed heart rate recovery (HRR) after exercise is associated with the development of metabolic syndrome (MetS). However, there has been a lack of comprehensively designed longitudinal studies. Therefore, our aim was to evaluate the longitudinal association of delayed HRR following a graded exercise treadmill test (GTX) with incident MetS.
Materials and Methods
This was a retrospective longitudinal cohort study of participants without MetS, diabetes, or cardiovascular diseases. The HRR was calculated as the peak heart rate minus the resting heart rate after a 1 min rest (HRR1), a 2 min rest (HRR2), and a 3 min rest (HRR3). Multivariate Cox proportional hazards analysis was performed to investigate the association between HRR and development of MetS.
Results
There were 676 (31.2%) incident cases of MetS identified during the follow‐up period (9,683 person‐years). The only statistically significant relationship was between HRR3 and the development of MetS. The hazard ratios (HRs) (95% confidence interval [CI]) of incident MetS comparing the first and second tertiles to the third tertile of HRR3 were 1.492 (1.146–1.943) and 1.277 (1.004–1.624) with P = 0.003 after adjustment for multiple risk factors. As a continuous variable, the HR (95% CI) of incident MetS associated with each one‐beat decrease in HRR3 was 1.015 (1.005–1.026) with P = 0.004 after full adjustments. An HRR3 value ≤45 beats per minute (bpm) was associated with a higher risk of incident MetS compared with values >45 bpm, with an HR (95% CI) of 1.304 (1.061–1.602) and P = 0.001.
Conclusions
The slow phase of HRR, particularly HRR3, might be more sensitive at predicting the risk of MetS.
Keywords: Heart rate recovery, Incident metabolic syndrome, Longitudinal cohort study
Delayed HRR3 after exercise could predict incident MetS in a general population, even after adjusting for fasting plasma glucose, HOMA‐IR, and HbA1c. And a HRR3 value of 45 beats per minute (bpm) or below was associated with a significantly higher risk of incident MetS compared with values over 45 bpm.
INTRODUCTION
Metabolic syndrome (MetS) includes conditions characterized by central obesity, elevated blood pressure (BP), dyslipidemia, and an elevated fasting plasma glucose (FPG) level 1 MetS is closely related with an increased risk of type 2 diabetes mellitus and cardiovascular disease (CVD) 2 Since the prevalence of MetS is increasing rapidly, it has become an emerging public health issue worldwide.
Delayed heart rate recovery (HRR) after exercise has clinical significance because it is associated with cardiovascular events and all‐cause mortality 3 , 4 The HRR has been calculated as the difference between the peak heart rate during exercise and the heart rate at a specific time interval following the onset of recovery 5 In practice, this value is calculated as the peak heart rate minus resting heart rate after a 1 min rest (HRR1), a 2 min rest (HRR2), and a 3 min rest (HRR3). MetS is associated with dysfunction of the autonomic nervous system (ANS), including impaired parasympathetic reactivation and sympathetic overactivation 6 The ANS plays a critical role in HRR 5 Thus, there could be a link between MetS and delayed HRR after exercise via autonomic dysfunction.
A meta‐analysis including our study showed an increased risk for type 2 diabetes mellitus in patients with delayed HRR 7 We previously reported an association between delayed HRR1 and incident type 2 diabetes mellitus 8 Delayed HRR1 might reflect parasympathetic dysfunction, which could potentially be associated with insulin secretory dysfunction and glucose intolerance. Therefore, autonomic dysfunction might be a cause or a risk factor for type 2 diabetes mellitus, although it is a complication of diabetes mellitus as well. Likewise, dysfunction of the ANS might precede MetS and eventually lead to MetS.
Previous studies have reported that delayed HRR after exercise is associated with MetS in a cross‐sectional setting 9 , 10 , 11 , 12 but there has been a lack of comprehensively designed longitudinal studies. Thus, the causal relationship between delayed HRR and the development of MetS remains unclear. In addition, some medications influence these values; for example, beta‐blockers can affect maximum heart rate and lower HRR after exercise 13 by reducing sympathetic activity. Nevertheless, few studies of HRR have excluded participants currently taking beta‐blockers or have considered beta‐blockers as a confounding factor. Excluding participants who have taken this class of medication will be required to make the results more reliable.
We explored how the longitudinal effects of HRR after exercise could influence the development of MetS after adjusting for metabolic parameters and excluding beta‐blocker effects in a general population for the first time. In addition, we measured all three HRR values of HRR1, HRR2, and HRR3.
MATERIALS AND METHODS
Study population and design
We designed a longitudinal, retrospective cohort study to investigate the association between HRR after exercise and incident MetS. We used the medical information collected from an annual check‐up program at the Health Promotion Center of Samsung Medical Center, Sungkyunkwan University School of Medicine, Seoul, Republic of Korea. The study methods have previously been described in detail 14
Figure 1 shows the process of participant selection. From January 2006 to December 2012, a total of 24,185 participants attended four or more health check‐ups. Among these, we included participants aged ≥20 who had HRR values after a graded exercise treadmill test (GTX) (n = 2,975). We excluded participants with baseline MetS (n = 467), type 2 diabetes mellitus (n = 281), or CVD (myocardial infarction, stroke, or bypass surgery; n = 100); those taking beta‐blockers (n = 86); those with a low estimated glomerular filtration rate (<60 mL/min/1.73 m2, n = 28); and those with an abnormal electrocardiogram (left bundle branch block, atrial fibrillation, or Wolff‐Parkinson‐White syndrome; n = 13). Because the mean BP of the participants was not high enough to affect the primary outcome, we did not exclude those with hypertension. After all exclusions, 2,167 participants (1,820 men and 347 women) were selected for this study. The observation period was defined as the elapsed time until the participant was first diagnosed with MetS; if there was no diagnosis of MetS, the observation period was defined as the time until the last follow‐up visit. The Institutional Review Board (IRB) of Samsung Medical Center approved this study (IRB No. SMC 2015‐01‐003‐001).
Figure 1.
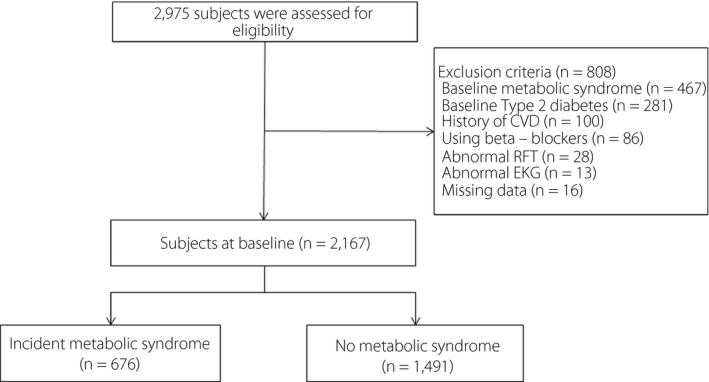
Selection of study participants. CVD, cardiovascular disease; RFT, renal function test.
Clinical and biochemical measurements
The clinical measurements have been described in detail 8 Height, weight, waist circumference (WC), systolic BP, and diastolic BP were obtained at every visit. The biochemical measurements have been described in detail 8 Venous blood samples were obtained after an overnight fast at each visit, and the samples were analyzed at the certified clinical laboratory at Samsung Medical Center.
Definition of MetS
The Joint Interim Statement of the International Diabetes Federation Task Force on Epidemiology and Prevention was used for the definition of MetS 15 The cutoff values for central obesity were a WC ≥ 90 cm for men and ≥85 cm for women, which was based on the recommendation of the Korean Society for the Study of Obesity 16 Participants who had three or more of the following criteria were considered to have MetS:
Central obesity: A WC ≥ 90 cm in men or ≥ 85 cm in women.
Elevated BP: A systolic BP ≥ 130 mmHg, a diastolic BP ≥ 85 mmHg, or current treatment for hypertension.
Elevated triglycerides (TG): TG ≥ 150 mg/dL or current treatment for elevated TG.
Reduced high‐density lipoprotein cholesterol (HDL‐C): An HDL‐C < 40 mg/dL in men or <50 mg/dL in women or current treatment for low HDL‐C.
Elevated FPG: An FPG (≥100 mg/dL) or current treatment for type 2 diabetes mellitus.
Cardiopulmonary function testing
The methods of cardiopulmonary function testing have been described in detail elsewhere 8 According to the Bruce protocol or the modified Bruce protocol, participants performed a standard symptom‐limited GTX using a treadmill system (Quinton Q‐Stress TM65, Bothell, WA, USA). The resting heart rate was obtained after at least 5 min of rest in the supine position. The exercise was terminated for any of the following reasons: heart rate >90% of the estimated maximum heart rate (220 – age), respiratory exchange ratio >1.15, or rating of perceived exertion >17. If the participant demanded test termination due to exhaustion, the exercise was considered complete. The participants continued to walk for 30 s at a speed of 1.2 mph and subsequently rested for 5 min with close monitoring (recovery phase). The HRR was calculated as the difference between the peak heart rate and the resting heart rate after a 1 min rest (HRR1), a 2 min rest (HRR2), and a 3 min rest (HRR3).
Statistical analyses
Normally distributed continuous variables were reported as the mean ± standard deviation. Continuous variables without normal distributions were reported as medians and interquartile ranges. Categorical variables were expressed as frequencies (percentages).
For comparisons of the baseline characteristics of study participants, either Student’s t‐test or the Mann–Whitney U test was used. To compare categorical variables between groups, the Chi‐square test was performed. For comparisons of participant characteristics according to tertile of HRR after exercise, one‐way analysis of variance or the Kruskal–Wallis test for continuous variables was used. The HRR after exercise was analyzed using tertile groups and continuous variables.
The endpoint of this study was the development of MetS. A multivariate Cox proportional hazards analysis was used to yield the hazard ratio (HR) and 95% confidence interval (CI) for evaluating the association between HRR after exercise and incident MetS. A collinearity test for the variables used in the multivariate Cox proportional hazards analysis was performed using linear modeling of the outcome variables along with calculation of the variance inflation factor (VIF) of the independent predictors. A VIF < 5 was considered optimal to warrant stability. We used intervals between the baseline visit and the last available visit or the visit of the initial MetS diagnosis.
We verified the proportional hazards assumption using statistical tests and graphical diagnostics based on the scaled Schoenfeld residuals. In addition, we confirmed that the proportional hazards assumption was satisfied for exposure variables in this study.
Model 1 was the crude model. Model 2 was adjusted for age, sex, smoking status, baseline heart rate, peak heart rate, peak oxygen uptake, and high‐sensitivity C‐reactive protein (hs‐CRP). Additionally, to investigate potential mediation by metabolic confounders, Model 3 was further adjusted for WC, systolic BP, TG, low‐density lipoprotein (LDL) cholesterol, HDL‐C, FPG, the Homeostatic Model Assessment for Insulin Resistance (HOMA‐IR), and hemoglobin (Hb)A1c.
To evaluate the potential linear association between the continuous HRR3 variable and the development of MetS, we used penalized cubic splines in Cox proportional hazards models, which can yield nonparametric estimates for the HR of HRR3. This model was adjusted for confounders as well (as in Model 3). A cutoff for HRR3 values was selected to classify participants into high‐ and low‐risk groups by exploring the HR plot. For each value of HRR3, the HR was compared with the average of the HRR3 (57.67) and displayed in the HR plot.
In addition, we performed subgroup analyses defined by sex, age (≤50 years vs >50 years), body mass index (BMI; ≤25 kg/m2 vs >25 kg/m2), or HOMA‐IR (≤2.5 vs >2.5). All P values were two‐sided, and the level of significance was set at 0.05. We used the Statistical Package for the Social Sciences (version 21.0) for statistical analyses. The penalized cubic spline model was carried out using the coxph and pspline functions in R (version 3.4.3).
RESULTS
Clinical characteristics and parameters of cardiopulmonary function
The clinical characteristics and parameters of cardiopulmonary function regarding the development of MetS are shown in Table 1. The HRR3 was lower in participants who developed MetS (56.1 ± 11.4 beats per minute [bpm]) compared with those who did not (58.3 ± 11.3 bpm, P < 0.001). Participants who subsequently developed MetS had a higher baseline BMI, WC, systolic BP, diastolic BP, hs‐CRP, total cholesterol, TG, LDL‐C, FPG, fasting plasma insulin, HOMA‐IR, HbA1c, and resting heart rate values but lower HDL‐C, peak oxygen uptake, and exercise capacity (expressed in metabolic equivalents [METs]) than those who did not develop MetS.
Table 1.
Baseline clinical and biochemical characteristics of study participants with respect to development of metabolic syndrome
| Variable | Incident metabolic syndrome [no. (%)] | P‐value | |||
|---|---|---|---|---|---|
|
No 1,491 (68.8) |
Yes 676 (31.2) |
Total | |||
| Age (years) | 52.2 ± 6.4 | 52.1 ± 6.3 | 52.2 ± 6.4 | 0.676 | |
| Men [no. (%)] | 1,239 (83.1) | 581 (85.9) | 1,820 (84.0) | 0.013 | |
| BMI (kg/m2) | 23.4 ± 2.2 | 25.3 ± 2.2 | 24.0 ± 2.3 | <0.001 | |
| Waist circumference (cm) | 82.7 ± 6.9 | 88.0 ± 6.6 | 84.2 ± 7.2 | <0.001 | |
| Systolic blood pressure (mmHg) | 110.3 ± 14.3 | 114.6 ± 13.8 | 111.6 ± 14.3 | <0.001 | |
| Diastolic blood pressure (mmHg) | 68.8 ± 10.1 | 71.8 ± 9.3 | 69.7 ± 9.9 | <0.001 | |
| Smoking status | |||||
| Current smoker [no. (%)] | 296 (19.6) | 174 (26.0) | 470 (21.5) | 0.002 | |
| Ex‐smoker [no. (%)] | 619 (40.6) | 268 (40.0) | 883 (40.4) | ||
| Non‐smoker [no. (%)] | 602 (39.8) | 228 (34.0) | 830 (38.0) | ||
| eGFR (mL/min/1.73 m2) | 87.4 ± 11.0 | 86.9 ± 11.2 | 87.2 ± 11.1 | 0.339 | |
| hs‐CRP (mg/L) | 0.1 (0.0−0.1) | 0.1 (0.0−0.1) | 0.1 (0.0−0.1) | <0.001 | |
| Total cholesterol (mg/dL) | 190.0 ± 30.4 | 193.9 ± 31.8 | 191.2 ± 30.9 | 0.006 | |
| Triglyceride (mg/dL) | 189 (169−209) | 194 (173−216) | 191 (170−212) | <0.001 | |
| LDL cholesterol (mg/dL) | 123.6 ± 27.3 | 129.6 ± 28.1 | 125.4 ± 27.7 | <0.001 | |
| HDL‐cholesterol (mg/dL) | 59.0 ± 13.1 | 50.8 ± 10.7 | 56.5 ± 13.0 | <0.001 | |
| Fasting plasma glucose (mg/dL) | 87.3 ± 8.6 | 91.3 ± 9.6 | 88.5 ± 9.1 | <0.001 | |
| Fasting plasma insulin (μU/mL) | 7.8 (6.0−10.0) | 9.1 (7.1−11.7) | 8.1 (6.3−10.4) | <0.001 | |
| HOMA‐IR | 1.7 (1.3−2.1) | 2.0 (1.6−2.7) | 1.8 (1.4−2.3) | <0.001 | |
| HOMA‐β (%) | 120.0 (86.1−162.9) | 121.9 (87.4−164.2) | 120.5 (86.4−163.5) | 0.177 | |
| HbA1c (%) | 5.28 ± 0.35 | 5.43 ± 0.37 | 5.33 ± 0.36 | <0.001 | |
| Resting heart rate (beats/min) | 62.2 ± 8.4 | 63.3 ± 8.5 | 62.6 ± 8.4 | 0.004 | |
| Peak heart rate (beats/min) | 152.9 ± 12.2 | 151.9 ± 12.4 | 152.6 ± 12.3 | 0.070 | |
| Peak oxygen uptake (mL/kg/min) | 32.8 ± 5.2 | 32.3 ± 5.4 | 32.7 ± 5.2 | 0.022 | |
| Exercise capacity (METs) | 9.3 ± 1.5 | 9.2 ± 1.4 | 9.3 ± 1.5 | 0.008 | |
| HRR1 (beats) | 23.8 ± 8.2 | 22.5 ± 7.7 | 23.4 ± 8.1 | 0.001 | |
| HRR2 (beats) | 47.4 ± 10.9 | 45.0 ± 10.4 | 46.7 ± 10.8 | <0.001 | |
| HRR3 (beats) | 58.3 ± 11.3 | 56.1 ± 11.4 | 57.6 ± 11.4 | <0.001 | |
Continuous variables with normal distributions are expressed as mean ± standard deviation, whereas continuous variables with non‐normal distributions are expressed as median (interquartile range). Categorical variables are expressed as percent (%). BMI, body mass index; eGFR, estimated glomerular filtration rate; HOMA‐IR, homeostasis model assessment of insulin resistance; HOMA‐β, homeostasis model assessment of beta‐cell; HRR1, peak heart rate minus heart rate after a 1 min rest; HRR2, peak heart rate minus heart rate after a 2‐min rest; HRR3, peak heart rate minus heart rate after a 3 min rest; hs‐CRP, high‐sensitivity C‐reactive protein; METs, metabolic equivalents.
Table 2 shows the clinical characteristics and parameters of cardiopulmonary function according to the HRR3 tertile. There were negative relationships between the HRR3 tertile and age, WC, systolic BP, diastolic BP, hs‐CRP, TG, fasting plasma insulin, HOMA‐IR, HbA1c, and resting heart rate. However, positive relationships were noted between HRR3 tertile and HDL‐C level, peak heart rate, and exercise capacity (METs). In addition, a decreased incidence of MetS was observed across the HRR3 tertiles (P < 0.001). The clinical characteristics and parameters of cardiopulmonary function according to the HRR1 tertile are shown in Table S4.
Table 2.
Baseline clinical and biochemical characteristics of study participants based on tertiles of heart rate recovery after a 3 min rest
| Tertiles of HRR3 (beats) | ||||
|---|---|---|---|---|
|
Tertile 1 (≤52) |
Tertile 2 (53–62) |
Tertile 3 (≥63) |
P‐value | |
| n = 705 | n = 736 | n = 726 | ||
| Age (years) | 54.4 ± 6.8 | 51.8 ± 6.0 | 50.3 ± 5.5 | <0.001 |
| Men [no. (%)] | 623 (88.4) | 645 (87.6) | 552 (76.0) | <0.001 |
| BMI (kg/m2) | 24.0 ± 2.4 | 24.0 ± 2.2 | 23.9 ± 2.4 | 0.155 |
| Waist circumference (cm) | 85.3 ± 7.0 | 84.6 ± 6.6 | 83.0 ± 7.8 | <0.001 |
| Systolic blood pressure (mmHg) | 112.4 ± 14.3 | 112.1 ± 14.2 | 110.6 ± 14.4 | 0.014 |
| Diastolic blood pressure (mmHg) | 70.7 ± 9.8 | 69.8 ± 9.9 | 68.7 ± 10.0 | <0.001 |
| Smoking status | ||||
| Current smoker [no. (%)] | 165 (23.4) | 174 (23.6) | 128 (17.6) | 0.009 |
| Ex‐smoker [no. (%)] | 285 (40.4) | 298 (40.5) | 290 (39.9) | |
| Non‐smoker [no. (%)] | 255 (36.2) | 264 (35.9) | 308 (42.4) | |
| eGFR (mL/min/1.73 m2) | 86.4 ± 11.1 | 87.3 ± 11.1 | 87.8 ± 10.9 | 0.016 |
| hs‐CRP (mg/L) | 0.1 (0.0−0.1) | 0.1 (0.0−0.1) | 0.1 (0.0‐0.1) | 0.004 |
| Total cholesterol (mg/dL) | 192.4 ± 31.1 | 191.1 ± 30.9 | 190.1 ± 30.8 | 0.167 |
| Triglyceride (mg/dL) | 114.0 (84.0‐152.5) | 111.0 (83.5‐149.0) | 104.0 (78.0–139.0) | <0.001 |
| LDL cholesterol (mg/dL) | 126.7 ± 27.6 | 125.0 ± 27.6 | 124.6 ± 27.8 | 0.140 |
| HDL cholesterol (mg/dL) | 55.4 ± 12.9 | 56.5 ± 13.1 | 57.6 ± 12.8 | 0.001 |
| Fasting plasma glucose (mg/dL) | 88.8 ± 9.2 | 88.6 ± 9.0 | 88.1 ± 9.1 | 0.149 |
| Fasting plasma insulin (μU/mL) | 8.6 (6.6–11.1) | 8.3 (6.3–10.4) | 7.6 (6.1−9.8) | <0.001 |
| HOMA‐IR | 1.9 (1.4–2.5) | 1.8 (1.4–2.3) | 1.7 (1.3−2.1) | <0.001 |
| HOMA‐β (%) | 122.8 (89.1–173.0) | 124.7 (91.2–161.4) | 113.7 (82.2–156.0) | 0.012 |
| HbA1c (%) | 5.36 ± 0.37 | 5.31 ± 0.35 | 5.31 ± 0.36 | 0.012 |
| Resting heart rate (beats/min) | 66.0 ± 9.1 | 62.8 ± 7.5 | 59.0 ± 7.1 | <0.001 |
| Peak heart rate (beats/min) | 146.5 ± 13.9 | 154.4 ± 9.7 | 156.9 ± 9.1 | <0.001 |
| Peak oxygen uptake (mL/kg/min) | 31.3 ± 5.5 | 33.2 ± 5.0 | 33.5 ± 4.9 | <0.001 |
| Exercise capacity (METs) | 8.9 ± 1.4 | 9.4 ± 1.4 | 9.6 ± 1.4 | <0.001 |
| HRR3 (beats) | 45.2 ± 6.2 | 57.5 ± 2.8 | 70.0 ± 6.4 | <0.001 |
| Incident metabolic syndrome [no. (%)] | 258 (36.6) | 225 (30.6) | 193 (26.6) | <0.001 |
Continuous variables with normal distributions are expressed as mean ± standard deviation, whereas continuous variables with non‐normal distributions are expressed as median (interquartile range). Categorical variables are expressed as percent (%). BMI, body mass index; eGFR, estimated glomerular filtration rate; HOMA‐IR, homeostasis model assessment of insulin resistance; HOMA‐β, homeostasis model assessment of beta‐cell; HRR3, peak heart rate minus heart rate after a 3 min rest; hs‐CRP, high‐sensitivity C‐reactive protein; METs, metabolic equivalents.
Correlations between HRR3 and other parameters
The correlations between the HRR3 and multiple variables are shown in Table S1 and Table 3. In Pearson’s correlation analysis, HRR3 was positively correlated with HDL‐C, peak heart rate, and peak oxygen uptake, but negatively correlated with age, WC, systolic BP, diastolic BP, hs‐CRP, TG, FPG, fasting plasma insulin, HOMA‐IR, HbA1c, and resting heart rate (Table S1). Upon multiple regression analysis, HRR3 was positively correlated with peak heart rate and peak oxygen uptake and negatively correlated with age, WC, hs‐CRP, TG, and HOMA‐IR, which are well‐known parameters associated with insulin resistance and sympathetic overactivity 17 , 18 , 19 , 20 (Table 3). The correlations between HRR1 and multiple variables are shown in Tables S5 and S6.
Table 3.
Correlations between heart rate recovery after a 3 min rest and anthropometric and biochemical parameters (multivariate model)
| Variable | Heart rate recovery after a 3 min rest (beats) | ||
|---|---|---|---|
| β | 95% CI | P‐value | |
| Age (years) | −0.16 ± 0.05 | −0.26 to −0.06 | 0.002 |
| Waist circumference (cm) | −0.08 ± 0.04 | −0.16 to −0.001 | 0.046 |
| Systolic blood pressure (mmHg) | 0.02 ± 0.02 | −0.06 to 0.02 | 0.315 |
| hs‐CRP (mg/L) | −2.01 ± 0.87 | −3.71 to −0.31 | 0.021 |
| Triglyceride (mg/dL) | −0.01 ± 0.004 | −0.02 to −0.01 | 0.003 |
| HDL cholesterol (mg/dL) | 0.01 ± 0.02 | −0.03 to 0.05 | 0.697 |
| Fasting plasma glucose (mg/dL) | −0.01 ± 0.03 | −0.08 to 0.05 | 0.723 |
| HOMA‐IR | −0.90 ± 0.34 | −1.58 to −0.24 | 0.008 |
| HbA1c (%) | 0.64 ± 0.79 | −0.90 to 2.18 | 0.417 |
| Peak heart rate (beats/min) | 0.32 ± 0.03 | 0.27 to 0.37 | <0.001 |
| Peak oxygen uptake (mL/kg/min) | 0.16 ± 0.06 | 0.05 to 0.27 | 0.004 |
CI, confidence interval; hs‐CRP, high‐sensitivity C‐reactive protein; HOMA‐IR, homeostasis model assessment of insulin resistance.
Association between HRR3 and development of MetS
There were 676 (31.2%) incident cases of MetS during 9,683 person‐years of follow‐up. The HRs and 95% CIs for incident MetS according to tertile of HRR3 and to HRR3 as a continuous variable are shown in Table 4.
Table 4.
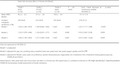
Hazard ratios and 95% confidence intervals of development of metabolic syndrome according to tertiles of heart rate recovery after 3 min rest and each 1 beat decrease in heart rate recovery after 3 min rest as a continuous variable
| Heart rate recovery after a 3 min rest (beats) | ||||||
|---|---|---|---|---|---|---|
|
Tertile 1 (≤52) |
Tertile 2 (53–62) |
Tertile 3 (≥63) |
P for trend |
Each 1 beat decrease as continuous variable HR (95% CI) |
P‐value | |
| n = 705 | n = 736 | n = 726 | ||||
| Mean HRR3 (beats) | 45.2 ± 6.2 | 57.5 ± 2.8 | 70.0 ± 6.4 | 57.7 ± 11.4 | ||
| Incident metabolic syndrome, n (%) | 258 (36.6) | 225 (30.6) | 193 (26.6) | 676 (31.2) | ||
| Model 1 | 1.502 (1.246–1.810) | 1.190 (0.982–1.442) | 1 (ref.) | <0.001 | 1.227 (1.117–1.348) | <0.001 |
| Model 2 | 1.332 (1.078–1.646) | 1.126 (0.925–1.371) | 1 (ref.) | 0.008 | 1.010 (1.003–1.018) | 0.009 |
| Model 3 | 1.492 (1.146–1.943) | 1.277 (1.004–1.624) | 1 (ref.) | 0.003 | 1.015 (1.005–1.026) | 0.004 |
Data are expressed as HR (95% CI). Model 1: unadjusted. Model 2: adjusted for age, sex, smoking status, baseline heart rate, peak heart rate, peak oxygen uptake, and hs‐CRP. Model 3: adjusted for Model 2 plus waist circumference, systolic blood pressure, triglyceride, LDL cholesterol, HDL cholesterol, fasting plasma glucose, HOMA‐IR and HbA1c. CI, confidence interval; HOMA‐IR, homeostasis model assessment of insulin resistance; hs‐CRP, high‐sensitivity C‐reactive protein; HRR3, peak heart rate minus heart rate after a 3 min rest, HR, hazard ratio.
In Model 1, the HRs (95% CI) of incident MetS comparing the first and second tertiles with the third tertile of HRR3 were 1.502 (1.246–1.810) and 1.190 (0.982–1.442), respectively (P < 0.001). These associations maintained statistical significance after adjustment for multiple confounders in Model 2. In Model 3, the HRs (95% CI) of incident MetS comparing the first and second tertiles with the third tertile of HRR3 were 1.492 (1.146–1.943) and 1.277 (1.004–1.624), respectively (P = 0.003) after adjusting for age, sex, smoking status, baseline heart rate, peak heart rate, peak oxygen uptake, hs‐CRP, WC, systolic BP, TG, LDL‐C, HDL‐C, FPG, HOMA‐IR, and HbA1c. In the lower tertiles of HRR3, a significantly increased risk of incident MetS was observed.
HRR3 was negatively associated with the risk of incident MetS as a continuous variable as well. In Model 1, the HR (95% CI) of incident MetS associated with a one‐beat decrease in HRR3 was 1.227 (1.117–1.348) (P < 0.001). This association was significant after adjustment for all confounders in Model 3, with an HR (95% CI) of 1.015 (1.005–1.026) and P = 0.004. However, there were no statistically significant relationships of HRR1 and HRR2 with the development of MetS (Table 5).
Table 5.
Hazard ratios and 95% confidence intervals of development of metabolic syndrome according to each 1 beat decrease in heart rate recovery after 1, 2, and 3 min rest as a continuous variable
|
Each 1 beat decrease as continuous variable HR (95% CI) |
P‐value | |
|---|---|---|
| HRR1 | 1.007 (0.995–1.019) | 0.242 |
| HRR2 | 1.010 (1.000‐1.019) | 0.073 |
| HRR3 | 1.015 (1.005–1.026) | 0.004 |
Data are expressed as HR (95% CI). These models were adjusted for age, sex, smoking status, baseline heart rate, peak heart rate, peak oxygen uptake, hs‐CRP, waist circumference, systolic blood pressure, triglyceride, LDL cholesterol, HDL cholesterol, fasting plasma glucose, HOMA‐IR and HbA1c. CI, confidence interval; HOMA‐IR, homeostasis model of insulin resistance; HR, hazard ratio; HRR1, peak heart rate minus heart rate after a 1 min rest; HRR2, peak heart rate minus heart rate after a 2 min rest; HRR3, peak heart rate minus heart rate after a 3 min rest; hs‐CRP, high‐sensitivity C‐reactive protein.
The association between HRR3 and the development of MetS was inverse and linear between HRR3 values from 40–70 bpm (Figure 2), and an HRR3 value ≤45 bpm was associated with a significantly higher risk of incident MetS compared with values >45 bpm, with an HR (95% CI) of 1.304 (1.061–1.602) and P = 0.001. The baseline clinical characteristics and parameters of cardiopulmonary function based on HRR3 of 45 bpm are shown in Table S2.
Figure 2.
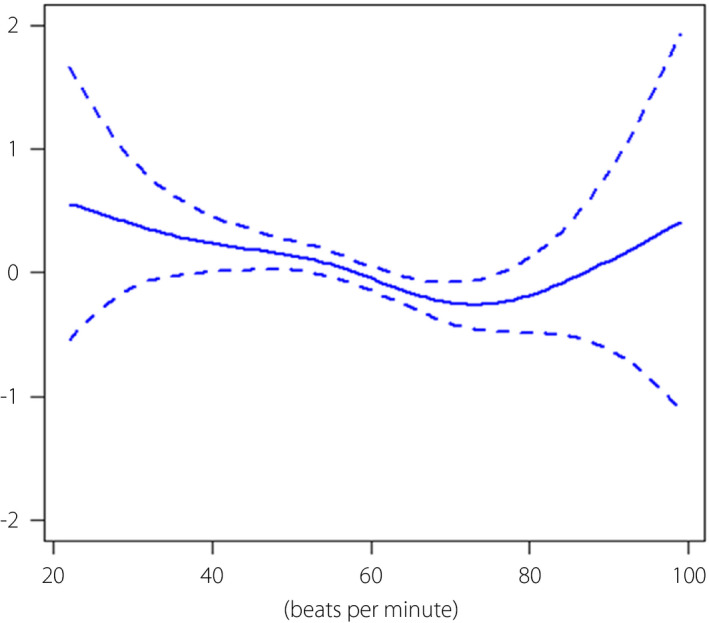
Log hazard ratios (95% CI) for development of metabolic syndrome by HRR3. This model was adjusted for age, sex, smoking status, baseline heart rate, peak heart rate, peak oxygen uptake, hs‐CRP, WC, systolic BP, TG, LDL‐C, HDL‐C, FPG, HOMA‐IR, and HbA1c. BP, blood pressure; FPG, fasting plasma glucose; HDL‐C, HDL cholesterol; HOMA‐IR, homeostatic model assessment of insulin resistance; HRR3, peak heart rate minus heart rate after a 3 min rest; hs‐CRP, high‐sensitivity C‐reactive protein; LDL‐C, LDL cholesterol; MetS, metabolic syndrome; TG, triglycerides; WC, waist circumference.
The participants with an HRR3 value <53 showed a significantly higher risk than those with an average HRR3 (HR > 1, P < 0.05). To ensure clinical significance, we selected an HRR3 value of 45 as a cutoff since the HRs for HRR3 values <45 were >1.2.
Using 10,000 bootstrap datasets, we conducted internal validation for the selected HRR3 cutoff value of 45 bpm. The HR of the selected cutoff against the average value of HRR3 was 1.216 with a 95% bootstrap CI (1.030–1.436). Compared with the low‐risk group, the high‐risk group with HRR3 >45 bpm showed an HR of 1.310 with a 95% bootstrap CI (1.066–1.609). A significant association between the risk group and the development of MetS was observed for all bootstrap datasets.
Upon stratified analyses, the positive association between delayed HRR3 and incident MetS was consistent across all subgroups except that of women. There was no interaction in subgroups of sex, age, or HOMA‐IR but was for that of BMI (P for interaction <0.001; Table S3).
DISCUSSION
The important findings of this study were that delayed HRR following a GTX was an independent predictor of MetS development, and that HRR3 was a potent predictor of incident MetS. Furthermore, we suggested a cutoff point of HRR3 for incident MetS; an HRR3 value ≤45 bpm corresponds to a 1.304‐fold higher risk of incident MetS compared with HRR3 values >45 bpm.
Previous cross‐sectional studies have reported a relationship between a delayed HRR after exercise and the presence of MetS 9 , 10 , 11 , 12 To the best of our knowledge, only one temporal study has investigated the causal relationships between HRR and the development of MetS. They reported delayed HRR after the development of MetS but not before 21 . However, since they only included young participants (mean age: 25 years), only a few met the three MetS criteria, so only the effects of two MetS components on HRR could be evaluated. In addition, certain findings of the study were limited to HRR2. Hence, these factors might have affected the different main outcomes compared with those of our study.
In contrast, we designed a longitudinal cohort study in a large general population to identify causal relationships between HRR and incident MetS and assessed their HRR1, HRR2, and HRR3 values. We also excluded all participants who were currently taking beta‐blockers, which might have affected their HRR. In addition, we adjusted for as many metabolic parameters as possible.
We previously demonstrated that HRR1 is a potent predictor of the development of type 2 diabetes mellitus in men, but these results had no statistically significant associations with HRR2 and HRR3 8 Interestingly, the meaningful time points for HRR after exercise to predict the development of type 2 diabetes mellitus and MetS were different. In the present study, HRR3 was the most potent predictor of incident MetS.
Certain underlying mechanisms might be responsible for the difference in HRR values after exercise to predict the development of type 2 diabetes mellitus or MetS. The natural course of HRR after exercise has been established, and the heart rate recovery phase can be divided into fast and slow phases 22 , 23 The fast phase is approximately the first minute of recovery and shows a rapid heart rate decrease caused largely by parasympathetic reactivation. Then, the slow phase occurs after approximately the first minute after exercise ceases and demonstrates a more gradual heart rate decrease resulting from sympathetic withdrawal. It might be that early dysfunction of the parasympathetic system plays a role in triggering the development of type 2 diabetes mellitus, whereas delayed recovery from sympathetic system hyperactivity could contribute to the development of MetS.
Sympathetic hyperactivity is related to hyperinsulinemia and/or insulin resistance 19 , 24 In addition, sympathetic abnormality has been described for each component of MetS, including hypertension 25 WC 26 impaired fasting glucose 27 and elevated TG 28 For this reason, delayed slow phase of HRR (particularly HRR3) might precede incident MetS and could represent a risk factor for the development of MetS.
Insulin resistance is a key mechanism in the development of MetS and can play a critical role in the delay of HRR after exercise via hyperinsulinemia and sympathetic hyperactivity. Moreover, insulin resistance has been correlated with autonomic neuropathy in previous studies 29 , 30 We also observed that factors that indicate insulin resistance (age, WC, hs‐CRP, TG, and HOMA‐IR) were negatively correlated with HRR3 in our multiple regression analysis. As a result, factors reflecting mitochondrial function (peak heart rate and peak oxygen uptake) that are also associated with insulin resistance 31 were positively correlated with HRR3 (Table 3). Collectively, delayed HRR3 could precede the development of MetS via insulin resistance.
The other possible mechanism is impaired nitric oxide (NO) function, which could affect sympathetic activity. Considering that nitric oxide suppresses sympathetic tone 32 dysfunctions in nitric oxide metabolism in MetS 33 might be associated with delayed recovery from sympathetic hyperactivity.
Although a link between delayed HRR3 and the development of MetS was observed in healthy participants in the present study, the evidence supporting this association has remained uncertain. One recent study suggested that resting heart rate was correlated genetically with FPG, fasting plasma insulin, TG, BMI, waist‐hip ratio, and HDL‐C 34 implying a genetic relationship between HRR3 and components of MetS. Thus, further studies that include genetic investigations are warranted to explore the mechanisms of the relationship.
Stratified analyses revealed an interaction in the subgroup of BMI (P for interaction <0.001; Table S2). This finding showed that BMI is an important factor in determining incident MetS. BMI is significantly correlated with WC, which is a component of MetS 35 Therefore, as expected, participants with a higher BMI (>25) were more likely to develop MetS.
There were some limitations of our study that must be considered. First, since this study was based on participants from a single center, the results might not be generalizable to other populations. Second, although we tried to adjust for as many confounding factors as possible, the participants’ dietary habits were not available to evaluate in this study. Third, >80% of the participants were men (84%, n = 1,820). Therefore, we had to consider this gender imbalance when interpreting the results. Finally, participants who were taking drugs known to influence the development of MetS were not excluded from this study, which might have affected our results.
Nevertheless, the strengths of our study lie in its comprehensive design with a large longitudinal sample and its broad biochemical database that included FPG, fasting plasma insulin, HOMA‐IR, HOMA‐β, and HbA1c, which enabled us to investigate the association between HRR and the development of MetS after adjustment for multiple metabolic risk factors. Moreover, we evaluated HRR1, HRR2, and HRR3 using a standard exercise test methodology. These factors likely contributed to the reliability of our results.
This is the first study to demonstrate a temporal relationship between HRR and the development of MetS in a general population, to the best of our knowledge. In addition, we have proposed a clear HRR3 cutoff point for incident MetS. Therefore, those with an HRR3 value ≤45 bpm should be cautious because they are at high risk for developing MetS. HRR data can be collected easily using a general GTX. Nevertheless, these results are often neglected in primary care medical practice. Thus, we would like to call attention to the importance of the HRR index as a marker of risk for both MetS and type 2 diabetes mellitus. In conclusion, the slow phase of HRR, particularly HRR3, might be more sensitive for predicting the risk of MetS in a general population, even after adjustment for FPG, HOMA‐IR, and HbA1c.
DISCLOSURE
The authors declare no conflict of interest.
Name of the institutional Ethics Committee: The Institutional Review Board (IRB) of Samsung Medical Center.
Approval number: SMC 2015‐01‐003‐001.
Approval date: January 14, 2015.
Animal Studies: N/A.
Supporting information
Table S1 | Correlations between heart rate recovery after a 3 min rest and anthropometric and biochemical parameters (Univariate Model) Table S2 | Baseline clinical and biochemical characteristics of study participants based on 45 beats of heart rate recovery after a 3 min rest Table S3 | Hazard ratios and 95% confidence intervals of development of metabolic syndrome according to tertiles of heart rate recovery after 3 min rest and each 1 beat decrease in heart rate recovery after 3 min rest as a continuous variable stratified by specific parameters Table S4 | Baseline clinical and biochemical characteristics of study participants based on tertiles of heart rate recovery after a 1 min rest Table S5 | Correlations between heart rate recovery after a 1 min rest and anthropometric and biochemical parameters (Univariate Model) Table S6 | Correlations between heart rate recovery after a 1 min rest and anthropometric and biochemical parameters (Multivariate Model)
ACKNOWLEDGMENTS
This study was supported in part by Clinical Research Development Project (CRDP) Grants of the Samsung Biomedical Research Institute [Grant# CRS110221(1), CRS110522(1)].
J Diabetes Investig 2022; 13: 167–176
REFERENCES
- 1. Grundy SM, Cleeman JI, Daniels SR, et al. Diagnosis and management of the metabolic syndrome: an American Heart Association/National Heart, Lung, and Blood Institute Scientific Statement. Circulation 2005; 112: 2735–2752. [DOI] [PubMed] [Google Scholar]
- 2. Ford ES. Risks for all‐cause mortality, cardiovascular disease, and diabetes associated with the metabolic syndrome: a summary of the evidence. Diabetes Care 2005; 28: 1769–1778. [DOI] [PubMed] [Google Scholar]
- 3. Qiu S, Cai X, Sun Z, et al. Heart rate recovery and risk of cardiovascular events and all‐cause mortality: a meta‐analysis of prospective cohort studies. J Am Heart Assoc 2017; 6: e005505. [DOI] [PMC free article] [PubMed] [Google Scholar]
- 4. Lachman S, Terbraak MS, Limpens J, et al. The prognostic value of heart rate recovery in patients with coronary artery disease: a systematic review and meta‐analysis. Am Heart J 2018; 199: 163–169. [DOI] [PubMed] [Google Scholar]
- 5. Savin WM, Davidson DM, Haskell WL. Autonomic contribution to heart rate recovery from exercise in humans. J Appl Physiol 1982; 53: 1572–1575. [DOI] [PubMed] [Google Scholar]
- 6. Grassi G, Seravalle G. Autonomic imbalance and metabolic syndrome: unravelling interactions, mechanisms and outcomes. J Hypertens 2006; 24: 47–49. [DOI] [PubMed] [Google Scholar]
- 7. Qiu SH, Xue C, Sun ZL, et al. Attenuated heart rate recovery predicts risk of incident diabetes: insights from a meta‐analysis. Diabetes Med 2017; 34: 1676–1683. [DOI] [PubMed] [Google Scholar]
- 8. Yu TY, Jee JH, Bae JC, et al. Delayed heart rate recovery after exercise as a risk factor of incident type 2 diabetes mellitus after adjusting for glycometabolic parameters in men. Int J Cardiol 2016; 221: 17–22. [DOI] [PubMed] [Google Scholar]
- 9. Lind L, Andren B. Heart rate recovery after exercise is related to the insulin resistance syndrome and heart rate variability in elderly men. Am Heart J 2002; 144: 666–672. [DOI] [PubMed] [Google Scholar]
- 10. Spies C, Otte C, Kanaya A, et al. Association of metabolic syndrome with exercise capacity and heart rate recovery in patients with coronary heart disease in the heart and soul study. Am J Cardiol 2005; 95: 1175–1179. [DOI] [PMC free article] [PubMed] [Google Scholar]
- 11. Sung J, Choi YH, Park JB. Metabolic syndrome is associated with delayed heart rate recovery after exercise. J Korean Med Sci 2006; 21: 621–626. [DOI] [PMC free article] [PubMed] [Google Scholar]
- 12. Deniz F, Katircibasi MT, Pamukcu B, et al. Association of metabolic syndrome with impaired heart rate recovery and low exercise capacity in young male adults. Clin Endocrinol 2007; 66: 218–223. [DOI] [PubMed] [Google Scholar]
- 13. Tsai SW, Huang YH, Chen YW, et al. Influence of beta‐blockers on heart rate recovery and rating of perceived exertion when determining training intensity for cardiac rehabilitation. J Chin Med Assoc 2015; 78: 520–525. [DOI] [PubMed] [Google Scholar]
- 14. Kim SW, Jee JH, Kim HJ, et al. Non‐HDL‐cholesterol/HDL‐cholesterol is a better predictor of metabolic syndrome and insulin resistance than apolipoprotein B/apolipoprotein A1. Int J Cardiol 2013; 168: 2678–2683. [DOI] [PubMed] [Google Scholar]
- 15. Alberti KG, Eckel RH, Grundy SM, et al. Harmonizing the metabolic syndrome: a joint interim statement of the International Diabetes Federation Task Force on Epidemiology and Prevention; National Heart, Lung, and Blood Institute; American Heart Association; World Heart Federation; International Atherosclerosis Society; and International Association for the Study of Obesity. Circulation 2009; 120: 1640–1645. [DOI] [PubMed] [Google Scholar]
- 16. Lee S, Park HS, Kim SM, et al. Cut‐off points of waist circumference for defining abdominal obesity in the Korean population. Korean J Obesity 2006; 15: 1–9. [Google Scholar]
- 17. Medalie JH, Papier CM, Goldbourt U, et al. Major factors in the development of diabetes mellitus in 10,000 men. Arch Intern Med 1975; 135: 811–817. [PubMed] [Google Scholar]
- 18. Choi KM, Lee J, Kim YH, et al. Relation between insulin resistance and hematological parameters in elderly Koreans – Southwest Seoul (SWS) Study. Diabetes Res Clin Pract 2003; 60: 205–212. [DOI] [PubMed] [Google Scholar]
- 19. Esler M, Rumantir M, Wiesner G, et al. Sympathetic nervous system and insulin resistance: from obesity to diabetes. Am J Hypertens 2001; 14: 304S–309S. [DOI] [PubMed] [Google Scholar]
- 20. Marques‐Vidal P, Mazoyer E, Bongard V, et al. Prevalence of insulin resistance syndrome in southwestern France and its relationship with inflammatory and hemostatic markers. Diabetes Care 2002; 25: 1371–1377. [DOI] [PubMed] [Google Scholar]
- 21. Kizilbash MA, Carnethon MR, Chan C, et al. The temporal relationship between heart rate recovery immediately after exercise and the metabolic syndrome: the CARDIA study. Eur Heart J 2006; 27: 1592–1596. [DOI] [PubMed] [Google Scholar]
- 22. Perini R, Orizio C, Comande A, et al. Plasma norepinephrine and heart rate dynamics during recovery from submaximal exercise in man. Eur J Appl Physiol 1989; 58: 879–883. [DOI] [PubMed] [Google Scholar]
- 23. Coote JH. Recovery of heart rate following intense dynamic exercise. Exp Physiol 2010; 95: 431–440. [DOI] [PubMed] [Google Scholar]
- 24. Emdin M, Gastaldelli A, Muscelli E, et al. Hyperinsulinemia and autonomic nervous system dysfunction in obesity: effects of weight loss. Circulation 2001; 103: 513–519. [DOI] [PubMed] [Google Scholar]
- 25. Schultz HD, Li YL, Ding Y. Arterial chemoreceptors and sympathetic nerve activity: implications for hypertension and heart failure. Hypertension 2007; 50: 6–13. [DOI] [PubMed] [Google Scholar]
- 26. Landsberg L. Pathophysiology of obesity‐related hypertension: role of insulin and the sympathetic nervous system. J Cardiovasc Pharmacol 1994; 23(Suppl 1): S1–S8. [PubMed] [Google Scholar]
- 27. Landsberg L. Insulin resistance, energy balance and sympathetic nervous system activity. Clin Exp Hypertens A 1990; 12: 817–830. [DOI] [PubMed] [Google Scholar]
- 28. Bray GA. Autonomic and endocrine factors in the regulation of food intake. Brain Res Bull 1985; 14: 505–510. [DOI] [PubMed] [Google Scholar]
- 29. Ugur‐Altun B, Altun A, Tatli E, et al. Relationship between insulin resistance assessed by HOMA‐IR and exercise test variables in asymptomatic middle‐aged patients with type 2 diabetes. J Endocrinol Investig 2004; 27: 455–461. [DOI] [PubMed] [Google Scholar]
- 30. Perciaccante A, Fiorentini A, Paris A, et al. Circadian rhythm of the autonomic nervous system in insulin resistant subjects with normoglycemia, impaired fasting glycemia, impaired glucose tolerance, type 2 diabetes mellitus. BMC Cardiovasc Disord 2006; 6: 19. [DOI] [PMC free article] [PubMed] [Google Scholar]
- 31. Kim JA, Wei Y, Sowers JR. Role of mitochondrial dysfunction in insulin resistance. Circ Res 2008; 102: 401–414. [DOI] [PMC free article] [PubMed] [Google Scholar]
- 32. Sander M, Hansen PG, Victor RG. Sympathetically mediated hypertension caused by chronic inhibition of nitric oxide. Hypertension 1995; 26: 691–695. [DOI] [PubMed] [Google Scholar]
- 33. Barbato JE, Zuckerbraun BS, Overhaus M, et al. Nitric oxide modulates vascular inflammation and intimal hyperplasia in insulin resistance and the metabolic syndrome. Am J Physiol Heart Circ Physiol 2005; 289: H228–H236. [DOI] [PubMed] [Google Scholar]
- 34. Guo Y, Chung W, Zhu Z, et al. Genome‐wide assessment for resting heart rate and shared genetics with cardiometabolic traits and type 2 diabetes. J Am Coll Cardiol 2019; 74: 2162–2174. [DOI] [PubMed] [Google Scholar]
- 35. Ryan MC, Fenster Farin HM, Abbasi F, et al. Comparison of waist circumference versus body mass index in diagnosing metabolic syndrome and identifying apparently healthy subjects at increased risk of cardiovascular disease. Am J Cardiol 2008; 102: 40–46. [DOI] [PubMed] [Google Scholar]
Associated Data
This section collects any data citations, data availability statements, or supplementary materials included in this article.
Supplementary Materials
Table S1 | Correlations between heart rate recovery after a 3 min rest and anthropometric and biochemical parameters (Univariate Model) Table S2 | Baseline clinical and biochemical characteristics of study participants based on 45 beats of heart rate recovery after a 3 min rest Table S3 | Hazard ratios and 95% confidence intervals of development of metabolic syndrome according to tertiles of heart rate recovery after 3 min rest and each 1 beat decrease in heart rate recovery after 3 min rest as a continuous variable stratified by specific parameters Table S4 | Baseline clinical and biochemical characteristics of study participants based on tertiles of heart rate recovery after a 1 min rest Table S5 | Correlations between heart rate recovery after a 1 min rest and anthropometric and biochemical parameters (Univariate Model) Table S6 | Correlations between heart rate recovery after a 1 min rest and anthropometric and biochemical parameters (Multivariate Model)