

Abstract
Aims/Introduction
We examined the impact of scanning frequency with flash glucose monitoring on glycemic control in children and adolescents with type 1 diabetes.
Materials and Methods
The study included 85 patients, aged 14.0 ± 0.5 years, with type 1 diabetes. The median time in the target glucose range (TIR) and glycosylated hemoglobin (HbA1c) values were 50.0 ± 1.4% and 7.5 ± 0.1%, respectively.
Results
The median scanning frequency using flash glucose monitoring was 12.0 ± 0.4 times/day. Scanning frequency showed a significant positive correlation with TIR and an inverse correlation with HbA1c. Scanning frequency was identified to be the determinant of TIR and HbA1c by using multivariate analysis. The participants whose scanning frequency was <12 times/day were categorized as the low‐frequency group (n = 40), and those who carried out the scanning >12 times/day were categorized as the high‐frequency group (n = 45). Patients in the high‐frequency group were more likely to be treated with insulin pumps compared with those in the low‐frequency group; however, this difference was not significant (21.3 vs 5.3%, P = 0.073). The high‐frequency group showed significantly greater TIR than the low‐frequency group (57 ± 1.6 vs 42 ± 1.7%, P = 0.002). Furthermore, the high‐frequency group showed significantly lower HbA1c levels than the low‐frequency group (6.8 ± 0.1 vs 8.0 ± 0.1%, P < 0.001).
Conclusions
These findings showed that patients with a higher scanning frequency had better glycemic control, with greater TIRs and lower HbA1c levels, compared with those with a lower scanning frequency. Scanning frequency of >12 times/day might contribute to better glycemic outcomes in real‐world practice in children with type 1 diabetes.
Keywords: Flash glucose monitoring, Scanning, Time in range
Patients with a higher scanning frequency had better glycemic control, with greater target glucose range and lower glycosylated hemoglobin level, compared with those with lower scanning frequency. Frequent scanning of >12 times per day using flash glucose monitoring might contribute to better glycemic outcomes in children with type 1 diabetes.

Introduction
Continuous glucose monitoring (CGM) provides additional information, including real‐time and predictive glucose data, compared with conventional glucose testing. CGM can also be used to recognize hyper‐ and hypoglycemia events, and review the variability in glucose levels over time. Glucose trends based on CGM data analysis can be helpful in treatment intervention (e.g., prevention of hypoglycemia, improvement of glycemic patterns at specific times of the day and increase of the time spent in the appropriate glucose range) 1 . Self‐monitoring of blood glucose offers real‐time glucose levels, and the glycosylated hemoglobin (HbA1c) values show the average glycemic control during the previous 1–2 months. However, they do not reflect the variability in glucose levels; therefore, individuals with identical HbA1c levels might have different blood glucose patterns 2 , 3 . CGM data might be superior to self‐monitoring of blood glucose, as well as to HbA1c, because it can provide the patterns and variability in glucose levels and glucose trends over time. This can be useful for patients with diabetes who desire to be more involved with their glycemic management 1 . The CGM‐derived metric, namely the time spent in the target glucose range (TIR), allows for the direct observation of daily glucose patterns, and is believed to be a superior glycemic indicator for patients with diabetes. The Advanced Technologies & Treatments for Diabetes Congress has proposed the international consensus of glycemic cut‐off point for TIR as 70–180 mg/dL for patients of all ages with type 1 and type 2 diabetes 4 .
Usually, the CGM requires repeated calibration by finger‐stick capillary glucose testing. However, FreeStyle® Libre (Abbott Diabetes Care, Witney, Oxfordshire, UK), flash glucose monitoring (FGM), is a simple device to measure glucose levels without the need for self‐calibration by the patient, but requires scanning a sensor for checking the glucose level. Nevertheless, FGM can check the glucose levels more easily without the burden of frequent finger‐stick tests, and offers more detailed information about the glucose trend. It displays the data as an ambulatory glucose profile (AGP) by scanning a sensor to obtain the glucose reading at any time 5 , 6 , 7 . Several studies have shown that the frequency of scanning with FGM is related to glycemic control 5 , 8 , 9 , 10 . We also previously reported that the scanning frequencies had a significant positive correlation with TIRs and an inverse correlation with HbA1c levels 11 . Therefore, frequent scanning with FGM might help in achieving optimal glycemic control, namely, improvement of TIR and reduced HbA1c level.
Glycemic control in children and adolescents with type 1 diabetes is believed to be difficult, because their physical activities, eating habits and lifestyles are variable, and endogenous insulin secretion is completely lost over time in most pediatric patients with type 1 diabetes. FGM can improve glycemic outcomes in such patients, because it is simple to use and shows various parameters, such as AGP. The AGP is based on the amplitude of glucose excursion (the extent by which the glucose value is out of range) and the time spent in glucose excursion (duration for which the glucose value was out of range) 1 . We hypothesized that patients with frequent scanning using FGM could achieve better glycemic control compared with those with a lower frequency of scanning. We evaluated the effect of scanning frequency with FGM on glycemic control by measuring TIR and HbA1c, and identified the optimal scanning frequency in achieving better glycemic control in Japanese children and adolescents with type 1 diabetes.
Materials and Methods
Study participants
The study enrolled 90 children and adolescents with type 1 diabetes who were using FreeStyle® Libre for FGM. The median (range) age and duration of diabetes were 14.0 ± 0.6 (3.8–17.9) and 6.4 ± 0.5 (1.0–14.0) years, respectively. Among these patients, 85 continued to wear FreeStyle® Libre for the entire study period of 28 days, whereas five participants dropped out of the study because of sensor problems, skin peeling off and skin irritation. Accordingly, the final analyses included 85 patients (36 boys, 49 girls; median age 14.0 ± 0.5 [4.0–17.9] years; duration of diabetes 6.3 ± 0.5 [1.2–14.0] years) with type 1 diabetes. The median TIR (70–180 mg/dL), time spent in below the target glucose range (<70 mg/dL), time spent in above the target glucose range (<180 mg/dL) and HbA1c level in the study participants were 50.0 ± 1.4%, 11.0 ± 0.7%, 39.0 ± 1.5% and 7.5 ± 0.1%, respectively. They were instructed to scan the sensors more than four times per day, and all kept the number of times during the study period.
In the present study cohort, 73 patients were on multiple daily injections of insulin, and 12 were on an insulin pump. They had neither problematic micro‐ and macrovascular complications nor psychosocial problems. The bolus insulin dosages were decided using a carbohydrate‐counting method based on the carbohydrate consumption at each meal. None of the participants used a sensor‐augmented pump, a predictive low glucose suspend‐function pump or a hybrid closed‐loop therapy. They regularly visited the outpatient clinic once a month, and HbA1c was tested at each visit at the laboratory of Nihon University Hospital.
This study was approved by the Human Ethics Review Committee of Nihon University School of Medicine (No. 20200601, June 12, 2021), and was carried out in accordance with the ethical standards set forth in the 1964 Declaration of Helsinki and its later amendments.
Assessments
First, we analyzed the correlation between scanning frequency and TIR and HbA1c, and investigated whether scanning frequency was the determinant of these variables or not using multiple regression analysis. Second, we divided the study participants into two subgroups according to the scanning frequency with FGM; that is, the low‐frequency group (n = 40) with a scanning frequency <12 times per day (12.0 times per day was the median frequency in the study) and the high‐frequency group (n = 45) with a scanning frequency >12 times per day. TIR and HbA1c values were compared between the two subgroups to evaluate whether this cut‐off time is optimal in achieving better glycemic control.
TIR was defined as the percentage of time spent within the glucose level of 70–180 mg/dL for 24 h 4 . HbA1c was measured by high‐performance liquid chromatography and expressed as National Glycohemoglobin Standardization Program units (%; reference value: 4.6–6.1%). Serum C‐peptide was measured by chemiluminescent enzyme immunoassay.
Statistical analysis
The results are expressed as the median ± standard error. Comparisons between the two groups were analyzed by the Mann–Whitney U‐test and the χ2‐test, and the correlation of scanning frequency with HbA1c and TIR was evaluated using Spearman’s rank correlation coefficient. In addition, the correlation of patient characteristics (sex and age) with HbA1c and TIR was evaluated in the same manner. The association between scanning frequency with HbA1c and TIR was further evaluated using multiple regression analysis adjusted for patient characteristics, which showed statistical significance in the correlation analysis to assess whether scanning frequency was the determinant of HbA1c and TIR. Multicollinearity was assessed by Spearman’s rank correlation coefficient. The assumption of multiple regression was confirmed with residual analysis. A P‐value <0.05 was considered as a statistically significant difference. All statistical analyses were carried out using SPSS version 25.0 (IBM Corp., Armonk, NY, USA).
Results
Median scanning frequency
The median scanning frequency was 12.0 ± 0.4 (5–20) times per day. The clinical characteristics of the two groups at baseline are shown in Table 1. There was no significant difference in the mean age, duration of diabetes, period after introduction of FGM and random serum C‐peptide level between the two groups. Patients in the high‐frequency group were more likely to be on insulin pump compared with those in the low‐frequency group; however, the difference between the groups was not statistically significant (21.3 vs 5.3%, P = 0.073).
Table 1.
Clinical characteristics in the low‐frequency group and high‐frequency group
| Low‐frequency group (n = 40) | High‐frequency group (n = 45) | |
|---|---|---|
| Male/female | 20/20 | 18/27 |
| Age (years) | 13.8 ± 4.6 (5.2–17.9) | 12.9 ± 5.0 (3.8–15.5) |
| Duration of diabetes (years) | 6.6 ± 4.3 (2.2–14.0) | 6.2 ± 4.6 (1.0–12.8) |
| Frequency of scanning per day | 9.0 ± 0.2 (5.0–11.0) | 15 ± 0.5 (12.0–20.0) |
| Period after the introduction of FGM (years) | 1.2 ± 0.5 (0.6–1.7) | 1.2 ± 0.6 (0.7–1.8) |
| Random serum C‐peptide (ng/mL) | 0.1 ± 0.1 (0.1 > −0.5) | 0.1 ± 0.1 (0.1 > −0.5) |
| MDI/insulin pump | 36/2 | 37/10 |
The results were expressed as the median ± standard error.
FGM, flash glucose monitoring; MDI, multiple daily injections.
Correlation between scanning frequency and TIR and HbA1c
Overall scanning frequency showed a significant positive correlation with TIR (r = 0.724, P < 0.001) and an inverse correlation with HbA1c (r = −0.789, P < 0.001).
Investigation whether scanning frequency was the determinant of TIR and HbA1c or not using multiple regression analysis
Regarding patient characteristics, scanning frequency was positively correlated with age. Multiple regression models adjusted for age showed that scanning frequency was a significant independent determinant of HbA1c and TIR (P < 0.001, respectively) with good model fitting (adjusted R 2 0.678 and 0.549, respectively). Scanning frequency was negatively associated with HbA1c (standardized β −0.754), and positively associated with TIR (standardized β 0.672; Table 2).
Table 2.
Investigation whether scanning frequency was the determinant of time spent in target glucose range and glycosylated hemoglobin or not using multiple using multiple regression analysis
| R 2 | β | β‐CI | Standard β | t | P‐value | |
|---|---|---|---|---|---|---|
| HbA1c | 0.678 | −0.191 | −0.228 to −0.154 | −0.754 | −10.241 | <0.001 |
| TIR | 0.517 | 2288 | 1.675–2.900 | 0.672 | 7.451 | <0.001 |
CI, confidence interval; HbA1c, glycosylated hemoglobin; R 2, coefficient of determination; TIR, time spent in target glucose range; β, regression coefficient.
Comparison of TIR and HbA1c between the low‐frequency and high‐frequency groups
The median TIR, below the target glucose range and time spent in above the target glucose range were 42.0 ± 1.7 (7.0–64.0)%, 11.0 ± 0.9 (3.0–24.0)% and 46.0 ± 1.7 (14.0–69.0)% in the low‐frequency group, and 57.0 ± 1.6 (36.0–73.0)%, 12.0 ± 1.1 (2.0–27.0)%, 30.0 ± 1.5 (15.0–44.0)% in the high‐frequency group, respectively. The high‐frequency group showed significantly higher TIR (P = 0.002; Figure 1) and lower time spent in above the target glucose range (P < 0.001) than the low‐frequency group. Although, there was no significant difference of below the target glucose range between the two groups (P = 0.586).
Figure 1.
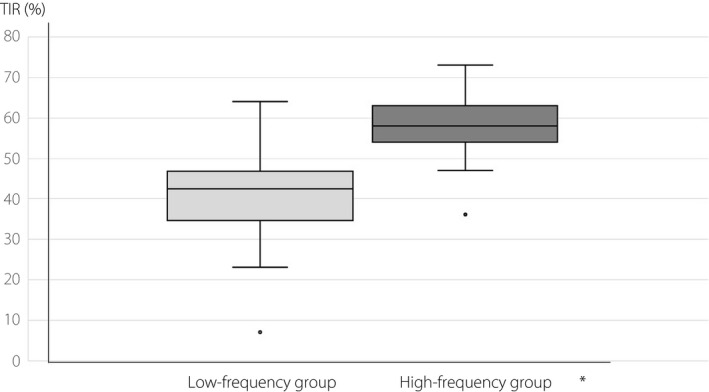
Comparison of time spent in target glucose range (TIRs) between the low‐frequency group and high‐frequency group. *P = 0.002.
In contrast, the median HbA1c level was 8.0 ± 0.1 (6.0–9.9)% in the low‐frequency group, and that in the high‐frequency group was 6.8 ± 0.1 (5.6–7.8)%. The high‐frequency group had significantly lower HbA1c level than the low‐frequency group (P < 0.001; Figure 2). The frequency of TIR of >60% was 7.5% in the low‐frequency group, whereas it was 44.4% in the high‐frequency group. Furthermore, the frequency of HbA1c level of <7.0% was 10.0% in the low‐frequency group, whereas it was 53.3% in the high‐frequency group. The frequency of TIR >60% and that of HbA1c <7.0% were significantly higher in the high‐frequency group than in the low‐frequency group (P < 0.001, both).
Figure 2.
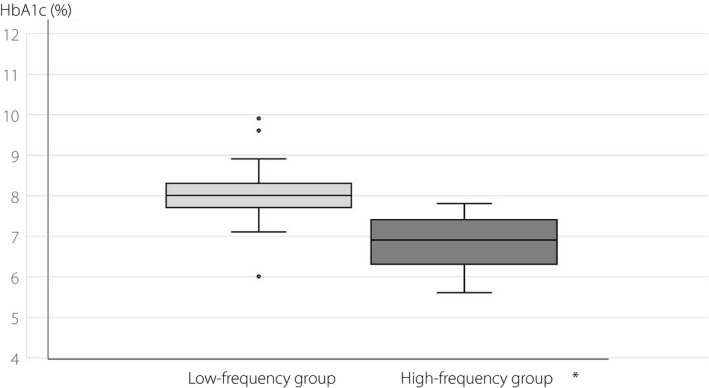
Comparison of glycosylated hemoglobin (HbA1c) levels between the low‐frequency group and high‐frequency group. *P < 0.001.
Discussion
In the present study, the median number of scans was 12.0 ± 0.4 times per day. Children and adolescents spend most of the daytime at school, and the majority do not frequently carry out glucose testing during school hours; in addition, they rarely carry out the scan after midnight, from 00.00 to 06.00 hours. The usual time of scan in this group is from 06.00 to 08.00 hours(before school) and from 18.00 to 00.00 hours (from after school to before bedtime) 11 . Nevertheless, 45 out of 85 children and adolescents carried out scanning with FGM >12 times per day for their glycemic management. More simple use of FreeStyle® Libre with convenient scanning at any time encourages frequent glucose testing, even in pediatric patients with diabetes.
An international study, in which the average number of scans was 16 times per day, reported that a higher frequency of scanning was related to better glycemic outcomes; for example, improvement of TIR and reduction in HbA1c, than a lower frequency of scanning. This result was consistent across individuals from all countries that participated in the study 9 . It was also reported that the reduction in HbA1c was achieved early with FGM and was sustained over time 12 . We also showed that children with a higher frequency of scanning with FGM had better glycemic control with greater TIR and lower HbA1c than those with a lower frequency of scanning. Furthermore, approximately half of the patients with a higher frequency of scanning could achieve appropriate glycemic control, with a HbA1c value <7.0% and acceptable TIR >60%, whereas <10% of a lower frequency of scanning achieved these target levels. We consider that HbA1c <7.0% and TIR >60%, which is lower than the Advanced Technologies & Treatments for Diabetes‐recommended value 1 , might be optimal glycemic cut‐off points without an increase of hypoglycemia in real‐world management of Japanese children with type 1 diabetes 13 . These results suggest that frequent scanning ≥12 times per day can contribute to achieving better glycemic control in pediatric patients with type 1 diabetes. Additionally, we calculated that TIR of 70%, which is a primary goal of Advanced Technologies & Treatments for Diabetes 1 , corresponded with an estimated scanning frequency of 20 times per day 11 . Twenty times seem quite difficult to achieve in real‐world practice; furthermore, achieving TIR >70% is also hard to achieve in pediatric patients with unstable lifestyles and eating habits 13 .
The possible reason for better glycemic control with frequent scanning using FGM might be as follows: a real‐time glucose view when scanning shows hyper‐ or hypoglycemia, even in the absence of clinical symptoms, and trend‐arrows provide predictive cues about glucose trend. The glucose information allows interventions, such as scheduling additional insulin injections to correct hyperglycemia and prevent hypoglycemia. Correction of hyperglycemia using individualized insulin sensitivity factors and intake of glucose to prevent the progression of hypoglycemia are the most important benefits. Furthermore, retrospective analyses of the AGP data and adjustment of insulin dosages are also key points to increase the TIR and to reduce the glucose variability 4 , 14 .
We showed that patients in the high‐frequency group were more likely to be treated with insulin pump compared with those in the low‐frequency group. Insulin pump therapy usually requires more frequent glucose testing than multiple daily injections of insulin to adjust the insulin dosages, both basal infusion rates and pre‐prandial bolus dosages. Insulin pump users are likely to desire strict glycemic management with meticulous adjustment of insulin dosages, because they tend to have a wider fluctuation of blood glucose and more frequent or recurrent episodes of hypoglycemia 15 . Frequent scanning helps to recognize the glucose variability and unexpected episodes of hyper‐ and hypoglycemia, which contributes to improved glycemic control by changing the pre‐programmed basal infusion rates and bolus dosages. Insulin pump therapy can have an impact on scanning frequency in FGM.
In the present study and the previous study 16 , we found that frequent scanning with FGM did not contribute to the reduction in the frequency of hypoglycemia. The possible reasons are as follows: the majority of children do not carry out scanning after midnight, despite most hypoglycemic events occurring after midnight 11 . The FGM cannot cope with a rapid fall in glucose levels and an unexpected change in hypoglycemia. Furthermore, FGM does not have an alert or alarm system against hypoglycemia. Real‐time CGMs and hybrid closed‐loop systems have an alarm system and low glucose suspension‐function when glucose is below a specified level or when there is a rapid fall in glucose levels 17 , 18 . Use of these advanced devices can reduce the episodes of hypoglycemia with improving glycemic control 19 , 20 .
Of note, this is the first study to show the scanning frequency with FGM as the determinant of important glycemic indicators, TIR and HbA1c, using multiple regression analysis in pediatric patients with type 1 diabetes, who usually show unstable lifestyles and variable glucose patterns. We also found that scanning frequency of >12 times per day might be a cut‐off point in achieving better glycemic control with HbA1c <7.0% and TIR >60%, which is considered to be optimal for real‐world practice in pediatric patients with type 1 diabetes.
The present study included some limitations. First, it was a retrospective and observational study. Therefore, the primary end‐point was not specified, and sample size considerations were not factored, and most outcomes were descriptive in nature. Second, it was a single‐center study without setting a control group. Therefore, the results were not representative of the entire population of pediatric patients with type 1 diabetes in Japan. However, specialized centers for childhood type 1 diabetes are rare in Japan, because the prevalence of type 1 diabetes in Japanese children is quite low compared with that in western countries. We did not find other Japanese reports describing the effect of scanning frequency with FGM on glycemic control in children and adolescents with type 1 diabetes. Third, patient characteristics, such as educational and socioeconomic status, and lifestyles, that can affect glycemic control were not evaluated. Fourth, higher scanning frequency in insulin pump users can be an impediment to assessing the pure impact of scanning frequency on FGM. Finally, the present study sample was too small to elucidate the results in a detailed manner. Therefore, our results should be confirmed in a larger pediatric population.
In conclusion, we found that patients with a higher scanning frequency with FGM had better glycemic control, with greater TIR and lower HbA1c than those with a lower scanning frequency in pediatric patients with type 1 diabetes. Scanning frequency of >12 times per day could contribute to better glycemic outcomes in real‐world practice. Some reports have shown that greater TIR is associated with a lower occurrence of diabetic microvascular complications 21 , 22 . Glycemic management using FGM with frequent scanning might be one of the beneficial options to improve the prognosis in pediatric‐onset type 1 diabetes.
Disclosure
TU received honoraria from Novo Nordisk Pharma Ltd., Eli Lilly Japan K.K., Terumo Corp. and JCR Pharmaceuticals Co., Ltd. IM received study grants from Atom Medical Corp.; and lecture fees from MSD Co., Ltd. and AbbVie LLC. The other authors declare no conflicts of interest.
J Diabetes Investig 2022; 13: 185–190
References
- 1. Miller EM. Using continuous glucose monitoring in clinical practice. Clin Diabetes 2020; 38: 429–438. [DOI] [PMC free article] [PubMed] [Google Scholar]
- 2. Wright EE Jr, Gavin JR 3rd. Clinical use of professional continuous glucose monitoring. Diabetes Technol Ther 2017; 19(Suppl. 2): S12–S15. [DOI] [PMC free article] [PubMed] [Google Scholar]
- 3. Distiller LA, Cranston I, Mazze R. First clinical experience with retrospective flash glucose monitoring (FGM) analysis in South Africa: characterizing glycemic control with ambulatory glucose profile. J Diabetes Sci Technol 2016; 10: 1294–1302. [DOI] [PMC free article] [PubMed] [Google Scholar]
- 4. Battelino T, Danne T, Bergenstal RM, et al. Clinical targets for continuous glucose monitoring data interpretation: recommendations from the international consensus on time in range. Diabetes Care 2019; 42: 1593–1603. [DOI] [PMC free article] [PubMed] [Google Scholar]
- 5. Bolinder J, Antuna R, Geelhoed‐Duijvestijn P, et al. Novel glucose‐sensing technology and hypoglycaemia in type 1 diabetes: a multicentre, non‐masked, randomized controlled trial. Lancet 2016; 388: 2254–2263. [DOI] [PubMed] [Google Scholar]
- 6. Reddy M, Jugnee N, El Laboudi A, et al. A randomized controlled pilot study of continuous glucose monitoring and flash glucose monitoring in people with type 1 diabetes and impaired awareness of hypoglycaemia. Diabet Med 2018; 35: 483–490. [DOI] [PMC free article] [PubMed] [Google Scholar]
- 7. Edelman SV, Argento NB, Pettus J, et al. Clinical implications of real‐time and intermittently scanned continuous glucose monitoring. Diabetes Care 2018; 41: 2265–2274. [DOI] [PubMed] [Google Scholar]
- 8. Haak T, Hanaire H, Ajjan R, et al. Flash glucose‐sensing technology as a replacement for blood glucose monitoring for the management of insulin‐treated type 2 diabetes: a multicenter, open‐label randomized controlled trial. Diabetes Ther 2017; 8: 55–73. [DOI] [PMC free article] [PubMed] [Google Scholar]
- 9. Dunn TC, Xu Y, Hayter G, et al. Real‐world flash glucose monitoring patterns and associations between self‐monitoring frequency and glycaemic measures: a European analysis of over 60 million glucose tests. Diabetes Res Clin Pract 2018; 37: 37–45. [DOI] [PubMed] [Google Scholar]
- 10. Jangum S, Dunn T, Xu Y, et al. Sustained improvement in glycaemic control following flash glucose monitoring: a world observational analysis (Abstract). Diabetes Technol Ther 2018; 20(Suppl. 1): A25. [Google Scholar]
- 11. Suzuki J, Urakami T, Yoshida K, et al. Association between scanning frequency of flash glucose monitoring and continuous glucose monitoring‐derived glycemic makers in children and adolescents with type 1 diabetes. Pediatr Int 2021; 63: 154–159. [DOI] [PubMed] [Google Scholar]
- 12. Evans M, Welsh Z, Ells S, et al. The impact of flash glucose monitoring on glycaemic control as measured by HbA1c: a meta‐analysis of clinical trials and real‐world observational studies. Diabetes Ther 2020; 11: 83–95. [DOI] [PMC free article] [PubMed] [Google Scholar]
- 13. Urakami T, Yoshida K, Kuwabara R, et al. Individualization of recommendations from the international consensus on continuous glucose monitoring‐derived metrics in Japanese children and adolescents with type 1 diabetes. Endocr J 2020; 67: 1055–1062. [DOI] [PubMed] [Google Scholar]
- 14. Dovc K, Battelino T. Time in range centered diabetes care. Clin Pediatr Endocrinol 2021; 30: 1–10. [DOI] [PMC free article] [PubMed] [Google Scholar]
- 15. Sherr JL, Tauschmann M, Battelino T, et al. ISPAD clinical practice consensus guidelines 2018: diabetes technologies. Pediatr Diabetes 2018; 19(Suppl. 27): 302–325. [DOI] [PubMed] [Google Scholar]
- 16. Urakami T, Yoshida K, Kuwabara R, et al. Significance of “time below range” as a glycemic marker derived from continuous glucose monitoring in Japanese children and adolescents with type 1 diabetes. Horm Res in Paediatr 2020; 93: 251–257. [DOI] [PubMed] [Google Scholar]
- 17. Bergenstal RM, Klonoff DC, Garg SK, et al. Threshold‐based insulin‐pump interruption for reduction of hypoglycemia. N Engl J Med 2013; 369: 224–232. [DOI] [PubMed] [Google Scholar]
- 18. Maahs DM, Calhoun P, Buckingham BA, et al. A randomized trial of a home system to reduce nocturnal hypoglycemia in type 1 diabetes. Diabetes Care 2014; 37: 1885–1891. [DOI] [PMC free article] [PubMed] [Google Scholar]
- 19. Chase HP, Kim LM, Owen SL, et al. Continuous subcutaneous glucose monitoring in children with type 1 diabetes. Pediatrics 2001; 107: 222–226. [DOI] [PubMed] [Google Scholar]
- 20. Mastrototaro JJ, Cooper KW, Soundararajan G, et al. Clinical experience with an integrated continuous glucose sensor/insulin pump platform: a feasibility study. Adv Ther 2006; 23: 725–732. [DOI] [PubMed] [Google Scholar]
- 21. Lu J, Ma X, Zhou J, et al. Association of time in range, as assessed by continuous glucose monitoring, with diabetic retinopathy in type 1 diabetes. Diabetes Care 2018; 41: 2370–2376. [DOI] [PubMed] [Google Scholar]
- 22. Sheng X, Xiong GH, Yu PF, et al. The correlation between time in range and diabetic microvascular complications utilizing information management. Int J Endocrinol 2020. 10.1155/2020/8879085. [DOI] [PMC free article] [PubMed] [Google Scholar]