

Abstract
Epigenetic therapies, including DNA methyltransferase and histone deacetylase (HDAC) inhibitors, are increasingly being considered to treat hematological malignancies, but their effects on normal hematopoietic stem cells (HSCs) remain largely unexplored. We compared the effects of several HDAC inhibitors, including valproic acid (VPA) and trichostatin A (TSA), alone or in combination with 5-aza-2′-deoxycytidine (5azaD) on the expansion of HSCs. VPA induced the highest expansion of CD34+CD90+ cells and progenitor cells compared with other HDAC inhibitors or the sequential addition of 5azaD/TSA in culture. Xenotransplantation studies demonstrated that VPA prevents HSC loss, whereas 5azaD/TSA treatment leads to a net expansion of HSCs that retain serial transplantation ability. 5azaD/TSA-mediated HSC expansion was associated with increased histone acetylation and transient DNA demethylation, which corresponded with higher gene transcript levels. However, some genes with increased transcript levels lacked changes in methylation. Importantly, a global microarray analysis revealed a set of differentially expressed genes in 5azaD/TSA- and VPA-expanded CD34+ cells that might be involved in the expansion and maintenance of transplantable HSCs, respectively. In summary, our data indicate that treatment of HSCs with different chromatin-modifying agents results in either the expansion or maintenance of HSCs, an observation of potential therapeutic importance.
Keywords: Hematopoiesis, Stem and progenitor cells, Epigenetic modification, Ex vivo expansion, Transplantation: basic biology, Umbilical cord blood
INTRODUCTION
The mechanisms that govern hematopoietic stem cell (HSC) fate decisions, including self-renewal and differentiation, are likely under tight control but remain potentially alterable. Self-renewal and differentiation decisions in HSCs seem to occur independently of cytokines and are postulated to be predetermined by cell-intrinsic properties [1,2], which can also be influenced by external regulatory factors. We demonstrated that environmental cues likely influence intrinsic factors, such as epigenetic events, to influence HSC fate choices [3].
The limited number of HSCs within a cord blood (CB) unit likely contributes to the high rate of graft failure and delayed engraftment upon CB transplantation, particularly in adults [4,5]. However, this limitation could be overcome if the number of transplantable HSCs within a CB unit were expanded. Studies have led to the identification of several molecules, including notch ligand, prostaglandin E2, pleiotrophin, and an aryl hydrocarbon receptor antagonist, as positive stimulators of HSC expansion, although none of these molecules alone exhibited potency [6–9]. Current ex vivo expansion strategies in clinical trials using notch ligand or marrow stromal cell co-culture primarily expand short-term progenitors and rely on a second unmanipulated CB graft for long-term blood cell production [7,10].
Epigenetic therapies, including the hypomethylating drug 5-aza-2′-deoxycytidine (5azaD) and histone deacetylase (HDAC) inhibitors, used alone or in combination, are increasingly being considered for the treatment of cancers, including hematological malignancies [11,12]. Valproic acid (VPA) alone or in combination with all-trans retinoic acid has demonstrated potency in inducing cell death in leukemia, myeloproliferative diseases, and solid tumors [13–15]. However, the effects of such epigenetic modifiers on normal HSCs are not clear.
We previously demonstrated that the sequential addition of 5azaD followed by the HDAC inhibitor trichostatin A (TSA) in CD34+ cell culture expands normal HSCs possessing marrow repopulation capacity [16,17]. The objective of our current study was to examine the potency of various chromatin-modifying agents (CMAs) either alone or in combination with a DNA methyltransferase inhibitors and to compare these results with previously established strategies involving the sequential addition of CMAs, including the hypomethylating drug 5azaD and the HDAC inhibitor TSA in culture [18,19]. Toward this goal, we compared the efficacy of several CMAs, including VPA, TSA, Nicotinamide (NA), sub-eroylanilide hydroxamic acid (SAHA), and 5azaD as single agents or in combination to study their ability to expand repopulating HSCs. The potential of various CMAs to alter normal HSC fate choices has been explored [20–23], but the ability of VPA to maintain hematopoietic stem/progenitor cells in culture has not been previously described. The significance of our current study is the demonstration that different CMAs have variable effects on HSC outcomes and that this difference can be used to identify genes presumably involved in distinct biological processes, including HSC expansion or maintenance. More importantly, we show for the first time that various HDAC inhibitors alone or in combination with DNA methyltransferase inhibitors can exert distinct effects on HSC outcomes in culture, which might be relevant for the design of future clinical trials using epigenetic therapy to treat hematological malignancies.
METHODS
Isolation and Culture of CD34+ Cells
Human CB was obtained according to Institutional Review Board guidelines. Low-density cells (<1.077 g/mL) were obtained by density centrifugation on Ficoll-Paque (GE Healthcare, Uppsala, Sweden), and CD34+ cells were immunomagnetically (Miltenyi Biotech, Inc., Auburn, CA) isolated from this population as described previously [3]. The purity of the isolated CD34+ cells ranged from 90% to 99%. CD34+ cell expansion culture with or without CMA was performed in medium containing 30% FBS (HyClone Laboratories, Logan, UT) supplemented with a cocktail of recombinant human cytokines as previously described [3].
Flow Cytometric Analysis
Flow cytometric analysis was conducted as previously described [18]. All antibodies were purchased from BD Bioscience (San Jose, CA). All analyses were paired with the corresponding matched isotype control, and at least 10,000 live cells were acquired for each analysis (CellQuest software, Becton Dickinson San Jose, CA).
Colony-Forming Cell and Cobblestone Area–Forming Cell Assays
Colony-forming cells (CFCs) were assayed by plating cells in semisolid methyl cellulose (1.1%)-based medium containing 30% FBS (Stem Cell Technologies, Vancouver, BC, Canada) and a cocktail of recombinant human cytokines as described previously [3]. The colonies were counted after 14 days [3]. The number of cobblestone area—forming cells (CAFCs) was quantitated by plating in a limiting dilution as described previously [3,24,25].
Nonobese Diabetic/SCID Assays
Immunodeficient nonobese diabetic/ltsz-scid/scid (NOD/SCID) mice were purchased from Jackson Laboratories (Bar Harbor, ME), and transplantation assays were performed as previously described [3].
RNA Preparation and Real-Time PCR
RNA preparation and real-time quantitative PCR (qPCR) assays were performed using SYBR Green dye (Life Technologies, Carlsbad, CA) and an ABI 7500 Fast Real-Time PCR system (Life Technologies) to quantitate gene expression using reverse-transcribed mRNA as described previously [18]. The primer sequences used in real-time RT-PCR are shown in Supplemental Table 1.
Chromatin Immunoprecipitation Assays
The chromatin immunoprecipitation assay was conducted using a commercial assay kit following the manufacturer’s instructions (Millipore, Billerica, MA) as described previously [26]. Briefly, after 72 hours of culture, CD34+ cells were cross-linked with formaldehyde, and the cell pellet was lysed, sonicated to produce genomic fragments, and immunoprecipitated using an anti—acetyl-histone H4 antibody (Millipore, Billerica, MA).
Microarray Studies
Global gene expression microarray studies using a U133 Plus 2.0 array (Affymetrix, Santa Clara, CA) were performed in collaboration with the UCLA Clinical Microarray Core as described previously with minor modifications [27]. For more details, please refer to Supplemental Methods, below.
DNA Methylation Analysis
Briefly, genomic DNA was isolated from primary or CMA-expanded enriched CD34+ cells using the Blood and Cell Culture DNA kit (Qiagen, Valencia, CA). Genomic DNA was bisulfite treated using an EZ Methylation Kit (Zymo Research, Irvine, CA), and biotinylated gene-specific primers or long interspersed nucleotide element 1 (LINE-1) primers were used to PCR amplify the regions of interest as described previously [28,29]. DNA methylation analysis was performed by EpigenDx (Worcester, MA) using quantitative pyrosequencing and the PSQ-HS96 system according to standard operating procedures [28]. Biotinylated gene-specific primers were developed for the CpG sites near the promoter area as detailed in Supplemental Table 3, or LINE-1 primers were used to amplify regions of interest for analysis as described previously [29].
Measurement of Leukotriene B4 by ELISA
The concentration of leukotriene B4 in conditioned medium was measured with an acetylcholine esterase competitive enzyme immunoassay following the manufacturer’s instructions (Cayman Chemical Co., Ann Arbor, MI).
Statistical Analysis
Results are expressed as means ± standard error (SE) when applicable. The statistical significance (P < .05) between groups was determined using a 2-tailed Student’s t-test.
RESULTS
VPA Induces Significant Expansion of CD34+CD90+ Cells
We compared the effects of various CMAs on HSC expansion using HDAC inhibitors as single agents or in combination with 5azaD with the effects of the sequential addition of 5azaD/TSA, a prototype CMA [3], under identical culture conditions. As shown in Figure 1C, after culture, 1.17% ± .32% of the total nucleated cells exposed to cytokines alone co-expressed CD34 and CD90, whereas 2%, 5%, 6%, 13%, and 3% of cells cultured with cytokines plus 5azaD, TSA, NA, 5azaD/NA, or SAHA, respectively, co-expressed the CD34 and CD90 antigens (Figure 1C). Cultures containing VPA, 5azaD/TSA, or 5azaD/VPA had a higher percentage of CD34+CD90+ cells compared with control (42.2% ± 13.5%, 28.2% ± 3.6%, and 52.4% ± 9.5%, respectively) (Figure 1C). Total nucleated cells were highest in the control culture and lowest in the culture treated with 5aza/VPA (Figure 1A). Because total nucleated cells and the proportion of CD34+CD90+ cells varied significantly in cultures containing various CMAs, in contrast to the control (Figure 1C), the fold expansion of primitive CD34+CD90+ cells was analyzed in comparison with their initial numbers before culture (Figure 1D).
Figure 1.
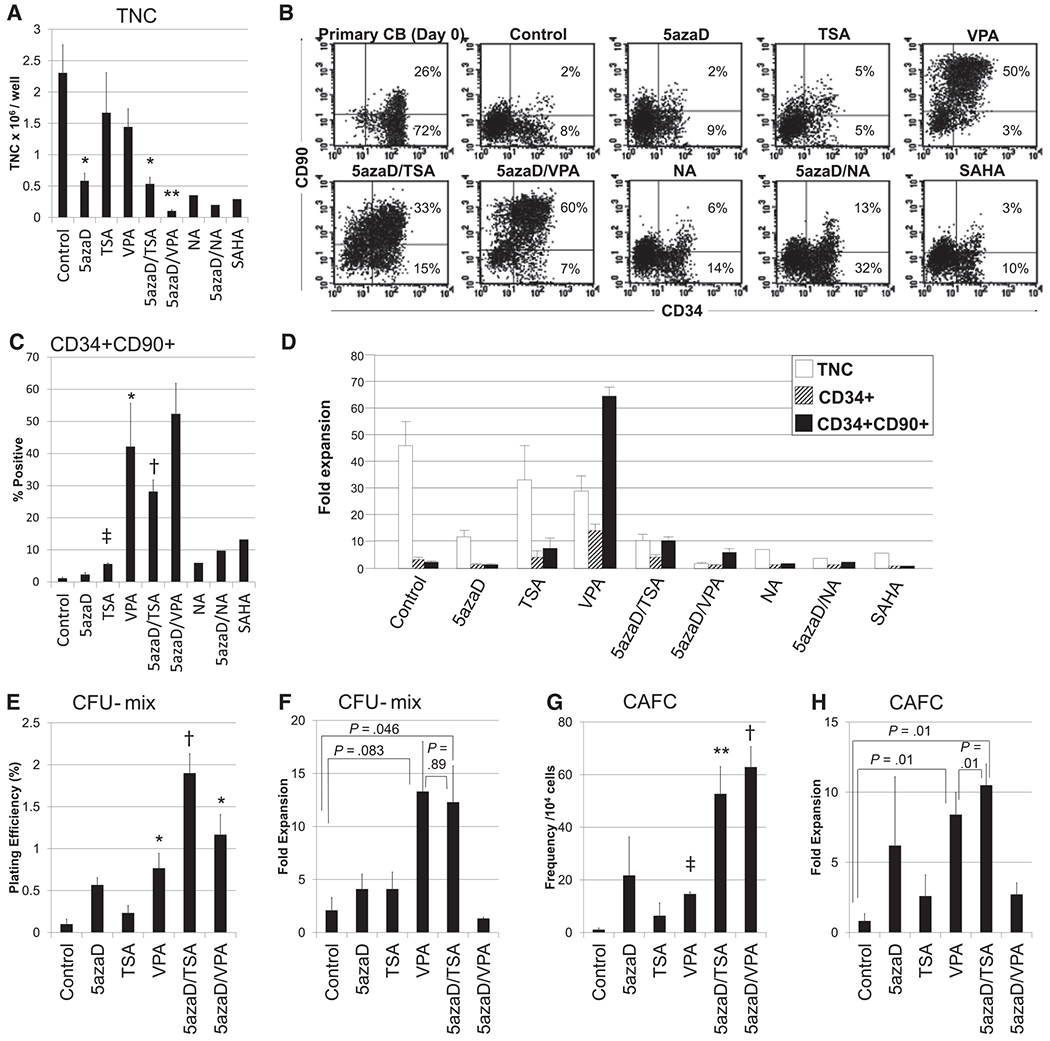
Effects of various CMAs on the expansion of CB cells after 9 days of culture. (A) The total nucleated cells (TNCs) per well after culture are shown as a bar graph. (B) Representative flow cytometric analysis of CB cells using mAbs for CD34 and CD90 or a matched isotype control. (C) The proportion of CD34+CD90+ cells after culture. The proportion of CD34+CD90+ cells in NA-, 5azaD/NA-, and SAHA-treated cultures are representative of 2 experiments, whereas all other CMAs tested are representative of 3 independent experiments. (D) The fold expansion of TNCs, CD34þ cells, and CD34+CD90+ cells was determined by dividing the total number of viable cells expressing the phenotype at the end of the culture by the input number of viable cells expressing the same phenotype. For example, in the present study, the expansion culture was initiated with 50,000 CD34+ cells (TNCs) with 1.4 × 10⁴ CD34+CD90+ cells per well (day 0). The addition of 5azaD/TSA in the culture yielded 0.53 × 10⁶ TNCs per well with 28.17% CD34+CD90+ cells, which represents a 10.7-fold expansion of CD34+CD90+ cells after 9 days. However, in the absence of 5azaD/TSA (cytokine alone), the culture yielded 2.3 × 10⁶ TNCs per well with only 1.17% cells expressing CD34+CD90+, resulting in 2.7 × 10⁴ CD34+CD90+ cells per well, which is a mere 1.9-fold expansion. The bar graph represents the mean ± SE of 3 independent experiments, except for NA, 5azaD/NA, and SAHA, which represent the mean of 2 independent experiments. The cytokines included 100 ng/mL recombinant stem cell factor (SCF), 100 ng/mL FLT3 ligand (FL), 100 ng/mL thrombopoietin (TPO), and 50 ng/mL IL-3 during the first 48 hours. At 48 hours, fresh medium containing 30% FBS and identical cytokine concentrations were added; IL-3 was omitted. All cytokines were purchased from Cell Genix USA (Antioch, IL). (E-H) The in vitro functional potential of CMA-expanded CB cells was determined by CFC and CAFC assays. (E) The PE and the fold (F) expansion of primitive CFU-mix colonies and the frequency (G) and fold (H) expansion of CAFCs from their initial number (before culture) after ex vivo expansion of CD34+ cells are shown. Data are expressed as the mean ± SE of 3 independent experiments. The fold expansion of CFU-mix colonies and CAFCs were determined by dividing the absolute number of CFU-mix colonies and CAFCs assayed from the culture product (day 9) by the absolute number of CFU-mix/CAFCs assayed from the input primary uncultured CD34+ cells (day 0). The CAFC frequency was calculated by the minimization of a chi regression using limiting dilution analyses with 95% statistical precision with L-Calc software (Stem Cell Technologies) as described previously [3,24,25]. P was calculated by Student’s T Test and is relative to Cytokines Alone. * P ≤ .05 ** P ≤ .01 † P ≤ .005 ‡ P ≤ .001.
Significant differences in the expansion of CD34+CD90+ cells were observed between cultures treated with various CMAs (Figure 1D). The addition of VPA resulted in a much higher expansion (64.6 ± 3.7-fold; P = .001; Figure 1D). However, when VPA was added after 5azaD to the culture (5azaD/VPA), the expansion of CD34+CD90+ cells decreased significantly (6.4 ± 1.3-fold), despite having the highest percentage of CD34+CD90+ cells (Figure 1C). VPA treatment alone provided the maximal expansion of CD34+CD90+ cells (Figure 1D). Notably, NA (2.1-fold) and SAHA (1.2-fold) as single agents or in combination with 5azaD (5azaD/NA [2.2-fold]) did not promote the expansion of CD34+CD90+ cells relative to 5azaD/TSA or VPA-expanded CB cells.
These data indicate that among the CMAs examined, VPA and 5azaD/TSA best expand CD34+CD90+ cells. We previously demonstrated that CD34+CD90+ cells exclusively retain in vivo hematopoietic repopulation potential [16], but the repopulation capacity of VPA- or 5azaD/VPA-expanded cells is not known.
Functional Potency of CMA-Expanded CB Grafts
To determine the correlation between the expansion of CD34+CD90+ cells and their in vitro functional potential, CFC and CAFC assays were performed using CB cells that were expanded using various CMAs. Figure 1E depicts the plating efficiency (PE) of primitive colony-forming unit (CFU)-mix colonies derived from expanded CB cells in the presence of various CMAs. The PE (%) of the CFU-mix colonies derived from VPA- and 5azaD/TSA- expanded cells was 0.77 % ± 0.18 % and 1.9 % ± 0.23%, respectively, whereas the PE of the CFU-mix colonies derived from cells expanded in the absence of CMA was only 0.1% ± 0.06% (Figure 1E).
CB cells expanded in the presence of 5azaD/TSA or 5azaD/VPA displayed the highest PE for CFU-mix colonies. However, the total nucleated cell output of each culture condition was significantly different. Although 5azaD/VPA-expanded cells had the highest PE, the expansion of CFU-mix colonies after culture was the lowest (Figure 1F). Cultures receiving VPA or 5azaD/TSA had the highest degree of expansion of primitive CFU-mix colonies (13.3 ± 4.7 and 12.4 ± 3.4-fold, respectively), as shown in Figure 1F. The frequency of the more primitive long-term in vitro hematopoietic progenitors, CAFCs, in 5azaD/TSA-expanded cells was approximately 4-fold greater than that in VPA-expanded cells (52.7 ± 10.37 versus 14.67 ± 0.74, Figure 1G).
The CAFC frequency of CB cells expanded in the absence of CMA (control) was 1.1 ± 0.64, and the CAFC frequency of 5azaD/VPA-expanded cells was 62.9 ± 7.8 per 10,000 cells plated. When we determined the absolute number of CAFCs, VPA- and 5azaD/TSA-expanded cultures had the highest degree of CAFC expansion (8.4 ± 1.6-fold and 10.5 ± 1.5-fold, respectively; Figure 1H). VPA-expanded cultures contained 6-fold more CD34+CD90+ cells than 5azaD/TSA; therefore, these cultures would be expected to be more enriched in CFCs and CAFCs. However, despite the greater number of CD34+CD90+ cells, the expansion of CFU-mix colonies and CAFCs derived from VPA were at best comparable with that of the 5azaD/TSA cultures (Figure 1D, F, and H). Our data indicate that the expansion of CD34+CD90+ cells after 5azaD/TSA but not VPA treatment correlates with their functional potential as demonstrated by the expansion of both CFCs and CAFCs.
VPA Maintains Transplantable HSCs in Culture
NOD/SCID mice were transplanted with primary uncultured CD34+ cells or the product of an equivalent starting number of CD34+ cells after expansion with cytokines alone, 5azaD/TSA, VPA, or 5azaD/VPA. After transplantation, 5 mice receiving cells from cultures containing only cytokines and 6 mice receiving cells from cultures treated with cytokines and 5azaD/VPA were devoid of human hematopoietic cell chimerism (Table 1). By contrast, all 7 mice receiving grafts from cultures expanded with 5azaD/TSA showed evidence of human multilineage hematopoietic engraftment (Table 1). The cells from cultures expanded with cytokines and VPA were capable of human hematopoietic engraftment in 2 of 7 mice, with a minimally detectable level of chimerism (Table 1). Primary CD34+ cells or CD34+ cells expanded with 5azaD/TSA and VPA retained their ability to differentiate into both myeloid and lymphoid lineages after transplantation (data not shown).
Table 1.
Hematopoietic Reconstitution Potential of Various CMA-Expanded CB Cells in NOD/SCID Mice
| No. of NOD/SCID Mice Engrafted/No. Transplanted | Human CD45+ Cells | |
|---|---|---|
| Primary CB (day 0) | 2/5 | 0.15%, 0.3% |
| Cytokines alone (day 9) | 0/5 | NA |
| Cytokines + 5azaD/TSA (day 9) | 5/5 | 0.2%, 0.47%, 4%, 15%, 18% |
| Cytokines + VPA (day 9) | 2/7 | 0.11%, 0.14% |
| Cytokines + 5azaD/VPA (day 9) | 0/6 | NA |
NA indicates not available.
NOD/SCID mice were transplanted with CD34+-enriched primary uncultured cells containing 10,000 CD34+CD90+ cells or the progeny of 10,000 CD34+CD90+ cells after expansion culture were injected per mouse i.v. using the tail vein as described previously [3]. Because the number of CD34+CD90+ cells injected was relatively low, the degree of chimerism is also expected to be low, as described previously [3]. The percentage of human CD45+ cells indicates the percent of human hematopoietic cells present in the bone marrow of each mouse at 8 weeks after transplantation. The specificity of the human mAb allows the detection of human blood cells with a cut-off value >0.1% by flow cytometry, as described previously [3].
Independently, the SCID mouse repopulating cell (SRC) frequency was determined by transplanting uncultured or CMA-expanded cells in a limiting dilution as described previously [3]. The frequency of SRCs was 1 in 22,000 in primary uncultured CD34+CD90+ cells and 1 in 21,720 in VPA-expanded CD34+CD90+ cells (Table 2). Cultures containing only cytokines displayed an SRC frequency of 1 in 123,315. 5azaD/TSA-expanded cultures had an SRC frequency of 1 in 3,147 CD34+CD90+ cells, which is a 7-fold expansion of the absolute number of SRCs in comparison with the input CD34+CD90+ cells. By contrast, although VPA treatment prevented the loss of SRCs, it merely maintained SRC numbers during ex vivo culture despite lacking any detectable bone marrow homing defects (data not shown).
Table 2.
Frequency of SCID Mouse Repopulating Cells (SRCs) in Uncultured Primary or CMA-Expanded CB Cells
| CD34+CD90+ Cells or Its Expanded Products Injected/Mouse | No. of NOD/SCID Mice Engrafted/No. Transplanted |
|||
|---|---|---|---|---|
| Day 0 | Day 9 Cytokines Alone | Day 9 Cytokines + 5azaD/TSA | Day 9 Cytokines + VPA | |
| 1000 | ND | ND | 0/3 | ND |
| 2000 | 0/6 | ND | 2/4 | 0/7 |
| 5000 | 3/8 | ND | 4/5 | 2/5 |
| 10,000 | 2/5 | 0/5 | 5/5 | 2/7 |
| 20,000 | 3/5 | 0/3 | 5/5 | 5/8 |
| 50,000 | 4/5 | 2/5 | ND | ND |
| 100,000 | ND | 2/3 | ND | ND |
| SRC frequency | 1 in 22,000 (95% CI, 1/11,722 to 1/41,293) | 1 in 123,315* (95% CI, 1/46,617 to 1/326,200) | 1 in 3147* (95% CI, 1/1602 to 1/6189) | 1 in 21,720 (95% CI, 1/11,160 to 1/42,269) |
ND indicates not detectable; CI, confidence interval.
NOD/SCID mice (n = 94) were transplanted with increasing doses of CD34+CD90+ cells estimated to be present in the purified uncultured CD34+ cell fraction or the expanded products of 5azaD/TSA- or VPA-expanded CD34+ cell cultures initiated with the same initial number of CD34+CD90+ cells. The data from 7 independent limiting dilution experiments using CD34+ cells from single CB units (CB units were not pooled) were pooled. The data from the limiting dilution experiments were calculated using the single-hit Poisson model, and a maximum likelihood estimator was used to determine the SRC frequency as described previously [3]. The specificity of the human mAb allows the detection of human blood cells with a cut-off value >0.1%, as described previously [3].
The SRC frequency was determined at identical time points using the same starting material and experimental conditions, but some data were previously published (reprinted with permission [3]).
The serial transplantation of unfractionated bone marrow cells from recipients engrafted with uncultured CD34+ cells resulted in hematopoietic engraftment in 2 of 5 mice. By contrast, primary recipients engrafted with an equivalent input number of CD34+CD90+ cells expanded with VPA did exhibit engraftment in any of the 5 secondary hosts (Table 3). Using identical culture conditions and the same number of transplanted cells, we previously demonstrated that 5azaD/TSA-expanded CB cells retain serial transplant ability [18]. These results indicate that unlike 5azaD/TSA, VPA-expanded cells likely expand short-term HSCs.
Table 3.
Serial Transplant Capacities of VPA-Expanded CB Cells in Contrast to Uncultured Primary CB Grafts
| Graft | Primary Transplants* |
Secondary Transplants† |
|
|---|---|---|---|
| Primary Mouse BM Chimerism (% human) | Secondary Mouse BM Chimerism (% human) | ||
| 1 | Primary CB | 15.1 | ND |
| 2 | Primary CB | 29.6 | 10.5 |
| 3 | Primary CB | 16.3 | 0.11% |
| 4 | Primary CB | 48.5 | ND |
| 5 | Primary CB | 25.3 | ND |
| 6 | VPA expanded | 0.60% | ND |
| 7 | VPA expanded | 1.0 | ND |
| 8 | VPA expanded | 0.30% | ND |
| 9 | VPA expanded | 5.6 | ND |
| 10 | VPA expanded | 1.0 | ND |
BM indicates bone marrow; ND, not detectable.
Both primary and secondary hosts for the serial transplant studies received a single i.p. injection (200 μg per mouse) of TM-β1 (BD Biosciences PharMingen, San Diego, CA) within 4 hours after total body irradiation (300 cGy) to eliminate the residual natural killer cell activity of the mice, as described previously [18]. For secondary transplantation, two thirds of the unfractionated BM of each primary mouse, which exhibited multilineage human hematopoietic engraftment after transplantation, were injected into secondary recipients without further enrichment of human cells as described previously [18]. The specificity of the human mAb allows the detection of human blood cells with a cut-off value >0.1%, as described previously [3].
1 × 10⁴ primary uncultured CD34+CD90+ cells or an equal initial number of CD34+CD90+ cells expanded with VPA and cytokines for 9 days were injected into sublethally irradiated primary NOD/SCID mice.
10 to 30 × 106 unseparated BM cells from primary engrafting mice were injected into sublethally irradiated secondary NOD/SCID recipients, which were killed 7 weeks later.
Gene Expression, DNA Methylation, and Histone Acetylation in Expanded CB Cells
Because the proportion of CD34+ cells expanded in the presence or absence of 5azaD/TSA in the culture is significantly different (36.7% ± 4.4% versus 7.0% ± 0.4%), in the current study, we reisolated CD34+ cells after culture for qPCR studies to avoid the influence of relatively mature CD34− cells. As shown in Figure 2A, treatment with 5azaD/TSA or VPA resulted in an increase in the expression levels of several genes, including GATA2, HoxB4, Bmi1, and Ezh2. The expression of differentiation-associated genes, including GATA1, may be due to the activation of gene expression. The transcript levels of the CDK inhibitor p21 were increased in 5azaD/TSA- and VPA-expanded CD34+ cells. Reduced p21 levels are generally associated with a shorter G1/S transition. The expression levels of genes generally implicated in HSC self-renewal, including Ezh2, HoxB4, and Bmi1, were not significantly different in 5azaD/TSA-treated cells, and enriched reisolated CD34+ cells expanded with VPA (Figure 2A).
Figure 2.
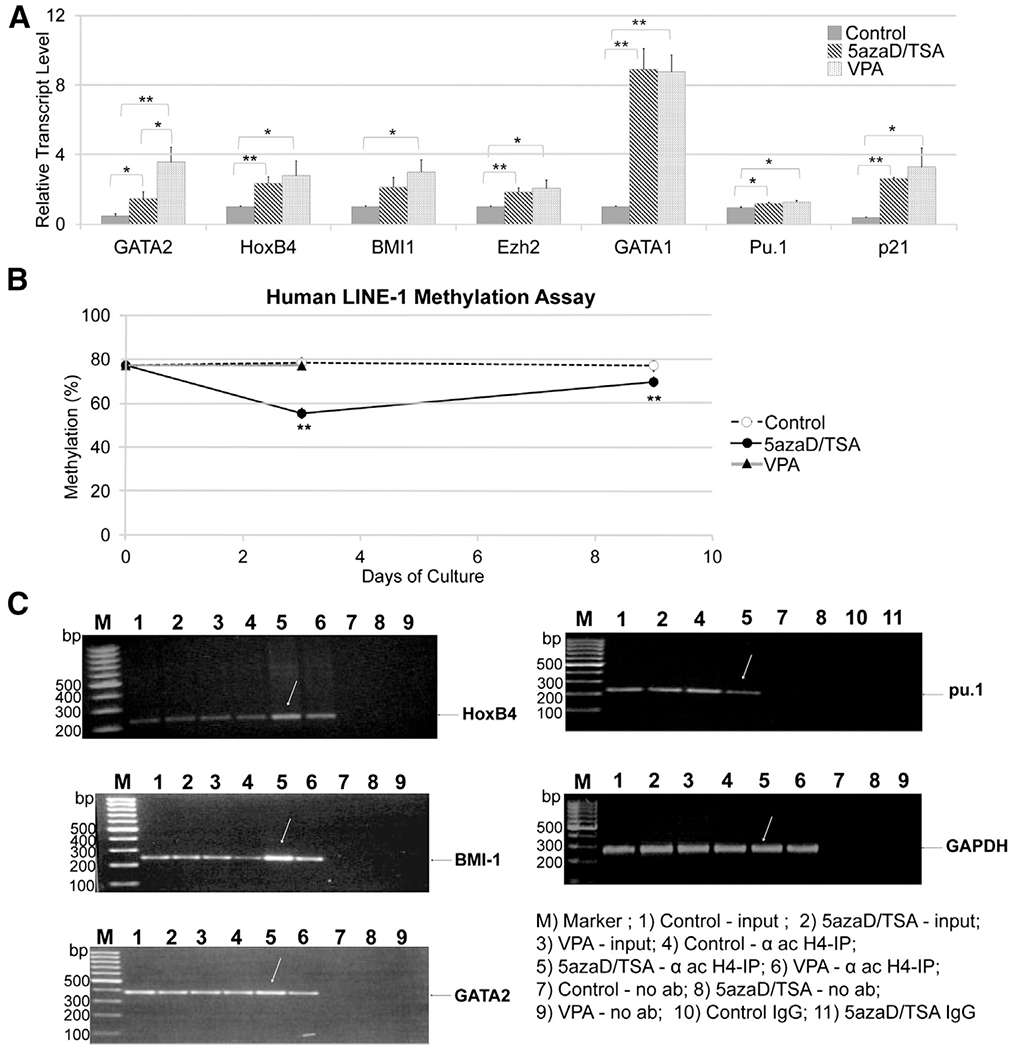
Gene expression, DNA methylation, and histone acetylation in CMA-expanded CD34+ cells. (A) Gene transcript levels were examined in reisolated CD34+ enriched cells after expansion culture (day 9) in the presence of 5azaD/TSA, VPA, or a control. TRIzol (Invitrogen, Carlsbad, CA) was used to extract total RNA from CD34+ cells or CD34+ cells enriched after expansion culture as described previously [18]. To quantitate the transcribed levels of various genes in CD34+ cells, we performed PCR amplification using an ABI 7500 Fast Detector (Life Technologies) using standard PCR cycling conditions. A standard curve method was used for relative mRNA quantification, and all results for gene expression were normalized to the expression of GAPDH as an internal calibrator. The difference in transcript levels between control and either 5azaD/TSA- or VPA-expanded CD34+ cells was statistically significant for all genes tested, except S100A8 (control versus VPA P = .09). However, the difference in transcript levels between 5azaD/TSA- and VPA-expanded CD34+ cells was not statistically significant, except for GATA2 (P = .03). All data presented here represent the mean ± SE of 3 independent experiments, except for p21, which represents the mean ± SE of 2 independent experiments. (B) A LINE-1 assay showing global methylation levels in repetitive DNA elements using bisulfite-treated genomic DNA from enriched CD34+ cells. LINE-1 methylation was expressed as the mean ± SE of % methylation for 4 CpG sites using genomic DNA from primary or CMA-expanded reisolated CD34+ cells from 2 replicate experiments (D0 and D3) or 1 experiment (D9). LINE-1 element PCR was used to perform a pyrosequencing-based methylation analysis as described previously [33]. The degree of methylation was expressed for each DNA locus as the percentage of methylated cytosines over the sum of methylated and unmethylated cytosines. For example, the percentage of methylation for LINE-1 fragments or individual genes was analyzed as an artificial cytosine (C)/thymine (T) SNP, in which C represents methylated C and T represents unmethylated C. The ratio of the C peak to (C+T) is expressed as the percentage of methylation. Methylation (%) data were expressed as the mean ± SE of 4 CpG sites for the LINE-1 assays. Non-CpG cytosines were used as an internal quality control (QC) for bisulfate conversion, and the average values of multiple CpG sites were used for statistical analysis. **P < .005 relative to the prior time point. (C) Chromatin immunoprecipitation assays showing histone H4 acetylation levels in chromatin prepared from CD34+ cells expanded in 5azaD/TSA, VPA, or control cultures. Chromatin was immunoprecipitated using an anti-acetylated histone H4 antibody, and chromatin-bound DNA was PCR amplified using promoter-specific primers. GAPDH was used as an internal control. No-antibody and matched-isotype controls were included as negative controls, and input chromatin was included as a positive control. The precipitated chromatin-bound DNA was PCR amplified using the primers for specific genes as shown in Supplementary Table 2. The amplified PCR fragments were then analyzed on a 1.2% agarose gel. P was calculated by Student’s T Test and is relative to Cytokines Alone. * P ≤ .05 ** P ≤ .01 † P ≤ .005 ‡ P ≤ .001.
We quantified the global methylation of genomic DNA in uncultured and culture-expanded, enriched CD34+ cells using an assay for LINE-1 methylation, which is a surrogate marker of genome-wide global methylation [29]. Interestingly, LINE-1 studies of 5azaD/TSA-expanded CD34+ cells indicated the transient hypomethylation of DNA because the methylation levels returned to pretreatment levels after culture (Figure 2B) and corresponded with the recovery of DNA methyltransferase 1 transcript and protein levels (data not shown) [30]. Moreover, for some genes, the increase in transcript levels correlated with histone H4 acetylation, as determined by chromatin immunoprecipitation assays (Figure 2C). Increased histone H4 acetylation in the promoter regions of the HoxB4, Bmi1, and GATA2 genes corresponded with their increased expression in 5azaD/TSA-expanded CD34+ cells compared with control cultures. Notably, VPA-expanded CD34+ cells exhibited intermediate levels of histone H4 acetylation of the Bmi1 and HoxB4 genes compared with control and 5azaD/TSA cultures.
Identification of Putative HSC Expansion and Maintenance Genes
Global gene expression in expanded CD34+ cells was analyzed to identify distinct sets of genes linked with the following in vivo hematopoietic repopulation functions: expansion (5azaD/TSA), maintenance (VPA), or loss (control), as demonstrated by xeno-transplantation assays. We used expanded, enriched CD34+ cell populations after culture with different CMA treatments in comparison with uncultured CD34+ cells for the microarray studies. A heat map was generated by analyzing the differential gene expression of primary (day 0) or expanded CD34+ cells from 5 different CD34+ cell populations. As shown in Figure 3A, 88 differentially expressed genes passed with a correlation coefficient, r, of 0.85, indicating a high level of correlation between the expression pattern of these genes and hematopoietic reconstitution capacity. Furthermore, principal component analysis of these 88 genes also revealed that the CD34+ cells with and without hematopoietic reconstitution capacity each are clustered together into distinct groups (Figure 3B).
Figure 3.
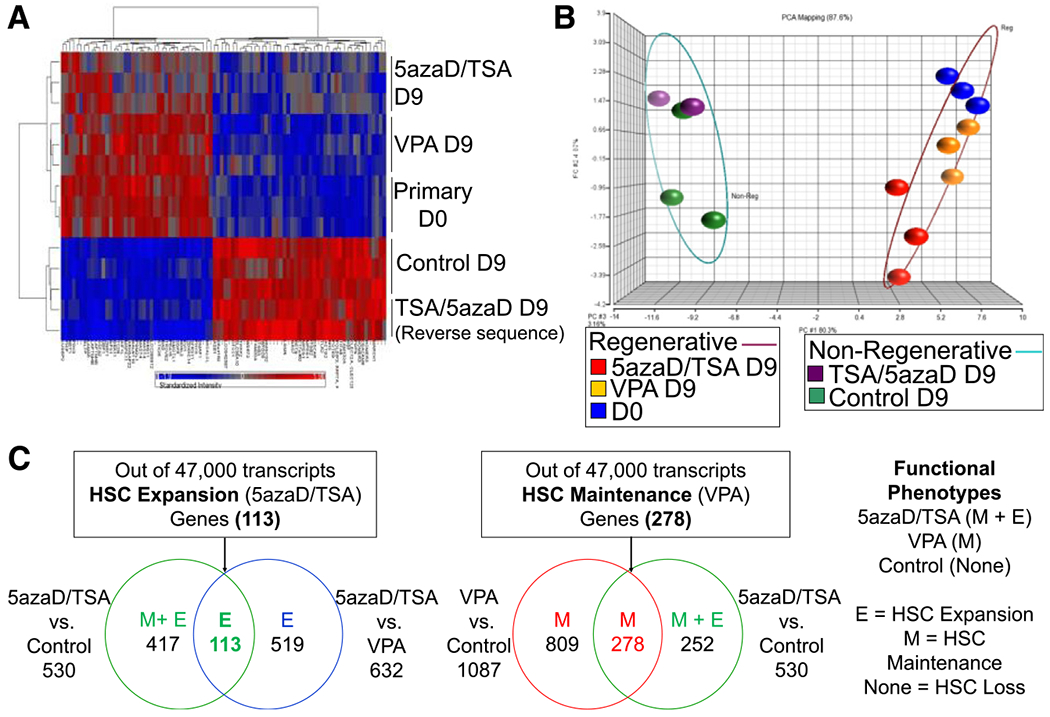
Identification of the gene expression profile of enriched CD34+ cells expanded in 5azaD/TSA, VPA, or control cultures linked with in vivo hematopoietic reconstitution function using global microarray analyses. Here, the expanded CD34+ cells used for microarray studies were also defined by their functional capacity from xeno-transplant studies using immunodeficient mice. For example, CD34+ cells expanded in 5azaD/TSA and VPA presumably represent the expansion and maintenance of in vivo repopulating HSCs, respectively, as shown by SRC frequency analyses (see Table 2). (A) Heat map showing genes whose differential expression correlates with the in vivo hematopoietic reconstitution capacity of expanded/unmanipulated CD34+ cells. Primary uncultured and 5azaD/TSA- or VPA-expanded reisolated CD34+ cell populations that possess in vivo hematopoietic reconstitution potential were arbitrarily assigned a regenerative capacity value of 2, whereas nonregenerative (lacking hematopoietic reconstitution capacity) samples (D9 control and D9 TSA/5azaD reverse CMA sequence) were assigned a value of 0 (0.01). Using this analysis, 88 genes displayed an r > 0.85, indicating a high correlation between gene expression and regenerative capacity. (B) Principal component analysis of the 88 genes shown in the heat map analysis was used to perform principal component analysis mapping of primary or ex vivo expanded enriched CD34+ cells linked with hematopoietic regenerative capacity. (C) Identification of common genes based on their differential expression in expanded CD34+ cells from 5azaD/TSA, VPA, and control cultures. Using this strategy, 113 HSC expansion genes that were differentially expressed between 5azaD/TSA versus control and 5azaD/TSA versus VPA were identified. Similarly, 278 HSC maintenance genes were identified that were differentially expressed between 5azaD/TSA versus control and VPA versus control cultured CD34+ cells.
The above findings demonstrate a correlation between hematopoietic reconstitution function and gene expression. This result led us to hypothesize that putative HSC maintenance- and expansion-related candidate genes could be identified by pairing differential expression with the in vivo hematopoietic reconstitution function of the test cell populations. Considering the limitations of using a rare cell population for microarray analysis, we used CD34+ CB cells, which are commonly used for microarray studies [6,31–33]. We postulated that 113 common differentially expressed genes identified between 5azaD/TSA-expanded CD34+ cells versus control cells and 5azaD/TSA- versus VPA-expanded CD34+ cells were related to HSC expansion (Figure 3C). Similarly, 278 common genes presumably related to HSC maintenance (VPA) were identified as differentially expressed between the pairs 5azaD/TSA-expanded versus control and VPA-expanded versus control CD34+ cells (Figure 3C).
Intriguingly, ingenuity pathway analysis linked 113 HSC “expansion” genes (Supplementary Table 4) with molecules involved in inflammation and lipid metabolism, distinct from the 278 HSC “maintenance” genes (Supplemental Table 5). We validated the transcript levels of several genes selected from the HSC expansion and maintenance gene sets using real-time qPCR (Figure 4A,B). The thrombin receptor F2RL2 gene transcript was represented in both the HSC expansion and HSC maintenance gene lists. However, our PCR validation data indicated that F2RL2 is differentially expressed in CD34+ cells expanded with 5azaD/TSA or VPA (Figure 4B). Similarly, Cyp11A1 is not in the putative HSC maintenance group, consistent with our PCR validation, which demonstrated lower transcript levels in VPA-expanded CD34+ cells than in 5azaD/TSA-expanded CD34+ cells (Figure 4A). Differentially expressed genes representative of the HSC expansion list included the calcium-binding protein S100A8, whereas those representatives of the HSC maintenance list included Alox5, a gene involved in arachidonic acid metabolism and the production of leukotrienes. Both genes function as inflammatory mediators, and their transcript levels were increased in 5azaD/TSA- as well as in VPA-expanded CD34+ cells compared with controls. The higher expression of Alox5, ALDH1A1, and BMPR1A in VPA-expanded CD34+ cells is also consistent with our microarray results because these genes are some of the 278 HSC maintenance-related genes.
Figure 4.
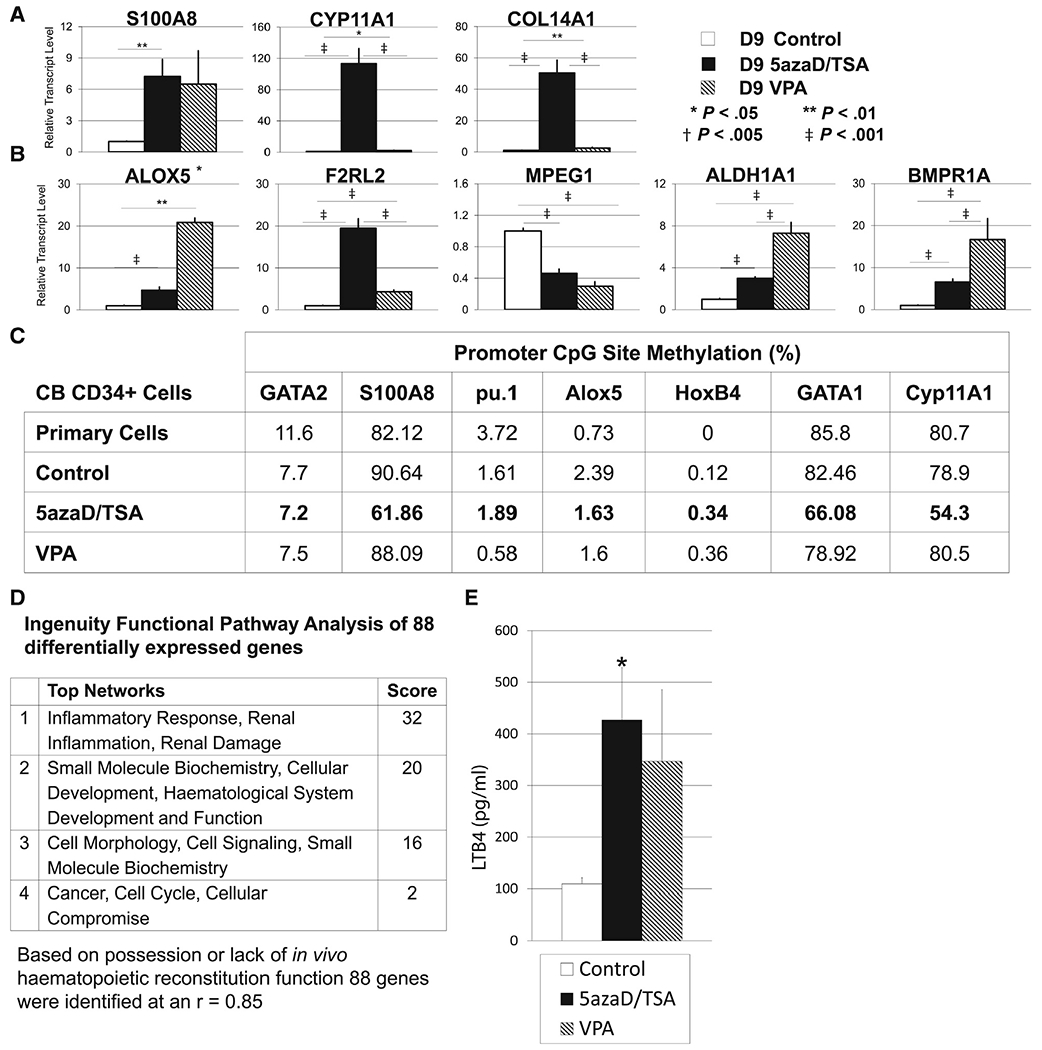
Validation of genes represented in putative HSC expansion or maintenance groups. (A) Validation by qPCR of genes identified by global microarray that are presumably associated with HSC expansion or (B) maintenance. The mean ± SE of 3 independent experiments is shown. (C) The methylation levels of the promoter CpG sites of several genes that were differentially expressed between the putative HSC expansion and HSC maintenance groups were analyzed by pyrosequencing. Primary uncultured CD34+ cells (day 0) and reisolated enriched CD34+ cells expanded in 5azaD/TSA (day 3) or VPA (day 3) were used to obtain genomic DNA, which was bisulfite treated and used to measure methylation levels. Data are displayed as the mean % ± SE of 3 to 11 CpG sites near the promoter area of each gene from 2 independent samples, except pu.1 (6 CpG) and Cyp11A1 (5 CpG), for which only 1 sample was analyzed. (D) Ingenuity pathway analysis revealed the top signaling networks among the 88 differentially expressed genes based on the presence or absence of in vivo hematopoietic regeneration capacity. (E) The concentration of leukotriene B4 (LTB4), an inflammatory mediator, in conditioned medium from CB cells expanded in the presence or absence of CMA was measured by an acetylcholinesterase competitive ELISA. Data are expressed as the mean ± SE of triplicate wells from 3 independent experiments (*P < .05 relative to control).
Epigenetics Exerts Both Direct and Indirect Effects
We quantified the methylation of CpG sites in the promoters of specific genes by pyrosequencing. Genes implicated in HSC self-renewal, including HoxB4 and GATA2, almost completely lacked methylation, even though their transcript levels increased after CMA treatment in culture (Figure 4C). Interestingly, genes with a role in hematopoiesis, including GATA1, were methylated in uncultured CD34+ cells and control cultures, whereas 5azaD/TSA treatment resulted in significant demethylation, which corresponded with their relatively higher transcript levels (Figure 4C). Although VPA resulted in minimal demethylation of the GATA1 gene after culture (Figure 4C), increased GATA1 transcript levels were also observed, indicating a possible indirect effect (Figure 2A).
Finally, the transcript levels of several genes not known for their role in hematopoiesis were not only increased after CMA treatment in culture but were exclusively associated with the HSC expansion gene list from the microarray analyses (113 genes; eg, S100A8). Consistently, 5azaD/TSA-expanded CD34+ cells displayed a significant reduction in the methylation levels of the S100A8 and Cyp11A1 gene promoter sites (Figure 4C). Cyp11A1 gene transcript levels were also significantly higher in 5azaD/TSA-expanded CD34+ cells compared with CD34+ cells expanded with VPA or control cultures (5azaD/TSA versus control, P < .001; 5azaD/TSA versus VPA, P < .001). VPA-expanded CD34+ cells almost completely lacked any changes in the methylation of the S100A8 gene promoter sites, despite increased transcript levels. Similarly, although the transcript level of Alox5 in 5azaD/TSA-expanded CD34+ cells was increased, Alox5 also lacked detectable changes in methylation.
In addition, an ingenuity pathway analysis of the 88 genes identified from heat map analyses of the CD34+ cell populations possessing or lacking hematopoietic reconstitution capacity (Figure 3A) revealed inflammation as a top network (Figure 4D, Supplementary Tables 6.1 and 6.2.). Interestingly, an ELISA assay revealed that the level of the inflammatory mediator leukotriene B4 was increased in the conditioned medium from the expansion of CD34+ cells with 5azaD/TSA and VPA compared with conditioned medium from control cells (Figure 4E). Leukotriene B4 is synthesized from arachidonic acid by the dual action of the Alox5 gene product, 5-lipoxygenase, and LTA4 hydrolase. Both microarray analyses and qPCR validation data indicated that the Alox5 transcript levels were relatively higher in CD34+ cells expanded with VPA than those expanded with 5azaD/TSA.
DISCUSSION
The present study demonstrates that epigenetics plays a role in silencing genes that are likely involved in the regulation of HSC maintenance and expansion in culture. We demonstrate that this process can be circumvented by the use of CMAs in culture, which activate genes by direct or indirect mechanisms, resulting in distinct HSC fate choices, expansion or maintenance. Our transplant studies demonstrate that although sequential ex vivo treatment of CD34+ cells with 5azaD/TSA expands transplantable HSCs that possess serial transplant capacity [18], VPA treatment only permits the maintenance of HSCs that lack serial transplant ability. Although further investigations will be required, our strategies will likely provide a solution to generate a composite graft containing augmented numbers of both short-term hematopoietic stem/progenitors and long-term HSCs expanded by VPA and 5azaD/TSA, respectively.
Curiously, SAHA and NA in culture displayed poor cell survival. In particular, when VPA was added after 5azaD, this combination was detrimental to CD34+CD90+ cell expansion in culture, and these cells failed to display hematopoietic reconstitution capacity after transplantation. Because many of these agents are being used in cancer treatment, the role of CMA in normal HSC viability as well as their potential use in cancer therapeutics may have important implications. Because CB cells expanded in the absence of a CMA display decreased marrow repopulating potential, we hypothesize that CMAs act by preventing the down-regulation of genes crucial for the retention of HSC function during culture by promoter hypomethylation. 5azaD/TSA-expanded cells displayed a 7-fold increase in SRCs compared with VPA-expanded cultures, despite having 6-fold fewer CD34+CD90+ cells. We previously demonstrated that after 5azaD/TSA treatment in culture, repopulating HSCs reside exclusively within the CD34+CD90+ cell population [3]. However, most VPA-expanded CD34+CD90+ cells were devoid of SRC, CAFC, and, to some extent, CFC capability. This discordance between the phenotype and function of VPA-expanded cells and, more importantly, the increase in the absolute number of SRCs mediated by 5azaD/TSA but not VPA has not been described previously. Although the regulation of cellular differentiation based on HDAC isoform selectivity remains to be fully elucidated [34], whether 5azaD/TSA and VPA inhibit distinct HDAC isoforms, resulting in the survival and proliferation of long-term and short-term HSCs, respectively, will be the focus of future studies.
Furthermore, the gene expression pattern in expanded CD34+ cells results at least in part from epigenetic modifications that include changes in promoter CpG site methylation and histone acetylation. Differential gene expression from our global microarray studies revealed distinct gene expression patterns associated with functional HSC expansion or maintenance. Indeed, the addition of CMAs to the culture was associated with increased transcript levels of polycomb group genes including Ezh2 and Bmi1, which are known to regulate HSC self-renewal [18,35–37]. Using a candidate gene approach, we were unable to discern differences in the expression levels of HSC self-renewal genes between CD34+ cells expanded in 5azaD/TSA and VPA. Alternatively, variations in the composition of subtypes of cells within CD34+ populations may have masked differences in gene expression.
Our studies indicate that CMAs result in both direct and indirect effects early in culture, which contribute to a transcriptome state that promotes HSC expansion or maintenance. For example, as a direct result of CMA treatment, a significant reduction in methylation levels was detected at the S100A8, Cyp11A1, and GATA1 gene promoter sites, corresponding with their increased transcript levels in CD34+ cells expanded in 5azaD/TSA. Furthermore, heat map analysis highlighted a differential gene expression pattern between CD34+ cells possessing or lacking in vivo marrow repopulation potential. Our data also show that CpG islands near the promoter areas of genes, including HoxB4 and GATA2, do not display significant changes in methylation, suggesting their increased transcript levels in CMA-expanded CD34+ cells are likely due to indirect effects.
We hypothesize that temporal effects, including early epigenetic modifications, lead to changes in transcription factor expression that directly or indirectly promote symmetrical or asymmetrical HSC divisions and ultimately result in HSC expansion or maintenance. The analysis of differential gene expression using global microarray studies, such as those in the present study, may help to identify such gene networks. Identifying a gene expression signature linked with in vivo blood regeneration capacity has significant clinical applications. To expand HSCs, both expansion and maintenance genes are likely necessary. The 19 genes that were shared between the putative HSC expansion- and maintenance-related genes included genes involved in lipid metabolism, such as F2RL2, MPEG1, ALDH1A1, and BMPR1A. These shared genes likely possess dual functions in HSC maintenance and expansion. In future studies, the functional roles of these distinct sets of genes that are presumably involved in HSC maintenance and expansion will need to be tested further.
Expression profiling data indicate that the differential expression of gene transcripts, such as Cyp11A1, Alox5, and F2RL2, may serve as biomarkers that indicate the successful expansion or maintenance of transplantable HSCs. Interestingly, S100A8, which was more highly expressed in CMA-expanded CD34+ cells, has been shown to be a Toll-like receptor 4 agonist [38]. Toll-like receptor 4 expression plays a role in the maintenance and proliferation of endothelial progenitor cells [39]. The transient demethylation of CpG sites corresponding with higher transcript levels of inflammation/stress-associated genes and the increase in inflammatory mediators in CMA-expanded cultures is consistent with a role of these molecules in HSC expansion or maintenance. This idea is consistent with the influence of systemic infection on HSC cycling and the role of interferon as a positive regulator of HSC proliferation [40]. Further studies are needed to determine whether CMAs influence HSC expansion or maintenance by promoting the expression of inflammatory and other stress response pathway genes.
Supplementary Material
ACKNOWLEDGMENTS
We are indebted to Drs. Pablo Rubinstein and Ludy Dobrila of the New York Blood Center, New York, and Dr. John Wingard and Ms. Emma H Rosenau from LifeCord Cord Blood Bank & University of Florida Health Cancer Center, Gainesville, Florida for providing CB units for research. Drs. Anwar Khan and Jong J. Jeong are acknowledged for their assistance with some graphics/figures in the article. We also gratefully acknowledge Dr. Steve Ackerman for helpful suggestions and Dr. Pradip Raychaudhuri for critical reading of the manuscript. We are indebted to Dr. Ronald Hoffman for facilitating the initial part of the work involved in this article. The authors thank Dr. Mirza S. Baig for technical assistance. This work was presented in part in abstract form during the 2010 American Society of Hematology Meeting [20].
Financial disclosure:
This work was supported in part by grants from the Leukemia and Lymphoma Society (White Plains, NY) Translational Research Program and Institutional (Office of the Vice Chancellor for Research) “Areas of Excellence” Award to N.M.
Footnotes
Conflict of interest statement: There are no conflicts of interest to report.
SUPPLEMENTARY DATA
Supplementary data related to this article can be found online at http://dx.doi.org/10.1016/j.bbmt.2013.12.562.
REFERENCES
- 1.Koury M, Mahmud N, Rhodes M. Origin and development of blood cells. In: Greer JP, Foerster J, Rodgers GM, et al. , editors. Wintrobe’s clinical hematology. Philadelphia, PA: Lippincott Williams & Wilkins; 2009. p. 79–105. [Google Scholar]
- 2.Zon LI. Intrinsic and extrinsic control of haematopoietic stem-cell self-renewal. Nature. 2008;453:306–313. [DOI] [PubMed] [Google Scholar]
- 3.Araki H, Baluchamy S, Yoshinaga K, et al. Cord blood stem cell expansion is permissive to epigenetic regulation and environmental cues. Exp Hematol. 2009;37:1084–1095. [DOI] [PMC free article] [PubMed] [Google Scholar]
- 4.Laughlin MJ, Barker J, Bambach B, et al. Hematopoietic engraftment and survival in adult recipients of umbilical-cord blood from unrelated donors. N Engl J Med. 2001;344:1815–1822. [DOI] [PubMed] [Google Scholar]
- 5.Rocha V, Gluckman E. Improving outcomes of cord blood transplantation: HLA matching, cell dose and other graft- and transplantation-related factors. Br J Haematol. 2009;147:262–274. [DOI] [PubMed] [Google Scholar]
- 6.Boitano AE, Wang J, Romeo R, et al. Aryl hydrocarbon receptor antagonists promote the expansion of human hematopoietic stem cells. Science. 2010;329:1345–1348. [DOI] [PMC free article] [PubMed] [Google Scholar]
- 7.Delaney C, Heimfeld S, Brashem-Stein C, et al. Notch-mediated expansion of human cord blood progenitor cells capable of rapid myeloid reconstitution. Nat Med. 2010;16:232–236. [DOI] [PMC free article] [PubMed] [Google Scholar]
- 8.Goessling W, Allen RS, Guan X, et al. Prostaglandin E2 enhances human cord blood stem cell xenotransplants and shows long-term safety in preclinical nonhuman primate transplant models. Cell Stem Cell. 2011;8:445–458. [DOI] [PMC free article] [PubMed] [Google Scholar]
- 9.Himburg HA, Muramoto GG, Daher P, et al. Pleiotrophin regulates the expansion and regeneration of hematopoietic stem cells. Nat Med. 2010;16:475–482. [DOI] [PMC free article] [PubMed] [Google Scholar]
- 10.de Lima M, McNiece I, Robinson SN, et al. Cord-blood engraftment with ex vivo mesenchymal-cell coculture. N Engl J Med.2012;367:2305–2315. [DOI] [PMC free article] [PubMed] [Google Scholar]
- 11.Fiskus W, Wang Y, Sreekumar A, et al. Combined epigenetic therapy with the histone methyltransferase EZH2 inhibitor 3-deazaneplanocin A and the histone deacetylase inhibitor panobinostat against human AML cells. Blood. 2009;114:2733–2743. [DOI] [PMC free article] [PubMed] [Google Scholar]
- 12.Jabbour E, Issa JP, Garcia-Manero G, Kantarjian H. Evolution of decitabine development: accomplishments, ongoing investigations, and future strategies. Cancer. 2008;112:2341–2351. [DOI] [PMC free article] [PubMed] [Google Scholar]
- 13.Kuendgen A, Gattermann N. Valproic acid for the treatment of myeloid malignancies. Cancer. 2007;110:943–954. [DOI] [PubMed] [Google Scholar]
- 14.Shi J, Zhao Y, Ishii T, et al. Effects of chromatin-modifying agents on CD34+ cells from patients with idiopathic myelofibrosis. Cancer Res. 2007;67:6417–6424. [DOI] [PubMed] [Google Scholar]
- 15.Wang X, Zhang W, Tripodi J, et al. Sequential treatment of CD34+ cells from patients with primary myelofibrosis with chromatin-modifying agents eliminate JAK2V617F-positive NOD/SCID marrow repopulating cells. Blood. 2010;116:5972–5982. [DOI] [PMC free article] [PubMed] [Google Scholar]
- 16.Araki H, Mahmud N, Milhem M, et al. Expansion of human umbilical cord blood SCID-repopulating cells using chromatin-modifying agents. Exp Hematol. 2006;34:140–149. [DOI] [PubMed] [Google Scholar]
- 17.Mahmud N, Milhem M, Araki H, Hoffman R. Alteration of Hematopoietic Stem Cell Fates by Chromatin-Modifying Agents. In: Ho AD, Hoffman R, Zanjani ED, editors. Stem Cell Transplantation. Germany: Weinheim Wiley-VCH Verlag GmbH & Co. KGaA; 2006. p. 27–42. [Google Scholar]
- 18.Araki H,Yoshinaga K, Boccuni P, et al. Chromatin-modifying agents permit human hematopoietic stem cells to undergo multiple cell divisions while retaining their repopulating potential. Blood. 2007;109:3570–3578. [DOI] [PubMed] [Google Scholar]
- 19.Milhem M, Mahmud N, Lavelle D, et al. Modification of hematopoietic stem cell fate by 5aza 2’deoxycytidine and trichostatin A. Blood. 2004; 103:4102–4110. [DOI] [PubMed] [Google Scholar]
- 20.Araki H, Baluchamy S, Petro B, et al. Valproic acid results in maintenance but not expansion of transplantable hematopoietic stem cells from human umbilical cord blood. Blood. 2010;116:827A. [Google Scholar]
- 21.Bug G, Gül H, Schwarz K, et al. Valproic acid stimulates proliferation and self-renewal of hematopoietic stem cells. Cancer Res. 2005;65: 2537–2541. [DOI] [PubMed] [Google Scholar]
- 22.De Felice L, Tatarelli C, Mascolo MG, et al. Histone deacetylase inhibitor valproic acid enhances the cytokine-induced expansion of human hematopoietic stem cells. Cancer Res. 2005;65:1505–1513. [DOI] [PubMed] [Google Scholar]
- 23.Seet LF, Teng E, Lai YS, et al. Valproic acid enhances the engraftability of human umbilical cord blood hematopoietic stem cells expanded under serum-free conditions. Eur J Haematol. 2009;82:124–132. [DOI] [PubMed] [Google Scholar]
- 24.Conneally E, Cashman J, Petzer A, Eaves C. Expansion in vitro of transplantable human cord blood stem cells demonstrated using a quantitative assay of their lympho-myeloid repopulating activity in nonobese diabetic-scid/scid mice. Proc Natl Acad Sci USA. 1997;94: 9836–9841. [DOI] [PMC free article] [PubMed] [Google Scholar]
- 25.Taswell C Limiting dilution assays for the determination of immuno-competent cell frequencies. I. Data analysis. J Immunol. 1981;126:1614–1619. [PubMed] [Google Scholar]
- 26.Sankar N, Baluchamy S, Kadeppagari RK, et al. p300 provides a core-pressor function by cooperating with YY1 and HDAC3 to repress c-Myc. Oncogene. 2008;27:5717–5728. [DOI] [PubMed] [Google Scholar]
- 27.Reeves ME, Baldwin SW, Baldwin ML, et al. Ras-association domain family 1C protein promotes breast cancer cell migration and attenuates apoptosis. BMC Cancer. 2010;10:562. [DOI] [PMC free article] [PubMed] [Google Scholar]
- 28.Warren L, Manos PD, Ahfeldt T, et al. Highly efficient reprogramming to pluripotency and directed differentiation of human cells with synthetic modified mRNA. Cell Stem Cell. 2010;7:618–630. [DOI] [PMC free article] [PubMed] [Google Scholar]
- 29.Yang AS, Estecio MR, Doshi K, et al. A simple method for estimating global DNA methylation using bisulfite PCR of repetitive DNA elements. Nucleic Acids Res. 2004;32:e38. [DOI] [PMC free article] [PubMed] [Google Scholar]
- 30.Baluchamy SP, Araki H, Lindgren V, Mahmud N. Possible epigenetic regulation of functionally opposing groups of genes involved in ex vivo expansion of cord blood stem cells. Blood. 2008;112:3473A. [Google Scholar]
- 31.Oswald J, Steudel C, Salchert K, et al. Gene-expression profiling of CD34+ hematopoietic cells expanded in a collagen I matrix. Stem Cells. 2006;24:494–500. [DOI] [PubMed] [Google Scholar]
- 32.Pang WW, Price EA, Sahoo D, et al. Human bone marrow hematopoietic stem cells are increased in frequency and myeloid-biased with age. Proc Natl Acad Sci U S A. 2011;108:20012–20017. [DOI] [PMC free article] [PubMed] [Google Scholar]
- 33.Daschkey S, Rottgers S, Giri A, et al. MicroRNAs distinguish cytogenetic subgroups in pediatric AML and contribute to complex regulatory networks in AML-relevant pathways. PLoS One. 2013;8:e56334. [DOI] [PMC free article] [PubMed] [Google Scholar]
- 34.Agata Y, Katakai T, Ye SK, et al. Histone acetylation determines the developmentally regulated accessibility for T cell receptor gamma gene recombination. J Exp Med. 2001;193:873–880. [DOI] [PMC free article] [PubMed] [Google Scholar]
- 35.Iwama A, Oguro H, Negishi M, et al. Enhanced self-renewal of hematopoietic stem cells mediated by the polycomb gene product Bmi-1. Immunity. 2004;21:843–851. [DOI] [PubMed] [Google Scholar]
- 36.Kamminga LM, Bystrykh LV, de Boer A, et al. The Polycomb group gene Ezh2 prevents hematopoietic stem cell exhaustion. Blood. 2006;107:2170–2179. [DOI] [PMC free article] [PubMed] [Google Scholar]
- 37.Rizo A, Olthof S, Han L, et al. Repression of BMI1 in normal and leukemic human CD34(+) cells impairs self-renewal and induces apoptosis. Blood. 2009;114:1498–1505. [DOI] [PubMed] [Google Scholar]
- 38.Ehrchen JM, Sunderkotter C, Foell D, et al. The endogenous Toll-like receptor 4 agonist S100A8/S100A9 (calprotectin) as innate amplifier of infection, autoimmunity, and cancer. J Leuk Biol. 2009;86:557–566. [DOI] [PubMed] [Google Scholar]
- 39.He J, Xiao Z, Chen X, et al. The expression of functional Toll-like receptor 4 is associated with proliferation and maintenance of stem cell phenotype in endothelial progenitor cells (EPCs). J Cell Biochem. 2010; 111:179–186. [DOI] [PubMed] [Google Scholar]
- 40.Baldridge MT, King KY, Boles NC, et al. Quiescent haematopoietic stem cells are activated by IFN-gamma in response to chronic infection. Nature. 2010;465:793–797. [DOI] [PMC free article] [PubMed] [Google Scholar]
Associated Data
This section collects any data citations, data availability statements, or supplementary materials included in this article.