Abstract
Objective:
Cone-beam CT (CBCT) in modern pre-clinical small-animal radiation research platforms provides volumetric images for image guidance and experiment planning purposes. In this work, we implemented multi-energy element-resolved (MEER) CBCT using three scans with different kVps on a SmART platform (Precision X-ray Inc.) to determine images of relative electron density (rED) and elemental composition (EC) that are needed for Monte Carlo-based radiation dose calculation.
Approach:
We performed comprehensive calibration tasks achieve sufficient accuracy for this quantitative imaging purpose. For geometry calibration, we scanned a ball bearing phantom and used an analytical method together with an optimization approach to derive gantry-angle specific geometry parameters. Intensity calibration and correction included the corrections for detector lag, glare, and beam hardening. The corrected CBCT projection images acquired at 30, 40 and 60 kVp in multiple scans were used to reconstruct CBCT images using the Feldkamp-Davis-Kress reconstruction algorithm. After that, an optimization problem was solved to determine images of rED and EC. We demonstrated effectiveness of our CBCT calibration steps by showing improvements in image quality and successful material decomposition in cases with a small animal CT calibration phantom and a plastinated mouse phantom.
Main results:
It was found that artifacts induced by geometry inaccuracy, detector lag, glare and beam hardening were visually reduced. CT number mean errors were reduced from 19% to 5%. In the CT calibration phantom case, median errors in H, O, and Ca fractions for all the inserts were below 1%, 2%, and 4% respectively, and median error in rED was less than 5%. Compared to standard approach deriving material type and rED via CT number conversion, our approach improved Monte Carlo simulation-based dose calculation accuracy in bone regions. Mean dose error was reduced from 47.5% to 10.9%.
Significance:
The MEER-CBCT implemented on an existing CBCT system of a small animal irradiation platform achieved accurate material decomposition and significantly improved Monte Carlo dose calculation accuracy.
1. Introduction
Preclinical small animal irradiation is an integral component of cancer radiation therapy. Over the years, several dedicated image-guided small animal irradiators have been successfully developed that can administer radiation accurately to a targeted area, while minimizing radiation to other regions (Verhaegen et al., 2011). These irradiators are equipped with advanced image guidance tools to allow the imaging of the animal subject at the experimental position to aid the development of an experiment plan and the positioning of the animal against the radiation beam. For example, cone beam CT (CBCT), the currently most widely used image guidance tool in human radiotherapy (Jaffray et al., 2002), has been successfully implemented on the preclinical irradiation platforms. It was found that CBCT can provide soft-tissue imaging at acceptable imaging doses to ensure sub-millimeter geometric and targeting accuracy for radiation delivery (Clarkson et al., 2011).
At our group at the University of Texas Southwestern Medical Center, a SmART preclinical radiation platform (Precision X-ray Inc., North Branford, CT, USA) has been recently installed, as the hardware platform to implement a few new technologies for preclinical radiation research. One of the goals is to enable multi-energy CBCT imaging capability to support material decomposition required by accurate radiation dose calculation for the low-energy kV photon beam, as well as other advanced applications, such as imaging injected agents. For radiation dose calculation under the kV x-ray beam in the preclinical radiation experiment context, it is well known that the radiation dose distribution in this beam energy range is sensitive to the material and density distribution, mainly due to the sensitivity of x-ray attenuation properties of the photoelectric interaction channel. Monte Carlo (MC) simulation is a reliable method for dose calculation because of the faithful modeling of the underlying radiation transport physics and simulation geometry (Alaei et al., 2000). This method requires density and material composition information as input data. Deriving these quantities using a single energy CBCT image encounters the challenge of degeneracy of different materials in CT numbers. Misassignment of tissue type, such as incorrectly assigning material of a tissue voxel to bone at the bone-tissue interface, can lead to up to 3 times dose calculation error (Montanari et al., 2014; Ding and Coffey, 2009; Ding et al., 2010). Employing the energy dimension of CBCT (Kachelrß et al., 2006; Granton et al., 2008; Bazalova et al., 2008) and an innovative material decomposition algorithm (Shen et al., 2018a,b), it is possible to accurately determine tissue type to support MC-based dose calculations. Such a modality is also expected to enhance visualization of high-Z materials, potentially beneficial for novel research topics, such as nano-particle based tumor targeting and sensitization (Hainfeld et al., 2008; Ashton et al., 2015; Berbeco et al., 2012, 2011; Ngwa et al., 2014).
Depending on the hardware setup, dual- or multi-energy CBCT data acquisition can be realized in different ways (McCollough et al., 2015). To realize this function on the existing CBCT platform of the SmART system without hardware modifications, it is straightforward to employ the multiple-scan approach that scans the object a number of times with different kVp levels. In this paper, we report our recent progress achieving the multi-energy element-resolved CBCT (MEER-CBCT) function via this approach and demonstrate the improved dose calculation accuracy under this new CBCT function.
The MEER-CBCT method enables the derivation of images of electron density and elemental compositions by decomposing the CBCT images at different kVp levels. Because this method employed an empirical model relating density and elemental compositions to x-ray attenuation coefficients (Rutherford et al., 1976), accuracy of CBCT images in terms of representing x-ray attenuation properties is essential to achieve satisfactory results. In a previous study, image quality for the CBCT on a previous version of the SmART platform was characterized and evaluated (Clarkson et al., 2011). However, the study mainly focused on the evaluation for the purpose of image guidance, such as regarding image resolution and low-contrast object visualization. When it comes to quantitative applications of CBCT images, such as the one in this study, we found that a proper calibration of the CBCT system is needed. Hence, a major focus of this study was on a comprehensive calibration process of the CBCT imaging system. We extended the previously published analytical method for geometry calibration (Noo et al., 2000) by including an optimization approach to derive gantry-angle specific geometry parameters. As for intensity calibration and correction, it included the steps to mitigate problems due to detector lag, detector glair, and beam hardening effect. We investigated the importance of these calibrations steps and showed that these together meet the requirement to deliver accurate CT image intensity, which serves the basis for the subsequent material decomposition step in MEER-CBCT to support accurate MC-based dose calculations.
2. Methods
2.1. Cone-beam CT platform and overview of the workflow
The SmART preclinical radiation platform consists of a rotating C-arm gantry and a removable animal bed, as shown in Figure 1(a). The C-arm gantry can perform 360° CBCT scanning and radiation delivery with an x-ray tube (Comet iVario 225 kV, JME Ltd, Suffolk, UK) mounted opposite to an amorphous silicon flat-panel detector (FPD) (XRD 0820 AN3-ES, Perkin-Elmer, Wiesbaden, Germany). The rotational speed of the gantry is 0 to 3 revolutions/minute with 6 arc minute repeatability. The x-ray tube is capable of emitting an x-ray beam with energy ranging from 5 to 225 kVp. The FPD has 1024 × 1024 active pixels with a pixel size of 0.2 × 0.2 mm2. The removable carbon fiber animal bed is mounted on an x-y-z stage made from three independent positioning stages with ±2 μm repeatability. Both the gantry and the stage are housed in a self-shielded cabinet. Vendor-provided software is used to control the synchronization of motion, x-ray exposure, and detector readout.
Figure 1.
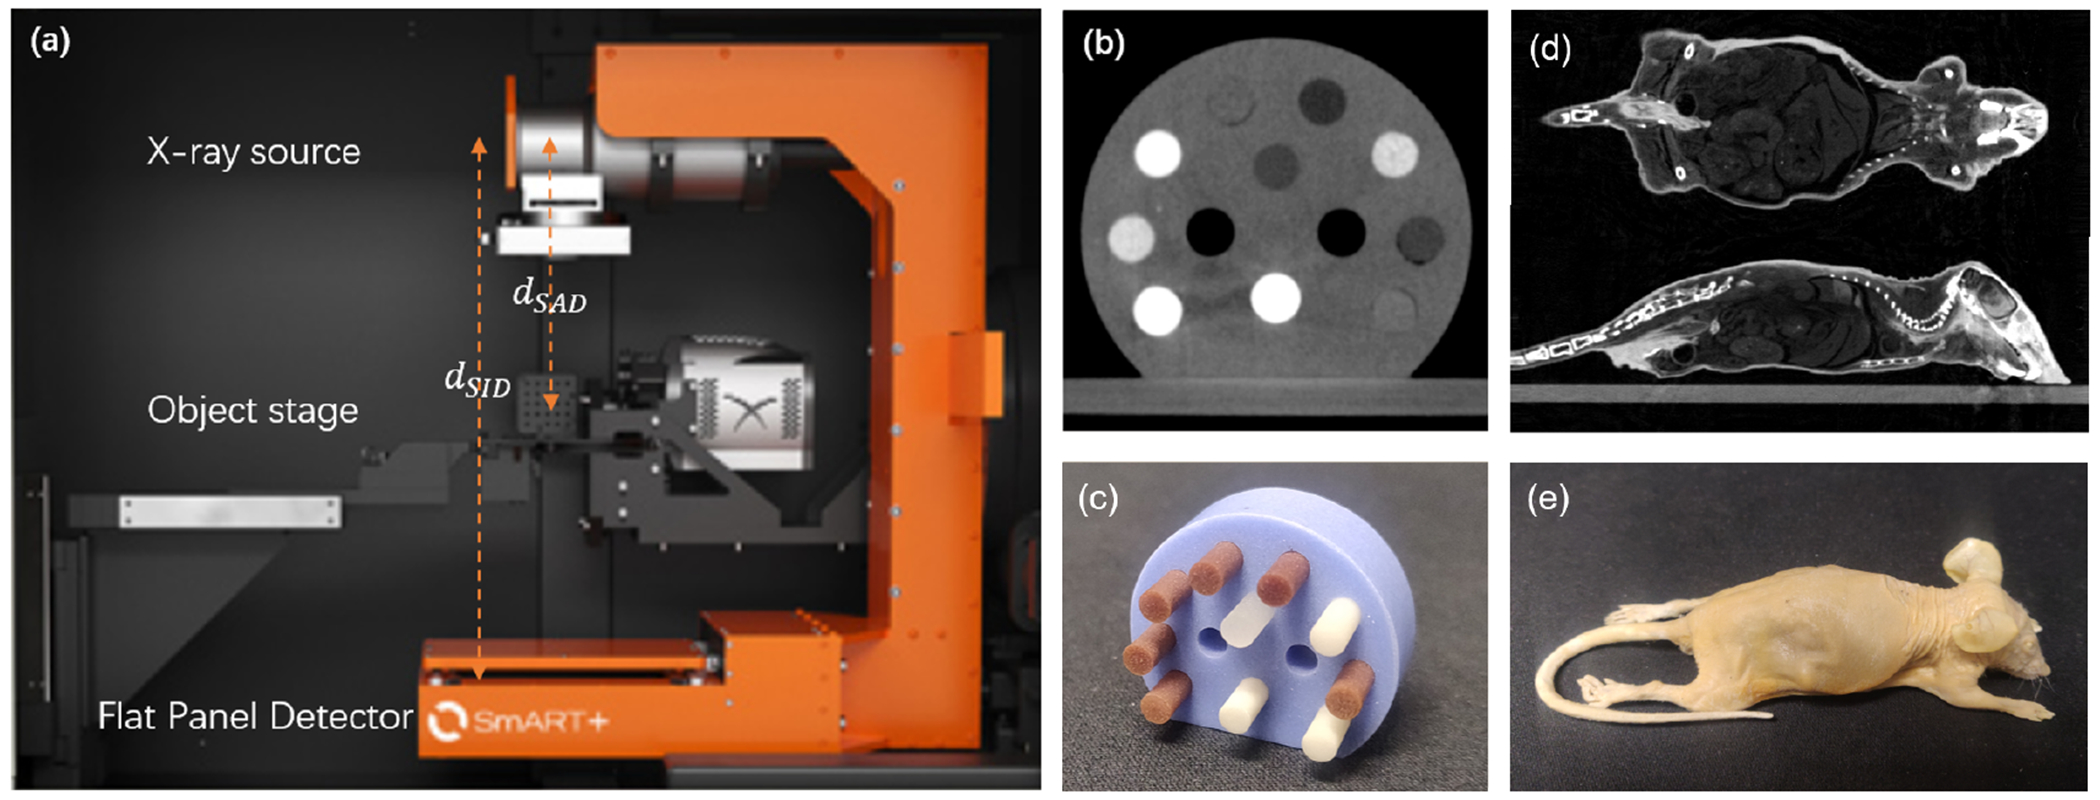
(a) Setup of the SmART preclinical radiation platform. (b) Micro-CT image and (c) picture of the CT calibration phantom. (d) CBCT image and (e) picture of the plastinated mouse phantom.
In our studies, CBCT data were acquired at three kVp levels of 30, 40, and 60 kVp with a fiter of 2.0 mm Al and 0.3 mm Cu and 0.27 mAs per projection. The kVp levels were empirically determined to generate satisfactory image and dose calculation results. We decided to use three kVp levels, as it was found that further increasing the number of kVp levels does not significantly improve result accuracy (Shen et al., 2018a,b). 600 projections were acquired in each scan with the angular range of 360° and scan time of 60 sec. Dark images and flood-field images were acquired to correct each projection image. Nominal source-to-axis distance dSAD and source-to-imager distance dSID were 30.5 cm and 62.5 cm, respectively. Two phantoms (SmART Scientific Solutions B.V., Maastricht, Netherlands) were used to evaluate the image quality of the CBCT system. One was a preclinical CT calibration insert phantom, as shown in Figure 1 (b) and (c), and the second one was a plastinated mouse specimen, as shown in Figure 1 (d) and (e).
For each projection, we corrected the geometry errors of the projection. Then, the projection image was processed to reduce the errors induced by detector time lag, veiling glare, and beam hardening effect. The corrected projection images at three kVp levels were then used to reconstruct three CBCT images via the Feldkamp-Davis-Kress (FDK) reconstruction model (Feldkamp et al., 1984). Finally, the CBCT images were employed to derive density and material composition images using our MEER decomposition algorithm.
2.2. Calibration and correction framework
The calibration and correction steps mainly followed standard approaches that have published previously in literature. In this section, we will briefly describe major steps in this process with references. Steps additional to published work will be explained. For completeness purpose, more details of the calibration and correction steps will be included in the Appendixes.
2.2.1. Geometry calibration and correction
Geometry correction in CBCT has been extensively studied over the years (Noo et al., 2000; Cho et al., 2005; Yang et al., 2006; Daly et al., 2008; Xu et al., 2017), including optimization-based calibration method (Li et al., 2019). In this study, we generally followed an analytic approach based on deriving parameters of ellipses formed by x-ray projections of BBs (Noo et al., 2000). Improvement over this method was made to derive parameters for each individual projection via an optimization approach.
Figure 2(a) and (b) show parameterization of the CBCT projection geometry with seven parameters dSAD, dSID, u0, v0, θ, φ and η. A right-handed Cartesian coordinate system was introduced with the z-axis along the rotation axis and the x-axis from the x-ray source to the rotation axis. dSAD is the distance from the x-ray source to the rotation axis. dSID is the shortest distance from the x-ray source to the FPD, whose direction is specified by a unit vector . The two angles θ and φ represent the relative angular position of in the (x, y, z) coordinate system. (u0, v0) is the position of the x-ray source on the detector coordinate system (u, v), whose unit vectors are . η represents the rotation of the unit vectors about the direction.
Figure 2.
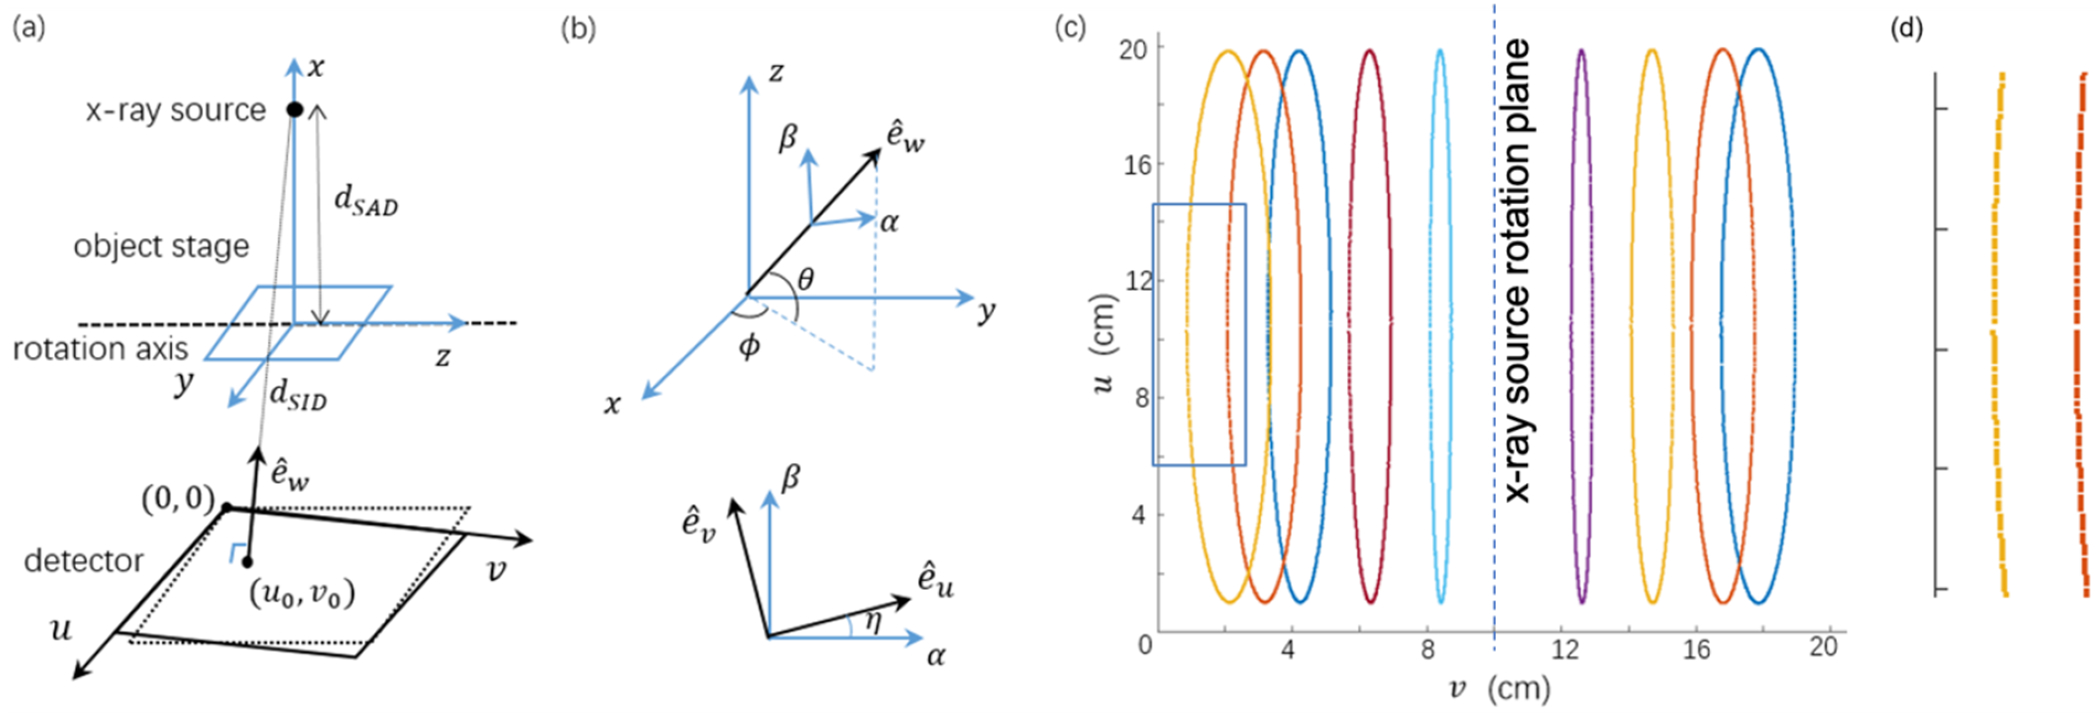
(a) Parameterization of the CBCT geometry. (b) Angles specifying the detector rotation. (c) Positions of BB centers in 600 projections shown on the detector. (d) Zoom-in view of the blue rectangular region in (c).
We attached one metal ball bearing (BB) with 0.5 mm diameter on the animal bed and precisely advanced it along the z axis to nine different positions by using the high-precision positioning stage. Four of the nine positions were on one side of the x-ray tube rotation plane, and the rest five positions on the other side. For each position, 600 projections were collected in a full rotation scan. On the acquired x-ray projections, we first identified all the BB’s center position using circular Hough transform, where the superscript k = 1, … , 600 is projection index, and subscript i = 1, … , 9 is the BB index. The centers of BBs traced nine ellipses on the acquired projection images (Figure 2(c)).
We assumed θ = 0, following the same assumption in (Noo et al., 2000) that the FPD is parallel to the rotation axis. Hence there are six parameters to determine, namely dSAD, dSID, u0, v0, φ and η. Different from the table-top system that the object rotates (Noo et al., 2000; Li et al., 2019), our system rotates gantry, and hence these parameters are generally speaking gantry angle dependent. As shown in Figure 2(d), the BBs’ trajectories did not follow exactly the ellipses due to deviation of the projection geometry from the ideal circular geometry, indicating the need for geometry calibration with gantry angle dependent parameters. To derive these parameters for each gantry angle, we first assumed gantry angle independent dSID, u0, v0, φ and η, and computed dSAD for each gantry angle. We then solved an optimization problem to derive dSID, u0, v0, φ and η for each angle based on the already known gantry angle specific dSAD. The validity of this approach was ensured by relatively small variations of dSID, u0, v0, φ and η among gantry angles, which will be demonstrated in the result section.
As such, following the approach in (Noo et al., 2000), we first assumed gantry angle independent dSID, u0, v0, φ and η and computed these values. This allowed the computation of dSAD for each gantry angle k:
| (1) |
where dij is the 3D distance between the ith and the jth BBs, known precisely based on how we moved the BB using the motion stage platform. Expressions of other parameters in this equation are presented in Appendix A.1.
With the and the kth gantry angle, we computed the expected projection position for the ith BB, denoted as . To derive the projection specific parameter , ϕ(k), η(k), we solved the optimization problem
| (2) |
where is the coordinate of the ith BB’s projected position computed based on dSID, u0, v0, ϕ, η, as well as the already derived . We solved this problem with MATLAB using the linear least-square fitting method. As the problem is highly non-convex, initial condition plays an important role. We used the previously derived projection-independent values of these variables as the initial condition.
Finally, as it is expected that the variations of these parameters dSID, dSAD, u0, v0, φ, η are smooth, as gantry rotates, we fit each of the six parameters in a truncated Fourier series form as
| (3) |
where y is the variable of interest, x represents the gantry angle in radians, and y0, α1, β1 α2, β2, are fitting coefficients. This fitting is expected to reduce uncertainty generated when deriving the variables of interest by processing each projection individually.
With the six gantry-angle dependent parameters dSID, dSAD, u0, v0, φ,η determined, for each projection, we resampled the measured projection image to an image defined the ideal circular projection geometry using bi-linear interpolation. The projection images were then used for subsequent corrections. Note that this resampling step may introduce some errors due to interpolation. In fact, it is possible use some reconstruction packages to accommodate misaligned data, including projection angle dependent geometry (Van Aarle et al., 2016; Karolczak et al., 2001). We used the resampling approach because of this requirement in our in-house developed GPU-based FDK reconstruction package (Jia et al., 2010).
2.2.2. Intensity calibration and correction
FPDs are known to suffer from the image lag effect caused by the trapping of electrons in the a-Si:H semiconductor pixel components and the subsequent release of the trapped charge (Siewerdsen and Jaffray, 1999). The effect of lag can be estimated from the measured rising step response (RSRF) (Mail et al., 2008). In this study, the RSRF was measured under an expose to the flood-field x-ray for each kVp at 0.8 mAs per frame for 600 frames during 60 sec, and the lag-response function L(m) was obtained by a double-exponential fitting. Then, the measured projections of a CBCT scan were corrected adopting the determined lag-response function (see Appendix A.2.1).
Long-range veiling glare effect is another important source of artifacts in CBCT with FPD (Poludniowski et al., 2011). The glare effect can be characterized by a point-spread function (PSF) of the detector. In this study, we collected projection images for a steel ruler positioned on the FPD at four different incline angles, each averaged over 5 frames, at 0 degree gantry angle and the same x-ray setup as in CBCT scans. Glare correction was performed based on deconvolution of the point-spread function (PSF) estimated from the line-spread function (LSF) measured in the projection image of the steel ruler (see Appendix A.2.2).
CBCT is affected by artifacts arising from beam-hardening (BH) effect caused by the energy-dependent x-ray attenuation coefficients of photons and the use of a polychromatic x-ray beam. In this study, a dual-material BH correction using water- and bone-materials (Van Gompel et al., 2011) was performed (see Appendix A.2.3).
2.3. MEER CBCT
The previous calibration workflow permitted high-quality CBCT images of multiple kVp levels, which can be used to derive relative electron density (rED) to water, and elemental compositions (EC). In our method, each voxel in a CBCT image is assumed to be sparsely represented over a dictionary consisting of EC of commonly encountered tissues (Shen et al., 2018a,b). The decomposition problem can be formulated mathematically as
| (4) |
where indicate CBCT images at V different kVp channels, with M being the number of voxels. Note that in this particular application, we focused on the three kVp levels of 30, 40, and 60 kVp as discussed before, while the the developed algorithm is generally applicable to any V ≥ 2 (Shen et al., 2018a). is a dictionary constructed in a similar way as (Shen et al., 2018a,b). It consists of compositions of D elements of E materials. For this study, we considered three elements (D = 3), i.e. Hydrogen (H), Oxygen (O), and Calcium (Ca), which are the major elements constructing common tissues. Let 1{·} denote a vector of size specified by its subscription with all elements equal to 1. We have Λ1D = 1E to ensure the unity summation on elemental fractions for each material. K and KC are scanner dependent coefficients, which can be determined via a calibration step (Rutherford et al., 1976; Shen et al., 2018a,b). is a diagonal matrix with each diagonal element corresponding to rED of each voxel, while EC is given by λ = vΛ where gives the dictionary coefficients with each row being a vector specifying the contribution of each dictionary material. ‖·‖F is the Frobenius norm for a matrix and ‖·‖0 is the l0 norm giving the number of non-zero elements in a data array. The first term in Eq. (4) characterizes the empirical relationship among F, rED, and EC (Rutherford et al., 1976), while the second term enforce v to be sparse. α is a parameter set to control the balance between the two terms.
One obvious limitation of this model Eq. (4) is its non-convex form due to product of ρ and v and the existence of l0 norm. As λ = vΛ is EC, vΛ1D = 1M naturally holds. As a consequence, v1E = vΛ1D = 1M. Hence, if we combine ρ and v as s = ρ · v and approximate l0 norm with the convex l1 norm, the optimization problem can be reformulated into a relaxed form as
| (5) |
diag(·) indicates the two-way conversion between a diagonal matrix and a column vector. This model regularizes the resulting EC to be a sparse representation of the dictionary, while no constraint is enforced to rED. Note that the standard conversion between CT number and electron density used in clinic can be obtained via two linear mappings for CT numbers higher and lower than that of water, respectively (Knöös et al., 1986), through which we can easily derive an accurate initial estimation of rED. Motivated by this, we established the linear mappings using image of the CT calibration insert phantom of the highest energy level used in our experiments (60 kVp) to derive the initial estimation on rED ρ0 for any input CT image. We then constrained the solution of our model to be close to the initial estimation:
| (6) |
In contrast to Eq. (4), Eq. (6) is a convex model which can be solved more effectively and efficiently. In this study, we incorporated alternating direction method of multipliers (ADMM) (Boyd et al., 2011) to solve this optimization problem. With s solved, one can easily compute ρ and v as
| (7) |
2.4. Evaluation studies
We performed a series of evaluation studies using the CT calibration phantom and the plastinated mouse phantom (Figure 1). Apart from visually inspecting reconstructed CBCT images to assess image quality improvement and artifact reduction, we quantitatively measured several metrics. The glare correction is expected to improve image resolution. Hence, we calculated Modular-transfer function (MTF) of reconstructed CBCT images, which was achieved by deconvolving a measured image intensity profile for a sharp edge in the phantom. Correcting BH effect can improve CT number accuracy. We demonstrated this using the CT calibration phantom. The phantom contains 10 inserts that represent different materials, including the solid water. For the ith insert, We calculated the ground truth x-ray attenuation , using the x-ray spectrum ψ(E) and known insert rED and EC, as well as the ground truth CT numbers. We compared the measured CT numbers with the ground truth CT numbers.
After decomposing the reconstructed images into rED and EC, we compared the calculated quantities with ground truth values in the CT calibration phantom case. For the plastinated mouse phantom, as the ground truth values are not available, we visually inspected the resulting images.
To evaluate the impact and necessity of three intensity correction steps, we generated three sets of CBCT data of the CT calibration phantom, each with one of the three intensity correction steps removed from the correction chain. After that, we performed MEER-CBCT decomposition on these three set of CBCTs, and then compared the results with that under the full correction.
As the ultimate goal of improving CT number accuracy and achieving MEER-CBCT is to improve dose calculation accuracy in pre-clinical radiation studies, we performed a proof-of-concept MC simulation study to evaluate the improvement of dose calculation accuracy. Specifically, we used our in-house developed GPU-based MC tool for kV photon transport (Jia et al., 2012) to compute dose distribution of a 2×2 cm2 225 kVp beam impinged horizontally to the CT calibration phantom. Three MC dose calculations were performed. The first one used the phantom definition with material and density provided by the vendor, and the result served as the ground truth of evaluation. The second one used the phantom defined by deriving material type and density based on CT number in the 40 kVp CBCT image. This is the current standard approach to define a phantom from a CT image for MC simulation. For each voxel, the material type was one of four possible types (air, tissue, lung, and bone) by comparing the CT number with thresholds, and the density was determined by a mapping consisting of two piece-wise linear functions between CT number and density (Schneider et al., 2000). Third, we defined the phantom material and density based on the results of MEER-CBCT. We compared the dose calculation results in the second and the third settings with the ground truth one in the first setting.
3. Results
3.1. Calibrations and corrections
3.1.1. Geometry calibration and correction
Figure 3 shows the geometric parameters dSAD, dSID, u0, v0, η and φ as a function of gantry angle. Scattered points are values obtained by processing each individual projection, and solid curves are fitting results. The values of fitting parameters are presented in Table 1.
Figure 3.
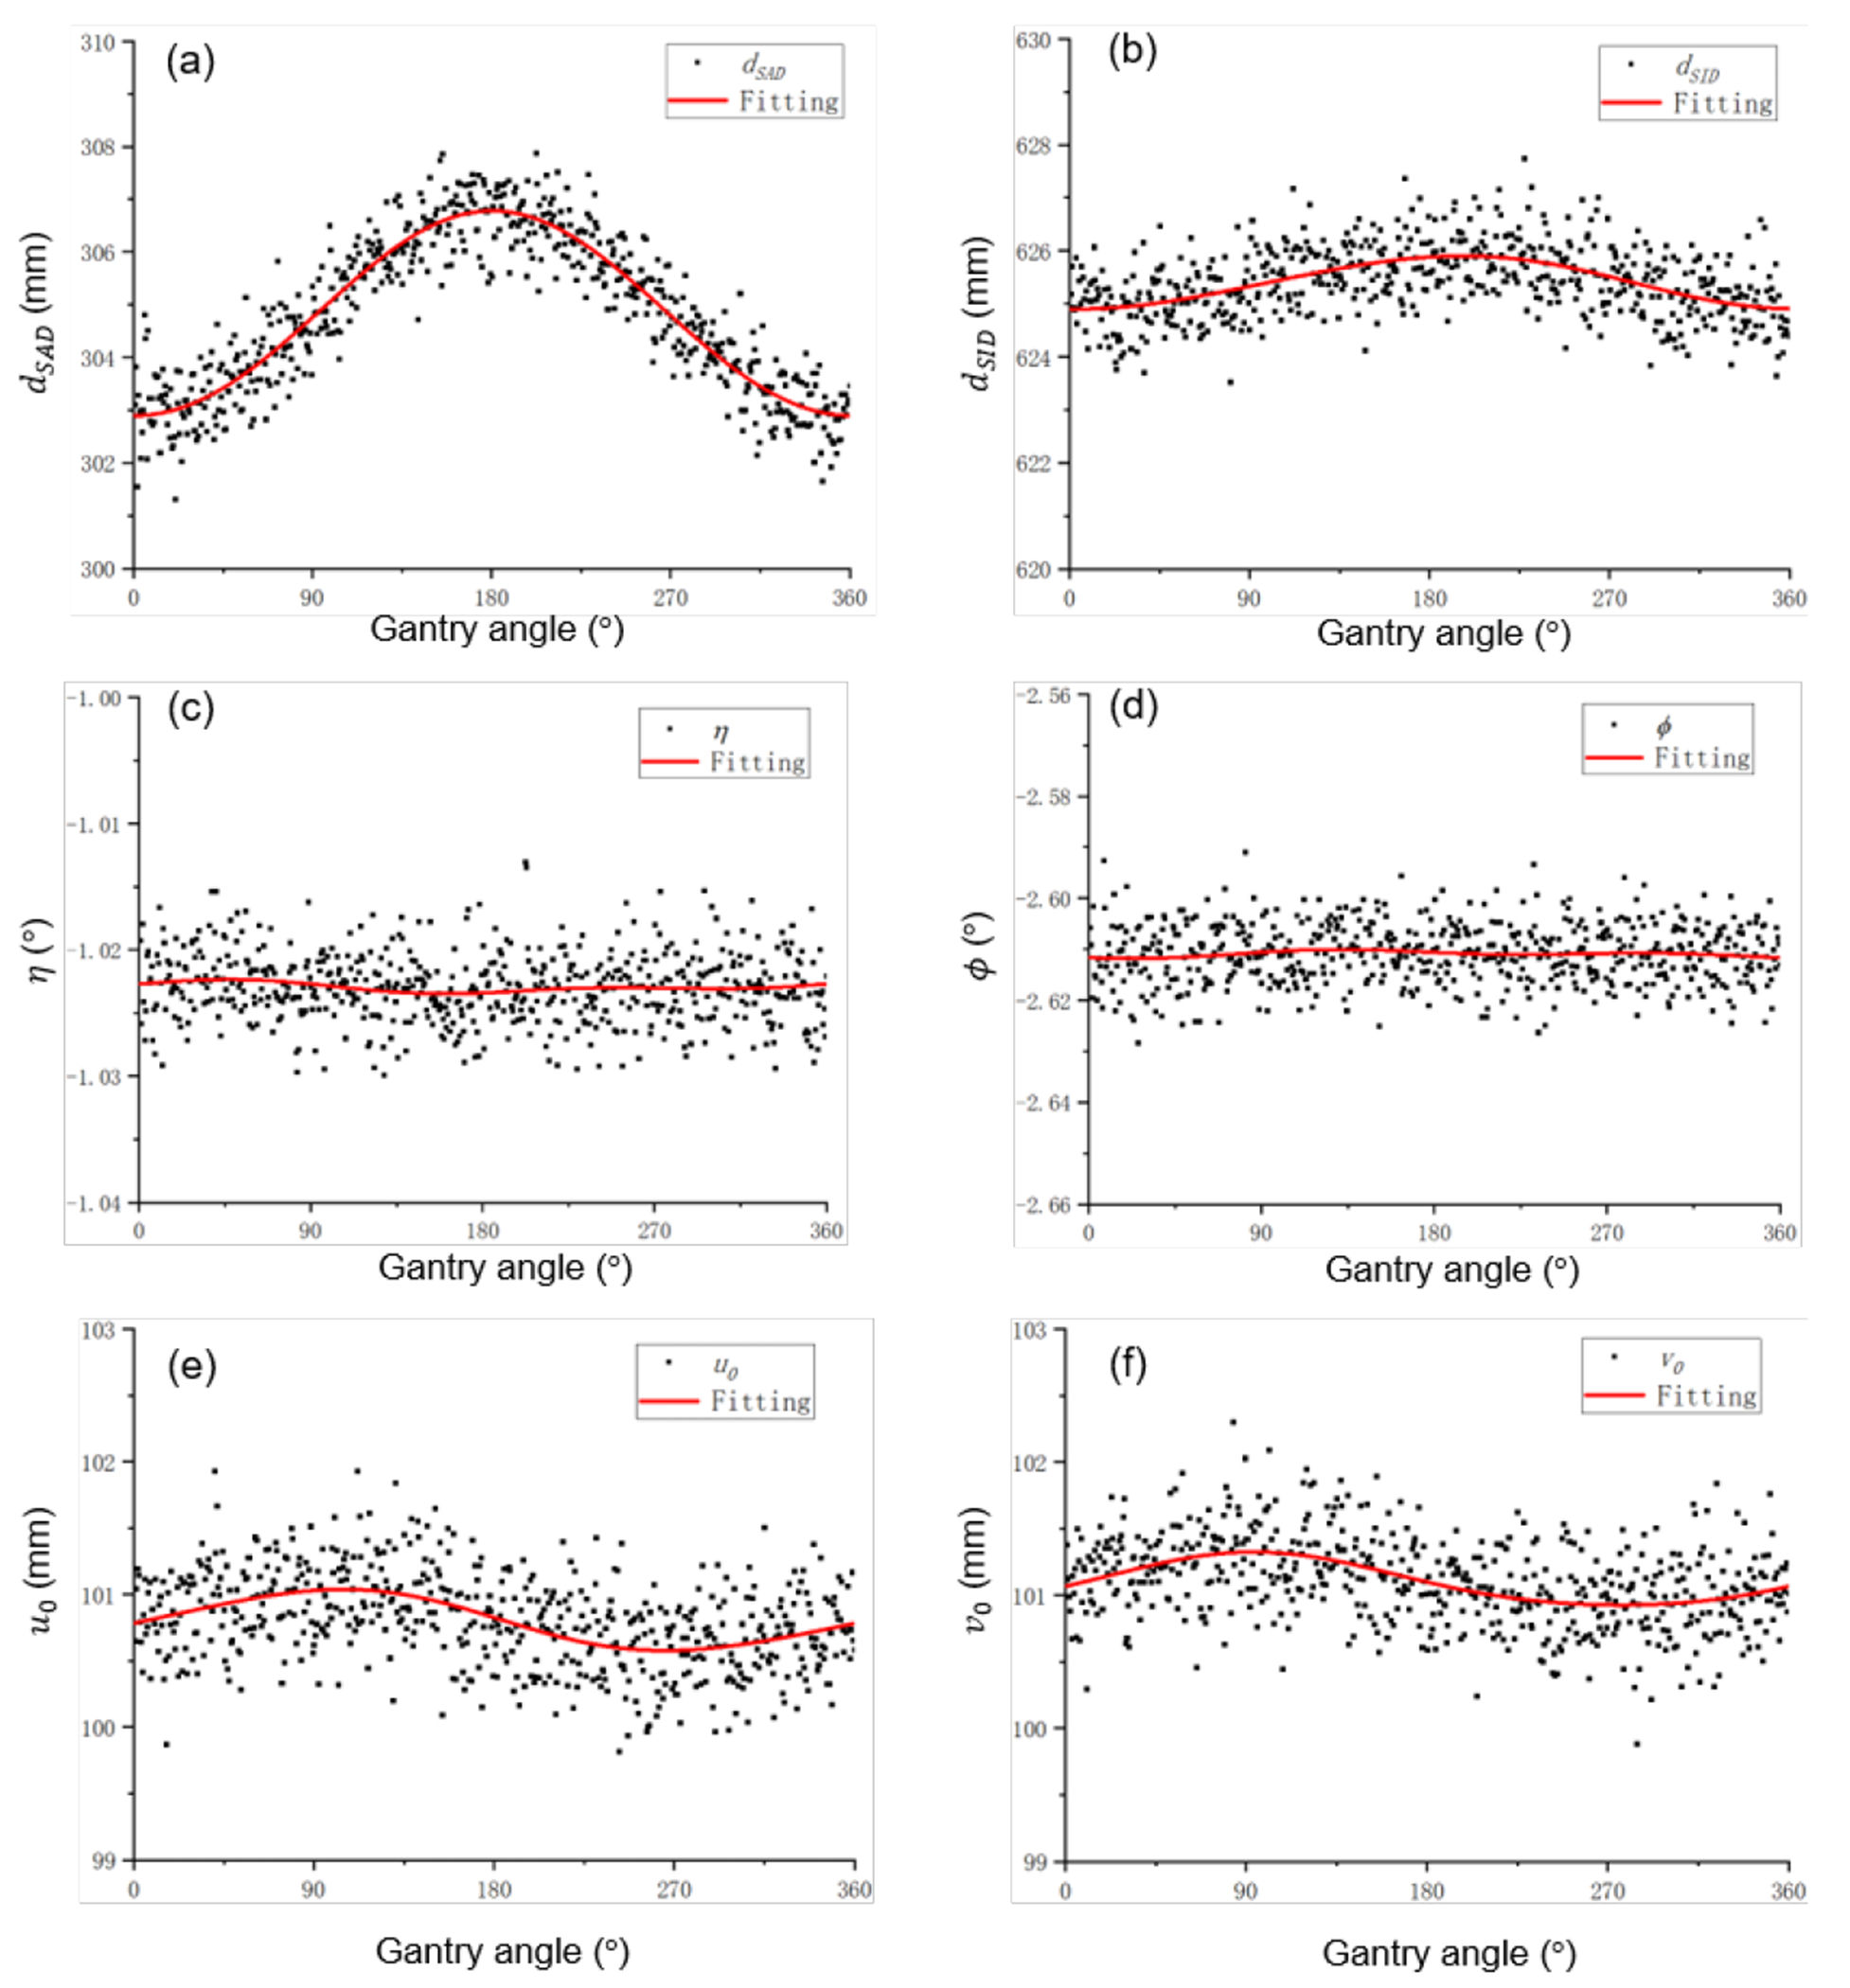
Geometry parameters and fitting results as a function of gantry angle.
Table 1.
Fitting coefficients of geometric parameters.
| dSAD(mm) | dSID(mm) | η(°) | φ(°) | (mm) | (mm) | |
|---|---|---|---|---|---|---|
| y 0 | 304.8 | 625.4 | −1.023 | −2.611 | 100.8 | 101.1 |
| α 1 | −0.016 | −0.091 | 1.5 × 10⁻⁴ | 1.0 × 10⁻⁴ | 0.23 | 0.20 |
| β 1 | −1.94 | −0.49 | 3.5 × 10⁻⁴ | −5.2 × 10⁻⁴ | −0.021 | −0.016 |
| α 2 | −0.0032 | 0.022 | 2.5 × 10⁻⁴ | −4.3 × 10⁻⁴ | −0.020 | −0.0014 |
| β 2 | 0.032 | −0.013 | −1.0 × 10⁻⁴ | −2.2 × 10⁻⁴ | 3.7 × 10⁻⁴ | −0.021 |
Among the six variables, the distance between source and axis dSAD was strongly dependent on the gantry angle. The distance was small at 0°, when x-ray tube is at the top, due to gravity. The standard deviation of dSAD was 1.56 mm. The much larger variation of this variable, compared to the other five variables, also justified the validity of our approach to first ignore the variations of the remaining five variables, when deriving gantry-angle specific dSAD.
For dSID, it varied much less over gantry angles. The x-ray tube and the FPD are pulled by gravity to the same direction, and hence the distance between them, dSID, did not change largely. For u0 and v0, the coordinate of the x-ray tube projected to the detector, their variations were also ascribed to gravity. At gantry angle 90° or 270°, the gravity pulled the detector to different directions, generating the pattern shown in the figure. Finally, the variations of η and φ were found to be small.
We have verified mechanical stability of the scanner geometry by performing the geometry calibration multiple times over a time period of four months. We found that the relative change of geometry correction parameters was on average smaller than 2%.
Figure 4 shows CBCT images of a BB and the CT calibration phantom with and without geometry correction. For the BB case, the correction step successfully restored the correct spherical shape. As for the insert phantom, geometry correction improved geometry accuracy of insert positions and recovered their circular shapes.
Figure 4.

Reconstructed images of a BB (a) and the CT calibration phantom (b) with and without geometry correction. Circles in the two panels of (b) indicate expected insert shapes and positions.
3.1.2. Intensity calibration and correction
Figure 5 shows the measurements and fitting results of the RSRF and LSF. The glare correction is expected to improve CBCT image resolution. As shown in Figure 6, the MTFs of the CBCT images along radial and axial direction after the glare correction were slightly improved.
Figure 5.
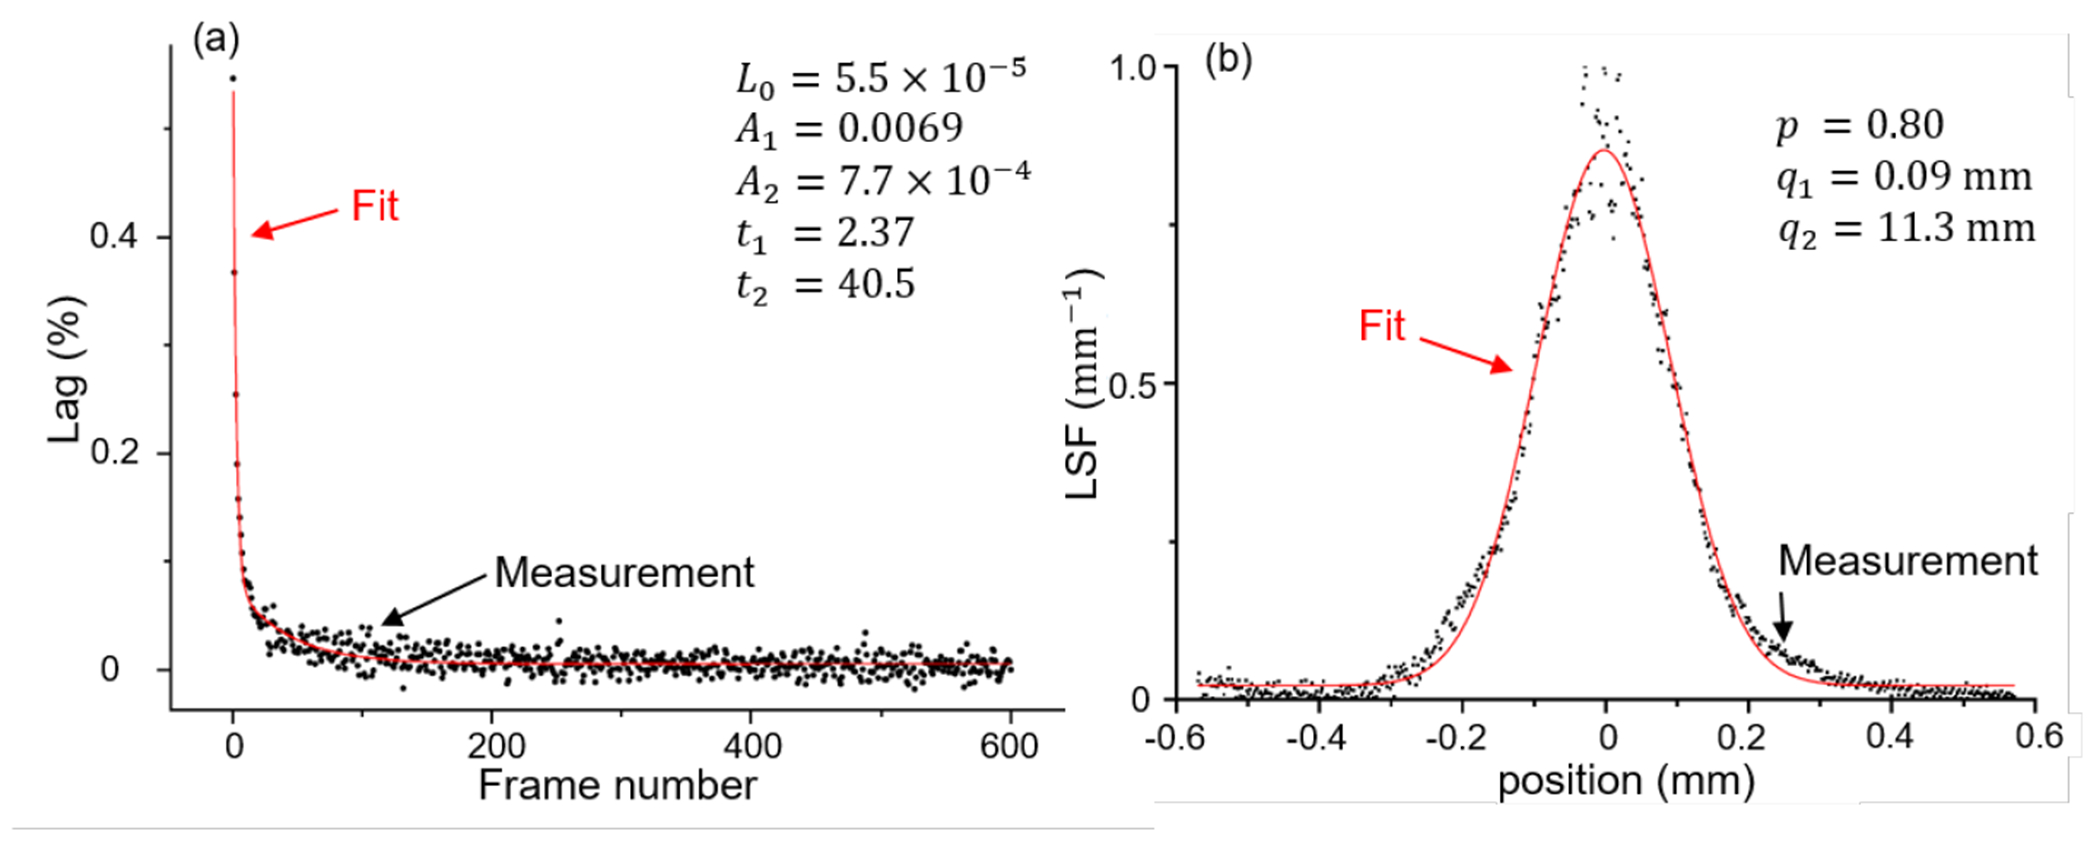
Fitting results of lag response function and line spread function.
Figure 6.
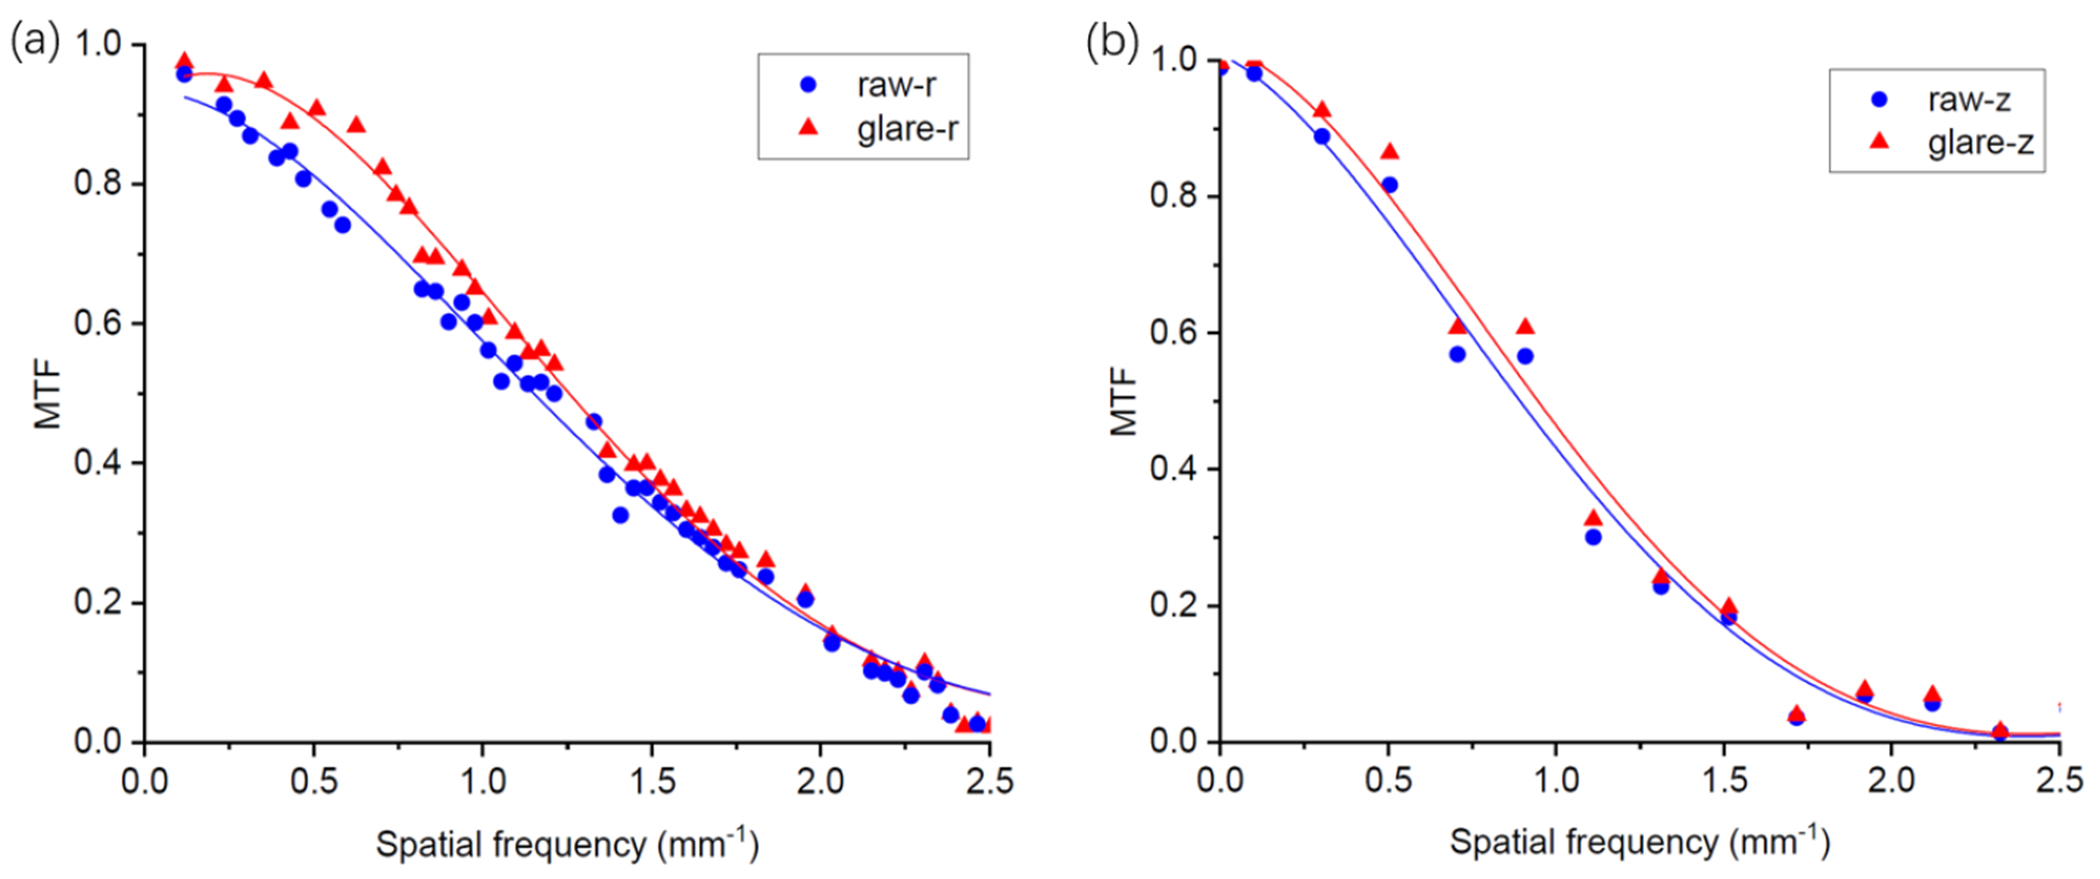
(a) Radial and (b) axial MTFs of reconstructed CBCT image using projections with and without glare correction. Solid lines are the spline fitting results.
Figure 7 compared CBCT images reconstructed using projection data with different steps of intensity corrections, with a 40 kVp polychromatic x-ray beam. We can see that the ‘comet’ and ‘streak’ artifacts were visually reduced after the detector lag correction, the edges became sharper after the glare correction, and the artifacts of ‘cupping’ and ‘streak’ visually were reduced after BH correction.
Figure 7.
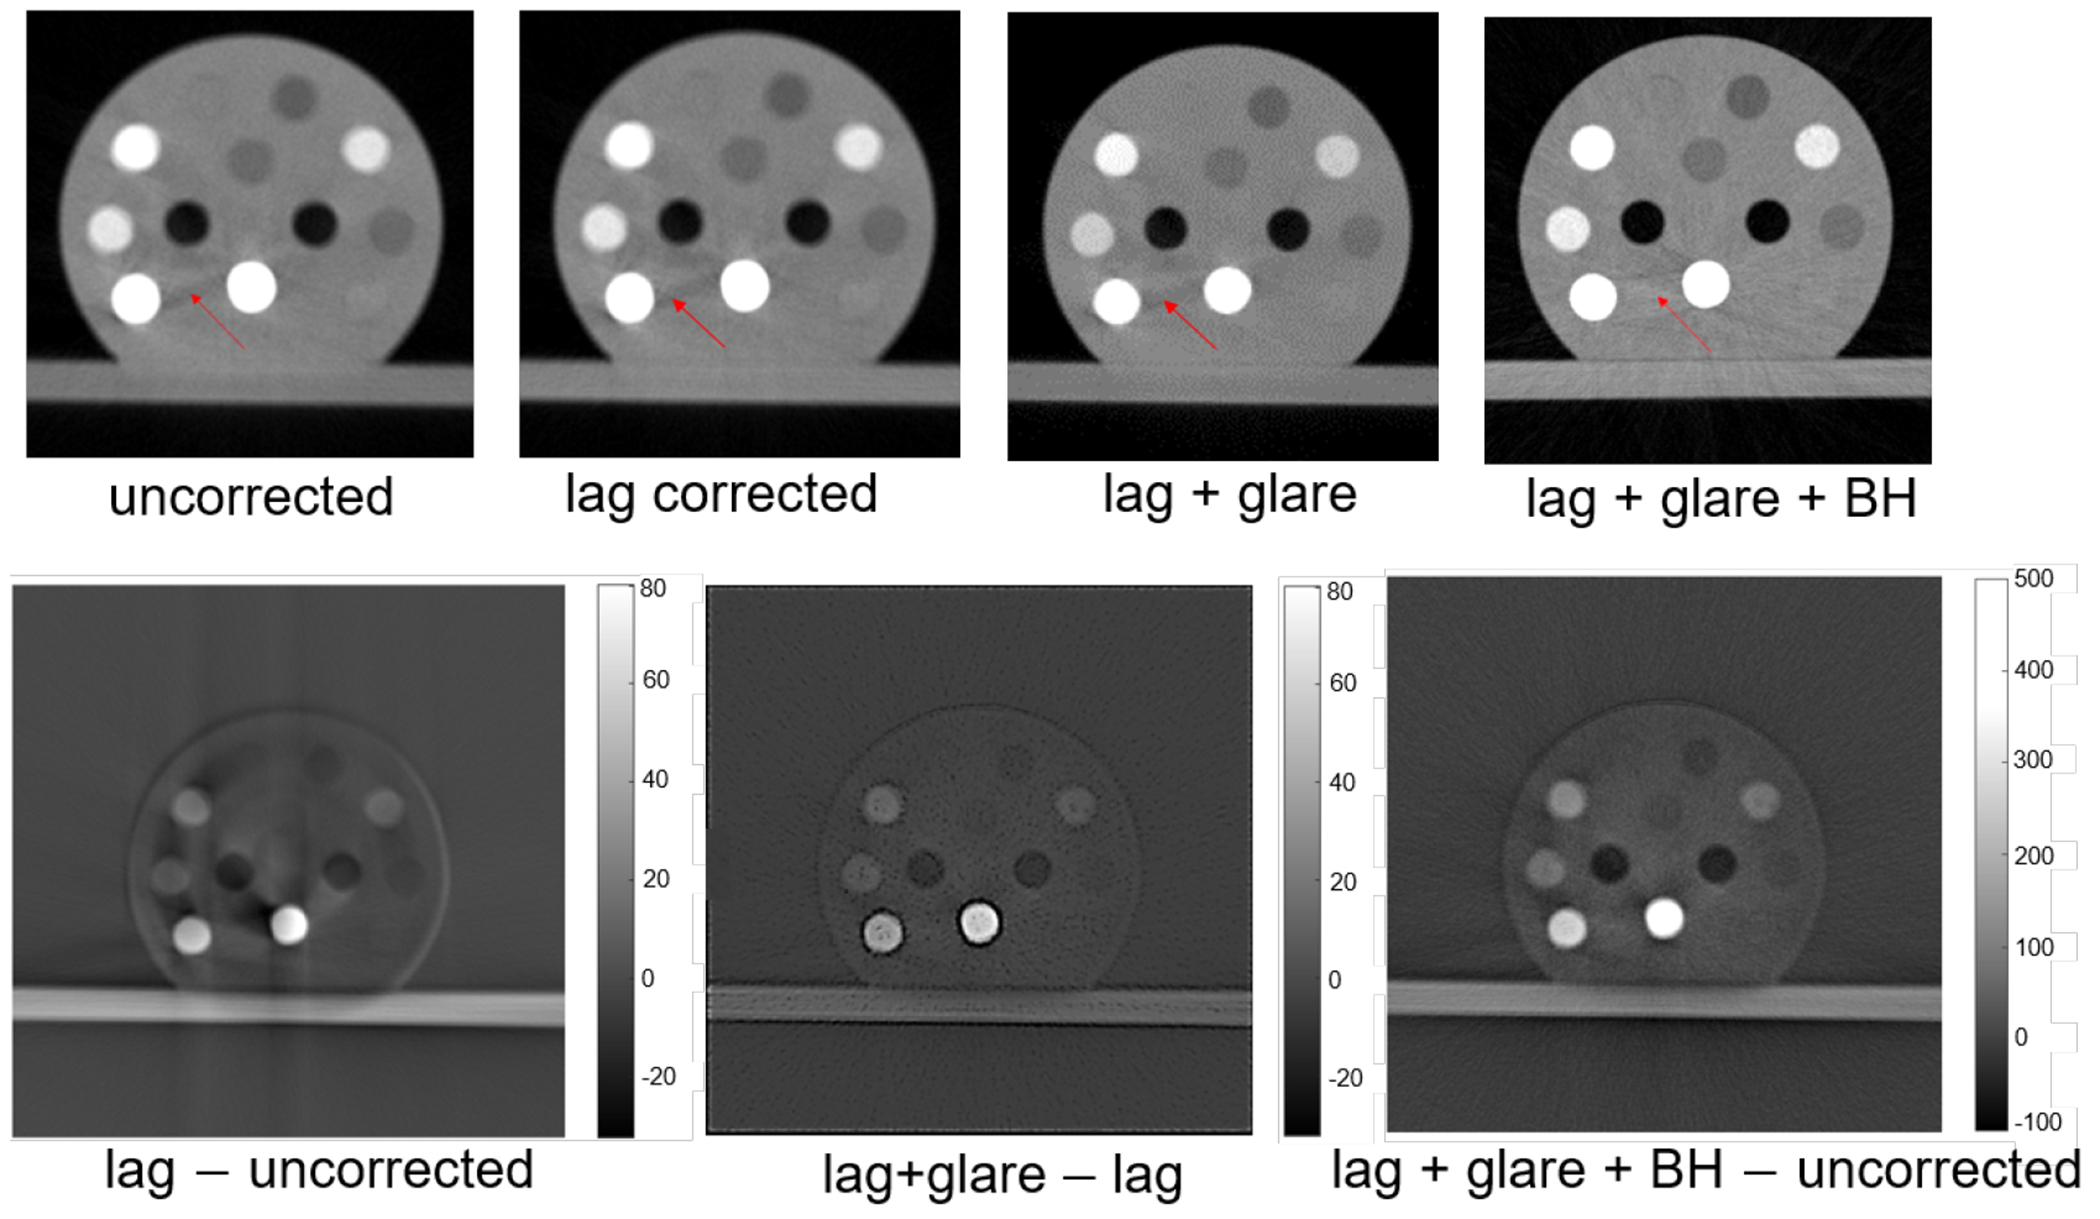
Top row from left to right: uncorrected CBCT image, that after the lag correction, that after lag and glare corrections, and that after lag, glare and BH corrections. Bottom row from left to right: difference between lag-corrected and uncorrected images, difference between images corrected for lag and glare and for lag only, and difference between the image with all the three corrections and the uncorrected image.
Figure 8 shows CT numbers of different inserts in different settings compared to the guideline of the ground truth value. Without any correction steps, the mean relative errors in CT numbers was 19%. Collectively all the three correction steps were able to reduce the CT number error to 5%.
Figure 8.

(a) CT numbers with different correction steps in the calibration chain. Solid line is the ground truth. (b) is the zoom-in view of the region of (a). (c) Mean relative error of CT numbers in different settings.
3.2. MEER-CBCT
We first evaluated the performance of MEER-CBCT on the calibration insert phantom. The rED and EC of the inserts in the phantom are known, allowing us to perform quantitative analysis on the results. Figure 9(a) shows the CT images of three energy levels, while Figure 9(b) gives the images of eED and EC (H, O, and Ca fractions), respectively. Visually speaking, the decomposition results generally match with our expectation. For instance, we observed the relatively large fractions of Ca and rED for bony tissues. The BH effects are more significant at lower kVp levels. Some residual BH artifacts still existed in the 30 and 40 kVp images. The quantitative errors in EC and rED for each insert are given in Figure 9(c). To compute the errors, we manually picked a region of interest inside each insert and compared the MEER-CBCT results against the ground truth. The results show excellent agreement between the decomposition and ground truth. The median errors in H, O, and Ca, fractions for all the inserts were below 1%, 2%, and 4% respectively, while the median error in rED was less than 5%. These results demonstrated the effectiveness of the MEER-CBCT method.
Figure 9.
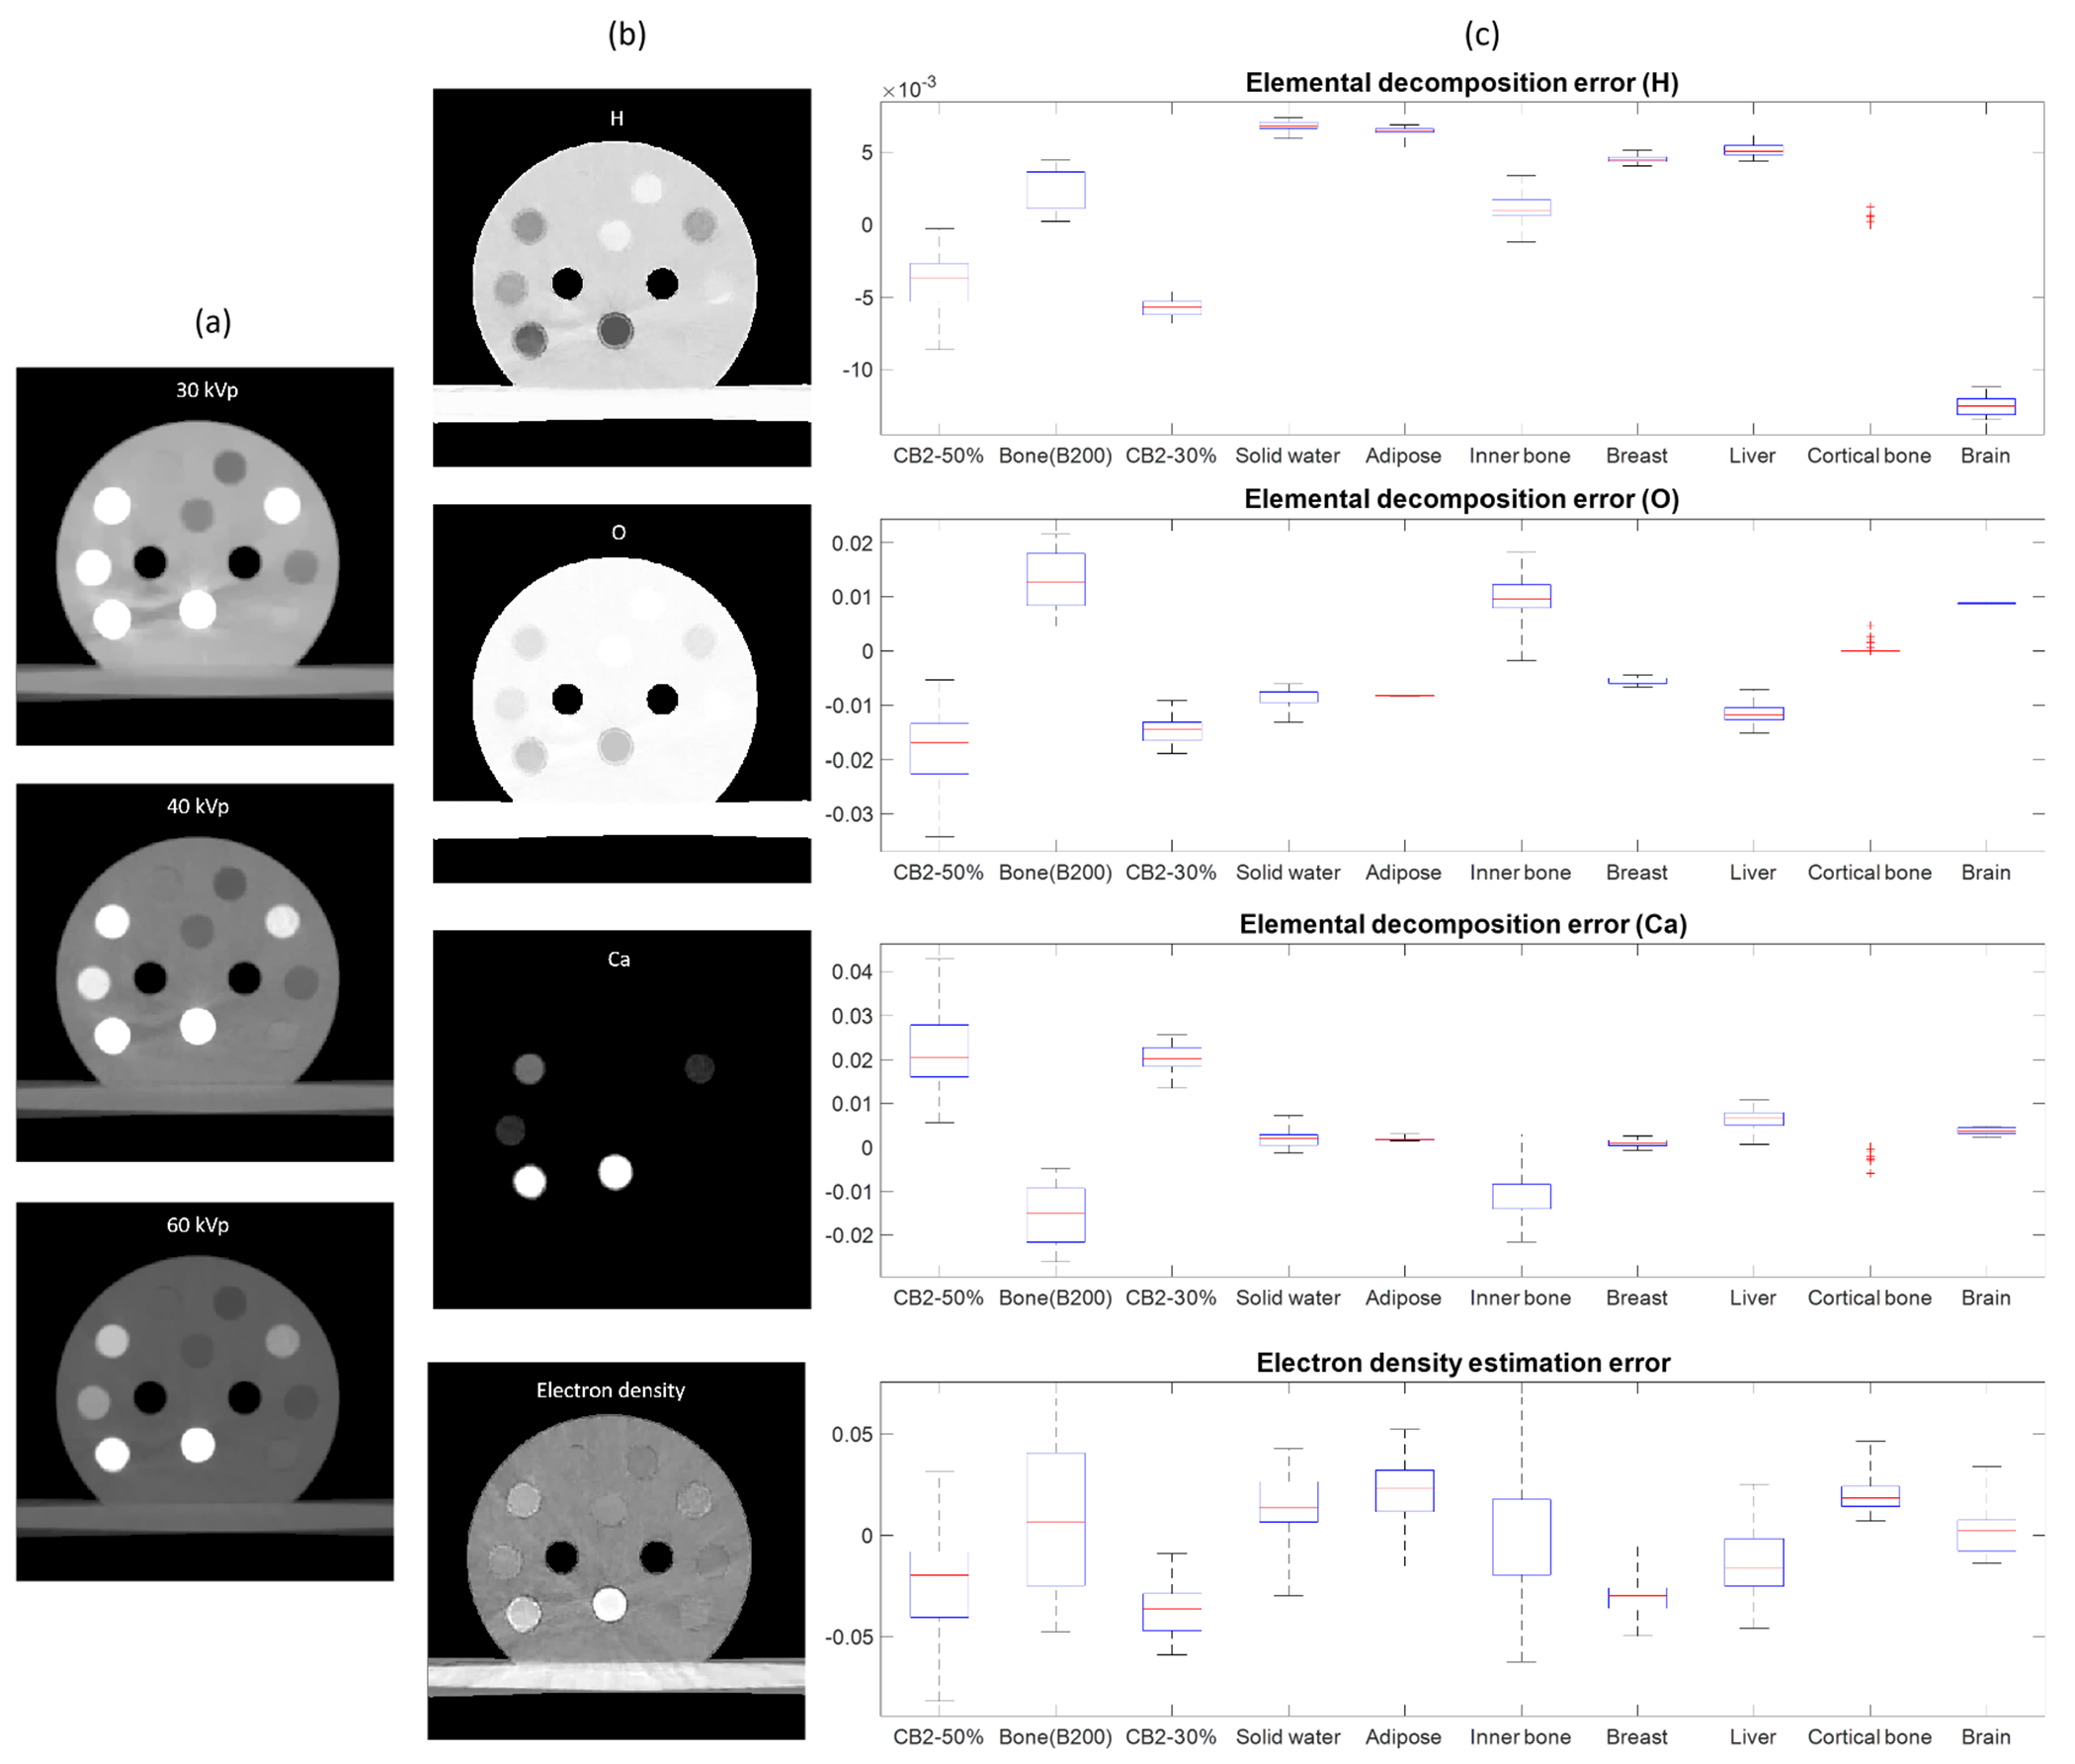
MEER-CBCT results for the calibration insert phantom. (a) CT images of three kVp levels. (b) Images of rED and EC fractions. (c) Errors in EC and rED of different inserts. For each box plot, the top and bottom bars indicate the maximal and minimal values respectively. The red line denotes the median error and the blue box gives the standard deviation.
MEER-CBCT decomposition were also performed on three sets of CBCTs, each with one intensity correction step removed. Figure 10 presents errors in rED and EC averaged over all inserts in different settings. These results indicated that all the three intensity correction steps are important to collectively improve accuracy of material decomposition.
Figure 10.
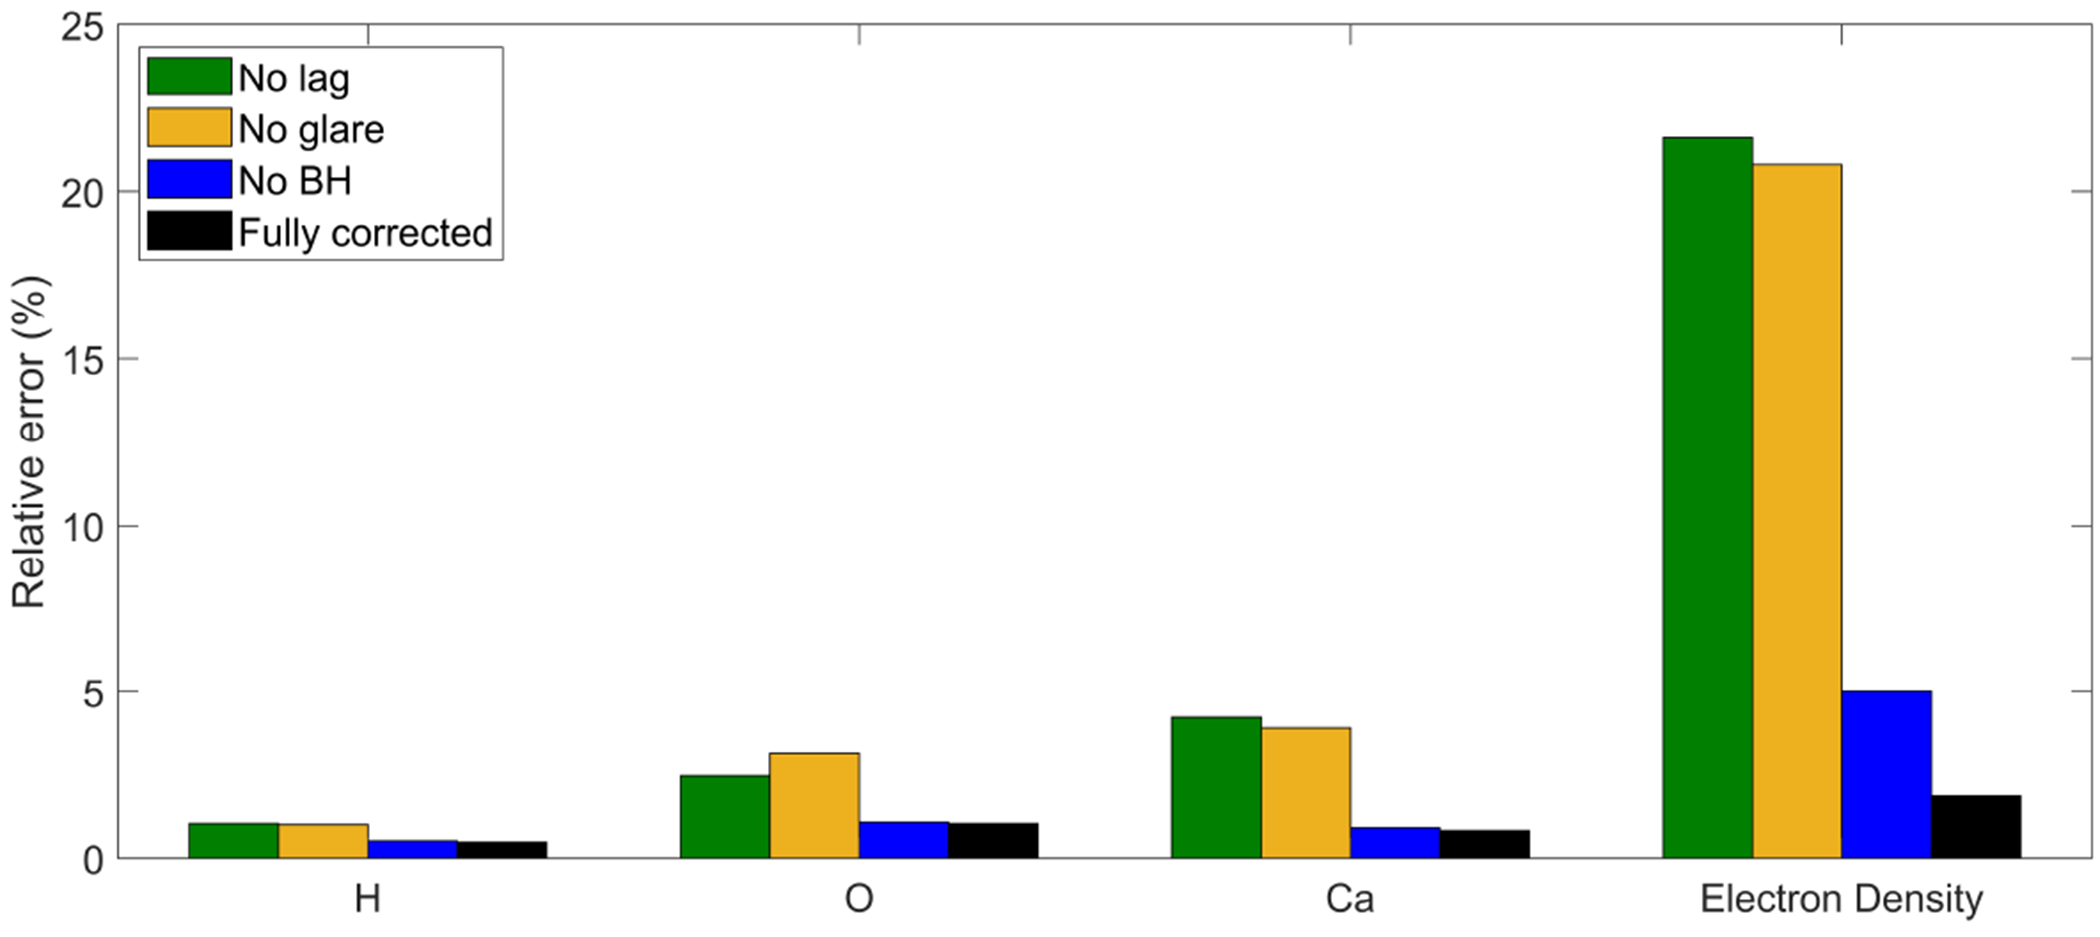
Material decomposition errors in different settings.
With the success achieved in the CT calibration phantom, we moved on to the plastinated mouse phantom, as shown in Figure 11. It is not possible to perform quantitative investigation for this phantom due to absence of ground truth. The results were found to be visually reasonable. For instance, rED in the bony tissues was generally higher compared to that in soft tissues. Ca element mainly existed in bone regions.
Figure 11.
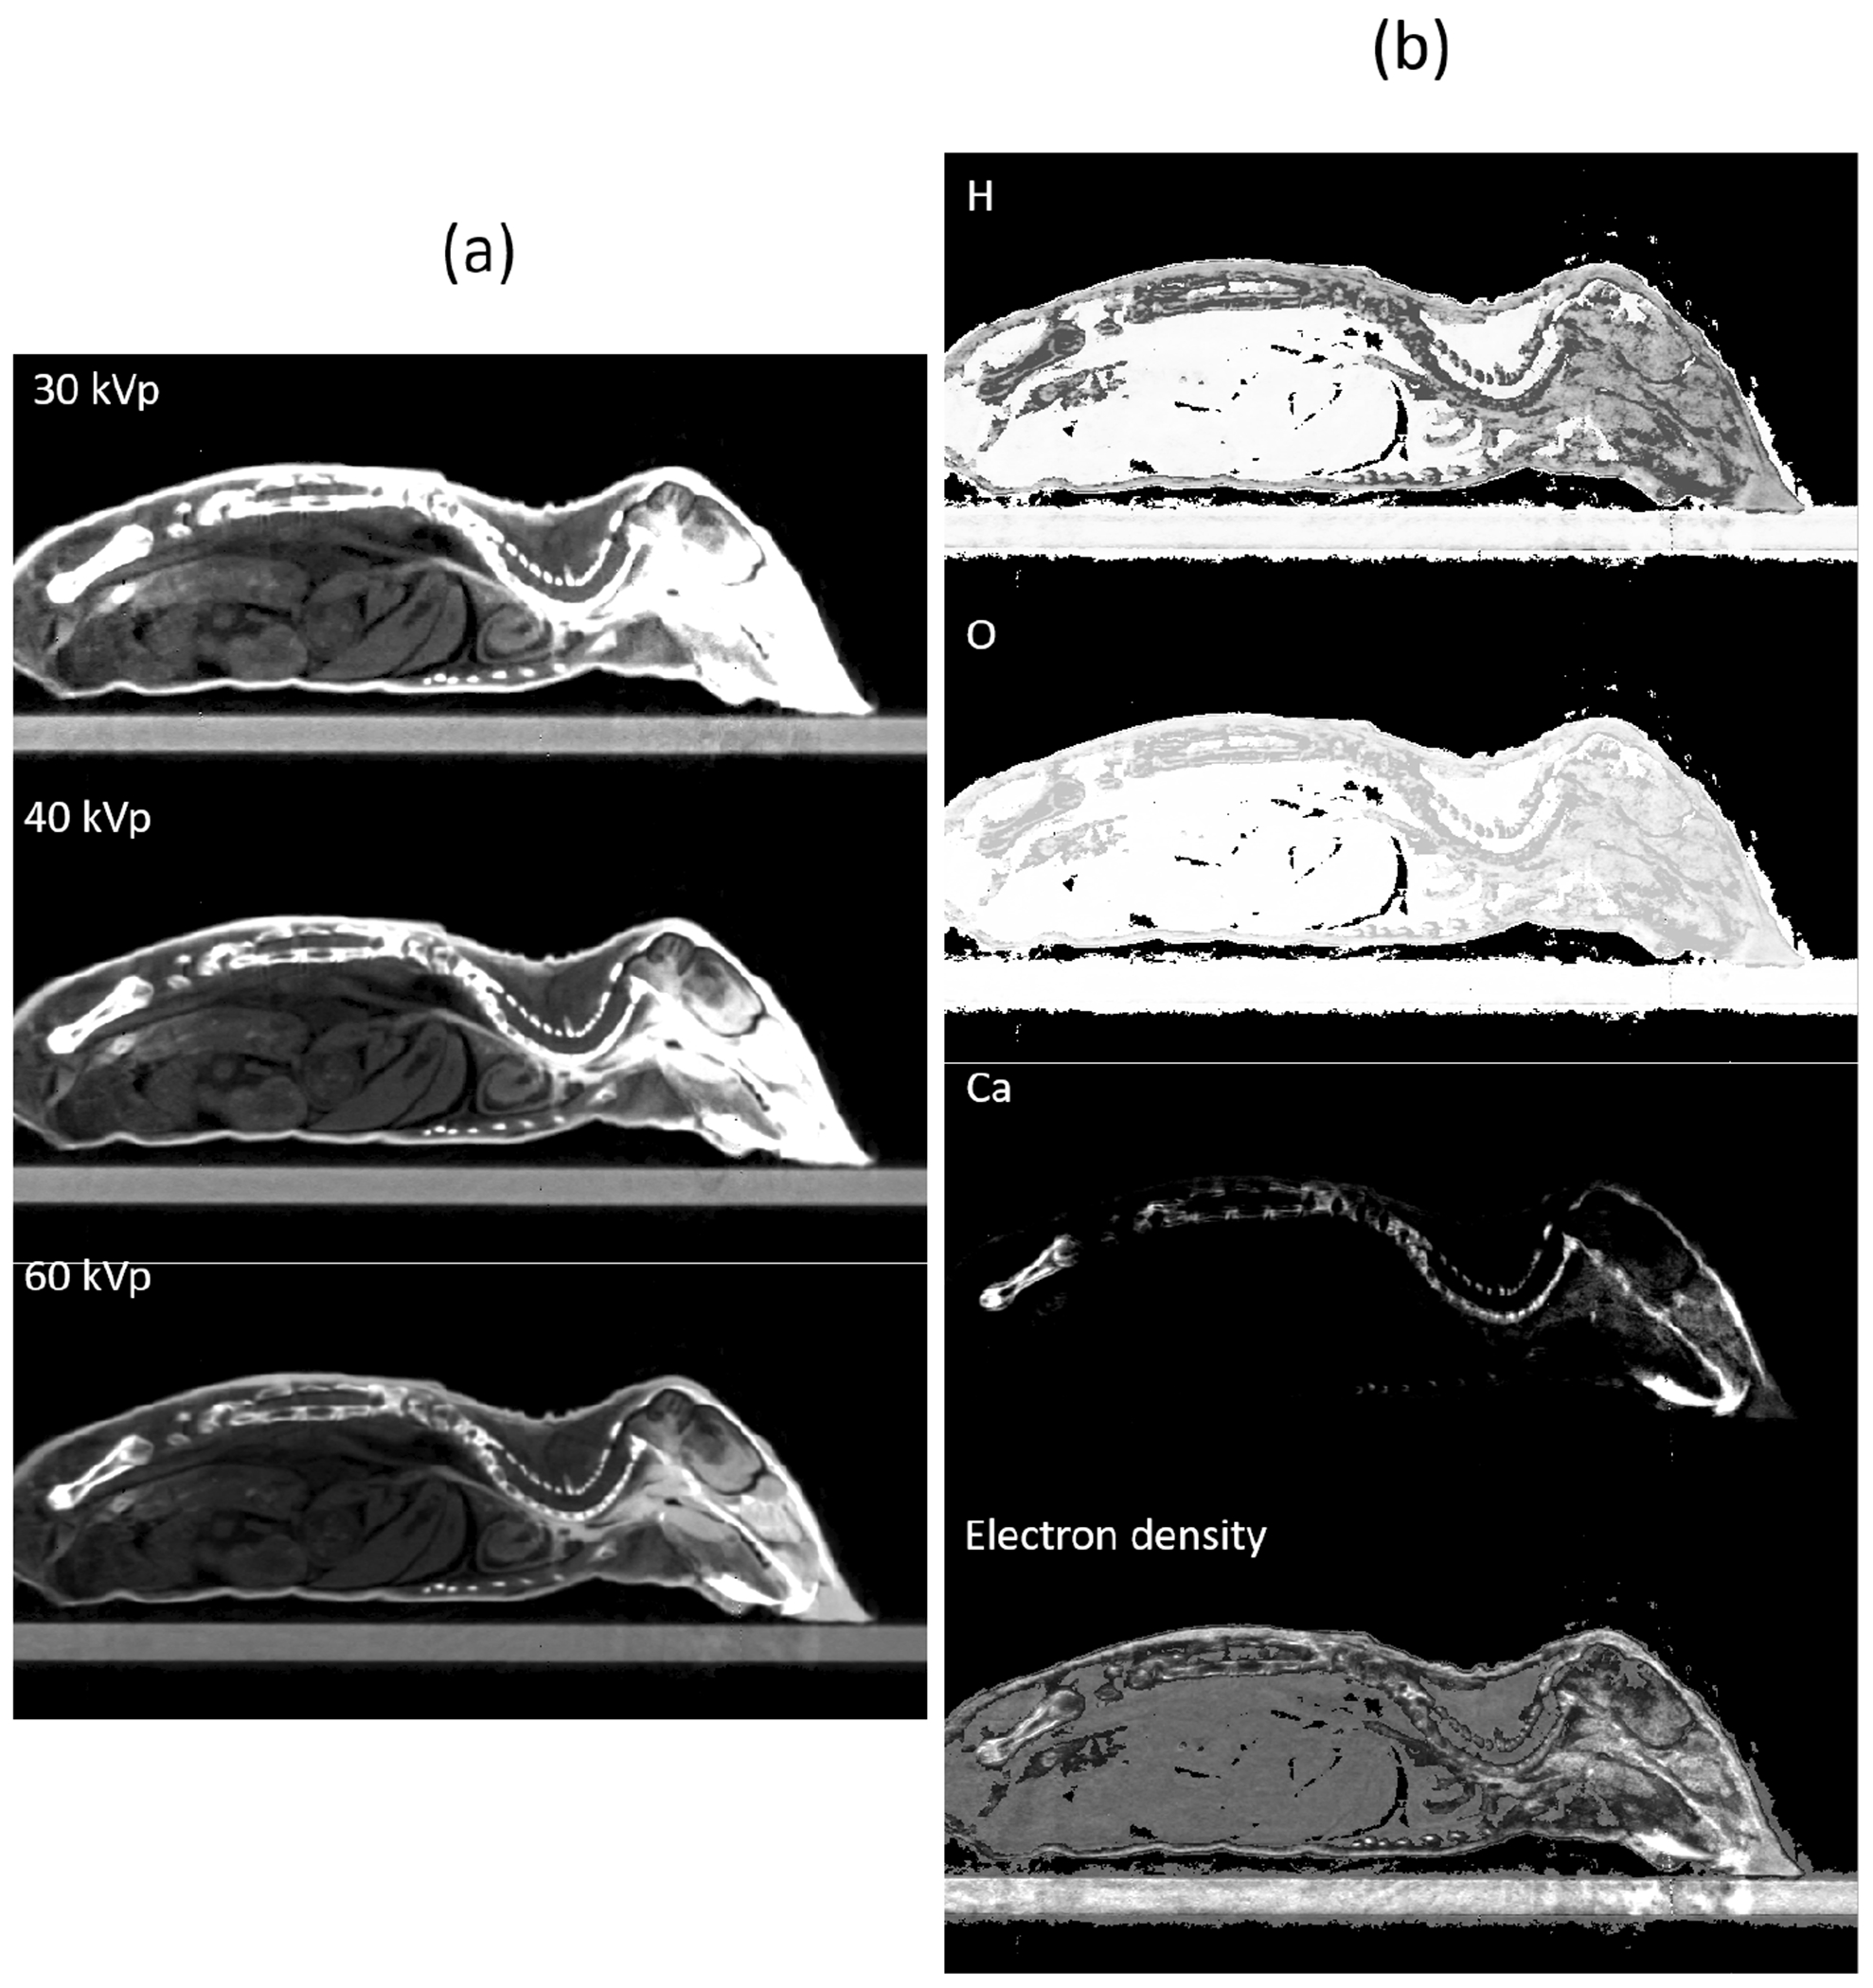
MEER-CBCT results for the plastinated mouse phantom. (a) CT images of three kVp levels. (b) Images of rED and EC fractions.
Compared to Eq. (4), The convex model in Eq. (6) is numerically more attractive and can be solved more efficiently. The computation time was 2.5 min, in contrast to the time 30 min it took to solve the non-convex model in Eq. (4), using MATLAB with a desktop computer equipped with 8 CPU and 24G memory.
3.3. Improvement in dose calculation accuracy
Figure 12 presents the MC dose calculation results on the CT calibration phantom. In tissue regions, dose calculation results based on phantoms generated using MEER-CBCT or CT number conversion were both close to the ground truth. The advantages of MEER-CBCT in terms of dose calculation accuracy appeared in bone regions. Due to increased photo-electric interactions in the kV energy range, doses in those bone inserts are substantially higher than dose to nearby tissues and are sensitive to the material composition. Because of improved accuracy in material composition, MEER-CBCT can reduce dose calculation errors in these areas. Quantitatively, the mean relative errors of dose in the tissue region for the CT number conversion method and for MEER-CBCT were 5.2% and 4.6%, respectively. In the bone region, the error was reduced from 47.5% to 10.9%.
Figure 12.
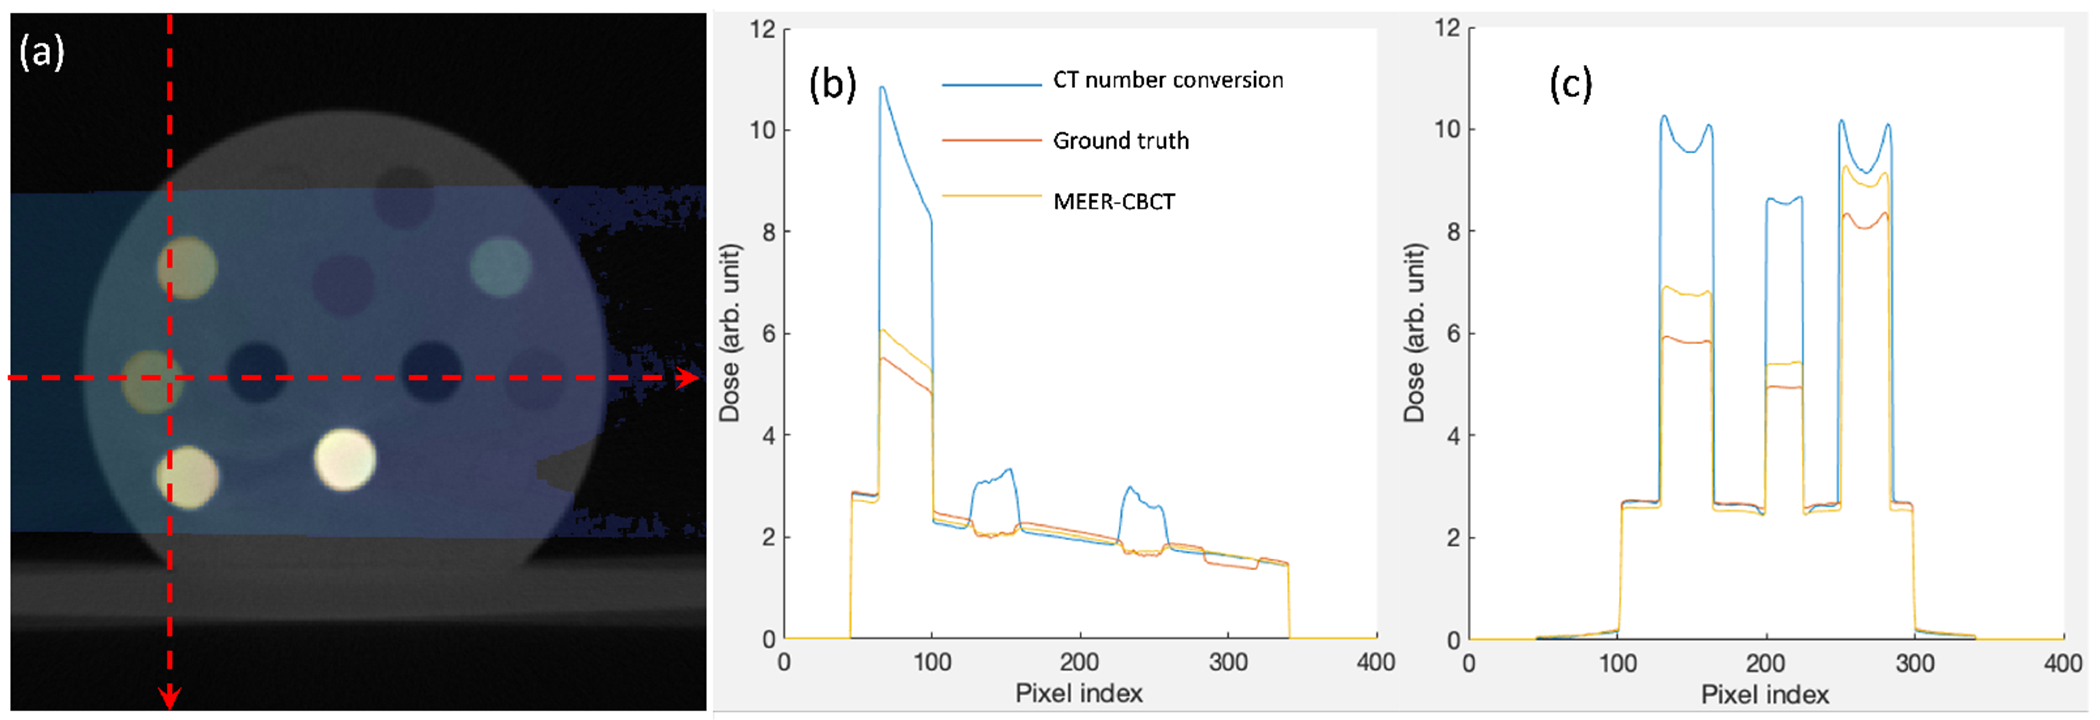
(a) MC dose calculation results overlaied on the CT image of the CT calibration phantom. (b) and (c) are dose profiles along the horizontal and vertical dash lines in (a), respectively.
4. Discussions
CBCT intensity calibration and correction have been extensively studied over the years. In this study, the calibration process followed standard approaches previously reported in literature. While the individual approach may not be new, to our knowledge, this is the first time that these techniques are collectively applied to the CBCT system of a small animal irradiator platform. We demonstrated that the applications of these methods together improved quantitative accuracy of CBCT images, which subsequently enabled accurate material decomposition based on multi-energy CBCT images acquired at different kVp levels, and eventually dose calculation accuracy. Over the years, there have been numerous algorithms and methods developed for these calibration tasks. Lately, with the rapid advances of deep learning (Sahiner et al., 2019; Shen et al., 2020), data-driven correction approaches have also been proposed (Park et al., 2018; Nomura et al., 2019). In future studies, if there is a need to use these algorithms to further improve performance, we will implement them in our CBCT system.
As for geometry calibration and correction, we extended the seminal work from Noo et al. (2000) by including an optimization step to derive geometry parameters for each individual projection angle. Previous studies, including an optimization based approach (Li et al., 2019), have mostly focused on deriving projection-independent calibration parameters, which is applicable to the table top CBCT setting. For gantry mounted CBCT system, geometry calibration parameters usually vary among projection angles due to gravity. Deriving projection-specific geometric parameters usually requires the use of specifically designed phantoms (Cho et al., 2005; Alaei et al., 2000; Daly et al., 2008; Xu et al., 2017). In this study, we solved this problem by using the simple setup with one BB moving to different positions and solving an optimization problem. The effectiveness of the method was demonstrated by the derived variations of geometry parameters (Figure 3) that can be explained by gravity, as well as the improved image quality (Figure 4).
The three kVp levels in this study were empirically chosen. The three kVp levels could be further optimized for the goal of accurate material decomposition and MC-based dose calculation. However, it would be difficult to formulate this as an optimization problem. A comprehensive study enumerating combinations of kVp levels and evaluating the corresponding dose calculation accuracy is probably necessary.
One typical concern in CBCT is the impact of x-ray scatter. In CBCT for human imaging, the strong scatter signal leads to errors in CT number, as well as cupping and other artifacts. In the small animal CBCT context, this is a smaller concern due to several factors. First, the object size is much smaller, which reduces the chance of photon scatter. Second, the low x-ray beam energy increases the chance of photoelectric effect that makes the photon vanish. Hence, the scattered x-ray photon component is reduced. Third, at low energy range, the angular distribution of Compton scattered photons is less forward peaked, reducing the chance of scattered photons reaching the detector. We have performed MC simulation to estimate the primary to scatter ratio in the case of the CT calibration phantom. The average primary to scatter ratio was found to be ~ 1%. Hence, we did not correct for scatter in this study.
Although we have realized multi-energy CBCT function on the small animal irradiator platform and derived rED and EC information using these images, the method has the major limitation of using multiple scans. The motivation for this choice was to realize multi-energy CBCT on existing hardware platform without modifications. Nonetheless, the three sequential CBCT scans with different kVps inevitably increased the scan time. For preclinical small animal radiation experiments, this prolonged scan time increases anesthesia use and hence the risks to the animal subjects. From imaging perspective, the long scan time also increases chances of animal motion, which would cause mismatches of the imaging contents among different scans and hence impede the performance of the material decomposition algorithms. To overcome this limitation, simultaneous multi-energy data acquisition is possible with energy-resolved photon counting detectors (He et al., 2012). We are in the process of installing a photon-counting detector to our small animal irradiation system. Reporting the development with the new detector will be in our future studies.
5. Conclusion
In this study, aiming at improving MC-dose calculation accuracy in pre-clinical small animal irradiation, we implemented MEER CBCT using three scans with 30, 40, and 60 kVps on the CBCT platform of a SmART system, and derived images of rED and EC using a material decomposition algorithm. We performed comprehensive calibrations of the CBCT system to achieve sufficient accuracy for this quantitative imaging purpose. The geometry calibration was performed by scanning a BB phantom and using an analytical method together with an optimization approach to derive gantry-angle specific geometry parameters. We corrected detector lag, glair, and BH effect using standard methods. After these corrections, quality of CBCT images were significantly improved in terms of geometry accuracy, CT number accuracy, and reduction of image artifacts. Using the material decomposition algorithm, in the CT calibration phantom case, median errors in H, O, and Ca fractions for all the inserts were below 1%, 2%, and 4% respectively, while median error in rED was less than 5%. We demonstrated that the intensity correction steps are important to collectively achieve the decomposition accuracy. Compared to standard approach deriving material type and rED via CT number conversion, our approach improved MC-based dose calculation accuracy in bone regions. Mean dose error was reduced from 47.5% to 10.9%.
Acknowledgement
This study is supported in part by grants from National Institutes of Health (R37CA214639, R01CA227289, R01CA237269).
Appendix A. Calibration Methods
Appendix A.1. Geometry correction
The rotation angle η of the detector can be estimated using the centers of the circles traced by the ith and the jth BB’s trajectories projected onto the detector, and , as (Noo et al., 2000):
| (A.1) |
The expression within the angle brackets 〈·〉 depends on the selected BB indices i and j, and hence. Selecting one BB on each side of the x-ray tube rotation plane, there were 20 combinations of BB pairs i, j. The angle brackets 〈·〉 denotes the operation of taking the average value over those η estimated using all BB pairs.
After that, we corrected BB positions for this detection rotation as
| (A.2) |
In the follows, we will remove the superscript * from the corrected BB coordinates to simplify notation.
For the ellipse traced by the ith BB parameterized as , we determined ai, bi, ci, , and by fitting to BB coordinates . Finally, using a pair of the ith and jth BBs, we have
| (A.3) |
where , , , and . zi is the coordinate of the ith BB along the z-axis, i.e. gantry rotation axis, and hence sign(zi) denotes which side the BB is.
Appendix A.2. Intensity corrections
Appendix A.2.1. Detector lag correction
After turning on the x-ray beam, the average intensity of a region of interest (ROI) of the kth frame I(k) can be written as , with being the lag-corrected projection image. The subscript l indicates the lag correction. L(m) is the lag-response function, denoting the lag effect caused by a projection on the mth frame prior to a given projection. Since the first frame is not affected by any other frames, . Thus, we can get
| (A.4) |
With this scheme, the detector lag-response L(1), L(2), …, L(k) can be obtained sequentially from the measured projections I(1), I(2), …, I(k). The response function obtained as such may be affected by measurement noise. We hence fit L(k) in a double-exponential form:
| (A.5) |
where L0, A1, A2, t1 and t2 are fitting coefficients. Once the lag function was determined, it can be used to correct measured projections of a CBCT scan as
| (A.6) |
Appendix A.2.2. Veiling glare correction
We first computed the LSF by using a finite difference scheme to compute derivative of the edge spread function expressed as the correspondence between image intensity of each pixel and the distance from the pixel center to the edge line (Poludniowski et al., 2011). To reduce noise in the result, we fit LSF as a sum of a Gaussian and a Lorentzian form, representing the short-range blur and long-range veiling glare, respectively:
| (A.7) |
where p, q1 and q2 are fitting parameters. Note that the LSF in the form of Eq. (A.7) meets the normalization condition. Under the assumption of a stationary and circularly symmetric system, the PSF can be obtained from the above LSF fitting function according to the relation , with , which leads to
| (A.8) |
Once the PSF was determined, we corrected the projection via a deconvolution operation
| (A.9) |
where Igc(x, y) is the glare-corrected image, with g indicating the glare correction. I(x, y) is the uncorrected image. FFT and FFT−1 are 2D fast Fourier transform and its inverse, respectively. ϵ is a small positive number introduced to avoid noise amplification.
Appendix A.2.3. Beam hardening correction
For a given x-ray line corresponding to a pixel on the detector, we computed measured x-ray attenuation under the polychromatic beam , where Ipoly and I0 are the pixel intensities of the CBCT scan and air scan after the aforementioned correction steps, respectively. The BH corrected attenuation can be written as ABHc = Apoly+ΔA(Lwater, Lbone), with ΔA denoting the correction term. It is a function of Lwater and Lbone, geometric lengths of this x-ray line intersecting with the two materials. Using the CT calibration phantom, we segmented the phantom into the two materials using a threshold based method and performed GPU-based ray tracing to compute ΔA as a function of (Lwater, Lbone)
| (A.10) |
n = 1 or 2 indicates water or bone, li is the intersection length of the voxel i and the x-ray line, and sn,i = 1 or 0 implies whether the voxel i contains the material n or not. μn(E) is the total linear attenuation coefficient of material n under energy E, which were obtained from the NIST database (Hubbell and Seltzer, 1995). The energy spectrum ψ(Ee) was computed by using SpekCalc (Poludniowski and Evans, 2007; Poludniowski, 2007).
To correct an acquired x-ray projection image, we firstly reconstructed the CBCT image using the uncorrected projection data and segmented the image into water and bone using a threshold method with empirically defined threshold values. Then we calculated geometric length of each x-ray line intersecting with the two materials using the ray-tracing calculation. Finally, the BH correction term ΔA was obtained by looking up the constructed table, which was then applied to the measured polyenergetic x-ray attenuation to correct the effect.
References
- Alaei Parham, Gerbi Bruce J, and Geise Richard A. Evaluation of a model-based treatment planning system for dose computations in the kilovoltage energy range. Medical physics, 27(12):2821–2826, 2000. [DOI] [PubMed] [Google Scholar]
- Ashton Jeffrey R, West Jennifer L, and Badea Cristian T. In vivo small animal micro-ct using nanoparticle contrast agents. Frontiers in pharmacology, 6:256, 2015. [DOI] [PMC free article] [PubMed] [Google Scholar]
- Bazalova Magdalena, Carrier Jean-François, Beaulieu Luc, and Verhaegen Frank. Dual-energy ct-based material extraction for tissue segmentation in monte carlo dose calculations. Physics in Medicine & Biology, 53(9):2439, 2008. [DOI] [PubMed] [Google Scholar]
- Berbeco Ross I, Ngwa Wilfred, and Makrigiorgos G Mike. Localized dose enhancement to tumor blood vessel endothelial cells via megavoltage x-rays and targeted gold nanoparticles: new potential for external beam radiotherapy. International Journal of Radiation Oncology* Biology* Physics, 81(1):270–276, 2011. [DOI] [PubMed] [Google Scholar]
- Berbeco Ross I, Korideck Houari, Ngwa Wilfred, Kumar Rajiv, Patel Janki, Sridhar Srinivas, Johnson Sarah, Price Brendan D, Kimmelman Alec, and Makrigiorgos G Mike. Dna damage enhancement from gold nanoparticles for clinical mv photon beams. Radiation research, 178(6):604–608, 2012. [DOI] [PMC free article] [PubMed] [Google Scholar]
- Boyd Stephen, Parikh Neal, Chu Eric, Peleato Borja, Eckstein Jonathan, et al. Distributed optimization and statistical learning via the alternating direction method of multipliers. Foundations and Trends ® in Machine learning, 3(1): 1–122, 2011. [Google Scholar]
- Cho Youngbin, Moseley Douglas J, Siewerdsen Jeffrey H, and Jaffray David A. Accurate technique for complete geometric calibration of cone-beam computed tomography systems. Medical physics, 32(4):968–983, 2005. [DOI] [PubMed] [Google Scholar]
- R Clarkson, Lindsay PE, Ansell S, Wilson G, Jelveh S, Hill RP, and Jaffray DA. Characterization of image quality and image-guidance performance of a preclinical microirradiator. Medical physics, 38(2):845–856, 2011. [DOI] [PMC free article] [PubMed] [Google Scholar]
- Daly MJ, Siewerdsen JH, Cho YB, Jaffray DA, and Irish JC. Geometric calibration of a mobile c-arm for intraoperative cone-beam ct. Medical physics, 35(5):2124–2136, 2008. [DOI] [PMC free article] [PubMed] [Google Scholar]
- Ding Aiping, Gu Jianwei, Trofimov Alexei V, and Xu X George. Monte carlo calculation of imaging doses from diagnostic multidetector ct and kilovoltage conebeam ct as part of prostate cancer treatment plans. Medical physics, 37(12):6199–6204, 2010. [DOI] [PMC free article] [PubMed] [Google Scholar]
- Ding George X and Coffey Charles W. Radiation dose from kilovoltage cone beam computed tomography in an image-guided radiotherapy procedure. International Journal of Radiation Oncology* Biology* Physics, 73(2):610–617, 2009. [DOI] [PubMed] [Google Scholar]
- Feldkamp Lee A, Davis Lloyd C, and Kress James W. Practical cone-beam algorithm. Josa a, 1(6):612–619, 1984. [Google Scholar]
- PV Granton, Pollmann SI, Ford NL, Drangova M, and Holdsworth DW. Implementation of dual-and triple-energy cone-beam micro-ct for postreconstruction material decomposition. Medical physics, 35(11):5030–5042, 2008. [DOI] [PubMed] [Google Scholar]
- Hainfeld James F, Dilmanian F Avraham, Slatkin Daniel N, and Smilowitz Henry M. Radiotherapy enhancement with gold nanoparticles. Journal of pharmacy and pharmacology, 60(8):977–985, 2008. [DOI] [PubMed] [Google Scholar]
- He Peng, Yu Hengyong, Thayer Patrick, Jin Xin, Xu Qiong, Bennett James, Tappenden Rachael, Wei Biao, Goldstein Aaron, Renaud Peter, et al. Preliminary experimental results from a mars micro-ct system. Journal of X-ray Science and Technology, 20(2):199–211, 2012. [DOI] [PMC free article] [PubMed] [Google Scholar]
- Hubbell John H and Seltzer Stephen M. Tables of x-ray mass attenuation coefficients and mass energy-absorption coefficients 1 kev to 20 mev for elements z= 1 to 92 and 48 additional substances of dosimetric interest. Technical report, National Inst. of Standards and Technology-PL, Gaithersburg, MD (United: …, 1995. [Google Scholar]
- Jaffray David A, Siewerdsen Jeffrey H, Wong John W, and Martinez Alvaro A. Flat-panel cone-beam computed tomography for image-guided radiation therapy. International Journal of Radiation Oncology* Biology* Physics, 53(5):1337–1349, 2002. [DOI] [PubMed] [Google Scholar]
- Jia Xun, Lou Yifei, Li Ruijiang, Song William Y, and Jiang Steve B. Gpu-based fast cone beam ct reconstruction from undersampled and noisy projection data via total variation. Medical physics, 37(4):1757–1760, 2010. [DOI] [PubMed] [Google Scholar]
- Jia Xun, Yan Hao, Gu Xuejun, and Jiang Steve B. Fast monte carlo simulation for patient-specific ct/cbct imaging dose calculation. Physics in Medicine & Biology, 57(3):577, 2012. [DOI] [PubMed] [Google Scholar]
- Kachelriß Marc, Berkus Timo, Stenner Philip, and Kalender Willi A. Empirical dual energy calibration (edec) for cone-beam computed tomography. In 2006 IEEE Nuclear Science Symposium Conference Record, volume 4, pages 2546–2550. IEEE, 2006. [Google Scholar]
- Karolczak Marek, Schaller Stefan, Engelke Klaus, Lutz Andreas, Taubenreuther Ulrike, Wiesent Karl, and Kalender Willi. Implementation of a cone-beam reconstruction algorithm for the single-circle source orbit with embedded misalignment correction using homogeneous coordinates. Medical physics, 28(10): 2050–2069, 2001. [DOI] [PubMed] [Google Scholar]
- Knöös Tommy, Nilsson Mats, and Ahlgren Lars. A method for conversion of hounsfield number to electron density and prediction of macroscopic pair production cross-sections. Radiotherapy and Oncology, 5(4):337–345, 1986. doi: 10.1016/S0167-8140(86)80183-9. URL https://www.sciencedirect.com/science/article/pii/S0167814086801839. [DOI] [PubMed] [Google Scholar]
- Li Guang, Luo Shouhua, You Chenyu, Getzin Matthew, Zheng Liang, Wang Ge, and Gu Ning. A novel calibration method incorporating nonlinear optimization and ball-bearing markers for cone-beam ct with a parameterized trajectory. Medical Physics, 46(1):152–164, 2019. [DOI] [PubMed] [Google Scholar]
- Mail N, Moseley DJ, Siewerdsen JH, and Jaffray DA. An empirical method for lag correction in cone-beam ct. Medical physics, 35(11):5187–5196, 2008. [DOI] [PubMed] [Google Scholar]
- McCollough Cynthia H, Leng Shuai, Yu Lifeng, and Fletcher Joel G. Dual-and multi-energy ct: principles, technical approaches, and clinical applications. Radiology, 276(3):637–653, 2015. [DOI] [PMC free article] [PubMed] [Google Scholar]
- Montanari D, Scolari E, Silvestri C, Graves CYJ, Rice R, Cervino L, Steve BJ, and Jia X. Cone beam ct dose assessments using monte carlo simulations phys. Med. Biol, 59:1239, 2014. [DOI] [PubMed] [Google Scholar]
- Ngwa Wilfred, Kumar Rajiv, Sridhar Srinivas, Korideck Houari, Zygmanski Piotr, Cormack Robert A, Berbeco Ross, and Makrigiorgos G Mike. Targeted radiotherapy with gold nanoparticles: current status and future perspectives. Nanomedicine, 9(7):1063–1082, 2014. [DOI] [PMC free article] [PubMed] [Google Scholar]
- Nomura Yusuke, Xu Qiong, Shirato Hiroki, Shimizu Shinichi, and Xing Lei. Projection-domain scatter correction for cone beam computed tomography using a residual convolutional neural network. Medical physics, 46(7):3142–3155, 2019. [DOI] [PMC free article] [PubMed] [Google Scholar]
- Noo Frédéric, Clackdoyle Rolf, Mennessier Catherine, White Timothy A, and Roney Timothy J. Analytic method based on identification of ellipse parameters for scanner calibration in cone-beam tomography. Physics in Medicine & Biology, 45(11):3489, 2000. [DOI] [PubMed] [Google Scholar]
- Park Hyoung Suk, Lee Sung Min, Kim Hwa Pyung, Seo Jin Keun, and Chung Yong Eun. Ct sinogram-consistency learning for metal-induced beam hardening correction. Medical physics, 45(12):5376–5384, 2018. [DOI] [PubMed] [Google Scholar]
- Poludniowski G, Evans PM, Kavanagh A, and Webb S. Removal and effects of scatter-glare in cone-beam ct with an amorphous-silicon flat-panel detector. Physics in Medicine & Biology, 56(6):1837, 2011. [DOI] [PubMed] [Google Scholar]
- Poludniowski Gavin G. Calculation of x-ray spectra emerging from an x-ray tube. part ii. x-ray production and filtration in x-ray targets. Medical physics, 34 (6Part1):2175–2186, 2007. [DOI] [PubMed] [Google Scholar]
- Poludniowski Gavin G and Evans Philip M. Calculation of x-ray spectra emerging from an x-ray tube. part i. electron penetration characteristics in x-ray targets. Medical physics, 34(6Part1):2164–2174, 2007. [DOI] [PubMed] [Google Scholar]
- Rutherford RA, Pullan BR, and Isherwood I. Measurement of effective atomic number and electron density using an emi scanner. Neuroradiology, 11(1):15–21, 1976. [DOI] [PubMed] [Google Scholar]
- Sahiner Berkman, Pezeshk Aria, Hadjiiski Lubomir M, Wang Xiaosong, Drukker Karen, Cha Kenny H, Summers Ronald M, and Giger Maryellen L. Deep learning in medical imaging and radiation therapy. Medical physics, 46(1):e1–e36, 2019. [DOI] [PMC free article] [PubMed] [Google Scholar]
- Schneider Wilfried, Bortfeld Thomas, and Schlegel Wolfgang. Correlation between ct numbers and tissue parameters needed for monte carlo simulations of clinical dose distributions. Physics in Medicine & Biology, 45(2):459, 2000. [DOI] [PubMed] [Google Scholar]
- Shen Chenyang, Li Bin, Chen Liyuan, Yang Ming, Lou Yifei, and Jia Xun. Material elemental decomposition in dual and multi-energy ct via a sparsity-dictionary approach for proton stopping power ratio calculation. Medical physics, 45(4): 1491–1503, 2018a. [DOI] [PMC free article] [PubMed] [Google Scholar]
- Shen Chenyang, Li Bin, Lou Yifei, Yang Ming, Zhou Linghong, and Jia Xun. Multienergy element-resolved cone beam ct (meer-cbct) realized on a conventional cbct platform. Medical physics, 45(10):4461–4470, 2018b. [DOI] [PMC free article] [PubMed] [Google Scholar]
- Shen Chenyang, Nguyen Dan, Zhou Zhiguo, Jiang Steve B, Dong Bin, and Jia Xun. An introduction to deep learning in medical physics: advantages, potential, and challenges. Physics in Medicine & Biology, 65(5):05TR01, 2020. [DOI] [PMC free article] [PubMed] [Google Scholar]
- Siewerdsen JH and Jaffray DA. A ghost story: Spatio-temporal response characteristics of an indirect-detection flat-panel imager. Medical physics, 26(8): 1624–1641, 1999. [DOI] [PubMed] [Google Scholar]
- Van Aarle Wim, Palenstijn Willem Jan, Cant Jeroen, Janssens Eline, Bleichrodt Folkert, Dabravolski Andrei, De Beenhouwer Jan, Batenburg K Joost, and Sijbers Jan. Fast and flexible x-ray tomography using the astra toolbox. Optics express, 24(22):25129–25147, 2016. [DOI] [PubMed] [Google Scholar]
- Van Gompel Gert, Van Slambrouck Katrien, Defrise Michel, Batenburg K Joost, de Mey Johan, Sijbers Jan, and Nuyts Johan. Iterative correction of beam hardening artifacts in ct. Medical physics, 38(S1):S36–S49, 2011. [DOI] [PubMed] [Google Scholar]
- Verhaegen Frank, Granton Patrick, and Tryggestad Erik. Small animal radiotherapy research platforms. Physics in Medicine & Biology, 56(12):R55, 2011. [DOI] [PubMed] [Google Scholar]
- Xu Yuan, Yang Shuai, Ma Jianhui, Li Bin, Wu Shuyu, Qi Hongliang, and Zhou Linghong. Simultaneous calibration phantom commission and geometry calibration in cone beam ct. Physics in Medicine & Biology, 62(17):N375, 2017. [DOI] [PubMed] [Google Scholar]
- Yang Kai, Kwan Alexander LC, Miller DeWitt F, and Boone John M. A geometric calibration method for cone beam ct systems. Medical physics, 33(6Part1):1695–1706, 2006. [DOI] [PMC free article] [PubMed] [Google Scholar]


