Abstract
From birth to adulthood, an animal’s nervous system changes as its body grows and its behaviours mature [1–8]. The form and extent of circuit remodelling across the connectome is unknown [3, 9–15]. We used serial-section electron microscopy to reconstruct the full brain of eight isogenic C. elegans individuals across postnatal stages to learn how it changes with age. The overall geometry of the brain is preserved from birth to adulthood. Upon this constant scaffold, substantial changes in chemical synaptic connectivity emerge. Comparing connectomes among individuals reveals substantial connectivity differences that make each brain partly unique. Comparing connectomes across maturation reveals consistent wiring changes between different neurons. These changes alter the strength of existing connections and create new connections. Collective changes in the network alter information processing. Over development, the central decision-making circuitry is maintained whereas sensory and motor pathways substantially remodel. With age, the brain progressively becomes more feedforward and discernibly modular. Developmental connectomics reveals principles that underlie brain maturation.
Introduction
The developing nervous system faces many challenges. Amid an animal’s changing anatomy and fluctuating environment, some circuits maintain robust outputs, such as locomotion [1–3]. New circuits are constructed to support new functions, such as reproduction [4,5]. To adapt and learn, the nervous system modifies circuits in response to internal and external cues [6]. In many organisms, adaptive mechanisms have been identified that coincide with aspects of behavioral maturation (see Extended Discussion) [7, 8]. However, developmental principles for the collective synaptic changes that shape the adult brain are unknown.
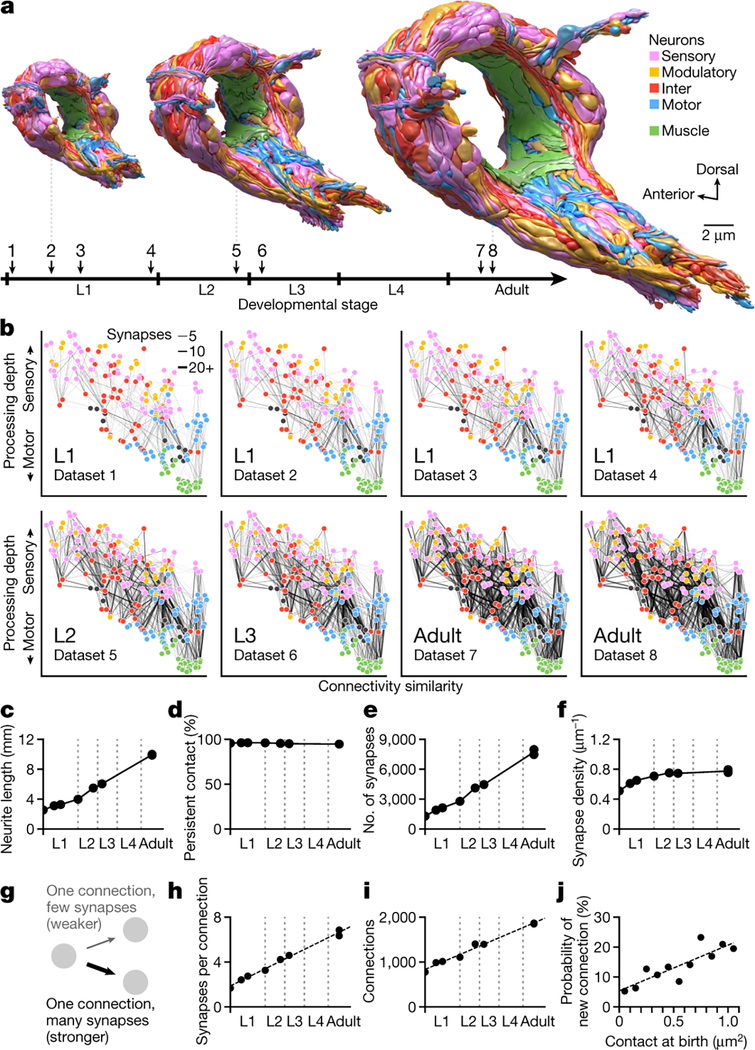
Serial-section electron microscopy (EM) has been used to reconstruct neural circuits with synapse resolution across species (see Extended Discussion) [3, 9–15]. We leveraged advances in EM reconstruction to study the entire brain of C. elegans - its circumpharyngeal nerve ring and ventral ganglion - across development (Extended Data - Figure 1a, Methods). We fully reconstructed the brains of eight isogenic hermaphrodites at different postembryonic ages, from hatching (birth) to adulthood (Fig. 1a, Supplementary Figure S1, Video 1,2). For each developmental timepoint, we quantified the length, shape, and position of every neural and muscle fibre in the nerve ring. We mapped every physical contact between neurons and muscles, as well as every chemical synapse between neurons, muscles, and glia to generate a connectome (Fig. 1b, Extended Data - Figure 2, Extended Data - Table, Supplementary Tables 1–5, Methods). Our comparison of developmental connectomes reveals principles by which synaptic changes shape the mind of a developing worm.
Figure 1. The developing brain maintains overall geometry with increasing numbers of synapses and connections.
a. Developmental timeline of eight reconstructed individuals. Volumetric models of the brain, coloured by cell types, shown at three stages. b. Wiring diagrams for eight individuals. Each circle represents a cell. Each line represents a connection between two cells with at least one chemical synapse. Vertical axis denotes signaling from sensory perception (top) to motor actuation (bottom). Horizontal axis denotes connectivity similarity – neurons that share partners are positioned more closely [20]. Signal flow and connectivity similarity are based on accumulated connections from all datasets. c. Summed length of all neurites in each brain. d. Persistent physical contact, the summed physical contact between neurite pairs that exist at birth and persists into adulthood, accounts for nearly all contact areas at all stages. e. Total synapse numbers in each brain.
f. Synapse density, the total number of synapses divided by total neurite length.g. Schematic of weak vs strong connections. Each connection contains at least one synapse between two cells. h. Mean number of synapses per connection existing from birth. i. Total number of connections in each brain. j. Probability of forming a new connection at physical contacts existing from birth. A connection is called new when it is absent in early L1 stages (datasets 1 and 2) and present in adults (datasets 7 and 8). *** r = 0.87, p = 4.5×10⁻⁴, Two-sided Spearman’s rank correlation.
Uniform growth and stable brain geometry
We found that uniform neurite growth maintains brain geometry. The shape and relative position of every neurite in the brain was largely established by birth (Extended Data - Figure 1b, 3). From birth to adulthood, the total length of neurites increased 5-fold (Fig. 1c), similar to the 5-fold increase in body length (~250μm to ~1150μm). Neurites grew proportionally (Extended Data - Figure 1b), maintaining physical contact between cells that were present at birth across maturation (Fig. 1d, Extended Data - Figure 1b) with a few exceptions (Supplemental Figure S2, Video 3). Thus, the brain grows uniformly in size and maintains its overall geometry without substantially changing the shape or relative position of neurites.
The total number of chemical synapses increased 6-fold (~1300 at birth to ~8000 in adults) (Fig. 1e). Except for the first larval stage (L1), synapse number increased in proportion to neurite length, maintaining synapse density across development (Fig. 1f). The increase in synapse density during L1 coincided with the increase in left-right wiring symmetry (Extended Data - Figure 1d,e). In the adult, ~90% of neurons are left-right symmetric pairs in position, morphology, and connectivity [9]. Some of these neurons exhibited left-right asymmetry in connectivity at birth (Extended Data - Figure 1d,e). One interpretation of early asymmetry is incompleteness: C. elegans hatches before the L1 connectome is made symmetric by adding synapses after birth.
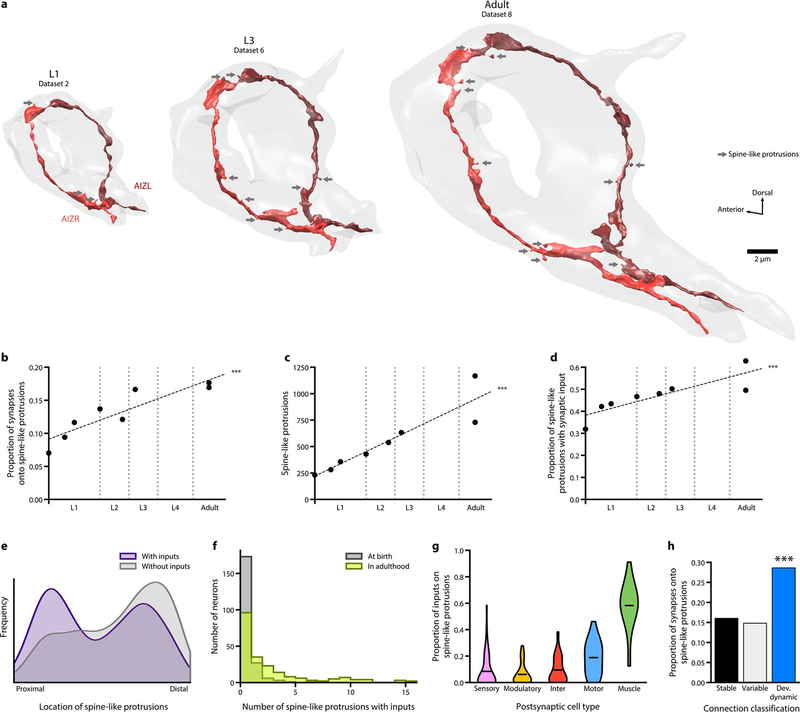
Additional growth occurred as small spine-like protrusions along many neurites and muscle processes. They increased 5-fold after birth, contributing 17% of synapses in the adult connectome (Extended Data - Figure 4).
Non-uniform synapse addition
From birth to adulthood, we found that non-uniform synapse addition reshapes the connectome. New synapses create new connections and strengthen existing connections. We define a connection as a pair of cells connected by one or more chemical synapses (Fig. 1g). At birth, the brain’s 204 cells were interconnected by ~1300 synapses among ~800 connections. Over maturation, ~4500 new synapses strengthened most connections that were present at birth. The mean synapse number per connection increased from 1.7 at birth to 6.9 at adulthood (Fig. 1h). Approximately 1200 new synapses formed new connections between previously non-connected cells, resulting in a 2.4-fold increase from the number of connections at birth (Fig. 1i).
Synapse addition did not occur uniformly across the brain. Preferential synapse addition occurred in multiple contexts. First, new connections were more likely to form between neurons that shared larger physical contact areas at birth (Fig. 1j). Thus, physical contacts at birth form a constant scaffold upon which network formation unfolds.
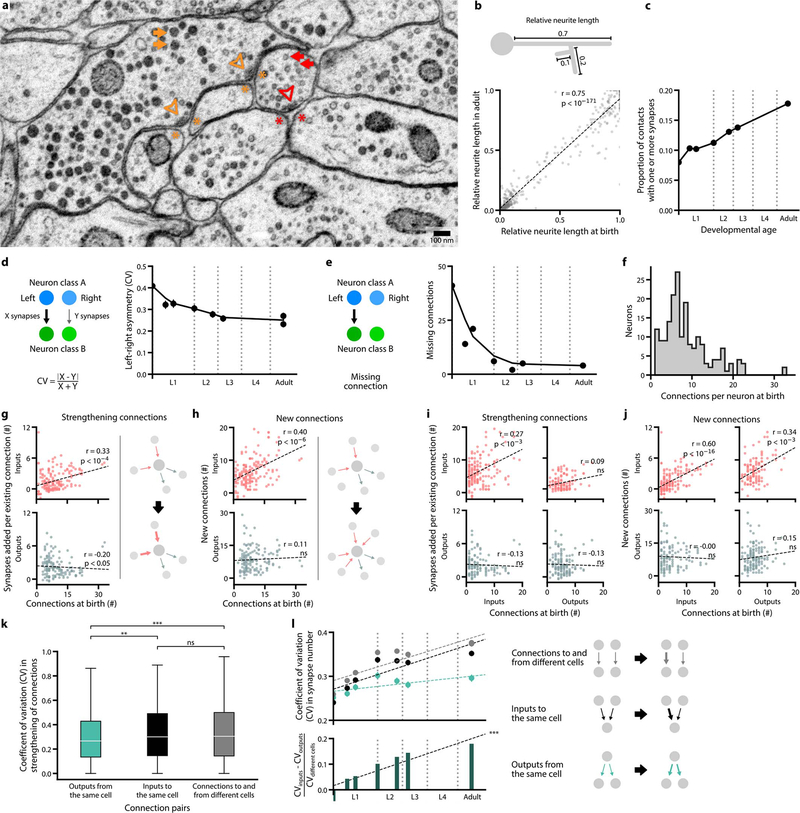
Second, synapse addition preferentially strengthened inputs to “hub” neurons, neurons with already more connections at birth (Extended Data - Figure 1f). Hub neurons disproportionately strengthened existing input connections over time and disproportionately established more new input connections. However, hub neurons did not disproportionately increase their outputs (Extended Data - Figure 1g,h). Thus, maturation progressively focuses the flow of information onto the most highly-connected neurons at birth.
Third, synapse addition selectively strengthened a cell’s individual connections. We found no correlation in the strengthening of existing input connections to each cell from different presynaptic partners, leading to divergence in the relative strengths of different inputs (Extended Data - Figure 1i–l). However, strengthening of the existing output connections from each cell was correlated, thereby maintaining relative strengths during development (Extended Data - Figure 1k,l). Thus, each cell appears to regulate the strengthening of its outputs but not its inputs.
Unlike mammals where synapse pruning is a hallmark of early development, we did not observe systematic synapse elimination. In the C. elegans brain, synaptic connections are rarely removed; instead, a diminished connection is mediated by selectively strengthening other connections.
Stereotyped and variable connections
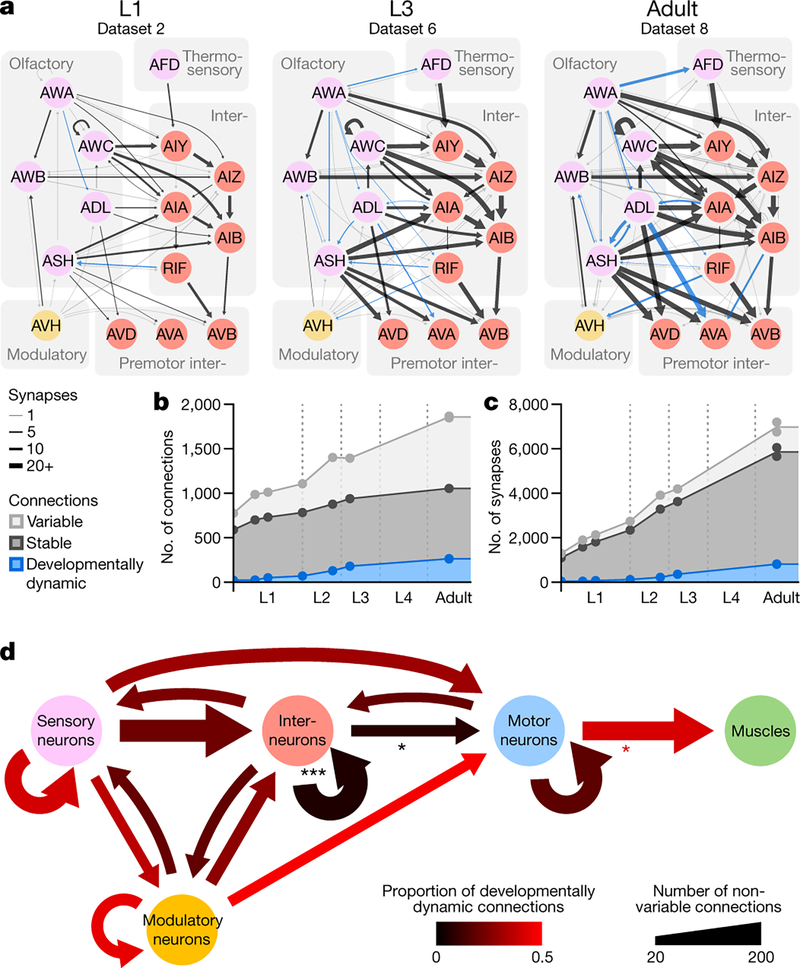
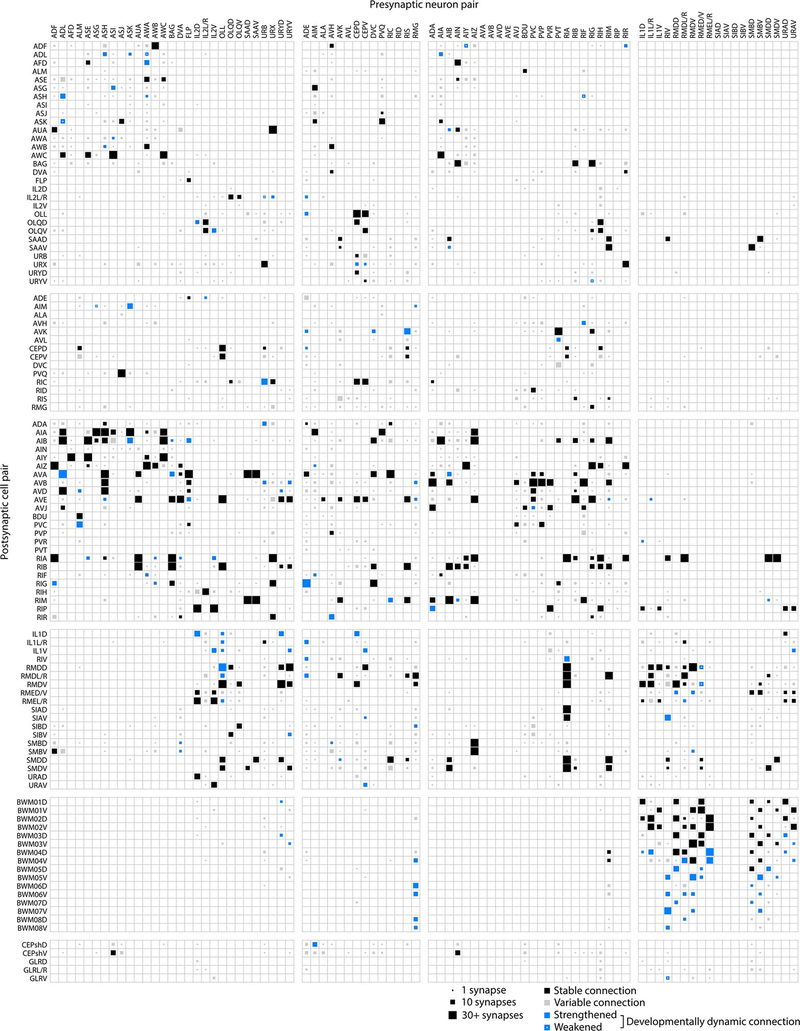
We found that isogenic animals exhibited both stereotyped and variable connections. We mapped the change in synapse number for each connection across development, and thereby classified each connection as stable, developmentally dynamic, or variable (Fig. 2a, Extended Data - Figure 5, Supplementary Table 6, Methods). Stable connections were present from birth to adulthood and maintained their relative strengths. Developmentally dynamic connections significantly increased or decreased their relative strengths in a stereotyped manner, sometimes forming new connections or more rarely eliminating connections at specific life stages. Variable connections exhibited no consistent trend in synapse number and were not present in every animal.
Figure 2. Connectomes of isogenic individuals have both stereotyped and variable connections.
a. Example of a sensory sub-circuit across maturation. Circles represent cells, colour-coded by cell types. Lines colour-code stable (black), developmentally dynamic (blue), and variable (grey) connections. b. Total number of stable, developmentally dynamic, and variable connections across maturation. c. Total number of synapses in stable, developmentally dynamic and variable connections across maturation. d. Wiring diagram with invariant (stable and developmentally dynamic) connections between different cell types. Connections with statistically significantly different proportions of developmentally dynamic connections are denoted, * p (motor-muscle) = 3.2×10⁻², * p (inter-motor) = 4.2×10⁻², *** p = 2.0×10⁻⁵, two-tailed Z-test, FDR adjusted using Benjamini–Hochberg correction (ninter−inter = 160, ninter−motor = 52, nmotor−muscle = 145).
In the adult connectome, stable and variable connections each represented ~43% of total connections. Developmentally dynamic connections represented ~14% (Fig. 2b). We observed similar partitions when connections were classified by synapse size (Extended Data - Figure 6a), suggesting that synapse number is a good proxy for synapse size.
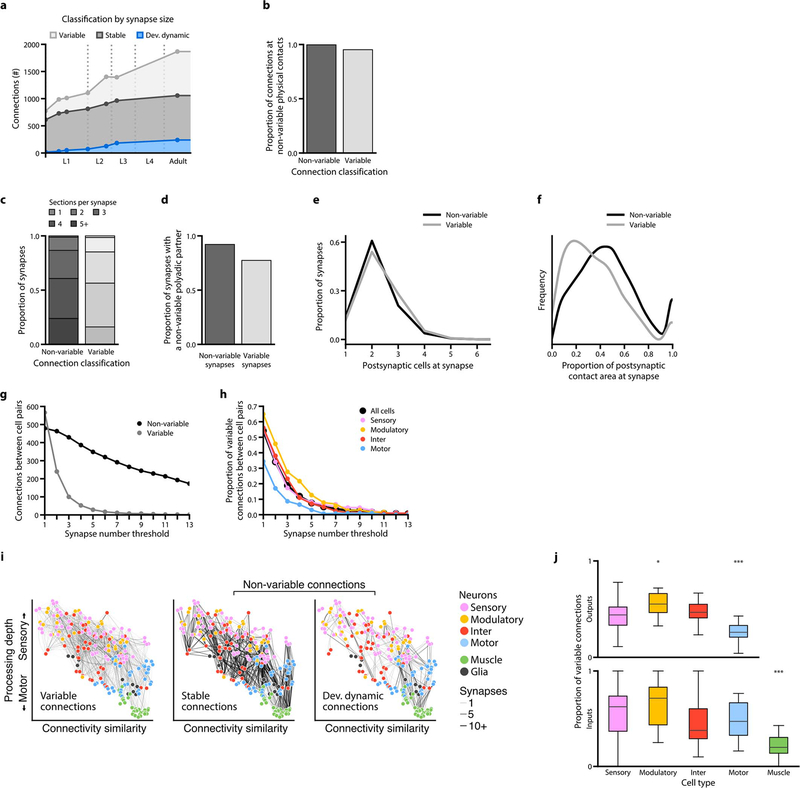
Stable connections contained more synapses than variable ones (6.6±5.8 versus 1.4±1.0 synapses per connection, in adults), and constituted a large proportion (~72%) of total synapses (Fig. 2c). Nonetheless, variable connections were common. Like other connections, most variable connections formed at cell contacts already existing at birth (Extended Data - Figures 3, 5, 6b). Prevalence of variable connections is not due to fortuitous synapse annotation between adjacent neurites (Extended Data - Figure 6c–f).
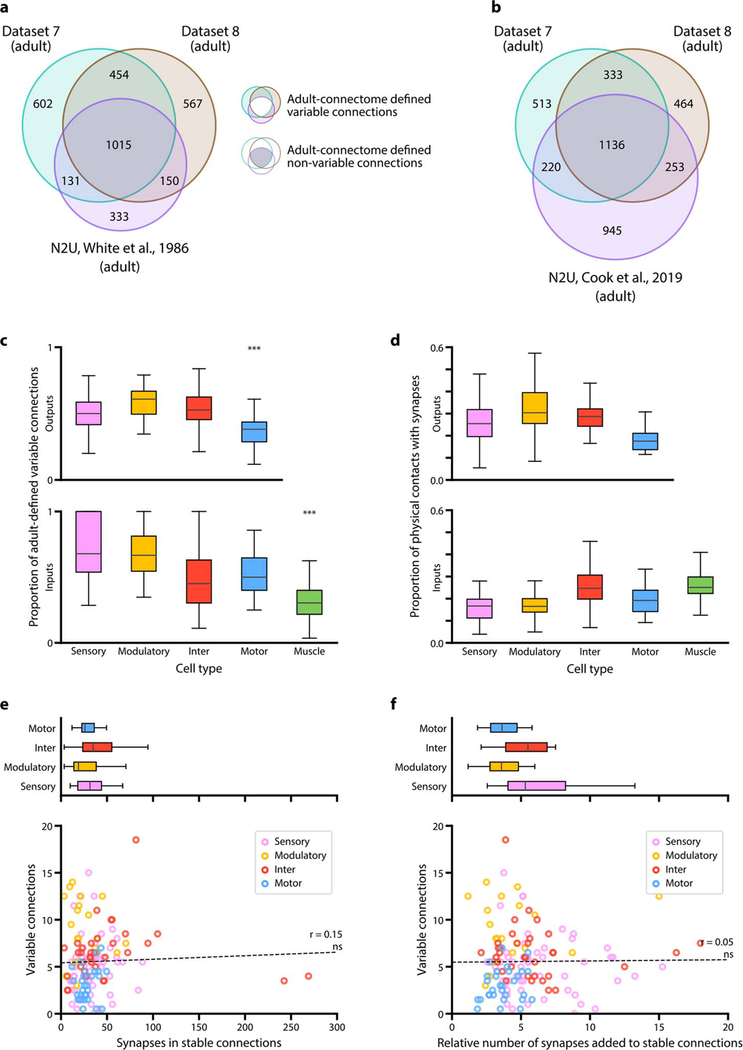
Stable and developmentally dynamic connections represent the invariant portion of the connectome that is shared across animals. Variable connections represent the portion that is unique to each animal (Extended Data - Figure 6g–i). The proportion of variable connections differed by each cell type (Extended Data - Figure 6j). Modulatory neurons exhibited higher variability in their output connections, whereas motor neurons exhibited the least variability. The high stereotypy of connections from motor neurons to muscles may reflect high fidelity in circuits for motor execution. Modulatory neurons, which secrete monoamines and neuropeptides by volume-release, may have less need for precisely positioned synaptic outputs.
Interneuron connections are stable
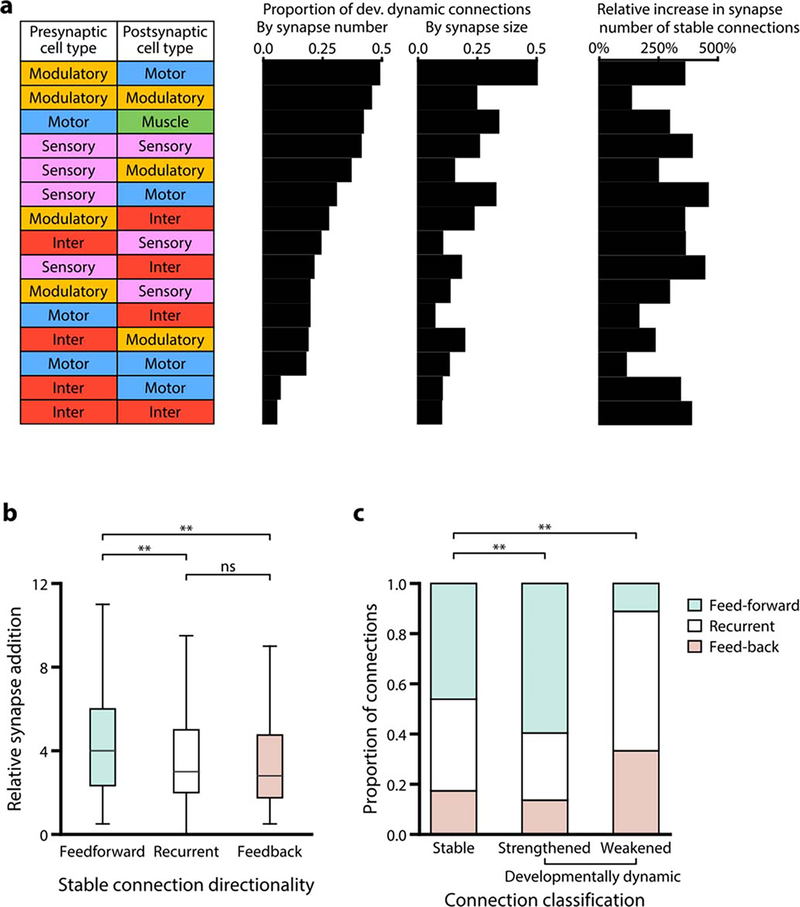
Excluding variable connections allows assessment of developmental connectivity changes that are shared across animals. Developmentally dynamic connections were not uniformly distributed among cell types or circuit layers (Fig. 2d). Connections between interneurons and from interneurons to motor neurons had disproportionately more stable connections than developmentally dynamic connections (Fig. 2d, Extended Data Figure 7a). In contrast, connections between and from sensory, modulatory, and motor neurons had many developmentally dynamic connections (Fig. 2d, Extended Data Figure 5). Spine-like protrusions may facilitate developmental changes, as developmentally dynamic connections were twice as likely to involve these protrusions than other connections (Extended Data - Figure 4h)
Thus, maturation changes how sensory information is integrated and relayed to downstream neurons. However, the layout of interneuron circuits, the core decision-making architecture, is largely stable from birth to adulthood.
Feedforward signaling increases with age
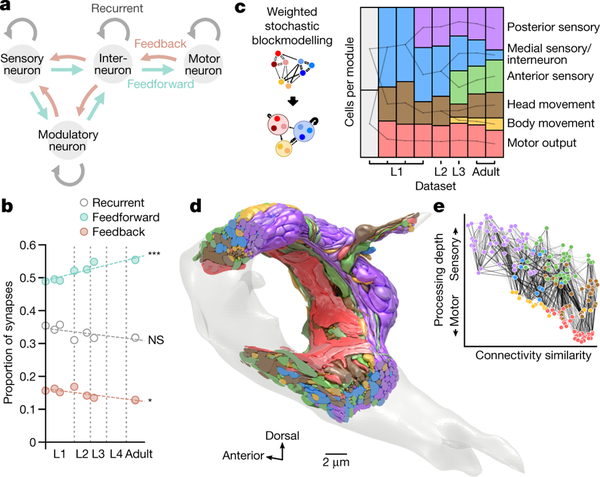
We asked how the sum of synaptic changes collectively alter the network structure. First, we examined how synaptic changes affect information flow. We classified connections from the sensory to motor layer as feedforward, connections from the motor to sensory layer as feedback, and connections between neurons of the same cell type as recurrent (Fig. 3a). Among stable connections, synapse addition strengthened existing feedforward connections more than feedback or recurrent connections (Extended Data Figure 7b). Developmentally dynamic connections also preferentially increased feedforward signal flow (Extended Data - Figure 7c). Cumulatively, the proportion of synapses in feedforward connections gradually increased (Fig. 3b).
Figure 3. Developmental increase in feedforward signaling and modularity.
a. Schematic of feedforward, feedback, and recurrent connections defined by cell types.
b. Proportions of the total number of synapses in feedforward, feedback, and recurrent connections. ns (not significant) p = 0.11, * p = 0.017, *** p = 2.0×10⁻⁴, Spearman’s rank correlation, FDR adjusted using Benjamini–Hochberg correction. c. Number of cells in each module across maturation, determined by weighted stochastic blockmodeling. Modules connected by a line share significant numbers of neurons. See Supplementary Table 7 for cells in each module. d,e Volumetric model and wiring diagram of the adult brain (dataset 8), colour-coded by module. Cell coordinates are represented as in Fig. 1b.
Thus, one global pattern of brain maturation augments signal flow from sensation to action, making the brain more reflexive with age.
Modularity increases with age
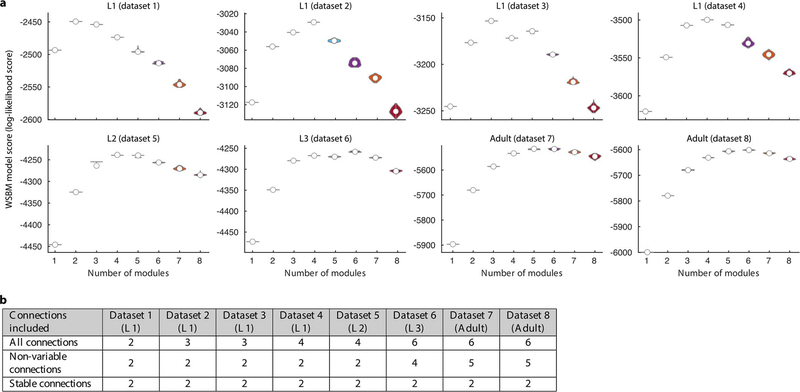
Next, we compared the brain-wide community structure across maturation. We used weighted stochastic blockmodeling (WSBM) to group neurons of similar connectivity into distinct modules [16]. In the adult, modularity corresponds to six cellular congregations with distinct functions (Fig. 3c–e, Extended Data - Figure 8a, Supplementary Table 7). Sensory and interneurons separate into three modules: anterior sensory (consisted of labial sensory neurons), posterior sensory (amphid sensory neurons and associated interneurons), and medial interneuron (other sensory neurons and most interneurons). Head motor neurons and descending premotor interneurons separate into two modules. Muscles constitute another module.
We discerned fewer modules at earlier developmental stages, starting with two modules at birth (Fig. 3c, Extended Data - Figure 8a, Supplementary Table 7). Most of the modularity increase is due to a small fraction of total synapses over development (Extended Data - Figure 8b). 74% of new synapses are added to stable connections which did not increase modularity. The increase in modularity is mostly due to developmentally dynamic connections, which account for only 14% of new synapses. Intriguingly, variable connections also contributed to module segregation.
After birth, an increase of connections further segregates closely connected neurons into more discernible modules (Fig. 3d,e, Video 4). The physical proximity of neurons in these modules resembles distinct brain lobes with different functions.
Discussion
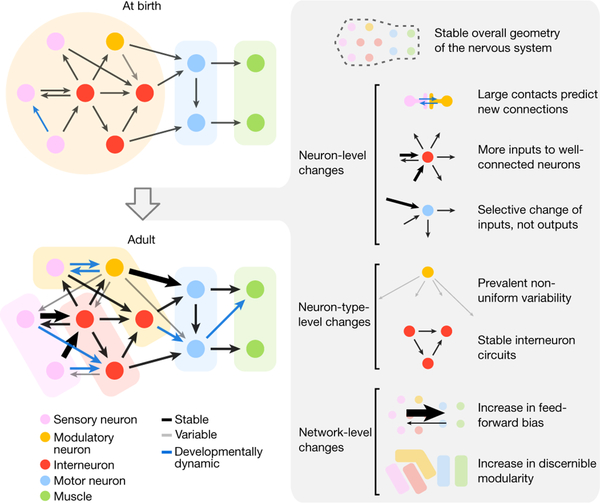
From birth to adulthood, the C. elegans brain enlarges 6-fold in volume while preserving several features. Overall brain geometry, shape, relative placement of individual neurons, and their physical contacts are surprisingly stable. Established neurite neighbourhoods at birth provide the structural platform that constrains and supports wiring maturation. However, changes in brain connectivity were not explained by uniform enlargement of existing wiring. With the 5-fold increase in synapse number from birth to adulthood, synaptic changes were not distributed uniformly through the network. Rather, we uncovered several developmental patterns that shape how the brain’s network changes (Fig. 4).
Figure 4. Developmental principles of brain maturation.
Left: schematic of brain-wide synaptic changes from birth to adulthood. Right: principles of maturation describing synaptic changes at the level of brain geometry, individual neurons, neuron types, and entire networks. Thicker lines represent stronger connections with more synapses.
Large contacts predict new connections.
Because the overall geometry of the brain is constant, physical contacts between neurites are nearly invariant across development. Most new synapses appear where physical contacts already exist, both adding synapses to connections between neurons and creating new connections between neurons. The larger the physical contact, the greater the probability of a new connection. The brain’s geometry at birth creates the scaffold upon which adult connectivity is built.
More inputs to well-connected neurons.
Developmental synapse addition is not equal among neurons. Cells with larger numbers of connections at early stages receive disproportionately more new synapses, both strengthening existing input connections and creating new input connections. In contrast, these neurons add fewer synapses to output connections. Thus, well-connected neurons become better integrators of information, but not broader communicators of that information.
Selective change of a neuron’s inputs, not outputs.
Synapses selectively change the strengths of existing connections. The strengths of input connections that converge on the same neuron tend to become more heterogeneous. In contrast, the outputs from the same neuron maintain their relative strengths. Neurons thus become differentially driven by a subset of their presynaptic partners, but distribute that information uniformly among their postsynaptic partners.
The wiring diagram is not stereotyped.
Each animal has connections that are not found in other individuals. About 43% of all cell-cell connections – accounting for 16% of all chemical synapses – are not conserved between isogenic animals. In contrast, physical contacts between neurites at birth are maintained across developmental stages. Wiring variability contrasts with the assumption that the C. elegans connectome is hardwired.
Stable interneuron circuits.
Stable wiring between interneurons may constitute the decision-making architecture of the developing brain. Stability of the core parts of the nervous system implies that the central processing unit is robust enough to be used in different contexts. Maturation changes the flow of sensory information into the central processor and its motor readout, without changing the central processor itself. Sensory maturation may reflect changes caused by learning and memory [17]. Motor circuit maturation may reflect adaptations to the changing musculature of the growing body [18].
Increase in feedforward bias.
Synaptogenesis preferentially creates new connections and strengthens existing connections in the direction from sensory to motor layers. This makes the network more feedforward over time. The adult brain, with increased feedforward-bias, may be more effective in rapid information processing and in reflexive decisions. The juvenile brain, with more feedback connections may have a greater capacity for learning and adaptation. Architecture in the adult brain may partly arise from feedback-mediated optimization of sensorimotor pathways.
Increase in discernible modularity.
Synaptogenesis increases the modularity of the brain, making it possible to resolve more sub-networks for sensory or motor processing with maturation. In the adult brain, it becomes possible to resolve functional communities among cells that are physically close to one another (Fig. 3d). These communities form spatially compact areas reminiscent of distinct brain areas in larger animals.
Perspective
In the C. elegans brain, synaptic remodeling from the cellular to network levels is likely to have functional consequences on behaviour. Most investigations of flexibility in neural circuits and behaviours focus on functional modulations of connectomes that are assumed to be anatomically static [19]. Our comparison of connectomes argues that the maturation and variability of brain and behaviour are not separated from wiring changes. Comparative connectomics is needed to reveal the origin of similarities and differences in structure and behaviour within and across species. High-throughput electron microscopy establishes a foundation for understanding how genes, experience, and evolution create the behaving adult (see Extended Discussion).
Methods
Electron microscopy
To learn emergent principles from studying synaptic changes of an entire brain across maturation, we analysed eight isogenic C. elegans beginning with the earliest larva stage and ending with the adult. Previous lineage studies revealed that the vast majority of post-embryonic neurogenesis and differentiation occurs during the L1 and L2 stages [21]. We reconstructed three L1, two L2, and one L3 animals at six different developmental time points, to afford the temporal resolution in capturing continuous connectomic changes during the period of most rapid growth. We reconstructed two adults to make direct comparisons between animals of the same age and with the original published connectome. While it took more than a decade to assemble the first C. elegans connectome [9], the advent of automation in sample sectioning, image acquisition, and data processing sped up the process, allowing our complete brain reconstructions of multiple animals in less time.
We examined wild-type (Bristol N2) animals reared in standard conditions: 35×10mm NGM-plates, fed by OP50 bacteria, and raised at 22.5C [3]. The animals were within a few generations of the original stock acquired from C. elegans Genetics Center (CGC) in 2001. All samples used in this study were derived from three batches of EM preparation.
Each EM sample was prepared and processed as previously described [4] with small modifications to the substitution protocol of the last 3 datasets (protocol in preparation). In short, isogenic samples reared in the same environment were high-pressure frozen (Leica HPM100 for datasets 1–5 and Leica ICE for datasets 6–8) at different stages of post-embryonic development. High-pressure freezing was followed by freeze-substitution in acetone containing 0.5% glutaraldehyde and 0.1% tannic acid, followed by 2% osmium tetroxide.
For each life stage, we selected samples based on their overall size and morphology for EM analysis. The precise developmental age of each larva was determined after the EM reconstruction, by comparing its cellular compositions to stereotyped C. elegans cell lineage [21], as well as the extent of its neurite growth. Three samples (datasets 2, 6, and 7) were prepared for transmission electron microscopy (TEM). Five samples (datasets 1, 3, 4, 5, and 8) were prepared for scanning electron microscopy (SEM).
For TEM, samples were manually sectioned at ~50nm using a Leica UC7 ultramicrotome, collected on formvar-coated slot grids (Electron Microscopy Sciences, FF205-Cu), poststained with 2% aqueous uranyl acetate and 0.1% Reynold’s lead citrate, and coated with a thin layer of carbon. Images were manually acquired using an FEI Tecnai 20 TEM and a Gatan Orius SC100 CCD camera.
For SEM, samples were serial sectioned at ~30–40nm and collected using an automated tape-collecting ultramicrotome (ATUM) [5]. The tape was glued to silicon wafers, carbon coated, and sections post-stained with 0.5% uranyl acetate (Leica Ultrostain I, Leica Microsystems) and 3% lead citrate (Leica Ultrostain II, Leica Microsystems). Images were collected semi-automatically using custom software guiding an FEI Magellan XHR 400L [6].
All images were acquired at 0.64–2 nm/px (~25,000×). In total, these datasets comprise 94,374 images, 5 teravoxels, and 2.4×105 μm3. Images were aligned using TrakEM2 [7,8] and imported into CATMAID [9] for annotation.
Brain reconstruction
The brain was defined as the nerve ring and ventral ganglion, neuropil anterior of the ventral sub-lateral commissures. In every EM volume, all cells within the brain were manually reconstructed by skeleton tracing in CATMAID [9]. Neuron and muscle processes, but not glia processes, were also volumetrically segmented (Supplementary Table 4).
Every neuron, glia, and muscle was annotated for chemical synapses to generate a connectome of the brain (Fig. 1b, Extended Data - Figure 2, Video 2, Supplementary Table 2). Chemical synapse annotations include classical synapses, which contain mostly clear vesicles as well as a small number of dense core vesicles, and synapses from modulatory neurons, which contains mostly dense core vesicles (DCVs) (Extended Data - Figure 1a). Gap junctions were partially annotated and excluded from analyses. Chemical synapse weight was assessed by both the number and size of synapses. Each presynaptic active zone was volumetrically reconstructed to determine synapse sizes (Supplementary Table 3).
The same neurons were unambiguously identified in all datasets based on their soma position, neurite trajectory, and stereotypic morphological traits, as described [9]. In the original connectome datasets, as well as ours, some variability in cell body position and neurite trajectory was observed. However, every cell could still be unambiguously identified in every dataset because the combined anatomical features and neighbourhood for each cell is unique.
Negligible amounts of neuropil in our reconstructions could not be reliably traced to a known cell. These orphan fragments were small (median length 0.38 μm) and rare (4.13±6.05 per dataset). Orphan fragments represent 0.18% of the total neurite length and 0.13% of all synapses and were excluded from analysis.
Synapse annotation
Chemical synapses and gap junctions were mapped manually. Chemical synapses were fully mapped and gap junctions were partially mapped. To reduce biases from different annotators, for chemical synapses, all datasets were annotated independently by three different people; only synapses that were agreed upon by at least two independent annotators were included in the final dataset.
Chemical synapse annotations include classical synapses, which contain mostly clear vesicles as well as a small number of dense core vesicles, and synapses from modulatory neurons, which contains mostly dense core vesicles (DCVs) (Extended Data - Figure 1a).
Modulatory neurons are distinguished from non-modulatory neurons by distinct features of their chemical synapses [10]. Classical synapses are made by all non-modulatory neurons; modulatory synapses are made by all modulatory neurons.
Classical synapses were identified by a characteristic presynaptic swelling containing a pool of clear vesicles adjacent to at least one dark presynaptic active zone on the inside of the membrane [4]. Each presynaptic active zone was annotated as the presynaptic partner of one chemical synapse. Cells adjacent to the active zone, within 100nm in xyz dimension, were identified as its potential postsynaptic partners. Synapse annotation included considerations for additional characteristics. Presynaptic swellings were also typically characterized by a small number of DCVs at the periphery of the active zone-associating and clear synaptic vesicle cloud, the presence of mitochondria, as well as the cadherin-like junctions between the pre- and postsynaptic partner cells [11]. Some postsynaptic partners exhibit morphological features such as swelling or postsynaptic densities (PSDs) that resemble the signature PSDs at the mammalian glutamatergic synapses.
Modulatory synapses appear as periodic varicosities along the modulatory neuron’s neurite, each filled with a cloud of DCVs. Some modulatory synapses are devoid of clear synaptic vesicles; some have a small numbers of clear synaptic vesicles in these varicosities. Most DCV-specific varicosities do not have presynaptic active zones; the small amount of presynaptic active zones are often not associated with vesicles [10].
Gap junctions were partially annotated and not subjected to the consensus scoring process due to limitations of current sample preparation methods [4]. They are shown at http://nemanode.org/ but were excluded from analyses due to incompleteness.
Volumetric reconstruction
For seven EM volumes, every neuron and muscle processes, but not glia processes, were volumetrically segmented (Supplementary Table 4). We computed the precise shape of every neurite and muscle process in each EM image based on the skeleton tracing that was performed in CATMAID and a machine learning algorithm that recognized cellular boundaries. Another algorithm expanded all skeleton nodes in each section until they fully filled the images of all labelled cell boundaries.
Cellular borders were predicted by a shallow Convolutional Neural Network (CNN) that builds on XNN [12, 13], a recently developed high performance system which computes convolutions on CPUs, to achieve border prediction throughput of ~10MB/s [14,15]. Node expansion was computed with a dedicated Cilk-based code [16] that parallelized the Dijkstra graph search algorithm. Code optimization allowed us to perform node expansion of an entire EM section in memory by a single multi-threaded process. Each software thread expanded an individual skeleton. Each pixel is attributed to a given cell by computing a generalized form of distance, taking into account the minimum number of cellular border pixels that must be traversed in a path connecting pixel and node. The generalized distance is computed using graph theory and concurrent data structures.
Volume traces were imported into VAST [17] for manual proofreading. At least 1,120 person-hours were spent proofreading the volumetric expansions. It was not possible to perform volumetric reconstruction on dataset 7 due to weak membrane contrast.
Spine-like protrusions
In parallel to neurite growth, there was extensive synapse addition. But only a small fraction of physical contacts developed into chemical synapses (Extended Data - Figure 1c). Presynaptic terminals appear as en passant boutons, most apposing the main neurite of a postsynaptic cell and some apposing small, spine-like protrusions [9,18].
These protrusions, short branches (<10% of the main neurite length), were found in many neurons and muscles (Extended Data - Figure 4f,g). From birth to adulthood, their number increased 5-fold (Extended Data - Figure 4c), and the proportion apposing presynaptic terminals increased 2-fold (Extended Data - Figure 4d). In the adult connectome, small spine-like protrusions were postsynaptic at ~17% of total synapses (Extended Data - Figure 4a,b, Supplementary Table 5).
Protrusions apposing presynaptic termini were more likely to locate distally along a neurite, whereas protrusions not apposing presynaptic termini were more proximal (Extended Data - Figure 4e). Developmentally dynamic connections were twice as likely to involve spine-like protrusions than stable and variable connections (Extended Data Figure 4h).
Cell type classification
We followed conventional neuronal type classification [9], with modifications based on structural features revealed in this study and other studies.
Neurons were classified as motor neurons if they primarily made synapses onto muscles. Neurons were classified as sensory if they had specialized sensory processes and/or were previously reported to have sensory capabilities. Neurons were classified as interneurons if most of their connections were to other neurons. Neurons were classified as modulatory if they make chemical synapses that contained mostly large dark vesicles (DVCs) or if they had been reported to use serotonin (AIM, HSN), dopamine (ADE, CEP), or octopamine (RIC) [19, 20]. Some neurons exhibit features corresponding to more than one type. In this case, they were classified based on their most prominent feature. A summary of the classification of each neuron and their justification is provided in Extended Data 10 and Supplementary Table 1.
Chemical synapse size
Presynaptic active zones were volumetrically reconstructed to determine synapse sizes in all EM volumes (Supplementary Table 3). Coordinates of all chemical synapses were exported from CATMAID [9] and imported into VAST [17] using custom scripts. The presynaptic active zone for every synapse was manually segmented throughout every section where it was visible. The size of monadic synapses is represented by the volume of the presynaptic active zone. At polyadic synapses, we estimated the relative strengths of postsynaptic partners by the proportion of postsynaptic area that each partner occupies at each synapse. We performed a Monte Carlo simulation of neurotransmitter diffusion from the presynaptic active zone, and quantified the proportion of these particles that reached each potential postsynaptic partner using the three-dimensional geometry of the EM reconstruction. Synapse size for each postsynaptic partner was calculated by multiplying the total volume of the presynaptic active zone by the proportion of particles that hit the membrane of each postsynaptic partner.
Connection classification
A total of 3113 connections (averaging 1292 per dataset) were assigned as stable, variable, or developmentally dynamic as follows. 1647 connections (averaging 323 per dataset) had no more than two synapses in two or more datasets and were left-right asymmetric. These connections were classified as variable. The 1466 remaining connections were pooled by left-right cell pairs, resulting in 658 pair connections. The number of synapses in each pair connection was tested for relative increase or decrease across maturation (Spearman’s rank correlation, corrected for multiple comparisons using the Benjamini–Hochberg correction). Pair connections showing a significant change and at least a 5-fold change in synapse number from birth to adulthood were classified as developmentally dynamic. When a connection is absent from dataset 1 and 2, but exists in later datasets, we consider it to have increased more than 5-fold (an ‘infinite’ increase). Remaining pair connections were considered stable if they were present in at least 7 datasets, and variable if present in fewer than 7 datasets. The 5-fold change cutoff is based on the overall expansion in synapse number from early L1 to adulthood. Occasionally, connections were near the cutoff for developmentally dynamic versus variable connections. How they are categorized does not affect any overall pattern in our connectome analysis due to the extremely small number.
Prevalence and validation of variable connections
When comparing connectomes from individuals at different developmental stages, we found a surprisingly substantial proportion of synapses and connections to be variable from animal to animal. Moreover, not all variable connections consisted of few synapses and not all stable connections consisted of many synapses (Extended Data - Figure 6g,h). The range of synaptic strength for both stable and variable connections makes it difficult to set them apart by thresholding: any threshold to filter postsynaptic partners – by synapse number, synapse size, or number of postsynaptic partners – excluded both variable and stable connections (Extended Data - Figure 6g,h).
We assessed the possibility that variability is more prominent during development than in the mature connectome. A conservative measure of variability in the adult stage can be made by comparing our two adult datasets and the original adult connectome [9]. When using these adult datasets to quantify variability, variable connections still made up ~50% of all connections (Extended Data - Figure 9a,b). Thus, variable connections are prominent in the C. elegans connectome across development.
The higher prevalence of variable connections between certain cell types remained evident when variable connections were defined only among adult datasets (Extended Data - Figure 9c) and when connections with fewer synapses were excluded (Extended Data - Figure 6h). The low variability of connections from motor neurons to muscles could not be simply explained by saturation of their physical contacts by synapses (Extended Data - Figure 9d). We also considered that neurons with more synapses may exhibit more stochastic synapses or have more annotation errors. However, the proportion of variable connections did not scale with the number of synapses (Extended Data - Figure 9e,f).
The developmental age of each dataset
The developmental age of each sample was established based on the described temporal cell division pattern exhibited by wild-type (N2) larva raised at 25° C ( [21]).
Dataset 1: L1 at birth. No Q cell division, which occurs ~3 hours post-hatching (hrs) after birth. Q cell nuclei are symmetrical, before nuclei migration, which occurs ~2 hrs after birth, placing this sample so close to birth, estimated to be ~0 hrs.
Dataset 2: L1 estimated to be 5 hrs. Q cell divided but no H1 division, which occurs at~7.5 hrs after birth. We found that PVC neurites were partially grown out and SAA posterior neurites had not begun to grow at this time point, indicating an age slightly more than halfway between dataset 1 and 3.
Dataset 3: L1 at 8 hrs. With H1 just completing its division and P5/6 starting their migration, this sample was placed at ~8 hrs after birth, when both events take place.
Dataset 4: L1 at the very end of the larval stage, near the end of the L1 lethargus. It is estimated to be 16hrs. It has two layers of cuticle. Both P11.aaa and P12.aaa have divided. V5R.p is in the midst of division, and H1.a has not yet divided; all happen at ~16 hrs. Dataset 5: L2 towards the end of the larval stage (23hr). SML/R have not divided, which occurs at ~29 hrs. It has 40 gonad cells, and a slight double cuticle that indicates the end of L2. However, its gut lumen contains food, placing this sample shortly before entering L2 lethargus, which occurs at ~23 hrs.
Dataset 6: L3 at 27 hrs. Based on the partial outgrowth of the RMF neurites, which is born at 23 hrs, this sample was estimated to be ~27 hrs.
Datasets 7 and 8: Young adults at 45hr. Both samples have adult cuticles but are relatively small compared to other adults. The exact ages of the two young adult samples are uncertain, so they are treated as equals for analyses.
Anatomical inconsistencies between samples
Similar to observations of the original studies ( [9]), a few anatomic inconsistencies are observed in some datasets, likely due to heterogeneity or imprecision of development processes. These events do not have an impact on overall connectivity, as all non-variable connections between individual neuron classes were conserved. Neurons in these datasets did not exhibit more variable connections either.
Dataset 2: CEPDL cell body is shifted to the anterior ganglion.
Dataset 3: RIFL neurite terminates prematurely laterally, not reaching the dorsal midline.
Dataset 4: RIH cell body is shifted to the anterior ganglion. PVCL and PVCR neurites both go right-handedly around the nerve ring, appearing as PVCR.
Dataset 5: RMHL and RMHR neurites both traverse right-handedly around the nerve ring, appearing as RMHR. ADAL terminates prematurely at a dorsal sub-lateral position, not reaching the dorsal midline.
Dataset 6: PVR neurite is fragmented.
Dataset 7: RIFL and RIFR neurites both traverse right-handedly around the nerve ring, appearing as RIFR.
Comparison to the original C. elegans adult connectome
The original adult hermaphrodite brain connectome annotated by White et al. [9,21] was taken from wormatlas.org (dataset N2U). Because individual muscles were not traced in the original annotation, we completed this dataset by tracing through all head muscles using the scanned EM micrographs hosted by wormatlas.org. Individual muscles arms were identified by their characteristic location within the brain, which were confirmed by tracing the arms back to their cell body in several datasets. This augmented dataset (referred to as “N2U, White et al., 1986”) was used for subsequent comparison.
The wormatlas.org hosts a re-annotated version of the wiring of the N2U connectome, which includes synapses to individual muscles from ( [22]). We noted errors in muscle identification and synapse annotation in this reannotation. We corrected some errors so that we could perform comparisons with our analysis. Specifically, we corrected the identity of the following muscle pairs VL1-VL2, VR1-VR2, DL2-DL3, DR2-DR3, DL5-DL6, DR5-DR6, VL5-VL6, and VR5-VR6. Other mistakes in tracing and synapse annotation could not be corrected. For example, muscles DL7 and DL8 were not traced at all in the brain, and only one of more than 50 synapses onto muscle VR2 (named as VR1 in Cook et al. 2019) was annotated. This minimally corrected dataset, referred to as “N2U, Cook et al., 2019” was used for subsequent comparison.
For both N2U datasets, we only included neurons and neurites within the same regions used for our datasets for comparison.
Community structure analysis
Weighted stochastic blockmodeling (WSBM) [16] was used to define modules individually for all eight connectomes. In this approach, modules are optimized on the likelihood of observing the actual network from the determined modules (log-likelihood score) based on two exponential family distributions. We chose the probability of establishing connections to follow a Bernoulli distribution and the synapse number for each connection to follow an exponential distribution. These distributions fit the data best according to the log-likelihood score and resulted in left-right cell pairs being assigned to the same modules.
In order to find a stable and representative number of modules for each connectome, we used a consensus-based model-fitting approach, similar to previously described [24]. First, to ensure unbiased coverage of the parameter space, we fitted the model independently 300 times using an uninformative prior for each potential number of modules (k = 1, …, 8). This procedure was repeated 100 times to yield a collection of models with concentrated and unimodally distributed log evidence scores. To improve the stability of the models on multiple runs, we increased the parameters for a maximum number of internal iterations to 100. For each dataset, we chose the number of modules whose collection of models had the highest mean posterior log-likelihood score. For dataset 2 the second-highest score was selected, as the number of modules otherwise conflicted with adjacent time points.
Finally, for each dataset, we found a representative consensus module assignment that summarized all 100 models [24]. In brief, considering all 100 models, we calculated the frequency of each cell being assigned to each module, and used this as a new prior to fit another 100 models. This procedure was repeated until convergence, when the consistency of the 100 models was larger than 0.95.
Data processing for analysis
To calculate the contact area of each adjacent cell pair, volumetric neuron and muscle traces were exported from VAST [17] and imported into MATLAB. EM artefacts were manually corrected. We performed two-dimensional morphological dilation of every traced segment across extracellular space until neighbouring segments made contact within 70 pixels (140–280nm). Expansion was restricted to the edge of the nerve ring. The total contact area was calculated as the sum of adjacent pixels for each segment in all sections. Contacts between cell bodies at the periphery of the neuropil were excluded.
To analyses related to neurites, synapses and connections, neuron skeletons and synapses were exported from CATMAID using custom Python scripts, and imported into Python or MATLAB environments for analyses. The module detection analysis was performed in MATLAB. Other analyses were implemented with custom Python scripts using SciPy and Statsmodels libraries for statistics. Post-embryonically born neurons were excluded from analyses related to classification of connections, feedforward information flow, and modules.
For analyses related to neurites, both processes of neurons and muscles in the nerve ring were included. The length was calculated using the smoothened skeleton of each neurite. The skeleton was smoothed by a moving average of 10 skeleton nodes after correction of major alignment shifts. Spine-like protrusions were defined as any branch shorter than 10% of the average neuron length.
For analyses related to information flow, analyses for feedforward, feedback, and recurrent connections excluded connections to muscles since they are all feedforward.
Statistics
Statistical methods were not used to predetermine sample sizes. Spearman’s rank was used for all correlations (Fig. 1j, Extended Data - Figure 1c,g,h,i,j, Extended Data Figure 9e,f) and time series (Extended Data - Figure 1l, Fig. 2a–c, Fig. 3b, Extended Data - Figure 4b–d). Two-tailed Z-test was used to compare proportions (Fig. 2e, Extended Data - Figure 7c). To determine if developmentally dynamic connections were over- or underrepresented, the proportions of developmentally dynamic connections between each cell type were compared to the total proportion of developmentally dynamic connections throughout all cell types (Fig. 2e, Extended Data - Figure 4h). Kruskal-Wallis test followed by pairwise Mann-Whitney U tests were used for comparisons of more than two unpaired categories (Extended Data - Figure 1k, 6j, 9c, 7b, 4h). For figure panels with more than three categories, only categories statistically different from all others were labelled (Extended Data - Figure 6j, 9c, 4h). For figure panels with multiple comparisons, the reported p-values were FDR adjusted using Benjamini–Hochberg correction.
Data availability
All electron microscopy images and volumetric reconstructions are available at bossdb.org/project/witvliet2020. Connectivity matrices for all datasets are available at www.nemanode.org and as Supplementary Tables.
Code availability
All scripts and files used to generate all figures are available at https://github.com/dwitvliet/nature2021.
Limitations
We have not included gap junctions, critical components of the nervous system, in our analysis. Our online connectome database (http://nemanode.org/) includes electrical synapses where gap junctions were most visible. But improvements in sample preparation and analysis are needed to reach the same level of confidence and throughput as we reached for chemical synaptic networks throughout development.
We have analyzed only one connectome at most time points. This allowed us to compare stable, variable, and developmentally dynamic synaptic networks across development but not to assess animal-to-animal variability at each age. Increased throughput and the analysis of many animals at each age will allow analysis of the statistical properties of synaptic connectivity.
Extended Data
Extended Data - Figure 1. EM reconstruction of cells and synapses in C. elegans brains from birth to adulthood.
a. A representative EM micrograph of the neuropil (from dataset 3). Presynaptic termini of classical chemical synapses are characterized by a pool of clear synaptic vesicles (red arrows) surrounding an active zone (red arrowhead). Presynaptic termini of chemical synapses of modulatory neurons are characterized by mostly dense core vesicles (orange arrows) distant from the active zone (orange arrowhead). Postsynaptic cells are marked by asterisks. The proportion of dense core and clear synaptic vesicles were not quantified.
Neurites grow while maintaining overall brain geometry
b. Correlation of the relative neurite length of each branch between L1 (dataset 1) and adult (dataset 8). The length of each neurite is normalized against the total neurite length of the neuron. p = 9.4×10−172, r = 0.75, n = 947, Spearman’s rank correlation.
c. Proportion of physical contacts in the brain that harbors at least one chemical synapse at respective developmental time points.
Most connectivity asymmetry at birth is eliminated during L1
d. Connectivity asymmetry decreases from birth to adulthood, most significantly during L1. Asymmetry is defined as the coefficient of variation (CV) in synapse number between left-right cell pairs. Error bars indicate SE.
e. Total number of missing connections decreases from birth to adulthood, most significantly during L1. One connection refers to a cell making at least one chemical synapse to another cell. A missing connection is defined as a connection absent in only one dataset and from one side of the brain.
Non-uniform distribution of connections and strengthening of connections across maturation
f. Distribution of the total number of input and output connections per neuron at birth.
Non-uniform synapse addition to synaptic inputs and outputs of a cell
g. Top: neurons with higher number of connections at birth (dataset 1) are more likely to receive new synapses at existing input connections by adulthood (averaging datasets 7 and 8). Bottom: no correlation is observed at existing output connections. Each data point represents one cell. Significance is calculated using two-sided Spearman’s rank correlation (top: p = 1.1×10⁻⁵, n = 166; bottom: p = 0.017, n = 141).
h. Top: neurons with higher number of connections at birth (dataset 1) are more likely to establish new input connections by adulthood (averaging datasets 7 and 8). Bottom: no correlation is observed at new output connections. Each data point represents one cell. Significance is calculated using two-sided Spearman’s rank correlation (top: p = 1.3×10⁻⁷, n = 166; bottom: p = 0.18, n = 141).
i. Upper panels: neurons with more input connections at birth are more likely to strengthen these connections during maturation. Left: the number of input connections at birth (dataset 1) is positively correlated with their synapse number increase by adulthood (average of datasets 7 and 8). p = 1.6×10⁻¹⁷, n = 166 by the Spearman’s rank correlation. Right: the number of output connections at birth does not predict the synapse number increase at input connections by adulthood. p = 0.32, n = 120 by the Spearman’s rank correlation. Lower panels: Neither input connection (left) nor output connection (right) at birth predicts the synapse number increase at output connections by adulthood. left: p = 0.16, n = 120; right: p = 0.12, n = 141 by the two-sided Spearman’s rank correlation. Each point represents one cell.
j. Upper panels: neurons with higher number of input connections (left) or output connections (right) at birth (dataset 1) are more likely to establish new input connections by adulthood (average of datasets 7 and 8). Left: p = 5.4×10⁻⁴, n = 166; right: p = 1.7×10⁻⁴, n = 120 by the Spearman’s rank correlation. Lower panels: Neither the input (left) or output (right) connection number at birth predicts the likelihood to establish new output connections by adulthood. Left: p = 1.00, n = 120; right: p = 0.08, n = 141 by the two-sided Spearman’s rank correlation. Each data point represents one cell.
k. Relative number of synapses added to existing connections is correlated between outputs of the same cell compared to connections to and from different cells. Relative number of synapses added represents the fold increase of synapse number from birth (dataset 1) to adulthood (average of datasets 7 and 8). ns (not significant) p = 0.48, ** p = 4.5×10⁻³, *** p = 4.9×10⁻⁵, two-sided Mann–Whitney U test, FDR adjusted using Benjamini–Hochberg correction (noutputs = 753, ninputs = 1203, nother = 90709). Center line, median; box limits, upper and lower quartiles; whiskers, 1.5x interquartile range; outliers not shown.
Top: each data point represents the mean coefficient of variation (CV) in the number of synapses for different sets of connections. The CV of output connections from the same cell is maintained. The CV of input connections to the same cell increases over time, at the same rate as connections to and from different cells. Error bars indicate SE. Bottom: the difference between the mean CV for output and input connections relative to connections between different cells grows over time. *** p = 5.3×10⁻⁷, r = 0.99, two-sided Spearman’s rank correlation.
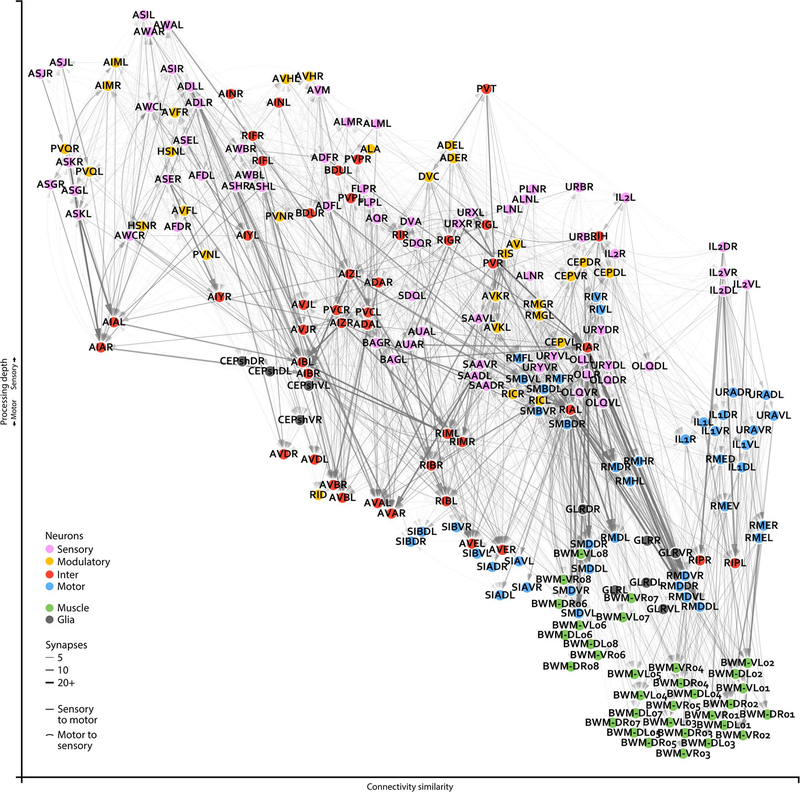
Extended Data - Figure 2. Closeup of an adult brain connectome.
Wiring diagrams for an adult connectome (dataset 8). Each circle represents a cell. Circle colour denotes cell type. Each line represents a connection with at least one chemical synapse between two cells. Line width indicates synapse number. Straight lines direct information from sensory to muscle layers whereas curved lines direct information in reverse. Cell coordinates are represented as in Figure 1b, with overlapping cells manually separated.
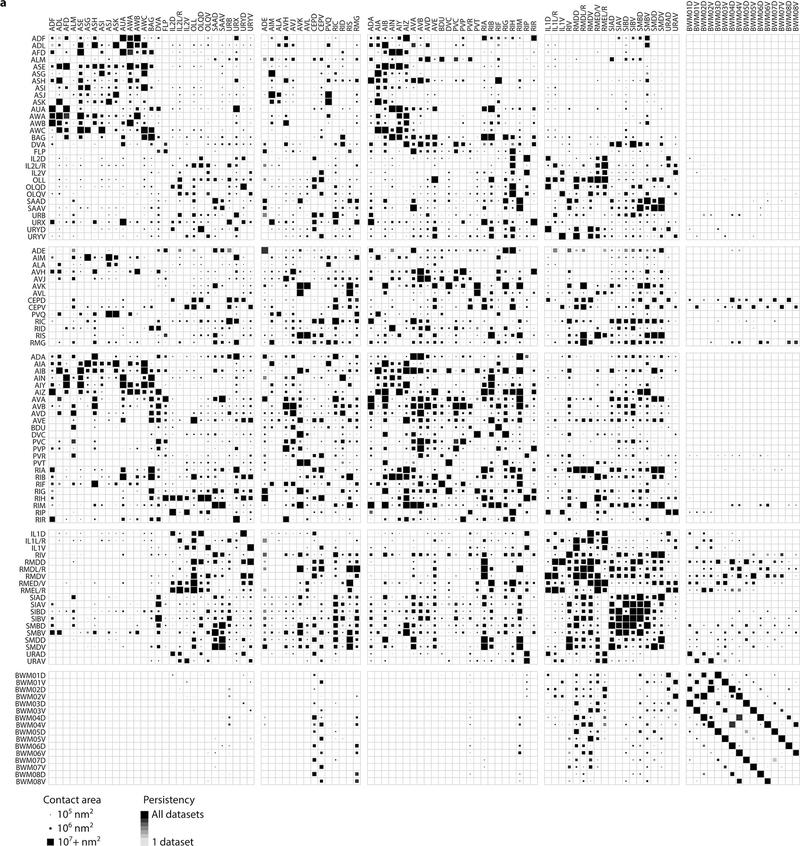
Extended Data - Figure 3. A physical contact matrix between neurites and muscle fibers in seven volumetrically reconstructed C. elegans brains.
Cells are pooled by left-right pairs. The physical contact size is represented by the largest value from the seven datasets. Statistical significance calculated by two-sided Spearman’s rank correlation.
Extended Data - Figure 4. Prevalence, location, and synaptic distribution of spine-like protrusions.
a. 3D reconstructions of one neuron class (AIZL and AIZR) across maturation. The overall geometry was maintained, whereas the number of spine-like protrusions (grey arrows) increased over time.
b. Proportion of postsynaptic spine-like protrusions increases across maturation. *** p = 6.5×10⁻⁵, two-sided Spearman’s rank correlation.
c. Total number of spine-like protrusions in the brain increases across maturation. *** p = 5.3×10⁻⁷, two-sided Spearman’s rank correlation.
d. Proportion of synapses with at least one spine-like protrusion postsynaptic partner increases across maturation. *** p = 1.8×10⁻⁴, two-sided Spearman’s rank correlation.
e. Distribution of spine-like protrusions by location, with the entry of the neurite into the brain as the most proximal, and the exit or terminal end of the neurite the most distal.
f. Number of spine-like protrusions that oppose a presynaptic terminal per neuron at birth (average of datasets 1 and 2) and in adulthood (average of datasets 7 and 8).
g. Proportion of presynaptic inputs onto spine-like protrusions per neuron in adulthood (average of datasets 7 and 8), grouped by their cell type.
h. Proportion of synapses with spine-like protrusions that comprise stable, variable, and developmentally dynamic connections. Developmentally dynamic connections have the highest proportion. *** (stable-dev. dynamic) p = 3.7×10⁻³⁴, *** (variable-dev. dynamic) p = 5.1×10⁻²⁵, two-tailed Z-test, FDR adjusted using Benjamini–Hochberg correction (nstable = 10059, nvariable = 2169, ndev.dynamic = 1611).
Extended Data - Figure 5. Connectivity matrix of the C. elegans brain throughout maturation.
Connectivity matrix including connections observed in eight C. elegans brains. Cells are pooled by left-right pairs. Each connection size represents the largest synapse number in any dataset. Stable, developmentally dynamic, and variable connections are colour-coded (Methods).
Extended Data - Figure 6. A connectome has prevalent variable connections.
a. Composition of stable, developmentally dynamic, and variable connections in each dataset classified by synapse size.
Prevalence of variable connections is not caused by over-annotation of ambiguous synapses
b. High proportions of both variable and non-variable (stable and developmentally dynamic) connections form at non-variable physical contacts. A physical contact is defined as variable when it is absent from more than one of the seven datasets.
c. Synapses that constitute non-variable and variable connections, sorted by EM section numbers that the presynaptic active zone encompasses. All synapses in seven volumetrically segmented datasets are included. Synapses comprising variable connections are marginally smaller that those comprising non-variable connections, but no threshold can be set to remove exclusively the variable connections.
d. Proportion of synapses that form a polyadic synapse with synapses of the stable connections. A marginally smaller portion of synapses that comprise variable connections (78%) than those comprising non-variable connections (93%) reside in this configuration. Therefore, variable connections are not fortuitous accidents of synapse annotation.
e. Synapses comprising non-variable and variable connections sorted by the number of post-synaptic partners. They exhibit similar distributions from monoadic to polyadic. Non-variable connections have marginally more polyadic synapses than variable connections (20% vs 28% for dyadic, and 61% vs 54% for triadic synapses, respectively). No threshold by postsynaptic partner number can be set to filter variable connections.
f. Proportion of postsynaptic contact area occupied by each postsynaptic partner at each synapse. Synapses comprising variable connections on average occupy less postsynaptic area than synapses comprising non-variable connections, but no threshold can be set to only exclude variable connections.
Any threshold removes both variable and non-variable connections.
g. Total number of non-variable (stable and developmentally dynamic) and variable connections in adulthood (average of datasets 7 and 8) upon thresholding by different synapse numbers. No synapse number provides a filter for specific removal of variable connections: all removes both variable and stable connections.
h. Thresholding connections by synapse number leaves substantial proportion of variable connections for all cell types. Non-uniform distribution of variable connections remains when connections with low synapse numbers are removed.
Non-uniform distribution of variable and developmentally dynamic connections.
i. Wiring diagrams for variable, stable, and developmentally dynamic connections. Each line represents a connection observed in at least one dataset. Line width indicates the largest number of synapses observed for a connection across datasets. Each circle represents a cell. Cell coordinates are represented as in Figure 1b.
Comparison of the proportion of variable and non-variable connections for each cell type. Non-variable connections include stable and developmentally changing connections. Cell types with significantly higher or lower proportions of variable connections are indicated. Upper panel: * p (modulatory-inter) = 2.2×10⁻², * p (modulatory-sensory) = 6.5×10⁻³, *** p (sensory-motor) = 4.7×10⁻⁸, *** p (modulatory-motor) = 5.2×10⁻⁸, *** p (inter-motor) = 1.7×10⁻⁷, lower panel: *** p (sensory-muscle) = 6.9×10⁻⁹, *** p (modulatory-muscle) = 1.3×10⁻⁷, *** p (inter-muscle) = 3.6×10⁻⁵, *** p (motor-muscle) = 8.1×10⁻⁷. n = 22–57, two-sided Mann–Whitney U test, FDR adjusted using Benjamini–Hochberg correction. Center line, median; box limits, upper and lower quartiles; whiskers, 1.5x interquartile range; outliers not shown.
Extended Data - Figure 7. Stability of interneuron connections and strengthening of feedforward connections are revealed by assessing connection strength by synapse size.
a. Proportion of developmentally dynamic connections by cell type, when connection strength changes were evaluated by either synapse number (left) or synapse size (middle). Connections between interneurons are the most stable regardless of how synapse weight was evaluated. Right panel: Developmental stability of connections is not correlated with the extend of synapse number increase from birth (average of datasets 1 and 2) to adulthood (average of datasets 7 and 8).
Increase in both feedforward signal flow and modularity across maturation.
b. The number of synapses for stable connections in adults (datasets 7 and 8) relative to birth (datasets 1 and 2). Stable feedforward connections are strengthened more than stable feedback and recurrent connections. ns (not significant) p = 0.13, ** p (feedforwardrecurrent) = 0.0015, ** p (feedforward-feedback) = 0.0012, two-sided Mann–Whitney U test, FDR adjusted using Benjamini–Hochberg correction (nfeedforward = 301, nrecurrent = 229, nfeedback = 107). Center line, median; box limits, upper and lower quartiles; whiskers, 1.5x interquartile range; outliers not shown.
c. Proportions of feedforward, feedback, and recurrent connections for stable and developmentally dynamic connections. ** p (stable-strenghened) = 0.0015, ** p (stable-weakened) = 0.0032, two-tailed Z-test of the proportion of feedforward connections, FDR adjusted using Benjamini–Hochberg correction (nstable = 737, nadded = 198, nweakened = 18).
Extended Data - Figure 8. Cell modules across maturation.
a. The log-likelihood score for each WSBM model (see Methods).
b Optimal number of modules detected by WSBM using subsets of connections.
Extended Data - Figure 9. Comparison of multiple adult connectomes reveals extensive variability in connectivity.
a. Shared and unique connections for three adult connectomes: dataset 7, dataset 8, and N2U (a) annotated by White et al. 1986, illustrated in the Venn diagram. Connections of all synapse numbers are included for comparison Methods.
Re-annotation of N2U increased its variability.
b. Re-annotation of the N2U adult connectome (Cook et al. 2019) added 1109 new connections that disproportionally enlarged its pool of unique connections (see Methods). Only 16% contributed to connections shared by three connectomes. This suggests the use of different annotation criteria from the original annotation.
Propensity of forming variable connections correlates with cell type.
c. Comparison between the proportion of adult connectome-defined variable and non-variable connections for each cell type. Adult-defined non-variable connections include the connections that are present in both of our adult datasets as well as the original connectome annotated by White et al. 1986. Cell types with significantly higher or lower proportions of variable connections are denoted; upper panel: *** p (sensory-motor) = 5.1×10⁻⁵, *** p (modulatory-motor) = 1.7×10⁻⁶, *** p (inter-motor) = 7.5×10⁻⁵, lower panel: *** p (sensory-muscle) = 2.6×10⁻⁶, *** p (modulatory-muscle) = 9.9×10⁻⁹, *** p (inter-muscle) = 4.7×10⁻⁴, *** p (motor-muscle) = 2.6×10⁻⁶; two-sided Mann–Whitney U test, FDR adjusted using Benjamini–Hochberg correction. Center line, median; box limits, upper and lower quartiles; whiskers, 1.5x interquartile range; outliers not shown.
d. The low variability of connections from motor neurons to muscles cannot be simply explained by saturation of their physical contacts by synapses. Physical contacts are not saturated for connections for any cell type. Motor neurons, which have the lowest proportion of variable connections (Extended Data - Figure 6j), are not restricted by few available potential synaptic partners. Center line, median; box limits, upper and lower quartiles; whiskers, 1.5x interquartile range; outliers not shown.
Higher variability for certain cell types is not explained by a fixed probability of an erroneous connection by neurons with abundant synapse formation.
e. Top: The number of synapses for stable output connections by cell types. Modulatory neurons, which exhibit a higher proportion of variable connections than other cell types (Extended Data - Figure 6j), do not exhibit more synapses per stable connection. Center line, median; box limits, upper and lower quartiles; whiskers, 1.5x interquartile range; outliers not shown. Bottom: The number of variable connections formed by a cell does not correlate with the strength of its stable output connections. Each data point represents one cell. ns (not significant) p = 0.08, r = 0.15, n = 139, two-sided Spearman’s rank correlation coefficient.
f. Top: The relative number of synapses added to existing stable output connections by cell types. Connections from modulatory neurons, which have a higher proportion of variable connections than other cell types (Extended Data - Figure 6j), do not exhibit higher increase in synapse number than connections from other cell types. Center line, median; box limits, upper and lower quartiles; whiskers, 1.5x interquartile range; outliers not shown. Bottom: The number of variable connections formed by a cell does not correlate with the number of synapses added to existing stable output connections from birth to adulthood. The relative number of synapses added is quantified as the fold increase of synapse number from birth (dataset 1) to adulthood (averaged of datasets 7 and 8). Each data point represents one cell. ns (not significant) p = 0.56, r = 0.05, n = 139, two-sided Spearman’s rank correlation coefficient.
For panels d-f, the synapse number for the adult brain (averaged of datasets 7 and 8) is shown
Extended Data - Table.
Cell types in the nerve ring.
| Class | Members | Type | Integration into nerve ring |
|---|---|---|---|
| ADA | 2 | inter | embryonic |
| ADE | 2 | modulatory | embryonic |
| ADF | 2 | sensory | embryonic |
| ADL | 2 | sensory | embryonic |
| AFD | 2 | sensory | embryonic |
| AIA | 2 | inter | embryonic |
| AIB | 2 | inter | embryonic |
| AIM | 2 | modulatory | embryonic |
| AIN | 2 | inter | embryonic |
| AIY | 2 | inter | embryonic |
| AIZ | 2 | inter | embryonic |
| ALA | 1 | modulatory | embryonic |
| ALM | 2 | sensory | embryonic |
| ALN | 2 | sensory | post-embryonic |
| AQR | 1 | sensory | post-embryonic |
| ASE | 2 | sensory | embryonic |
| ASG | 2 | sensory | embryonic |
| ASH | 2 | sensory | embryonic |
| ASI | 2 | sensory | embryonic |
| ASJ | 2 | sensory | embryonic |
| ASK | 2 | sensory | embryonic |
| AUA | 2 | sensory | embryonic |
| AVA | 2 | inter | embryonic |
| AVB | 2 | inter | embryonic |
| AVD | 2 | inter | embryonic |
| AVE | 2 | inter | embryonic |
| AVF | 2 | modulatory | post-embryonic |
| AVH | 2 | modulatory | embryonic |
| AVJ | 2 | modulatory | embryonic |
| AVK | 2 | modulatory | embryonic |
| AVL | 1 | modulatory | embryonic |
| AVM | 1 | sensory | post-embryonic |
| AWA | 2 | sensory | embryonic |
| AWB | 2 | sensory | embryonic |
| AWC | 2 | sensory | embryonic |
| BAG | 2 | sensory | embryonic |
| BDU | 2 | inter | embryonic |
| BWM01 | 4 | muscle | embryonic |
| BWM02 | 4 | muscle | embryonic |
| BWM03 | 4 | muscle | embryonic |
| BWM04 | 4 | muscle | embryonic |
| BWM05 | 4 | muscle | embryonic |
| BWM06 | 4 | muscle | embryonic |
| BWM07 | 4 | muscle | embryonic |
| BWM08 | 4 | muscle | embryonic |
| CEP | 4 | modulatory | embryonic |
| CEPsh | 4 | glia | embryonic |
| DVA | 1 | modulatory | embryonic |
| DVC | 1 | inter | embryonic |
| FLP | 2 | sensory | embryonic |
| GLR | 6 | glia | embryonic |
| HSN | 2 | modulatory | post-embryonic |
| IL1 | 6 | motor | embryonic |
| IL2 | 6 | sensory | embryonic |
| OLL | 2 | sensory | embryonic |
| OLQ | 4 | sensory | embryonic |
| PLN | 2 | sensory | post-embryonic |
| PVC | 2 | inter | embryonic |
| PVN | 2 | modulatory | post-embryonic |
| PVP | 2 | inter | embryonic |
| PVQ | 2 | modulatory | embryonic |
| PVR | 1 | inter | embryonic |
| PVT | 1 | inter | embryonic |
| RIA | 2 | inter | embryonic |
| RIB | 2 | inter | embryonic |
| RIC | 2 | modulatory | embryonic |
| RID | 1 | modulatory | embryonic |
| RIF | 2 | inter | embryonic |
| RIG | 2 | inter | embryonic |
| RIH | 1 | inter | embryonic |
| RIM | 2 | inter | embryonic |
| RIP | 2 | inter | embryonic |
| RIR | 1 | inter | embryonic |
| RIS | 1 | modulatory | embryonic |
| RIV | 2 | motor | embryonic |
| RMD | 6 | motor | embryonic |
| RME | 4 | motor | embryonic |
| RMF | 2 | motor | post-embryonic |
| RMG | 2 | modulatory | embryonic |
| RMH | 2 | motor | post-embryonic |
| SAA | 4 | sensory | embryonic |
| SDQ | 2 | sensory | post-embryonic |
| SI A | 4 | motor | embryonic |
| SIB | 4 | motor | embryonic |
| SMB | 4 | motor | embryonic |
| SMD | 4 | motor | embryonic |
| URA | 4 | motor | embryonic |
| URB | 2 | sensory | embryonic |
| URX | 2 | sensory | embryonic |
| URY | 4 | sensory | embryonic |
Cell types using each neuron, muscle, and glia that contributed to chemical synapses in our analyses. Cell types assigned using the criteria described in Methods. We performed volumetric reconstructions of all listed neuron and muscle processes within our datasets. We did not perform volumetric reconstructions of the thinner glia processes, which our algorithms were unable to reconstruct automatically (Methods). Volumetric reconstruction of the 6 GLR glia (cells with a mesodermal origin that may affect neuron-muscle communication) and the 4 CEPsh glia (the sheath cells of the cephalic sensilla that have a neuronal/epidermal origin) require thinner EM sectioning.
Supplementary Material
Acknowledgments
We thank V. Laskova for help with EM samples; B. Harris for help with high-pressure freezing; M. Neubauer, D. Kersen, A. Paulino, M. Suriyalaksh, A. Srajer, M. Chang, S. Ihn, and J. Ho for help with imaging; A. Cardona, I. Arganda-Carreras and J. Qian for guidance on EM alignment; S. Cook, C. Rehaluk, and M. Wang for synapse annotation in some datasets; J. Ho, C. Morii-Sciolla, I. So, M. and C-Y. Ho for generating ground truth and proofreading for volumetric reconstruction; A. Matveev, L. Mi, and H. Saribekyan for help with analysis algorithms; J. Wang and D. Cao for help with statistics; A. Lin, C. Tabone, and V. Venkatachalam for help with data servers; S. Maeng and D. Fong for help with www.nemanode.org; members of our labs for comments; G. Si and L. Varshney for critical reading and suggestions; D. Hall, J. Srinivasan, and A. Cardona for early advice.
JKM was supported by NSF PoLS (NSF 1806818). BM was supported by the Mount Sinai Foundation. JWL was supported by the NIMH, Silvio Conte Center (P50 MH094271), the NIH (U24 NS109102-01), and MURI (GG0008784). JWL, ADTS, and MZ were supported by the HFSP (RGP0051/2014). ADTS and MZ were supported by the NIH (R01-NS082525-01A1). ADTS was supported by NIH Brain Initiative (1U01NS111697-01) and NSF BRAIN EAGER (IOS-1452593). MZ was supported by CIHR (MOP-123250 and Foundation Scheme 154274), the Radcliffe Institute, and the Mount Sinai Foundation.
Footnotes
Competing Interests
The authors declare no competing interests.
References
- [1].Bucher D Animal-to-Animal Variability in Motor Pattern Production in Adults and during Growth. Journal of Neuroscience 25, 1611–1619 (2005). [DOI] [PMC free article] [PubMed] [Google Scholar]
- [2].Kämper G & Murphey R Maturation of an insect nervous system: Constancy in the face of change. Comparative Biochemistry and Physiology Part A: Physiology 109, 23–32 (1994). [Google Scholar]
- [3].Gerhard S, Andrade I, Fetter RD, Cardona A & Schneider-Mizell CM Conserved neural circuit structure across Drosophila larval development revealed by comparative connectomics. eLife 6 (2017). [DOI] [PMC free article] [PubMed] [Google Scholar]
- [4].Kagan J, Herschkowitz N & Herschkowitz EC A Young mind in a growing brain (Lawrence Erlbaum, Mahwah, NJ, 2005). OCLC: 845860192. [Google Scholar]
- [5].Pujala A & Koyama M Chronology-based architecture of descending circuits that underlie the development of locomotor repertoire after birth. eLife 8 (2019). [DOI] [PMC free article] [PubMed] [Google Scholar]
- [6].Hebb DO The organization of behavior: a neuropsychological theory (John Wiley Amp Sons, Inc., 1949). [Google Scholar]
- [7].Hubel DH & Wiesel TN Brain Mechanisms of Vision. Scientific American 241, 150–162 (1979). [DOI] [PubMed] [Google Scholar]
- [8].Van Horn MR & Ruthazer ES Glial regulation of synapse maturation and stabilization in the developing nervous system. Current Opinion in Neurobiology 54, 113–119 (2019). [DOI] [PubMed] [Google Scholar]
- [9].White JG, Southgate E, Thomson JN & Brenner S The structure of the nervous system of the nematode Caenorhabditis elegans. Philosophical Transactions of the Royal Society of London. Series B, Biological Sciences 314, 1–340 (1986). [DOI] [PubMed] [Google Scholar]
- [10].Scheffer LK et al. A Connectome and Analysis of the Adult Drosophila Central Brain. preprint, bioRxiv (2020). [DOI] [PMC free article] [PubMed] [Google Scholar]
- [11].Karimi A, Odenthal J, Drawitsch F, Boergens KM & Helmstaedter M Cell-type specific innervation of cortical pyramidal cells at their apical dendrites. eLife 9, e46876 (2020). [DOI] [PMC free article] [PubMed] [Google Scholar]
- [12].Morgan JL & Lichtman JW An Individual Interneuron Participates in Many Kinds of Inhibition and Innervates Much of the Mouse Visual Thalamus. Neuron S0896627320301008 (2020). [DOI] [PMC free article] [PubMed] [Google Scholar]
- [13].Randel N et al. Inter-individual stereotypy of the Platynereis larval visual connectome. eLife 4 (2015). [DOI] [PMC free article] [PubMed] [Google Scholar]
- [14].Kornfeld J et al. An anatomical substrate of credit assignment in reinforcement learning. preprint, bioRxiv (2020). [Google Scholar]
- [15].Schneider-Mizell CM et al. Chandelier cell anatomy and function reveal a variably distributed but common signal. preprint, bioRxiv (2020). [Google Scholar]
- [16].Aicher C, Jacobs AZ & Clauset A Learning latent block structure in weighted networks. Journal of Complex Networks 3, 221–248 (2015). [Google Scholar]
- [17].Jin X, Pokala N & Bargmann CI Distinct Circuits for the Formation and Retrieval of an Imprinted Olfactory Memory. Cell 164, 632–643 (2016). [DOI] [PMC free article] [PubMed] [Google Scholar]
- [18].White JG, Albertson DG & Anness MA Connectivity changes in a class of motoneurone during the development of a nematode. Nature 271, 764–766 (1978). [DOI] [PubMed] [Google Scholar]
- [19].Bargmann CI & Marder E From the connectome to brain function. Nature Methods 10, 483–490 (2013). [DOI] [PubMed] [Google Scholar]
- [20].Varshney LR, Chen BL, Paniagua E, Hall DH & Chklovskii DB Structural Properties of the Caenorhabditis elegans Neuronal Network. PLoS Computational Biology 7, e1001066 (2011). [DOI] [PMC free article] [PubMed] [Google Scholar]
- [21].Sulston JE & Horvitz HR Post-embryonic cell lineages of the nematode, Caenorhabditis elegans. Developmental biology 56, 110–156 (1977). [DOI] [PubMed] [Google Scholar]
Methods References
- [1].Sulston JE & Horvitz HR Post-embryonic cell lineages of the nematode, Caenorhabditis elegans. Developmental biology 56, 110–156 (1977). [DOI] [PubMed] [Google Scholar]
- [2].White JG, Southgate E, Thomson JN & Brenner S The structure of the nervous system of the nematode Caenorhabditis elegans. Philosophical Transactions of the Royal Society of London. Series B, Biological Sciences 314, 1–340 (1986). [DOI] [PubMed] [Google Scholar]
- [3].Brenner S The genetics of Caenorhabditis elegans. Genetics 77, 71–94 (1974). [DOI] [PMC free article] [PubMed] [Google Scholar]
- [4].Mulcahy B et al. A pipeline for volume electron microscopy of the Caenorhabditis elegans nervous system. Frontiers in Neural Circuits 12, 94 (2018). [DOI] [PMC free article] [PubMed] [Google Scholar]
- [5].Baena V, Schalek RL, Lichtman JW & Terasaki M Serial-section electron microscopy using automated tape-collecting ultramicrotome (ATUM). Methods in Cell Biology 152, 41–67 (2019). [DOI] [PMC free article] [PubMed] [Google Scholar]
- [6].Hayworth KJ et al. Imaging ATUM ultrathin section libraries with WaferMapper: a multi-scale approach to EM reconstruction of neural circuits. Frontiers in Neural Circuits 8 (2014). [DOI] [PMC free article] [PubMed] [Google Scholar]
- [7].Cardona A et al. TrakEM2 software for neural circuit reconstruction. PloS One 7, e38011 (2012). [DOI] [PMC free article] [PubMed] [Google Scholar]
- [8].Saalfeld S, Fetter R, Cardona A & Tomancak P Elastic volume reconstruction from series of ultra-thin microscopy sections. Nature Methods 9, 717–720 (2012). [DOI] [PubMed] [Google Scholar]
- [9].Saalfeld S, Cardona A, Hartenstein V & Tomancak P CATMAID: collaborative annotation toolkit for massive amounts of image data. Bioinformatics 25, 1984–1986 (2009). [DOI] [PMC free article] [PubMed] [Google Scholar]
- [10].Lim MA et al. Neuroendocrine modulation sustains the C. elegans forward motor state. eLife 5, e19887 (2016). [DOI] [PMC free article] [PubMed] [Google Scholar]
- [11].Hung WL et al. Attenuation of insulin signalling contributes to FSN-1-mediated regulation of synapse development. The EMBO Journal 32, 1745–1760 (2013). [DOI] [PMC free article] [PubMed] [Google Scholar]
- [12].Kasthuri N et al. Saturated Reconstruction of a Volume of Neocortex. Cell 162, 648–661 (2015). [DOI] [PubMed] [Google Scholar]
- [13].Meirovitch Y et al. A multi-pass approach to large-scale connectomics. arXiv preprint arXiv:1612.02120 (2016). [Google Scholar]
- [14].Matveev A et al. A multicore path to connectomics-on-demand. In Proceedings of the 22nd ACM SIGPLAN Symposium on Principles and Practice of Parallel Programming, 267–281 (2017). [Google Scholar]
- [15].Meirovitch Y et al. Cross-classification clustering: An efficient multi-object tracking technique for 3-d instance segmentation in connectomics. In Proceedings of the IEEE Conference on Computer Vision and Pattern Recognition, 8425–8435 (2019). [Google Scholar]
- [16].Blumofe RD et al. Cilk: An efficient multithreaded runtime system. Journal of parallel and distributed computing 37, 55–69 (1996). [Google Scholar]
- [17].Berger DR, Seung HS & Lichtman JW VAST (Volume Annotation and Segmentation Tool): Efficient Manual and Semi-Automatic Labeling of Large 3d Image Stacks. Frontiers in Neural Circuits 12, 88 (2018). [DOI] [PMC free article] [PubMed] [Google Scholar]
- [18].Philbrook A et al. Neurexin directs partner-specific synaptic connectivity in C. elegans. eLife 7, e35692 (2018). [DOI] [PMC free article] [PubMed] [Google Scholar]
- [19].Sulston J, Dew M & Brenner S Dopaminergic neurons in the nematode Caenorhabditis elegans. The Journal of Comparative Neurology 163, 215–226 (1975). [DOI] [PubMed] [Google Scholar]
- [20].Duerr JS et al. The cat-1 Gene of Caenorhabditis elegans Encodes a Vesicular Monoamine Transporter Required for Specific Monoamine-Dependent Behaviors. The Journal of Neuroscience 19, 72–84 (1999). [DOI] [PMC free article] [PubMed] [Google Scholar]
- [21].Durbin RM Studies on the development and organisation of the nervous system of Caenorhabditis elegans (University of Cambridge UK, 1987). [Google Scholar]
- [22].Cook SJ et al. Whole-animal connectomes of both Caenorhabditis elegans sexes. Nature 571, 63–71 (2019). [DOI] [PMC free article] [PubMed] [Google Scholar]
- [23].Aicher C, Jacobs AZ & Clauset A Learning latent block structure in weighted networks. Journal of Complex Networks 3, 221–248 (2015). [Google Scholar]
- [24].Faskowitz J, Yan X, Zuo X-N & Sporns O Weighted Stochastic Block Models of the Human Connectome across the Life Span. Scientific Reports 8 (2018). [DOI] [PMC free article] [PubMed] [Google Scholar]
Associated Data
This section collects any data citations, data availability statements, or supplementary materials included in this article.
Supplementary Materials
Data Availability Statement
All electron microscopy images and volumetric reconstructions are available at bossdb.org/project/witvliet2020. Connectivity matrices for all datasets are available at www.nemanode.org and as Supplementary Tables.


