

Abstract

Pyrazinoic acid-resistant tuberculosis is a severe chronic disorder. First-line drugs specifically target the ribosomal protein subunit-1 (RpsA) and stop trans-translation in the wild-type bacterium, causing bacterial cell death. In mutant bacterial strain, the deletion of ala438 does not let the pyrazinoic acid to bind to the active site of RpsA and ensures that the bacterium survives. Hence, such tuberculosis cases require an immediate and successful regime. The current study was designed to identify inhibitors that could bind to the mutant state of the RpsA protein. Initially, a pharmacophore model was generated based on the recently published most potent inhibitor for the mutant state of RpsA, i.e., zrl15. The validated pharmacophore model was further used for virtual screening of two chemical libraries, i.e., ZINC and ChemBridge. After applying the Lipinski rule of five (Ro5), a total of 260 and 749 hits from the ChemBridge and ZINC libraries, respectively, were identified using pharmacophore mapping. These hits were then docked into the active site of the mutant state of the RpsA protein, and later, the top 150 compounds from each library were chosen based on the docking score. A total of 21 compounds were shortlisted from each library based on the best protein–ligand interactions. Finally, a total of 05 compounds were subjected to molecular dynamics study to examine the dynamic behavior of each compound in the active site of the mutant state of the RpsA protein. The results revealed that all compounds had good chemical properties such as absorption, distribution, metabolism, excretion, and toxicity (ADMET), and there was no Pan Assay Interference (PAINS) or deviation from Ro5, indicating that these compounds could be useful antagonists for the mutant state of the RpsA protein.
1. Introduction
Tuberculosis (TB) is a contagious, chronic inflammatory disease caused by Bacillus Mycobacterium tuberculosis (Mtb). In 2019, TB remained the most common cause of death from a single infectious pathogen. Globally, an estimated 10.0 million people developed TB disease in 2019, and there were an estimated 1.2 million TB deaths among HIV-negative people and an additional 208 000 deaths among people living with HIV.1 TB affected about 1.7 billion people worldwide as reported by WHO in 2018,2 leading to the death of individuals in case of improper or poor treatment. The conventional treatment for TB is a 06-month plan of four first-line drugs, i.e., ethambutol, rifampicin, isoniazid, and pyrazinamide.3 Pyrazinamide (PZA) plays a peculiar role in the treatment of TB, reducing the regimen from 09–12 to 06 months, and is referred as short-course chemotherapy.4,5 However, the ability of PZA to cure TB is restrained by multidrug-resistant (MDR) and extensively drug-resistant (XDR) strains of Mtb.6 TB caused by such strains cannot be cured with such less-toxic first-line drugs; rather, it needs a 02-year regimen with toxic and second- or third-line drugs, because these strains show resistance to PZA.6 With the advent and spread of PZA-resistant strains, there is an intense and ultimate concern to identify novel drugs to ease and shorten the plan.7,8
The Mycobacterial pyrazinamidase (PncA) enzyme converts the PZA (inactive form) into the active form, pyrazinoic acid (POA), in wild-type strains of Mtb.9 However, in mutant strains, spontaneous mutation in PncA and RpsA prevents the conversion of PZA to POA.10 Being a target of POA, RpsA is an important protein that is necessary for two processes. First, it enables the bacterium to reproduce rapidly by binding to the upstream sequence of mRNA, which confirms the linking of mRNA to a smaller (30S) unit of ribosome and causes translation. Secondly, it causes trans-translation; when Mtb is in unfavorable condition, trans-translation makes the ribosomal machinery relax by restarting the translation of the halted protein during the process of decoding mRNA.11 Therefore, to overcome PZA resistance, it is critical to target RpsA and the trans-translation pathway.
POA specifically binds to the conserved region of the RpsA protein (Arg357, Phe310, Phe307, and Lys303).12 Among these residues, Arg357 forms a hydrogen bond with the carboxylic oxygen of POA, while the residue Lys303 forms a hydrogen bond with the nitrogen of the pyrazine ring of POA.12 The rest of the residues, i.e., Phe307 and Phe310, adopt π-stacking interaction with the aromatic ring of POA.13 In mutant strain, the binding pocket becomes smaller and the residue Arg357 is far from both phenylalanine residues, due to the deletion of the ala438 residue. This deletion enables the POA to form a π-stacking interaction with the pyrazine ring while forming a hydrogen bond with the residue Arg357, which efficiently loses the affinity of POA for RpsA, and thus POA becomes inactivated in the mutant state of the RpsA protein.12 In an attempt to better understand the challenges in the path of treatment of MDR/XDR-TB, computational scientists have found many active compounds that also showed in vitro activities, i.e., zrl15 (6-amino-3-methyl-2-oxo-2,3,4a,7-tetrahydro-8H-pyrimido[1,2-b][1,4,2]oxathiazin-8-iminium) was found to be active in blocking the function of the mutant bacterium RpsA.12 The activity of this compound has also been studied via in vitro analyses, like saturation transfer difference (STD) spectroscopy,12 fluorescence quenching titration technology (FQT), and chemical shift perturbation (CSP) analysis.12 It was found that zrl15 interacts with the mutant state of the RpsA protein through the spectrum of STD. The results of FQT technology also showed that zrl15 enhanced the tendency for mutated bacterium RpsA to have the deleted residue ala438. It has also been found that zrl15 has the ability to interact with the residue Phe307 of RpsA, and hence block the function of RpsA, resulting in the death of the bacterium. These experiments also found that the residue Arg357 is the most critical residue in the RpsA protein of the pathogen and is also important for the interaction to block the activity of RpsA of the mutant strain. Based on this active lead compound (reference; zrl15), in the current study, we have found several other compounds in both ZINC and ChemBridge libraries that might have better potential against the target compared with the compound zrl15.12
2. Results and Discussion
2.1. Exploration of Drug-Like Features
A validated 3D model was used to explore the drug-like features of the compound zrl15 (selected as a reference compound), which strongly interacts with the mutant state of RpsA and may halt the activity of the desired protein.12 We have generated a pharmacophore with a total of 07 necessary features selected; the generated pharmacophore has been depicted in Figure 1. Finally, ZINC and ChemBridge compound libraries were screened based on the generated pharmacophore for the reference compound. Consequently, we have found numerous compounds having stronger interactions with the target than the reference compound.
Figure 1.
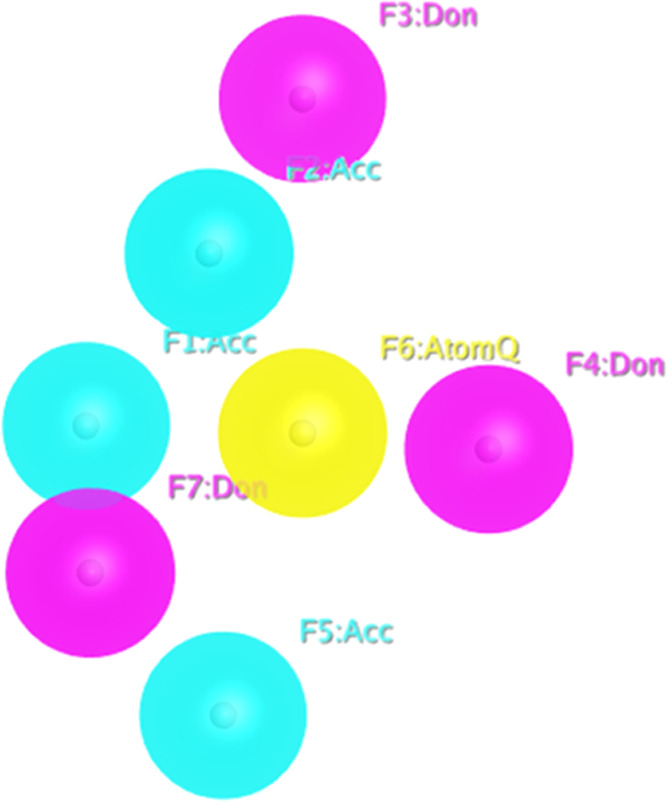
Validated pharmacophore model with its features.
2.2. Assessment of Drug-Like Features with Chemical Libraries
A total of two chemical libraries (ZINC and ChemBridge) were evaluated using a validated pharmacophore model. Subsequently, 335 and 1692 structurally diverse hits were retrieved from ZINC and ChemBridge libraries, respectively, exhibiting 07 features fit to the Extended Huckel Theory (EHT) pharmacophore model. Finally, 260 and 749 hits were selected from the ZINC and ChemBridge libraries, respectively, applying Lipinski Ro5.
2.3. Molecular Interaction and Selection of Lead Compounds
The docking protocol implemented in Molecular Operating Environment (MOE) v2016 was first checked for reliability by calculating the root-mean-square-deviation (RMSD) between the co-crystal and re-docked conformation of RpsA, which was found to be equal to 0.78 Å using the Scientific Vector Language (SVL) script in MOE. As a result, the findings imply that the docking method used is capable of producing the interaction mode of a protein–ligand complex. We docked a total of 260 and 749 compounds from ZINC and ChemBridge libraries, respectively, in the active site of the mutant state of RpsA (with ala438 deleted). A large number of hits were obtained from each library, from which the top 150 ranked conformations of all docked compounds for each library were chosen and saved based on the docking score (S). The resultant binding interactions between these hits and the protein were visually observed using the protocol implemented in MOE v2016. We picked in total 21 best hits from each library after filtering those hits that exhibited substantial interactions with the active-site residues, i.e., Arg357, Lys303, Phe307, Phe310, Leu320, and His322.
2.4. Lead Optimization based on the Binding Energy and Binding Affinity
The binding energy and binding affinity of the best hits (21 compounds) from both libraries along with the reference compound were calculated using the protocol implemented in MOE. The resulting total of 05 compounds were selected based on their high binding energy and affinity (Table 1).
Table 1. Binding Energy, Binding Affinity, and Lipinski Ro5 for the Finally Selected Compounds.
| compound ID | docking score | binding affinity (kcal/mol) | binding energy (kcal/mol) | a_acc | a_don | h_logP | TPSA (Å) | weight (Da) |
|---|---|---|---|---|---|---|---|---|
| ZINC72414676 (Zn1) | –5.0323 | –5.1600 | –32.9300 | 4.000 | 2.000 | –0.1190 | 133.9700 | 305.2740 |
| ZINC16956402 (Zn1) | –4.5883 | –6.2000 | –36.2200 | 5.000 | 3.000 | 1.5029 | 111.7800 | 303.3180 |
| ZINC16952914 (Zn1) | –4.9008 | –5.3400 | –28.9300 | 6.000 | 1.000 | –0.3937 | 86.9600 | 305.3180 |
| 73904686 (Ch1) | –5.9046 | –7.4400 | –46.5600 | 6.000 | 1.000 | 2.4453 | 88.0700 | 442.9510 |
| 78446875 (Ch1) | –5.8531 | –5.8200 | –37.7700 | 7.000 | 2.000 | 2.1265 | 103.1900 | 410.4780 |
| reference (Zrl15) | –4.5138 | –4.9600 | –28.4000 | 2.000 | 2.000 | –0.8010 | 93.9400 | 214.2490 |
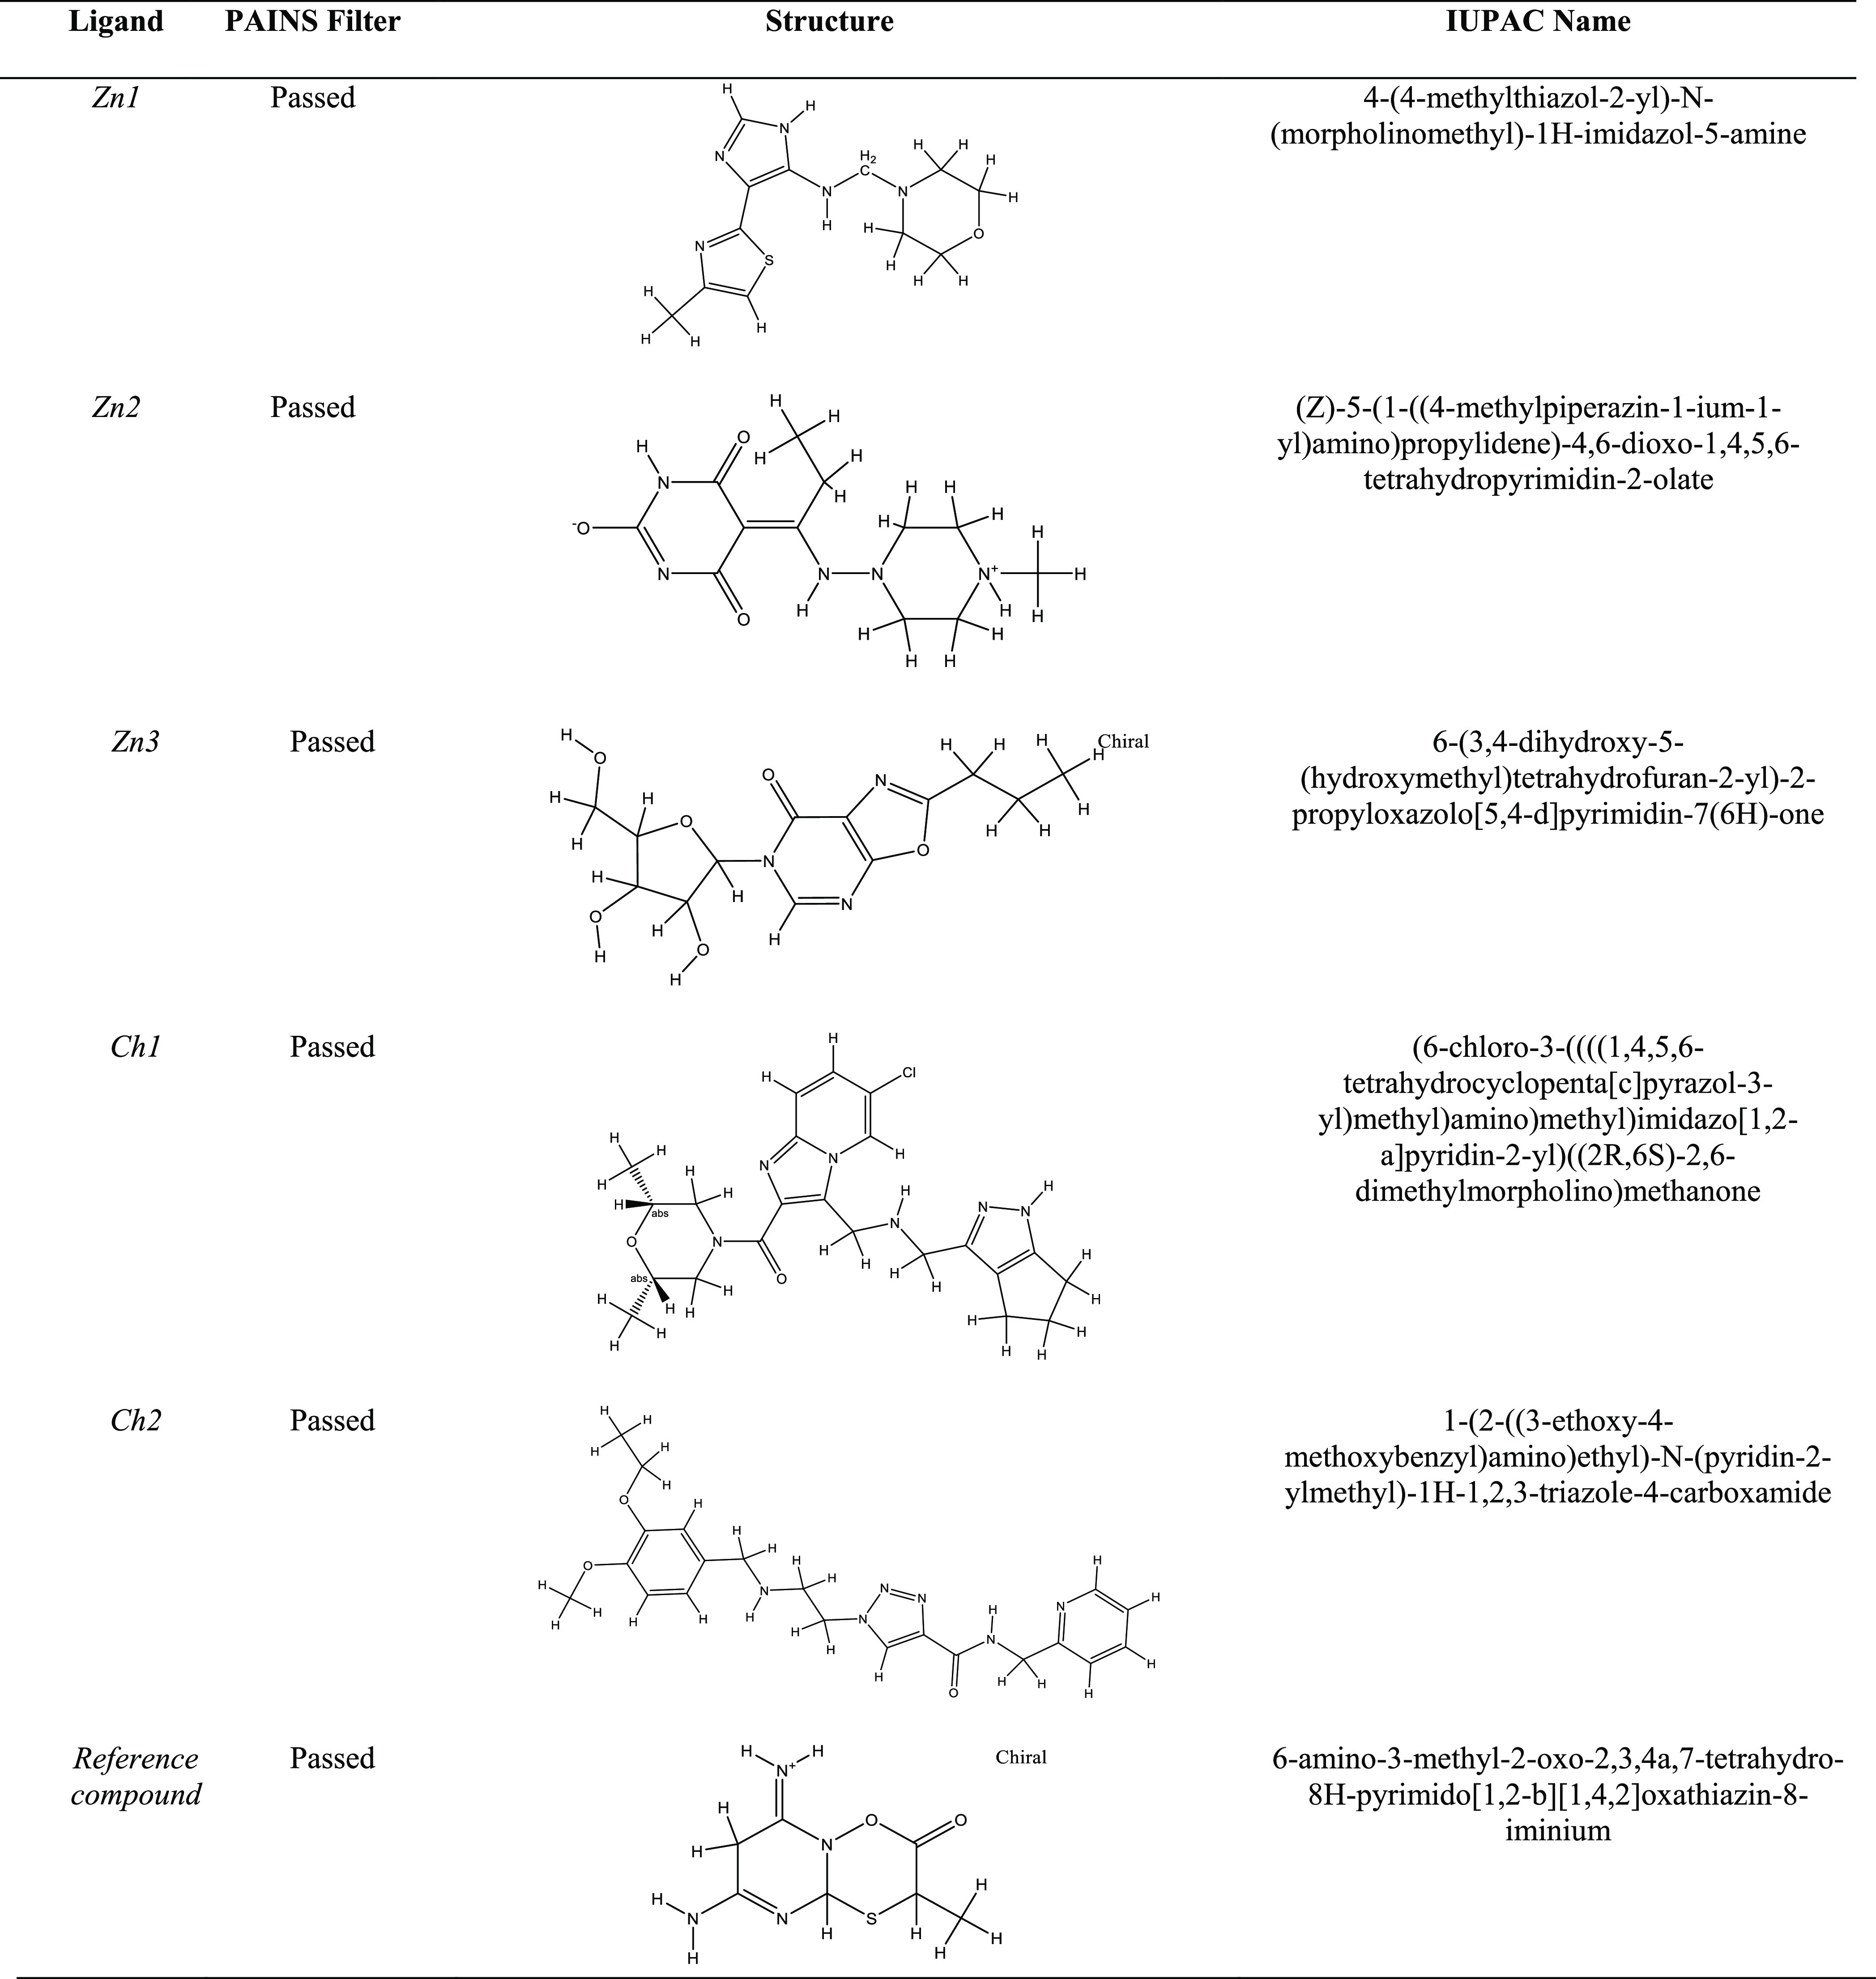
2.5. PAINS Filter Assay
All of the 05 compounds from each library were passed through the electronic filter, and their absorption, distribution, metabolism, excretion, and toxicity (ADMET) properties were studied using the online PAINS server.18 The compounds that passed the PAINS filter with appropriate drug-like properties are enlisted in Table 2.
Table 2. PAINS Results, Structural Formulae, and IUPAC Names of the Selected Compounds.
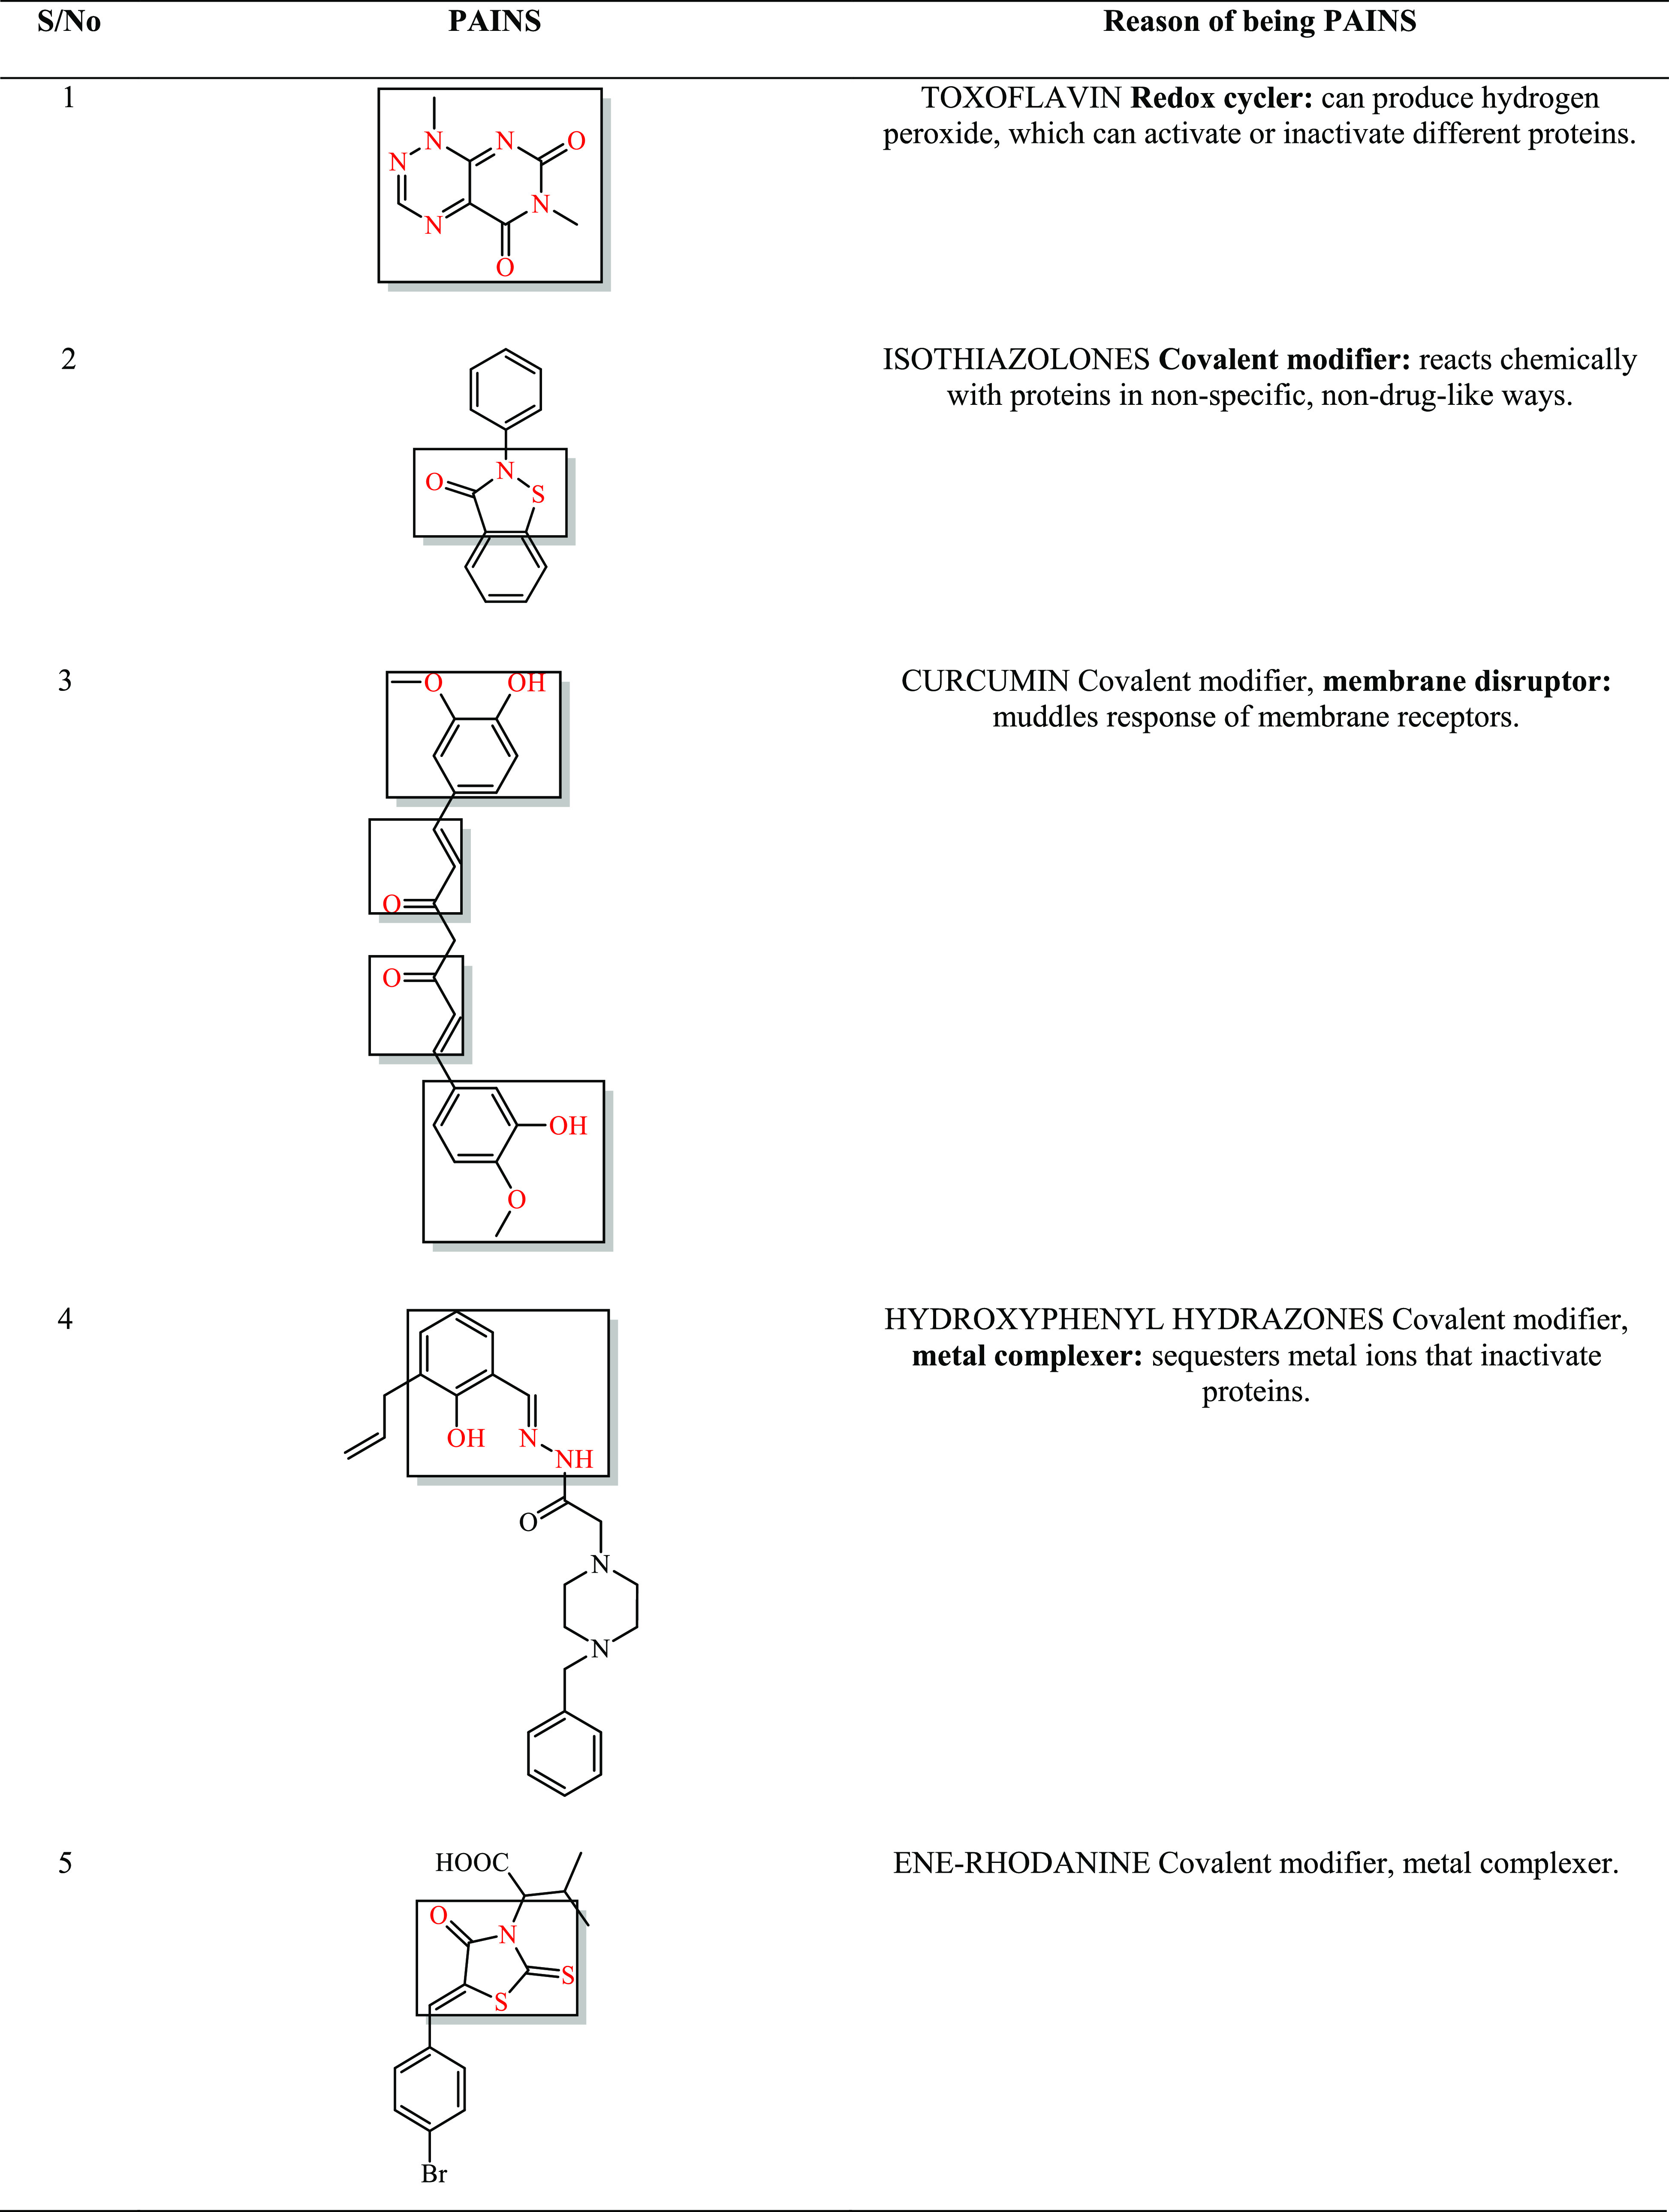
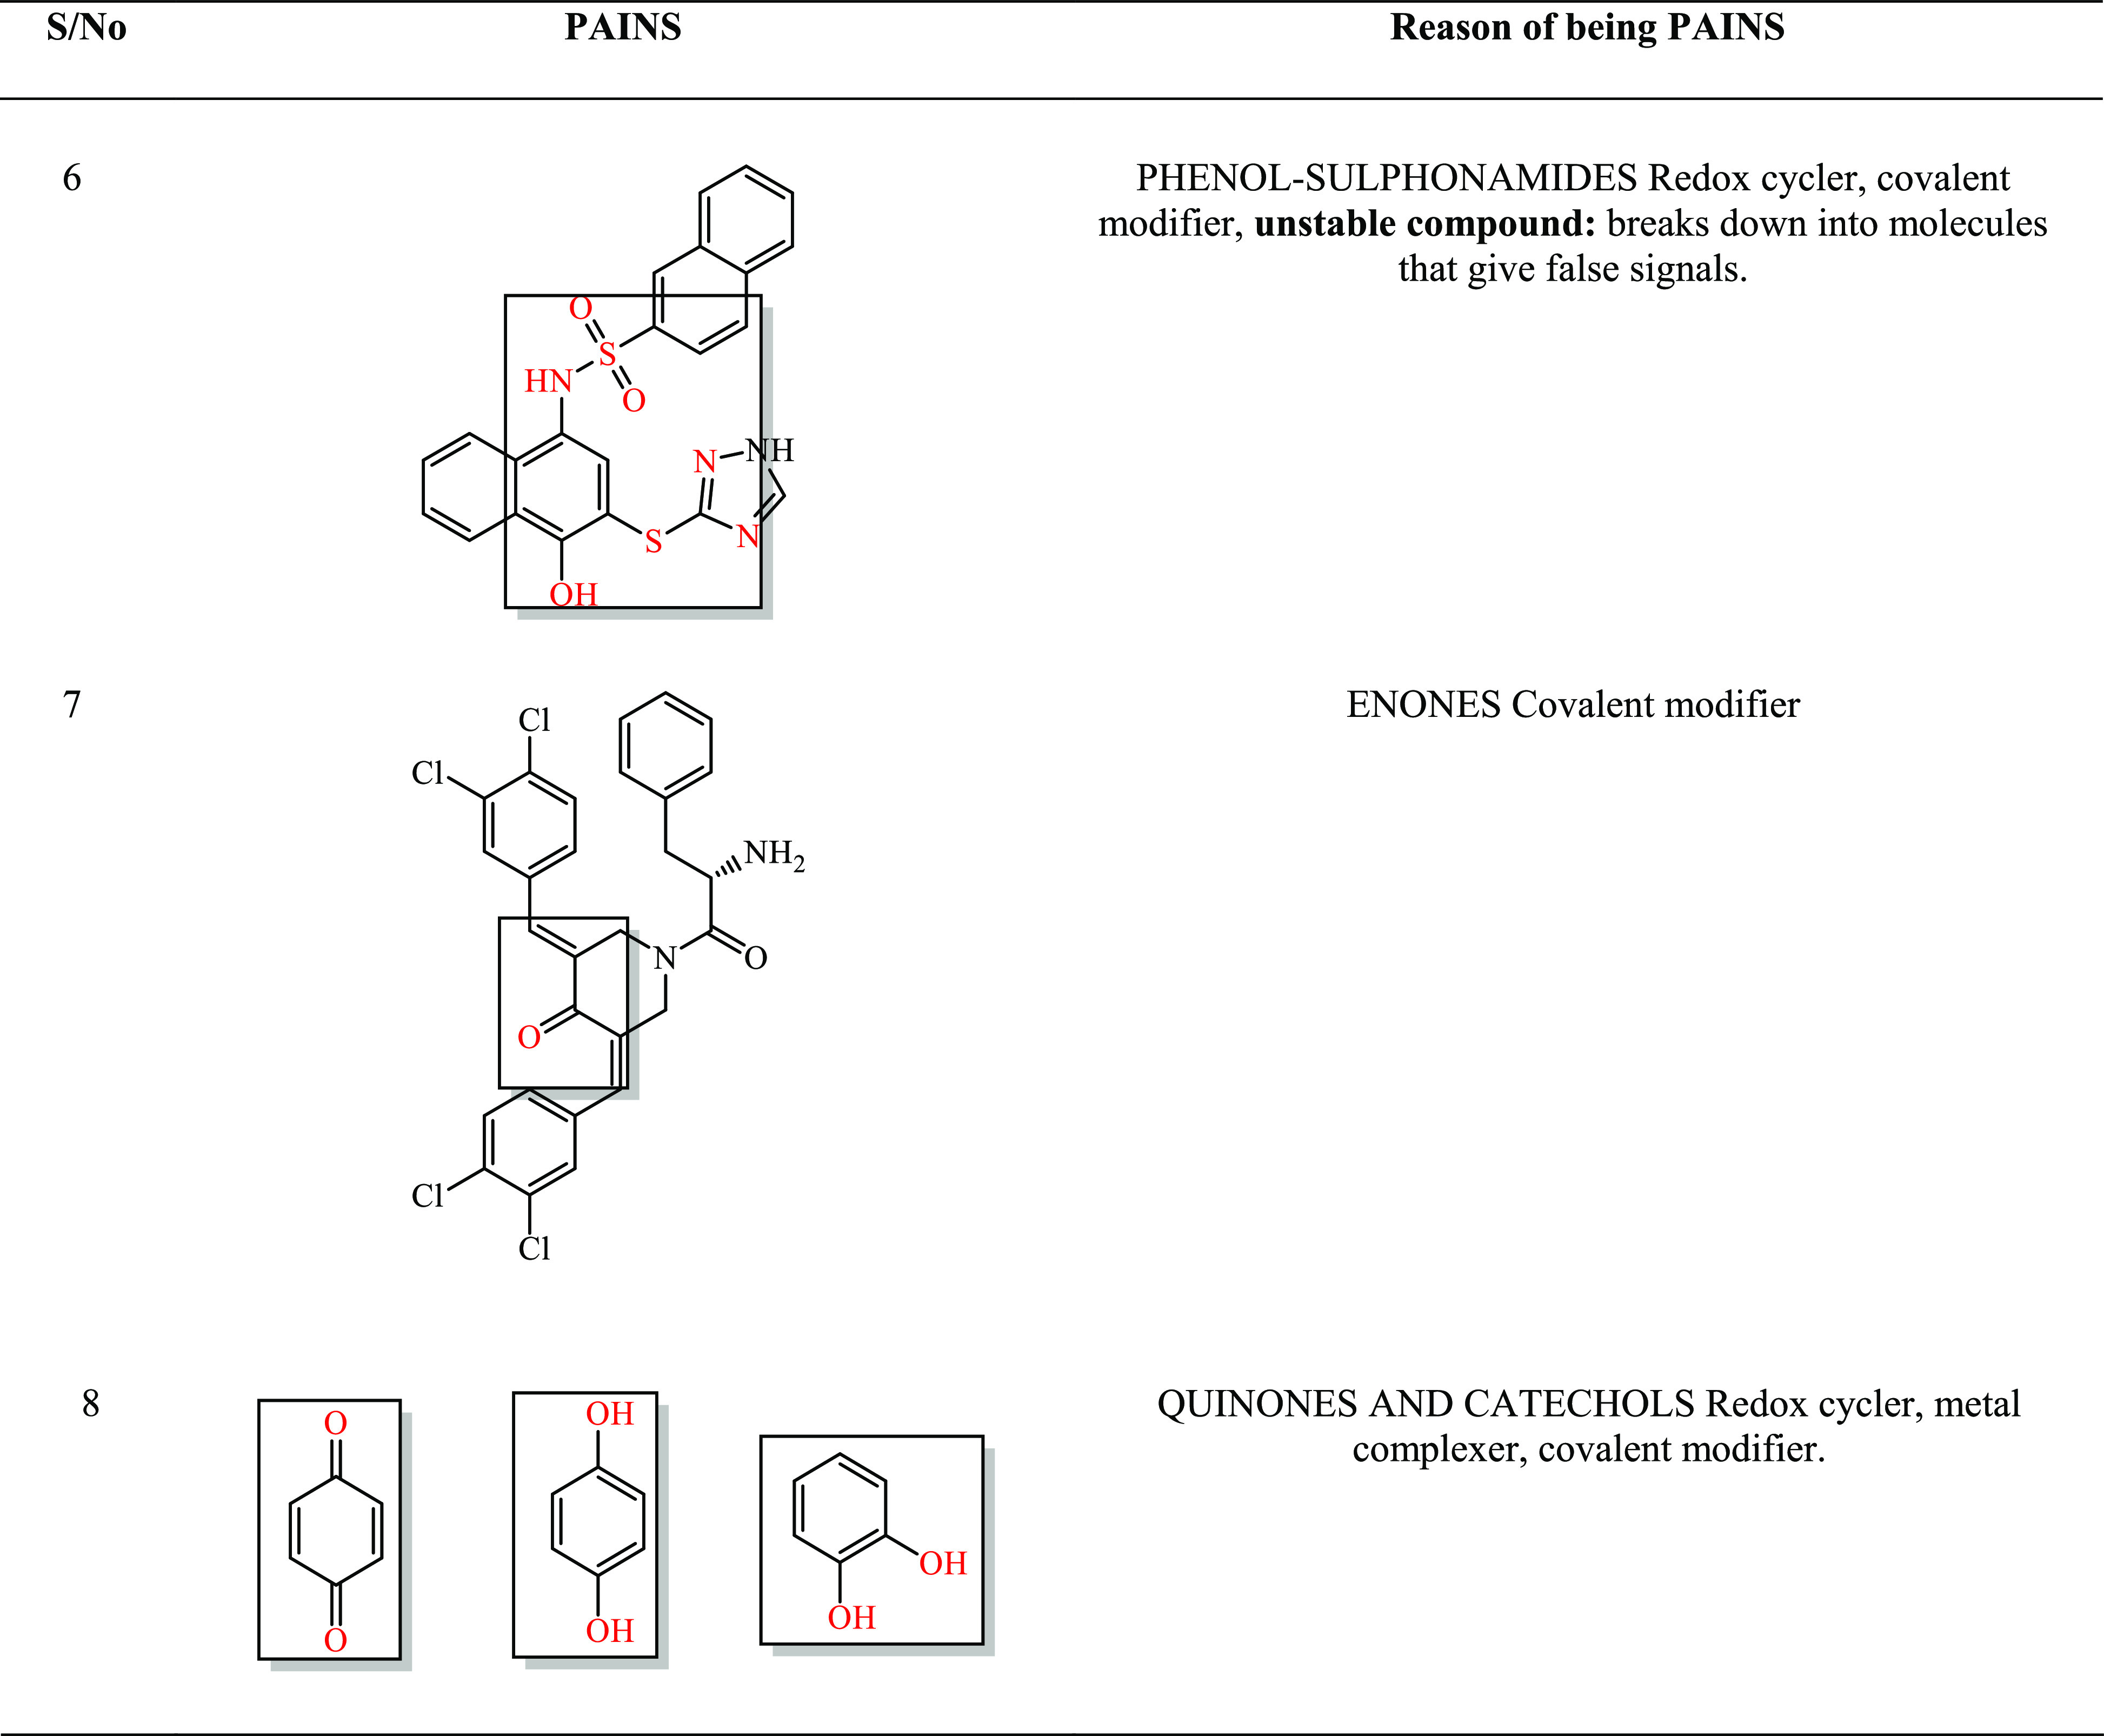
Among the most perfidious of those listed in Table 3; is is 08. Their reactive moieties are encircled by the red line.
Table 3. Areas Enclosed, with Red-Color Parts Showing the Chemistries of the Artifacts.
2.6. All-Atom Molecular Dynamics Simulation
Molecular dynamics (MD) simulation was carried out for all 05 best hits having good interactions, best docking scores, binding energies, and binding affinities, as well as passed the electronic filter with better ADMET properties in comparison with the reference molecule containing the active-site residues of the mutant state of the RpsA protein. The dynamics simulation results revealed that all of the selected compounds showed better dynamics behavior compared with the reference compound. The stability of all of the systems was studied, considering the RMSD parameters of the whole complex, in order to check the stability of the selected compounds in the active site of the RpsA in mutant state with deletion of the ala438 residue. Simulations were run for a total of 100 ns in order to analyze the comparative stability of the selected compounds with the reference compound. The dynamics simulation results, particularly the RMSD curve, show that the reference compound has a high deviation compared with the selected compounds, which indicates the stability of the selected compounds as shown in Figure 2. The reference compound’s RMSD curve showing 4 Å deviation around 25 ns could indicate the maximum instability of the complex compared with the deviation of the selected compounds. Moreover, gradually, this high deviation decreases and oscillates after 85 ns; the RMSD curve was found near 1.8 Å. Furthermore, the RMSD curve for the selected compounds revealed that the compound Zn1 showed local deviation, i.e., 0.7–1 Å (Figure 2A), and oscillated throughout the MD simulation time compared with the reference compound that showed dynamic behaviors initially and then oscillated after 85 ns MD time. Also, we observed many differences in the binding free energies (GB and PB) for compound Zn1 compared with those of the reference compound (refer to Tables 4 and 5).
Figure 2.

Black-colored lines in all graphs showing the plot of the reference compound. (A) Root-mean-square deviation (RMSD) graph of Zn1, (B) graph of Zn2, (C) graph of Zn3, (D) graph of Ch1, and (E) graph of Ch2.
Table 4. MMGBSA Binding Free Energy (kcal/mol) Calculation for the Finally Selected Compounds.
| complex | VDW | EEL | EGB | ESURF | ΔGBSA |
|---|---|---|---|---|---|
| reference compound | –1228.9312 | –10 241.0306 | –3830.7324 | 73.4547 | –9.6234 |
| Zn1 | –1242.6633 | –10 388.4400 | –3700.7824 | 70.1550 | –22.8870 |
| Zn2 | –1225.4674 | –10 228.3292 | –3833.6148 | 74.0722 | –24.8497 |
| Zn3 | –1210.4905 | –10 564.7997 | –3713.1522 | 75.1993 | –6.5594 |
| Ch1 | –1254.3164 | –10 292.0627 | –3770.1018 | 71.9468 | –29.6844 |
| Ch2 | –1253.3782 | –10 299.8688 | –3761.9038 | 72.1455 | –28.6894 |
Table 5. MMPBSA Binding Free Energy (kcal/mol) Calculation for Finally Selected Compounds.
| complex | VDW | EEL | EPB | ENPOLAR | EDISPER | ΔPBSA |
|---|---|---|---|---|---|---|
| reference compound | –1228.9312 | –10 241.0306 | –3850.1649 | 1365.0633 | –925.9343 | –0.5682 |
| Zn1 | –1242.6633 | –10 388.4400 | –3710.6003 | 1354.9305 | –903.3560 | –2.6319 |
| Zn2 | –1225.4674 | –10 228.3292 | –3833.8564 | 1373.6337 | –932.3994 | –0.9111 |
| Zn3 | –1210.4905 | –10 564.7997 | –3731.4335 | 1379.7470 | –949.3280 | 3.9574 |
| Ch1 | –1254.3164 | –10 292.0627 | –3764.4848 | 1372.1981 | –915.6635 | 5.1382 |
| Ch2 | –1253.3782 | –10 299.8688 | –3758.1048 | 1374.0777 | –922.9056 | 1.3824 |
These results suggest that compound Zn1 could be a potent inhibitor of the mutant state of the RpsA protein. Moreover, the dynamics simulation results for compound Zn2 were found to be more stable than those for the reference compound, as it showed slight deviation and more stability than the reference compound (Figure 2B). This compound (Zn2) has a minimum RMSD value of ∼1.2 to 1.5 Å during 30–50 ns of the MD simulation time. Furthermore, this compound showed a highly stable RMSD curve (stable) for up to 70 ns, imparting maximum stability in this trajectory (Figure 2B). Among the other three complexes, Zn3 had the lowest RMSD value of 1.3 Å for about 47 ns, but later diverged even more than the reference compound during 70–80 ns with an RMSD value of roughly 3.2 Å, which was greater than that of the reference compound (Figure 2C).
The deletion of ala438 makes the binding site smaller and less flexible, which renders the protein less reactive for the remaining two inhibitors, i.e., compound Ch1 and compound Ch2, as compared to the reference compound, although these two compounds have considerably lower binding energies than all other selected compounds and the reference compound. However, the PB values are high, i.e., 5.1382 and 1.3824 kcal/mol, respectively. The RMSD result for compound Ch1 revealed high deviations during 60–70 ns; after that, it oscillated throughout the MD time (∼1 Å) compared to the reference compound (Figure 2D). The RMSD for compound Ch2 shows maximum fluctuations during 70–83 ns with an RMSD of ∼3.5 Å, which might indicate the unstable behavior of the compound (Figure 2E). However, both the compounds (Ch1 and Ch2) have better GB and RMSD graph as compared to the reference compound.
In order to get more information regarding the impact of the deletion of the single residue ala438 on RpsA protein structure and function, we calculated the per-residue fluctuation by root-mean-square-fluctuation (RMSF) analysis. The RMSF results show that the active-site residues of each compound had an entirely different pattern of fluctuations. Comparing the RMSF results of compound Zn1 with the reference compound showed smaller fluctuations for residues 80–110 (∼0.4 to 1.0 Å) and 122–142 (0.7–0.8 Å). Smaller fluctuations indicate a more stable complex, and vice versa. The remaining residues were comparable in fluctuations with the reference compound. Though in some regions the reference compound had fewer fluctuations, considering the other analysis parameters like binding energies, docking scores, RMSD, and RMSF values, Zn1 seems to be a better inhibitor than the reference compound (Figure 3A).
Figure 3.

Root-mean-square fluctuation (RMSF) analysis. The black lines in all graphs show the RMSF plot of the reference compound. (A) RMSF graph of Zn1, (B) Zn2, (C) Zn3, (D) Ch1, and (E) Ch2.
Also, compound Zn2 has almost the same residue fluctuation pattern as compound Zn1, with fewer fluctuations of 0.4–0.9 Å for residues 80–110 and 0.5–0.8 Å for residues 122–157. Other regions have local fluctuation as compared to the reference compound, and in some regions, the reference compound has local fluctuations as compared to the selected compounds. Although the reference compound seems stable in some regions, considering other analysis parameters, Zn2 can be judged to be a better candidate than the reference compound (Figure 3B). Similarly, compound Zn3 showed similar residue fluctuations as Zn2: it also has lesser fluctuations, i.e., 0.4–1 Å for residues 80–115. However, the compound is comparable to or even better than the reference compound by considering other analysis parameters (Figure 3C). The other two compounds, i.e., Ch1 and Ch2, have similar RMSF results and are found to have local fluctuations as compared to the reference compound (Figure 3D,E). The residues’ fluctuations might be the reason that the binding pocket of the bacterium protein gained the flexibility and the pocket had become smaller after the deletion of residue ala438.
In other words, the active-site residues become more stable as the guanidine group of residue Arg357 becomes flexible and moves away from the active site, but still the selected compound interacted in a much better way and moved the system toward stability, which supported their capacity of drug-likeness for such cases of TB (Figure 6).
Figure 6.

Ligand interaction of reference compound (F), and the five finally selected compounds, i.e., Zn1 (A), Zn2 (B), Zn3 (C), Ch1 (D), and Ch2 (E). The green colors show the ligand molecule.
2.7. Functional Displacement of RpsA Mutant Complexes
In order to know the functional displacement of all of the systems as a function of time, we have performed the dynamics cross-correlation matrix (DCCM) method. The results indicate that the binding-site residues where compound Zn1 bonded showed a positive correlation compared with the reference compound (Figure 4A,B), which further confirms that the positive correlation might be due to the adopted interactions of these compounds with key residues (residue regions 40–80, 120, and 160), like hydrophobic, hydrophilic, and hydrogen. These residues also comprise the binding site. Overall, the DCCM results delineate that the reference compound and our selected compound showed similar patterns of strong positive correlation, particularly at the residues where the compounds mostly bonded and some additional nearby residues also showed positive correlation, as shown in Figure 4C–F. The deep blue color indicates strong negative correlation, while the red color indicates strong positive correlation among the residues. The positively correlated residues move in a similar direction, while the negatively correlated residues move in opposite directions. The details of interactions of active-site residues and all compounds are enlisted in Table 6.
Figure 4.

(A) DCCM of the reference compound, (B) Zn1, (C) Zn2, (D) Zn3, (E) Ch1, and (F) DCCM of Ch2.
Table 6. Protein–Ligand Interaction (PLI) Details of the Finally Selected Compounds in Complex with the RpsA Protein.
| interaction
details |
|||||||||
|---|---|---|---|---|---|---|---|---|---|
| compound | docking score | ligand | receptor | interaction | distance | E (kcal/mol) | |||
| Zn1 | –5.0323 | N9 | 9 | OE2 | GLU | 318 | H-donor | 2.74 | –8.1 |
| O17 | 17 | NH1 | ARG | 357 | H-acceptor | 2.94 | –3.3 | ||
| N9 | 9 | OE2 | GLU | 318 | ionic | 2.74 | –6.5 | ||
| N14 | 14 | OE2 | GLU | 318 | ionic | 3.10 | –3.8 | ||
| 5-ring | N | GLU | 318 | π–H | 4.43 | –0.6 | |||
| Zn2 | –4.5883 | N7 | 7 | OE2 | GLU | 318 | H-donor | 2.83 | –4.4 |
| C18 | 18 | O | ARG | 355 | H-donor | 2.93 | –0.6 | ||
| O12 | 12 | NH1 | ARG | 357 | H-acceptor | 3.33 | –1.1 | ||
| O12 | 12 | NH2 | ARG | 357 | H-acceptor | 3.24 | –3.6 | ||
| Zn3 | –4.9008 | O17 | 17 | O | GLU | 318 | H-donor | 2.78 | –1.7 |
| O18 | 18 | NH1 | ARG | 357 | H-acceptor | 2.83 | –4.2 | ||
| O18 | 18 | NH2 | ARG | 357 | H-acceptor | 3.15 | –1.5 | ||
| 6-ring | 6-ring | TYR | 280 | π–π | 3.67 | –0.0 | |||
| Ch1 | –5.9046 | C12 | 12 | OE2 | GLU | 318 | H-donor | 3.46 | –0.5 |
| O20 | 20 | OH | TYR | 280 | H-acceptor | 2.74 | –3.9 | ||
| 5-ring | N | GLU | 318 | π–H | 3.64 | –0.8 | |||
| 6-ring | 6-ring | PHE | 310 | π–π | 3.50 | –0.0 | |||
| Ch2 | –5.8531 | N20 | 20 | OE1 | GLU | 318 | H-donor | 2.70 | –18.5 |
| O11 | 11 | NH1 | ARG | 357 | H-acceptor | 2.75 | –3.7 | ||
| C22 | 22 | 6-ring | PHE | 310 | H−π | 4.07 | –1.1 | ||
| 6-ring | CB | ARG | 356 | π–H | 4.68 | –0.6 | |||
| reference compound | –4.5138 | N | 11 | O | GLU | 318 | H-donor | 2.85 | –1.7 |
| S | 6 | NH2 | ARG | 357 | H-acceptor | 3.86 | –2.6 | ||
| N | 10 | NH1 | ARG | 357 | H-acceptor | 2.88 | –8.2 | ||
2.8. Principal Component Analysis of RpsA Mutant Complexes
Motion mode analysis was performed in order to explore dynamically favorable conformational changes in the chemistry of the bonded compounds and the targeted protein. The input selected for principal component analysis (PCA) was the coordinate covariance matrix calculated from the time series of 3D positional coordinates of different compound complexes throughout the 100 ns MD simulation time. The results show that except for Zn3, all the other compound complexes had almost similar patterns and did not deviate from one energy state to another, while Zn3 showed a different pattern with different energy states, which might indicate the unstable pattern of binding of the compound in the active site of the mutant state of the RpsA protein. All other compound complexes showed similar energy states, which indicate that most of the time (the whole MD time), the compound resides in the same site, resulting in similar energy states (Figure 5A–F).
Figure 5.

(A) PCA of the reference compound, (B) Zn1, (C) Zn2, (D) Zn3, (E) Ch1, and (F) PCA of Ch2.
Furthermore, we tried to understand the most dominant structural interactions of the compounds and protein with the aid of eigenvalues and eigenvectors. The results helped us to separate the high-energy state complexes from the low-energy states, which could ultimately lead to identification of lead compounds as compared to the reference compound. It was found that each complex exhibits a different motion from the other one. It has been noted that the phase motion of the reference compound was mixed and clustered (Figure 5A), as shown by the blue dots in the beginning followed by red and then blue dots. The dots (each dot represents a single conformation) of the compound Zn1 were found be in an arranged form (ordered) and compact as compared to the reference compound, starting from the red-color dot and ending in blue-color dots covering the area from −300 to +300 along PC1 and −200 to +100 along PC2. As for the reference compound, it was not so assembled; rather it was more dispersed, indicating that Zn1 has a good magnitude along with motion of the mutated RpsA during the overall MD simulation time. The complex of Zn1 resides in an almost similar energy state (Figure 5B), revealing the stable behavior. The complex of Zn2 showed little disassembly, but was still more arranged than the reference compound, starting from the red-color dot and ending in blue color covering a phase space of −350 to +400 along PC1 and −200 to +300 along PC2 (Figure 5C). The Zn3 complex showed a lot of dispersion and occupied a large phase space during the whole MD time (Figure 5D). The other two compounds (Ch1 and Ch2) have the same pattern of phase motion along the magnitude. The Ch1 complex covers an area of phase space from −200 to +300 along PC1 and −200 to +200 along PC2, whereas Ch2 and reference compounds also cover almost the same (Figure 5E,F).
2.9. Ligand Interaction and Visualization
The 3D compound interactions and visualization of all compounds was carried out in order to study their interaction in detail. The compound Zn1 showed 02 stronger hydrogen bonding with the active-site residues, i.e., Arg357 and Glu318, with 02 ionic interactions with residue Glu318 and a π-stacking interaction with residue Glu318, along with several hydrophobic interactions with residues Ile317, Tyr280, Phe310, and Arg356. The ligand interaction details are given in Table 6, while the 3D interactions are shown in Figure 6. The interaction table shows that compound Zn2 forms 03 hydrogen bonds with active-site residues Glu318, Arg355, and Arg357, along with several hydrophobic interactions like Lys303, Tyr280, Phe310, and Arg356 as shown in Figure 6B. The compound Zn3 shows 03 hydrogen bond interactions with residues Glu318 and Arg357, with a π–π interaction with residue Tyr280 as shown in Figure 6C and Table 6.
According to the interaction detail given in Table 6, the compound Ch1 has 01 π–H bonding with residue Glu318, with 01 π–π stacking interaction with residue Phe310 and 02 hydrogen bonding with residues Glu318 and Tyr280. Similarly, Ch2 has stronger interactions than all other compounds; it has 04 hydrogen bonds, 03 with residue Glu318, and 01 with residue Arg357, along with 02 ionic bonds with residue Glu318, an H−π interaction with residue Phe310 and π–H with residue Arg356, as shown in Figure 6E and Table 6. The reference compound has fewer interactions with the targeted protein as compared to the selected compounds.
The reference compound has only 01 hydrogen bond interaction with residues Glu318 and Arg357, with some hydrophobic interactions with residues Tyr280 and Phe310 as shown in Figure 6F and Table 6.
3. Discussion
The reference compound is an active potent inhibitor for the deleted ala438 RpsA protein state.12 The compound bound to the active site of mutated RpsA consisting of residues Lys303, Phe307, Phe310, and Arg357, which could help in stopping the trans-translation of the bacterium, and may shorten the life of the bacterium and cure MDR/XDR tuberculosis. The first-line drugs of TB do not bind to the active site of the protein, due to the mutation in the corresponding protein-conserved region. This mutation (deletion of ala438) makes the active site of the protein smaller and more flexible. In first-line drug therapy, the POA, which is the active form of PZA, was the most successful drug that binds to residues Lys303, Phe307, Phe310, and Arg307 of the RpsA protein and forms different interactions.12 However, upon mutation, POA fails to bind to the active site of RpsA of the mutated bacterium. The reference compound showed good activity against such cases.12 The current study uses various computational drug design methodologies, such as virtual screening, docking, and molecular dynamics simulation, to identify the best compound to shorten the disease’s treatment schedule and cure it cost-effectively based on this active compound. During these various computational approaches, we have identified a total of 05 differently diverse compounds, having better dynamics simulation results than the reference compound. Among the selected and reference compounds, compound Zn1 was found to be the most active against the mutant state of the RpsA protein. The other 04 compounds showed similar dynamics behavior like RMSF data to the reference compound, but their RMSD, DCCM, PCA, and protein–ligand interaction (PLI) profile showed that these selected compounds were more active and formed stronger interactions with the mutant state of the RpsA protein. The selected compounds have a lower RMSD graph as compared to the reference compound, which indicated that the binding of these selected compounds to the active site of the mutant state of the RpsA protein makes the protein more stable as compared to the reference compound. Binding of RpsA to these compounds instead of its substrate may destroy its activity and creates an unfavorable condition for the bacterium.
It has also been found that these compounds had lower PB and GB values; lowering of these values indicates good binding free energies, which in turn means higher stability, or, in other words, maximum or strong interaction of the compound with the protein. The DCCM results of these compounds also showed that the selected compounds, especially Zn1, has a strong positive correlation with the active-site residues (deeper red color) as compared to the reference compound, which has a slight positivity. The PLI profile showed that the selected compounds have stronger and more intermolecular interaction with the residues of the target protein than the reference compound. Moreover, all of these 06 compounds also passed through the PAINS electronic filter and there were no artifacts found. These compounds were also found drug-able after applying Lipinski Ro5, with a good docking score. The above results revealed that these compounds may have the ability to bind to the active site of the targeted protein and stop its activity, which ultimately could cure the MDR/XDR M. tuberculosis.
4. Conclusions
Various attempts have been made, and numerous drugs have been identified, in order to have a brief and successful regimen of M. tuberculosis. The current study was designed to identify a candidate drug that has better efficacy, ADMET properties, is free of PAINS, and shortens the regimen of the disease. Based on the reference compound of the target protein RpsA, we have identified 05 variously diverse compounds. All these identified compounds were compared with the reference compound via various computational methodologies. The results show that all of the selected compounds were notable due to their having drug-likeness, binding energies, and interaction with the key residues of the active site. Among these, compound Zn1 was identified as the most active, which showed a lesser α-carbon deviation and residue fluctuation, better interaction with residues, and a good binding energy, i.e., −22.8870 and −2.6319 kcal/mol, respectively. Overall, compound Zn1 may have the potential to shorten the regimen of TB.
5. Materials and Methods
5.1. Exploration of Drug-Like Features
A pharmacophore based on the reference compound was designed for exploring drug-like features in the compound, leading to the inspection of large chemical libraries in MOE v2016. The reference compound was first docked rigidly into the active site of mutated RpsA, followed by pharmacophore generation with the EHT approach. The pharmacophore was generated with 07 features, of which 02 were marked as essential features. The RpsA protein with pdb code 4NNI(14) was downloaded from the protein data bank and mutated in MOE v2016 by deleting the residue ala438. The generated model was validated by a test database containing anti-Tb drugs along with the reference compound. All compounds of the test database were screened on the 07-featured complex-based pharmacophore and their mapping modes were analyzed.
5.2. Assessment of Drug-Like Features with Chemical Libraries
For evaluation and assessment of the drug-like features, the validated pharmacophore geometry was screened with chemical libraries like ZINC and ChemBridge using a virtual screening protocol implemented in MOE v2016. Such a model is used as 3D query during in silico screening to identify the best hits of different physicochemical properties. The main purpose of such screening is to identify a novel drug-like pose for further assessment.15 A total of 335 and 1692 hits were retrieved from ZINC and ChemBridge library, respectively, as a result of the screening. To predict the drug-likeness of the compounds, Lipinski Ro5 was applied, according to which the compound that is drug-like would have a log P in the range of −0.4 to +5.6; a molecular weight of 180 to 500 Da; number of atoms ranging from 20 to 70 (including H-bond donors not more than 5 and H-bond acceptors not more than 10); and a polar surface area no greater than 140 Å.16 By strictly following the above rules, 260 and 749 hits, respectively, for ZINC and ChemBridge libraries were selected for further evaluation.
5.3. Molecular Interaction Study and Selection of Lead Compounds
For molecular interaction studies and selection of lead compounds, all of the retrieved hits were docked into the active site of mutated RpsA. A docking protocol implemented in MOE v2016 with parameters like rigid and ligand-based docking was performed. A maximum of total 10 conformations were allowed to be saved for each ligand using the default parameters of MOE, i.e., Placement: Triangle Matcher, Rescoring: London dG, GBVI/WSA dG, and Refinement: Rigid Receptor. Using the SVL script of MOE, the RMSD between the co-crystal and re-docked conformation was calculated as 0.78 Å, suggesting that our docking protocol is reliable.17 On the basis of the docking score, 05 top-ranked compounds were selected for further evaluation. All of the 05 compounds having better or at least comparable binding affinity and binding energy to the reference compound were selected for molecular dynamic simulations. The docking score, binding mode, pharmacophore mapping, binding energy (stability), binding affinity, and visual ligand interaction indicate that these selected lead compounds might act as structurally diverse, potent, and novel antagonists for the mutated ribosomal protein RpsA of Mtb.
5.4. PAINS Filter Assay
The Pan Assay Interference Compounds (PAINS) is an electronic filter, focused on the quality of compounds in the database. PAINS analyzes the compounds that are likely to be more assay-interfering and chemically reactive, frequently hitting, and not known by toxicophoric filters.18 Therefore, it is recommended to study a combination of filtered compounds for obtaining the desired pharmacokinetic properties like ADMET of a compound earlier in drug designing and development. An online PAINS server18 was used to pass the compounds through this filter, and the ADMET properties were predicted by visiting the online server http://biosig.unimelb.edu.au/pkcsm/prediction. Only those compounds that passed the PAINS filter and had better ADMET properties were selected.
5.5. All-Atoms Molecular Dynamics Simulation
The top 05 compounds having better docking score, binding affinity, binding energy, and better interaction as compared to the reference compound were studied for molecular dynamics simulations. MD simulations revealed important energetic and structural information about the major biomolecules, and receptor and ligand interactions. MD simulations and analyses for the systems were carried out in AMBER v2018 with the force field (ff14SB).19 To neutralize the system, counter ions (Na+ and Cl–) were added by using the LEAP module. The octahedral box of TIP3P water model with a 12.0 Å buffer was used for solvating the whole system. For the van der Waals and long-range electrostatic interactions, the cutoff distance 10 Å was used. For treatment of long-range electrostatic interactions, the Particle Mesh Ewald PME algorithm was used.20 The SHAKE algorithm was used to constrain the bonds involving hydrogen atoms, followed by 0.5 ns of constant pressure equilibration at 300 K.21 For controlling the temperature, Langevin dynamics was used.22 Finally, 100 ns MD simulation was carried out with the CUDA version of PMEMD in GPU for all of the equilibrated complex systems at constant temperature and pressure.23 MD trajectories were analyzed using the CPPTRAJ module of Amber v2018.
5.6. Dynamic Cross-Correlation Map
The DCCM is a 3D matrix image that indicates the correlation of movement of amino acid residues with time. This analysis was carried out to study the comparison of Cα atoms throughout the correlation matrix for all of the complexes and systems24 in order to evaluate the continuous correlations of domains. Based on the Cα carbon atoms, the DCCM analysis used 9800 snapshots. The Cα carbon atoms in the trajectories were cross-correlated with the displacements of the backbone Cα atoms. Sij is the symbolic representation of the correlation coefficient, where i and j are atoms and Sij is the correlation coefficient between them; mathematically
| 1 |
where the bracket “⟨⟩” defines the time average during the whole trajectory. Δri or Δrj represents the displacement vector calculated by subtracting the instantaneous position of the ith or jth atom from its average position. The value of DCCM ranges from −1 to +1, where Sij > 0 represents the movement with positive correlation (same direction) between two atoms, i.e., ith and jth atoms, whereas Sij < 0 shows the movement with negative correlation (opposite direction) between the ith and jth atoms. Cpptraj was used for the analysis of DCCM, and Origin software was used for plotting the data.25 In the graph of DCCM, two types of correlations are shown, i.e., positive correlation and negative correlation. A positive correlation indicates that the ligand and protein movements occur in the same direction and the system achieves stability while they interact with each other. In contrast, a negative correlation indicates that the ligand moves away from the binding pocket and gives anti-parallel correlation, or that the complex is unstable. Moreover, the intensity of the color in the DCCM map is directly proportional to the strength of the positive and negative correlations. These correlations are indicated by red to light red, and blue to light blue color, respectively. The red color shows positive correlation and blue color shows negative correlation; a deeper color means a stronger respective correlation, and vice versa.
5.7. Principal Component Analysis
The principal movements of high amplitude were assessed by PCA analysis in the receptor26 using cpptraj package. The covariance matrix was calculated by taking the Cα coordinates, followed by the analysis of eigenvalues and eigenvectors with the diagonalized covariance matrix. The PCs, i.e., eigenvectors, indicate the direction of movement of the ligand and receptor atoms, whereas the corresponding eigenvalues represent the mean square fluctuations of the atoms of the complex. PC1 and PC2 were used for calculation and plotting purposes to check their motions.
5.8. MM-PBSA Calculation
MM-PBSA/GBSA is used for calculation of binding free energies. The MMPBSA/GBSA approach is based on the combination of continuous solvent fashions and molecular mechanical energies. For these calculations, the MMPBSA.py a python script was used to calculate the free energy of the reference compound and selected (searched) compounds. In this study, the BFE (binding free energy) of various sample compounds in comparison to the reference compound was calculated. The binding free energy was calculated according to the following formula:
| 2 |
where ΔGbind is the binding free energy, ΔGcomplex is the free energy of the complex, ΔGreceptor is the energy of the protein, and ΔGligand is the free energy of the ligand.
Acknowledgments
The authors from King Khalid University of Saudi Arabia extend their appreciation to the Deanship of Scientific Research at King Khalid University for funding the work through Research Project R.G.P.2/156/42.
The authors declare no competing financial interest.
References
- Chakaya J.; Khan M.; Ntoumi F.; Aklillu E.; Razia F.; Mwaba P.; Kapata N.; Mfinanga S.; Hasnain S. E.; Katoto P. D. Global Tuberculosis Report 2020–Reflections on the Global TB burden, treatment and prevention efforts. Int. J. Infect. Dis. 2021, 113, S7–S12. 10.1016/j.ijid.2021.02.107. [DOI] [PMC free article] [PubMed] [Google Scholar]
- Tiberi S.; Petersen E.; Maeurer M.; Ntoumi F.; Yeboa-manu D.; Mwaba P.; Vilaplana C.; Dar O.; Bates M.; Corrah T.; et al. Taking forward the stop TB partnership and world health organization joint theme for world TB day march 24th 2018—“wanted: leaders for a TB-free world. You can make history. End TB”. Int. J. Infect. Dis. 2018, 68, 122–124. 10.1016/j.ijid.2018.03.002. [DOI] [PubMed] [Google Scholar]
- Conde M. B.; Melo F. A. F. D.; Marques A. M. C.; Cardoso N. C.; Pinheiro V. G. F.; Dalcin P. D. T. R.; Machado Junior A.; Lemos A. C. M.; Netto A. R.; Durovni B.; et al. III Brazilian thoracic association guidelines on tuberculosis. J. Bras. Pneumol. 2009, 35, 1018–1048. 10.1590/S1806-37132009001000011. [DOI] [PubMed] [Google Scholar]
- Yadon A. N.; Maharaj K.; Adamson J. H.; Lai Y.-P.; Sacchettini J. C.; Ioerger T. R.; Rubin E. J.; Pym A. S. A comprehensive characterization of PncA polymorphisms that confer resistance to pyrazinamide. Nat. Commun. 2017, 8, 588 10.1038/s41467-017-00721-2. [DOI] [PMC free article] [PubMed] [Google Scholar]
- Mitchison D. Mechanisms of the action of drugs in the short-course chemotherapy. Int. J. Tuberc. Lung Dis. 1985, 60, 36. [PubMed] [Google Scholar]
- Singh V.; Mizrahi V. Identification and validation of novel drug targets in Mycobacterium tuberculosis. Drug Discovery Today 2017, 22, 503–509. 10.1016/j.drudis.2016.09.010. [DOI] [PubMed] [Google Scholar]
- Zuniga E. S.; Early J.; Parish T. The future for early-stage tuberculosis drug discovery. Future Microbiol. 2015, 10, 217–229. 10.2217/fmb.14.125. [DOI] [PMC free article] [PubMed] [Google Scholar]
- Zumla A.; Rao M.; Parida S. K.; Keshavjee S.; Cassell G.; Wallis R.; Axelsson-Robertsson R.; Doherty M.; Andersson J.; Maeurer M. Inflammation and tuberculosis: host-directed therapies. J. Intern. Med. 2015, 277, 373–387. 10.1111/joim.12256. [DOI] [PubMed] [Google Scholar]
- Doustdar F.; Pazhang M.; Mehrnejad F.; Safarzadeh M.; Rabiei D.; Chaparzadeh N.; Falahati H.; Mir-Derikvand M. Biochemical characterization and computational identification of Mycobacterium tuberculosis pyrazinamidase in some pyrazinamide-resistant isolates of Iran. Protein J. 2015, 34, 181–192. 10.1007/s10930-015-9610-5. [DOI] [PubMed] [Google Scholar]
- Shi W.; Zhang X.; Jiang X.; Yuan H.; Lee J. S.; Barry C. E.; Wang H.; Zhang W.; Zhang Y. Pyrazinamide inhibits trans-translation in Mycobacterium tuberculosis. Science 2011, 333, 1630–1632. 10.1126/science.1208813. [DOI] [PMC free article] [PubMed] [Google Scholar]
- Cole S. T. Pyrazinamide—old TB drug finds new target. Science 2011, 333, 1583–1584. 10.1126/science.1212450. [DOI] [PubMed] [Google Scholar]
- Zhi Y.; Dai Y.; Yang J.; Tan S.; Lin D.; Lin K. Lead compounds and key residues of ribosomal protein S1 in drug-resistant Mycobacterium tuberculosis. Bioorg. Chem. 2019, 82, 58–67. 10.1016/j.bioorg.2018.09.024. [DOI] [PubMed] [Google Scholar]
- Yang J.; Liu Y.; BI J.; Cai Q.; Liao X.; Li W.; Guo C.; Zhang Q.; Lin T.; Zhao Y. Structural basis for targeting the ribosomal protein S1 of Mycobacterium tuberculosis by pyrazinamide. Mol. Biol. 2015, 95, 791–803. 10.1111/mmi.12892. [DOI] [PubMed] [Google Scholar]
- Rehman A. U.; Khan M. T.; Liu H.; Wadood A.; Malik S. I.; Chen H.-F. Exploring the pyrazinamide drug resistance mechanism of clinical mutants T370P and W403G in ribosomal protein S1 of Mycobacterium tuberculosis. J. Chem. Inf. Model. 2019, 59, 1584–1597. 10.1021/acs.jcim.8b00956. [DOI] [PubMed] [Google Scholar]
- Kurogi Y.; Guner O. F. Pharmacophore modeling and three-dimensional database searching for drug design using catalyst. Curr. Med. Chem. 2001, 8, 1035–1055. 10.2174/0929867013372481. [DOI] [PubMed] [Google Scholar]
- Veber D. F.; Johnson S. R.; Cheng H.-Y.; Smith B. R.; Ward K. W.; Kopple K. D. Molecular properties that influence the oral bioavailability of drug candidates. J. Med. Chem. 2002, 45, 2615–2623. 10.1021/jm020017n. [DOI] [PubMed] [Google Scholar]
- Wadood A.; Riaz M.; Uddin R.; et al. In silico identification and evaluation of leads for the simultaneous inhibition of protease and helicase activities of HCV NS3/4A protease using complex based pharmacophore mapping and virtual screening. PLoS One 2014, 9, e89109 10.1371/journal.pone.0089109. [DOI] [PMC free article] [PubMed] [Google Scholar]
- Baell J. B.; Holloway G. A. New substructure filters for removal of pan assay interference compounds (PAINS) from screening libraries and for their exclusion in bioassays. J. Med. Chem. 2010, 53, 2719–2740. 10.1021/jm901137j. [DOI] [PubMed] [Google Scholar]
- Salomon-Ferrer R.; Case D. A.; Walker R. C. An overview of the Amber biomolecular simulation package. Wiley Interdiscip. Rev. Comput. Mol. Sci. 2013, 3, 198–210. 10.1002/wcms.1121. [DOI] [Google Scholar]
- Darden T.; York D.; Pedersen L. Particle mesh Ewald: An N· log (N) method for Ewald sums in large systems. J. Chem. Phys. 1993, 98, 10089–10092. 10.1063/1.464397. [DOI] [Google Scholar]
- Ryckaert J.-P.; Ciccotti G.; Berendsen J. Numerical integration of the cartesian equations of motion of a system with constraints: molecular dynamics of n-alkanes. J. Comput. Phys. 1977, 23, 327–341. 10.1016/0021-9991(77)90098-5. [DOI] [Google Scholar]
- Zwanzig R. Nonlinear generalized Langevin equations. J. Stat. Phys. 1973, 9, 215–220. 10.1007/BF01008729. [DOI] [Google Scholar]
- Götz A. W.; Williamson M. J.; Xu D.; Poole D.; Le Grand S.; Walker R. C. Routine microsecond molecular dynamics simulations with AMBER on GPUs. 1. Generalized born. J. Chem. Theory Comput. 2012, 8, 1542–1555. 10.1021/ct200909j. [DOI] [PMC free article] [PubMed] [Google Scholar]
- Piao S.; Liu Q.; Chen A.; Janssens I. A.; Fu Y.; Dai J.; Liu L.; Lian X.; Shen M.; Zhu X. Plant phenology and global climate change: Current progresses and challenges. Global Change Biol. 2019, 25, 1922–1940. 10.1111/gcb.14619. [DOI] [PubMed] [Google Scholar]
- Doody R. S.; Thomas R. G.; Farlow M.; Iwatsubo T.; Vellas B.; Joffe S.; Kieburtz K.; Raman R.; Sun X.; Aisen P. S.; et al. Phase 3 trials of solanezumab for mild-to-moderate Alzheimer’s disease. N. Engl. J. Med. 2014, 370, 311–321. 10.1056/NEJMoa1312889. [DOI] [PubMed] [Google Scholar]
- Amadei A.; Linssen A. B.; Berendsen H. J. Essential dynamics of proteins. Proteins 1993, 17, 412–425. 10.1002/prot.340170408. [DOI] [PubMed] [Google Scholar]