Abstract
Torrefaction of biomass is a promising thermochemical pretreatment technique used to upgrade the properties of biomass to produce solid fuel with improved fuel properties. A comparative study of the effects of torrefaction temperatures (200, 250, and 300 °C) and residence times (0.5 and 1 h) on the quality of torrefied biomass samples derived from spent coffee grounds (SCG) and coffee husk (CH) were conducted. An increase in torrefaction temperature (200–300 °C) and residence time (0.5–1 h) for CH led to an improvement in the fixed carbon content (17.9–31.8 wt %), calorific value (18.3–25 MJ/kg), and carbon content (48.5–61.2 wt %). Similarly, the fixed carbon content, calorific value, and carbon content of SCG rose by 14.6–29 wt %, 22.3–30.3 MJ/kg, and 50–69.5 wt %, respectively, with increasing temperature and residence time. Moreover, torrefaction led to an improvement in the hydrophobicity and specific surface area of CH and SCG. The H/C and O/C atomic ratios for both CH- and SCG-derived torrefied biomass samples were in the range of 0.93–1.0 and 0.19–0.20, respectively. Moreover, a significant increase in volatile compound yield was observed at temperatures between 250 and 300 °C. Maximum volatile compound yields of 11.9 and 6.2 wt % were obtained for CH and SCG, respectively. A comprehensive torrefaction model for CH and SCG developed in Aspen Plus provided information on the mass and energy flows and the overall process energy efficiency. Based on the modeling results, it was observed that with increasing torrefaction temperature to 300 °C, the mass and energy yield values of the torrefied biomass samples declined remarkably (97.3% at 250 °C to 67.5% at 300 °C for CH and 96.7% at 250 °C to 75.1% at 300 °C for SCG). The SCG-derived torrefied biomass tested for CO2 adsorption at 25 °C had a comparatively higher adsorption capacity of 0.38 mmol/g owing to its better textural characteristics. SCG would need further thermal treatment or functionalization to tailor the surface properties to attract more CO2 molecules under a typical post-combustion scenario.
1. Introduction
The transition toward attaining a sustainable and renewable energy economy from a petroleum-based economy has gained much attention in recent times. The worldwide interest in sustainable energy resources is mainly due to the escalating demand for energy resources, the gradual depletion of petroleum resources, and the environmental concerns associated with its worldwide utilization.1 Moreover, the consumption of non-renewable petroleum resources is presumed to have a negative impact on the ecological system.
In the past few decades, the global CO2 emissions from large-point stationary sources have increased significantly and are the main contributor to climate change. It is predicted that by the year 2035, the atmospheric concentration of CO2 could reach about 550 ppm.2 In addition, the global temperature is also expected to rise by approximately 2 °C.2 Therefore, researchers, the scientific community, and policymakers face the challenges of developing sustainable and environmentally benign energy resources as well as developing innovative and cost-effective methods to minimize CO2 or other toxic gas emissions.
The post-combustion CO2 capture units are considered as one of the feasible solutions to reduce CO2 emissions.3,4 The post-combustion method involves capturing CO2 from the mixed flue gas stream after the complete combustion. Compared to other existing CO2 capture technologies (pre-combustion or oxy-fuel combustion), post-combustion capture can be retrofitted to the existing industries without significant modifications.5,6 In addition, the post-combustion method is easy to set up and is also a cost-effective CO2 capture technology.
Post-combustion CO2 capture technology uses wet/dry adsorbents and the principle of adsorption/desorption to trap CO2 molecules from the flue gas stream. Activated carbon (AC) and biochar are widely studied as the carbon-based adsorbents for post-combustion capture techniques due to the availability of a large specific surface area, microporous structure, hydrophobicity, and superior CO2 adsorption capacity.4 Activated carbon can be produced from a single- or two-step pyrolysis (thermally treating biomass/organic wastes in an inert environment) and subsequent physical or chemical activation.
The previous study of Mukherjee et al.5 showed that biochar synthesized from spent coffee grounds (SCG) could serve as a promising carbon-based adsorbent for CO2 capture via post-combustion technology. The SCG-derived biochar produced from slow pyrolysis at 600 °C displayed a relatively higher specific surface area of 539 m2/g, microporous structure, and improved adsorption capacity of 2.8 mmol/g.5 Although promising results were realized, several knowledge gaps are prevailing. For instance, the biochar used in our previous study was produced by slow pyrolysis. However, a few studies have evaluated the post-combustion CO2 capture of carbonaceous materials produced from other thermochemical conversion methods such as torrefaction or hydrothermal carbonization. Furthermore, most reports presented in this field are related to the experimental studies7 or kinetics.8,9 However, it is challenging to scale up a process without implementing and comparing modeling studies to the experimental results. For instance, it is challenging to calculate the energy requirements of an entire process with experimental results alone.10 Also, experimental results alone do not provide adequate information needed for preliminary economic evaluation.
Torrefaction is fundamentally a mild thermochemical pretreatment exploited mainly for upgrading biomass characteristics. The process is conducted at a moderate temperature ranging from 200 to 300 °C in an oxygen-deficient condition. Moreover, torrefaction is characterized by lower heating rates and long reactor residence time under atmospheric conditions.11 The fundamental advantage of torrefaction is that the biomass samples are converted into high-quality fuels with lower atomic ratios and high energy density. The properties of torrefied biomass are comparable to those of conventional fossil fuels such as coal.12 Hydrophobicity properties in torrefied biomass make it easier for efficient storage, handling, and long-distant transportation.
Several researchers have studied and reported the torrefaction process as a biomass pretreatment technique for improving its fuel characteristics.13,14 In a recent study, Sarker et al.15 reported the improvement in biomass characteristics after undergoing mild to severe torrefaction treatment using barley straw (BS), canola hull (CH), and oat hull (OH). Chen et al.16 showed that torrefied biomasses fall in the periphery of high-volatile bituminous coal when synthesized at high temperatures. Despite many impressive studies related to biomass torrefaction, a few studies have reported the effect of torrefaction on the fuel properties of SCG and coffee husk (CH). To the best of the author’s knowledge, no study has reported the possibility of using torrefied SCH or CH as solid material for postcombustion CO2 capture. In contrast, numerous studies have reported the use of activated carbon for post-combustion CO2 capture.8,17,18 Tiwari et al.18 showed that almond shell-prepared activated carbon is effective for CO2 removal. In another study, Dilokekunakul et al.17 prepared activated carbon from bamboo waste and studied the effect of N, O, and different functional groups on CO2 capture. To fill the knowledge gaps, this study aims to evaluate the impacts of temperature and residence time on the yield and physicochemical properties of torrefied SCG and CH.
Another novelty of this study is the development of a comprehensive biomass torrefaction model. The model is essential for process optimization and techno-economic analyses. The torrefaction model can estimate the product distribution and by-products of the process. Furthermore, torrefaction models provide the information required to bridge the gap between academia and industry research. SCG and CH were selected as feedstock for this study due to their availability and the promising results obtained from both feed materials in our previous studies.5,19 Furthermore, SCG and CH have no significant applications as they are mostly discharged into landfills, causing a detrimental impact to the environment owing to the emission of toxic materials. Therefore, their valorization would help minimize environmental pollutions originating from their disposal.
2. Results and Discussion
2.1. Ultimate, Proximate, and pH Analyses of the Precursors and Torrefied Biomass Samples
The ultimate, proximate, and pH analyses reveal the modifications in chemical composition before and after the exposure of the precursors (SCG and CH) to torrefaction, and the findings are summarized in Table 1. The carbon, hydrogen, nitrogen, sulfur, and oxygen compositions of SCG and CH were characteristics of typical lignocellulosic (agricultural) biomass materials such as bamboo, rice husk, and oil palm.20 The carbon contents of SCG (50 wt %) and CH (48.5 wt %) fall in the periphery of typical lignocellulosic biomasses. On the contrary, SCG has superior hydrogen (6.7 wt %) and sulfur content (0.9 wt %) compared with CH. It should be emphasized that both coffee residues showed a low sulfur content of less than 1 wt % and nitrogen content (<3 wt %). Low sulfur and nitrogen contents are desirable for thermochemical conversion processes, especially the reactions involving a catalyst. Moreover, low sulfur and nitrogen contents mean that there will be fewer emissions of nitrous and sulfides during thermochemical conversion processes.
Table 1. Ultimate, Proximate, and pH Analyses of the Precursors and Torrefied Biomass Samples (Dried Basis).
| ultimate analysis |
proximate analysis |
atomic ratios |
|||||||||||
|---|---|---|---|---|---|---|---|---|---|---|---|---|---|
| precursor | torrefaction conditions (temperature–time) (°C–h) | C (wt %) | H (wt %) | N (wt %) | S (wt %) | Oa (wt %) | volatile matter (wt %) | ash (wt %) | moisture (wt %) | fixed carbonb (wt %) | H/C | O/C | pHc |
| coffee husk (CH) | raw material | 48.5 | 5.9 | 2.8 | 0.6 | 40.6 | 77.7 | 1.7 | 2.7 | 17.9 | 1.43 | 0.63 | 6.8 |
| 200–0.5 | 50.5 | 5.6 | 2.8 | 0.2 | 36 | 75.3 | 1.9 | 2.2 | 20.6 | 1.31 | 0.53 | 7.1 | |
| 200–1 | 51.6 | 5.5 | 2.9 | 0.1 | 33 | 74.6 | 2.1 | 1.9 | 21.4 | 1.26 | 0.48 | 7.2 | |
| 250–0.5 | 56.3 | 5.4 | 3.3 | 0.1 | 25.6 | 71.1 | 2.2 | 1.8 | 24.9 | 1.13 | 0.34 | 7.4 | |
| 250–1 | 58.6 | 5.3 | 3.3 | 0.1 | 22.1 | 70.4 | 2.7 | 1.7 | 25.2 | 1.07 | 0.28 | 7.7 | |
| 300–0.5 | 60.3 | 5.0 | 3.3 | 0.1 | 17.6 | 64.8 | 3.1 | 1.5 | 30.6 | 0.99 | 0.22 | 8.3 | |
| 300–1 | 61.2 | 4.8 | 3.5 | 0.2 | 15.3 | 63.5 | 3.3 | 1.4 | 31.8 | 0.93 | 0.19 | 8.8 | |
| spent coffee grounds (SCG) | raw material | 50 | 6.7 | 2.3 | 0.9 | 39.0 | 81.2 | 0.9 | 3.3 | 14.6 | 1.6 | 0.60 | 5.5 |
| 200–0.5 | 52.8 | 6.6 | 2.2 | 0.06 | 37.3 | 79.7 | 1.07 | 3.5 | 15.7 | 1.5 | 0.53 | 5.6 | |
| 200–1 | 54.4 | 6.5 | 2.8 | 0.1 | 35.1 | 78.3 | 1.1 | 2.5 | 18.1 | 1.45 | 0.48 | 5.9 | |
| 250–0.5 | 56.3 | 6.3 | 2.4 | 0.03 | 33.5 | 73.2 | 1.3 | 2.2 | 23.3 | 1.37 | 0.45 | 6.1 | |
| 250–1 | 59.4 | 6.3 | 2.7 | 0.04 | 30.1 | 72.6 | 1.6 | 2.1 | 23.7 | 1.3 | 0.38 | 6.3 | |
| 300–0.5 | 67.8 | 6.2 | 3.0 | 0.03 | 21 | 68.3 | 1.8 | 1.8 | 28.1 | 1.13 | 0.23 | 6.4 | |
| 300–1 | 69.5 | 6.0 | 3.2 | 0.03 | 19 | 67.8 | 2.0 | 1.2 | 29 | 1.0 | 0.20 | 6.7 | |
| lignited | 61.9 | 4.3 | 0.9 | 16.4 | 8.5 | 0.80 | 0.20 | ||||||
Calculated by the difference: O (wt %) = 100 – (C + H + N + S + ash) wt %.
Calculated by the difference: fixed carbon content (wt %) = 100 – (volatile matter + ash + moisture) wt %.
Standard deviations for the pH measurements of the tested samples were ±0.02.
Values for lignite are obtained from Kim et al.24
The ultimate analysis of the torrefied biomass samples reveals a change in elemental composition for both precursors. The results indicate that notable alterations in composition occur during torrefaction regardless of the type and nature of the precursor. Moreover, an elevation in the torrefaction temperature from 200 to 300 °C at 0.5 h led to a significant improvement in C content for both the precursors. For instance, the C content of SCG-derived torrefied solid was 52.8 wt % at 200 °C and 0.5 h residence time. However, a rise in the torrefaction temperature to 300 °C and 1 h produced an elevation in the C content to 69.5 wt %. On the contrary, with an increase in torrefaction temperature and residence time, the torrefied biomass samples’ oxygen, hydrogen, and sulfur contents reduced, irrespective of the biomass. The reduction in oxygen fraction could be attributed to the disruption of the polymeric structure mainly hemicellulose followed by cellulose between 200 and 300 °C during torrefaction. Moreover, owing to the series of devolatilization and decomposition reactions of the lignocellulosic components that take place during torrefaction, the oxygen content was reduced sharply. The decline in hydrogen content with elevating torrefaction temperatures to 300 °C could also be attributed to the release of hydrocarbons (CH4 and C2H6) during torrefaction.15 It should also be highlighted that no clear pattern was evident in the change in nitrogen composition in torrefied biomass samples with variations in torrefaction temperatures or residence time. Similar observations were reported in previous studies.21,22
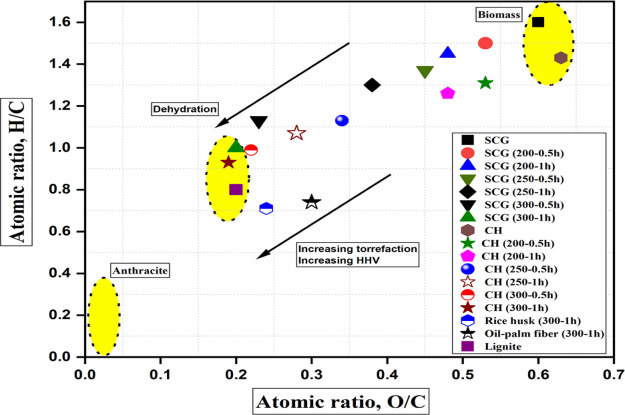
The proximate analysis presented in Table 1 indicates that both SCG and CH showed a high content in the volatile matter range of 77.7–81.2 wt % and therefore could exhibit poor combustion efficiency and fuel characteristics. However, torrefaction of the precursors led to a decline in the volatile matter and moisture content with increasing process severity (Table 1). Surprisingly, the ash content of all the torrefied solids is greater than those of the precursors. However, all the ash contents are still low and less than lignite coal (8.5 wt % ash content). Decreasing ash content is favorable for thermochemical conversion processes. Biomass ash contains inorganic elemental composition that often creates operating challenges such as slagging, fouling, or obstruction in the combustion units.9 For that reason, a low ash content of the torrefied solid residues is desirable. Significant changes in the proximate analysis were not evident at a lower range of temperature (200 °C) because only moisture and light volatile compounds were eliminated from the biomass samples. The Van Krevelen diagram presented in Figure 1 shows the extent of reactivity and fuel characteristics of the precursors and the torrefied biomass samples. Compared to the precursors, the torrefied biomass samples showed lower atomic ratios (H/C and O/C) owing to low H and O content. Moreover, comparatively, CH-derived torrefied biomass samples under the most severe conditions (300 °C and 1 h) had the lowest values of H/C (0.93) and O/C (0.19). Both the atomic ratios (H/C and O/C) declined remarkably and were influenced by increasing torrefaction temperature and longer residence time. The atomic ratios of the torrefied biomass samples are within the periphery of lignite coal (Table 1). Chen et al.16 and Lu al.23 have reported a similar finding on declining atomic ratios using rice husk and oil palm fiber as the starting materials, respectively, as shown in the Van Kravelen plot. The findings on atomic ratios reveal that torrefaction of both the precursors improved their fuel properties for subsequent biological or thermochemical conversion processes.
Figure 1.
Van Krevelen Plot of the precursors and torrefied biomass samples.
pH analysis was used to assess the acidity or basicity of the torrefied samples. The pH values of the tested samples are also summarized and presented in Table 1. SCG and CH had pH values of 5.5 and 6.8, respectively. These values are often regarded as very weak acidic values. However, torrefaction of the precursors led to an increase in pH values beyond neutral values to the very weak to mild basic range. Therefore, it can be inferred that torrefaction of SCG and CH improved their pH values. An increase in pH for both the precursors also indicates a decrease in acidic functional groups in the torrefied solids and a similar finding was observed from the FTIR analysis. Owing to the Lewis acid nature of CO2 molecules, the improvement of pH for both the precursors to the basic range could facilitate the CO2 capture process owing to acid–base interactions.
2.2. Moisture-Sorption Test of the Precursors and Torrefied Biomass Samples
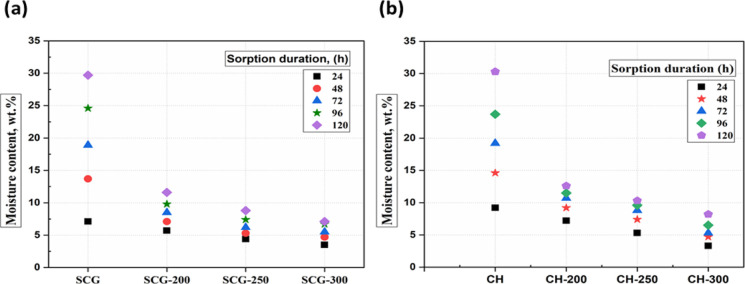
The improved hydrophobic characteristics of the torrefied samples were evaluated through an equilibrium moisture content test, and the results are presented in Figure 2a,b. The torrefaction temperature significantly impacted the equilibrium moisture content compared with the influence of residence times. Therefore, the impact of varying torrefaction temperatures at a fixed residence time of 1 h is presented in Figure 2a,b. The figures also depict the relationship between the percentages of moisture absorbed with time at varying torrefaction temperatures for the individual coffee residues. SCG and CH are hydrophilic (strong affinity for water) due to the presence of increased polar moieties in hemicellulose (oxygenated) and the ability to form a hydrogen bond.
Figure 2.
Moisture-sorption test of precursors and torrefied biomass samples: (a) SCG and (b) CH.
As presented in Figure 2a,b, the equilibrium moisture contents of SCG and CH after 120 h were 30 and 29 wt %, respectively. However, the moisture uptake of torrefied biomass samples derived from SCG and CH synthesized under the severe conditions (300 °C for 1 h) reduced its level in the range of 8.2–7.1 wt % compared with the precursors. The decline in the equilibrium moisture content of the torrefied biomass samples compared with the biomass samples indicates that the thermal treatment transformed the physical structure and characteristics of the precursor from its hydrophilic nature to more hydrophobic.
The increased hydrophobicity of SCG- and CH-derived torrefied biomass samples could be due to the dissolution and disintegration of polar functional groups such as O–H and C–O bonds present in hemicellulose molecules of the biomass and the release of oxygenated hydrophilic groups. In addition, the formation of an unsaturated polymer structure in the precursors and the disintegration of hemicellulose and lignin during torrefaction could also lead to the elimination of hydrogen bonds in water, thereby improving their hydrophobicity.12 Moreover, as the severity of torrefaction conditions increases, the amorphous hemicellulose and small cellulose crystallite fractions degrade, thereby limiting the adsorption of moisture in the torrefied samples.25 It is necessary to highlight that the resistance of biomass samples to fungal attack is proportional to the moisture uptake. Therefore, a decline in the moisture uptake of the torrefied biomass implies that torrefaction would enhance the resistance of biomass to fungal attack under humid conditions.26 Improved hydrophobicity is favorable for long-time storage, transportation, and CO2 capture under typical postcombustion conditions.
2.3. BET Analysis of the Precursors and Torrefied Biomass Samples
A summary of the textural properties of the precursors and torrefied biomass samples is presented in Table 2. As evident irrespective of the precursors, the torrefaction temperature significantly influenced the specific surface area. The specific surface area for SCG-derived torrefied biomass samples increased from 11 m2/g to 100 m2/g when the torrefaction temperature rose from 200 °C for 0.5 h (mild) to 300 °C for 1 h (severe). A similar trend in the improvement of the specific surface area was observed for CH-derived torrefied biomass samples, as highlighted in Table 2. However, the values obtained are comparatively less than the SCG-derived torrefied biomass. The specific surface area of CH-derived torrefied biomass samples is within the range of 15–24 m2/g for mild–severe treatment conditions. A more porous structure in SCG-derived torrefied samples could be attributed to the removal of volatiles, tars, degradation of lignin, and loss of oxygenated species from the pores, creating a network of void spaces in the carbon matrix. Similar findings were reported by Sarker et al.15 They have reported that with increasing severity of the torrefaction process conditions, the biomass structures rupture to produce more porous structures and a higher specific surface area.
Table 2. BET Analysis of the Precursors and Torrefied Biomass Samples.
| parameter | SCG | SCG-200 (0.5 h) | SCG-300 (1 h) | CH | CH-200 (0.5 h) | CH-300 (1 h) |
|---|---|---|---|---|---|---|
| BET surface area, m2/g | 2.3 | 11 | 100 | 3.5 | 15 | 24 |
| total pore volume, 10–3 cm3/g | 1.2 | 7.2 | 10.4 | 2.4 | 3.7 | 5.5 |
| mean pore size, nm | 10.1 | 8.4 | 5.8 | 23.1 | 13.4 | 8.1 |
2.4. FTIR of the Precursors and Torrefied Biomass Samples
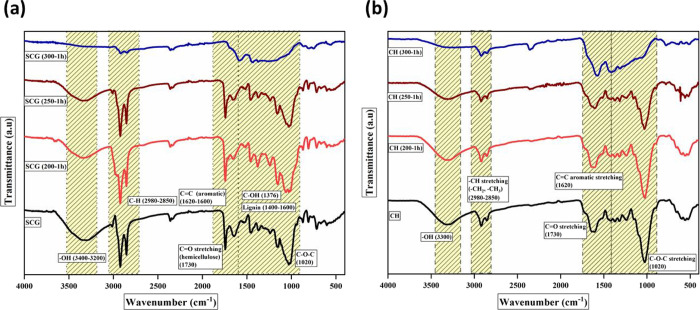
To determine the impact of torrefaction conditions on the chemical structure of the biomasses and torrefied biomass samples, the Fourier transform infrared spectroscopy (FTIR) analysis was conducted, as shown in Figure 3a,b. The FTIR spectra of the biomasses and torrefied samples heated up to 250 °C are almost similar in shape owing to the absence of significant changes in their chemical structure. However, the changes in the vibration intensity of the FTIR spectra at 300 °C for 1 h (severe treatment conditions) are more pronounced than precursors at 200 and 250 °C. The characteristic peak at around 3200–3400 cm–1 characterizes O–H vibration (stretching) present mainly in the lignocellulosic component (cellulose). The peak reduced drastically and disappeared with increasing torrefaction temperature due to partial dehydration and carbohydrate decomposition with increasing severity of torrefaction conditions.27 The inception of the peaks at around 2980–2850 cm–1 is attributed to the presence of vibrations (stretching) of asymmetric and symmetric aliphatic groups (C–H), which narrowed and disappeared in the torrefied samples.28 The band at around 1730 cm–1 in both precursors and torrefied biomass samples could be attributed to the carbonyl stretching (C=O) of acetyl, carboxylic acid, aldehyde, or ketone groups in hemicellulose. It starts to disappear from 250 °C and with increasing temperature progressively to 300 °C and 1 h duration. The peak at around 1730 cm–1 is eliminated owing to the complete decomposition of the carbonyl groups in hemicellulose present in the torrefied biomass samples. This demonstrates that a chemical change appears from the decomposition of hemicellulose and the disintegration of long-chain polysaccharides in the tested samples. The peak at 1620–1600 cm–1 represents the aromatic skeletal vibration of C=O with no significant change in the vibrational intensity of this peak observed at a lower range of temperatures.7 The inception of the peak reveals the aromatization of the torrefied samples. This characteristic reflects its stability in the torrefied biomass samples and enrichment of lignin components. Among all the build block components found in biomasses, hemicellulose is the most reactive biopolymer owing to lack of crystallinity and lower degree of polymerization.29 Therefore, hemicellulose goes through the most significant decomposition reactions during torrefaction, as evident from the less intensified peaks at 300 °C for the respective torrefied samples. From the spectrum presented in Figure 3a,b, it can be concluded that by increasing the temperature to mild conditions (200 and 250 °C), the peaks are retained, but under the severe torrefaction condition (300 °C–1 h), noticeable changes in the spectra of the tested samples are observed. The changes are attributed to the release of oxygenated species mainly from complete destruction of hemicellulose and limited disintegration of cellulose.
Figure 3.
FTIR analysis of precursors and torrefied samples at different temperatures: (a) SCG and (b) CH.
2.5. Thermal Stability Analysis of the Torrefied Biomass Samples
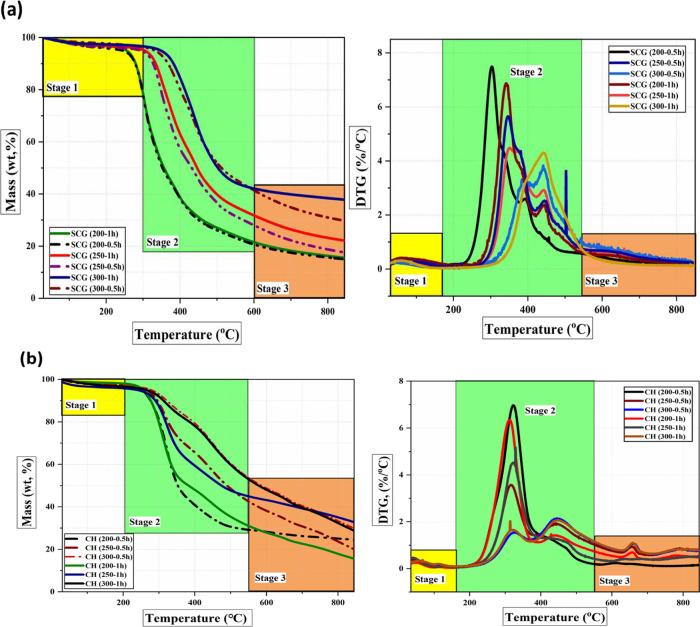
The TGA-DTG profiles for SCG and CH and the torrefied biomass samples are presented in Figure S1 in the Supporting Information. Moreover, the devolatilization profiles of the torrefied samples are shown in Figure 4a,b. The thermal decomposition pattern of the torrefied biomass samples differs from that of the precursors, most significantly under mild to severe torrefaction conditions (250 and 300 °C). From the DTG curve, the two prominent peaks observed for the precursors overlapped for the torrefied biomass samples, and the peaks represent the disintegration temperature of cellulose and lignin. Owing to the loss of hemicellulose as the main lignocellulosic component at around 320 °C, the lignin content increased in both the tested samples. Additionally, the decline in the rate of mass loss of the torrefied biomass samples and the peak shifting to a higher temperature also indicated the attainment of thermal stability of the torrefied biomass samples compared to the precursors. Irrespective of the precursors, the thermal stability is attained under the severe torrefaction conditions (300 °C and 1 h) and the CH-derived torrefied biomass sample is thermally more stable than SCG.
Figure 4.
TGA-DTG analysis of torrefied biomass samples at different torrefaction temperatures: (a) SCG and (b) CH.
As can be seen (Figure 4a,b), the thermal decomposition process of the precursors (Figure S1) and torrefied samples can be separated into three distinct stages. The first stage that occurs at a temperature of up to 200 °C corresponds to dehydration and the removal of light volatile matter content from the precursors. However, the mass loss associated with dehydration was insignificant for the torrefied samples, confirming the tested samples’ hydrophobic nature compared to the raw precursor. The second stage occurs at temperatures ranging from 200 to 500 °C. This stage is characterized by pyrolytic volatile combustion and is termed the active phase.22 Decomposition of the basic lignocellulosic building blocks, including hemicellulose (220–315 °C), cellulose (315–400 °C), and lignin (160–900 °C), occurred at this stage. Depending on the torrefaction temperature, this stage could proceed in one or two phases. The first phase corresponded to the combustion of hemicellulose and cellulose components within the temperature range of 190–400 °C. Two visible peaks with maximum mass loss in DTG curves can be observed in this stage (Figure 4a,b). The first peak corresponds to the degradation of hemicellulose at 322 °C with a maximum mass loss rate of 1.02%/°C, and the second peak relates to cellulose degradation at 400 °C with a maximum mass loss rate of 1.03%/°C. Moreover, the weight loss at the first phase was approximately 70% for raw precursors, which decreased to about 30% for the torrefied 300 °C–1 h samples, and corresponded to the maximum devolatilization process. It should be observed that the decomposition of hemicellulose in the first peak had the highest reactivity compared to cellulose and lignin for both the precursors. This indicates the high reactivity of hemicellulose as confirmed by the FTIR analysis. Moreover, the peak representing the decomposition of hemicellulose did not appear for the torrefied samples at 300 °C–1 h, which further highlights the loss and disintegration of hemicellulose during torrefaction.
The third stage (500–800 °C) corresponded to char oxidation. Residue fixed carbon is combusted in this stage, which has the lowest reactivity, and the rate of mass loss declined. As seen from Figure 4a,b, no peak appeared in the DTG curve during this stage. The decline in the rate of mass loss of the torrefied biomass samples and the peak shifting to a higher temperature also indicated the attainment of thermal stability of the torrefied biomass samples compared to the precursors. Irrespective of the precursors, the thermal stability is attained under the severe torrefaction conditions (torrefaction temperature of 300 °C and longer residence time of 1 h). The CH-derived torrefied biomass sample is thermally more stable than SCG owing to a lesser mass loss rate and peak shifting to a higher temperature.
2.6. XPS of the Torrefied Biomass Samples
X-ray photoelectron spectroscopy is carried out to understand the impact of torrefaction temperatures and residence time on the elemental composition and surface functional groups in the precursors and torrefied biomass samples. Moreover, it also provides information on the qualitative and quantitative analyses of the different amounts of elements in the precursors and torrefied biomass samples. The findings of the survey scan for the respective torrefied biomass samples are presented in Table 3.
Table 3. Elemental Composition of Torrefied Biomass Samples.
| sample | C1s | O1s | N1s | Si2p |
|---|---|---|---|---|
| SCG-200-0.5h | 84.9 | 15.3 | 1.3 | 2.2 |
| SCG-300-1h | 90.8 | 8.7 | 1.6 | 0.5 |
| CH-200-0.5h | 83.4 | 14.2 | 1.2 | 1.1 |
| CH-300-1h | 85.9 | 10.9 | 2.4 | 0.7 |
The elemental composition obtained from the wide survey scan of the tested samples reveals a similar trend where the surface is dominated by C followed by O, N, and a small amount of Si, irrespective of the precursors. The XPS analysis findings complement the ultimate analysis (bulk) findings, where SCG-derived torrefied biomass samples were predominantly carbonaceous in nature, followed by CH-derived torrefied biomass samples synthesized at 300 °C for 1 h (Table 4). The C content increased to 90.8–85.9 wt %, and O reduced slightly to 8.7–10.9 wt % for SCG- and CH-derived torrefied biomass samples synthesized at 300 °C. The increase in C content and a decline in O content and O/C demonstrate the carbonization, cracking of bonds, aromatization, and decarboxylation during biomass torrefaction.
Table 4. Solid Yield (%), HHV, Energy Density Ratio, and Energy Yield (%) of the Precursors and the Torrefied Biomass Samples.
| torrefaction
conditions (temperature–residence
time) (°C–h) |
||||||
|---|---|---|---|---|---|---|
| material | temperature (°C) | residence time (h) | solid mass yield (%) | HHV (MJ/kg, dry basis) | energy density ratio | energy yield (%) |
| coffee husk (CH) | raw material | dried | 100 | 18.3 | 1 | 100 |
| 200 | 0.5 | 93.3 | 19.3 | 1.05 | 97.9 | |
| 200 | 1 | 89.6 | 20.03 | 1.09 | 97.6 | |
| 250 | 0.5 | 72 | 23.8 | 1.3 | 93.6 | |
| 250 | 1 | 68.3 | 24 | 1.3 | 89.5 | |
| 300 | 0.5 | 49.7 | 24.6 | 1.34 | 68 | |
| 300 | 1 | 48.1 | 25 | 1.4 | 67.1 | |
| spent coffee grounds (SCG) | raw material | dried | 100 | 22.3 | 1 | 100 |
| 200 | 0.5 | 93.2 | 23 | 1.03 | 96.5 | |
| 200 | 1 | 90.4 | 23.6 | 1.06 | 95.6 | |
| 250 | 0.5 | 78.6 | 25.5 | 1.14 | 90 | |
| 250 | 1 | 77.1 | 25.7 | 1.15 | 89 | |
| 300 | 0.5 | 55.1 | 28.6 | 1.24 | 74.4 | |
| 300 | 1 | 54.3 | 30.3 | 1.3 | 70.6 | |
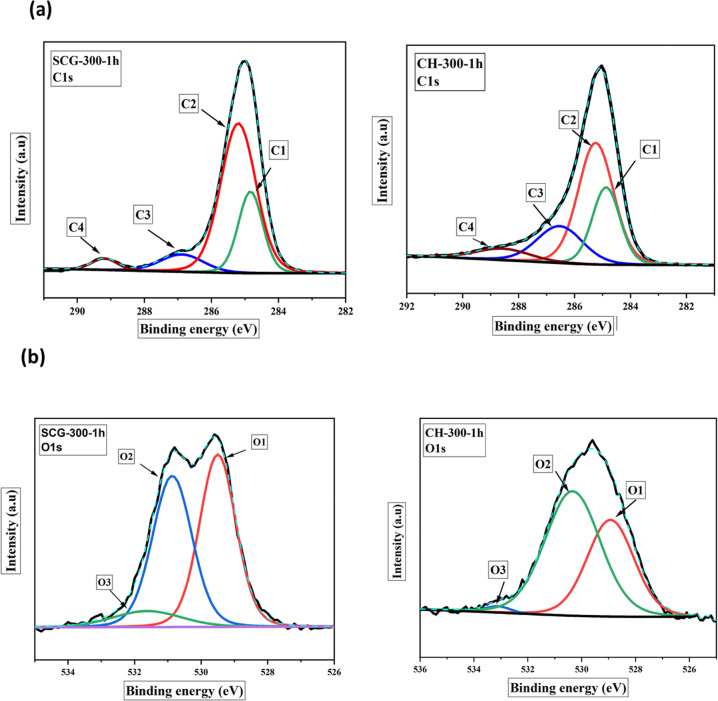
The deconvoluted C1s and O1s spectra of the respective precursors and the SCG- and CH-derived biochars at 300 °C for 1 h are shown in Figure 5a,b, and the variation in content obtained from the survey scan is presented in Tables S1 and S2. Azargohar et al.30 suggested that the C1s spectra contain the following functional groups in the carbon matrix: peak (I) for aromatic/aliphatic sp2 carbon (C–C/C=C/C–CHx) observed at BE = 284.1–284.7 eV, peak (II) for sp3-C and C–O bonding at B.E. = 285.5–285.9 eV, peak (III) for −C–OR for ether and hydroxyls/phenol group (C–OH) observed at B.E. = 286.1−286.4 eV, and peak (IV) for C=O for carboxylic acids or ester observed at B.E. = 288.0–288.8 eV. Also, Azargohar et al.30 suggested that the O1s spectra could be deconvoluted into three peaks; peak (I) at 531.2–531.5 eV for carbonyl and ketone/lactone, peak (II) at 532.04–532.3 eV for C–OH functional groups, and peak (III) at 533.3 eV for ether oxygen atoms in anhydrides and esters. As can be seen, both SCG and CH are dominated by C–C/C–Hx functional groups. Also, the relative proportion of C–C/C=C/C–Hx functional groups increased from 25.2–24.4 wt % to 34.3–31.0 wt % for SCG- and CH-derived torrefied samples, respectively, when the torrefaction conditions changed from mild to severe conditions.
Figure 5.
Deconvoluted spectra of SCG-300-1h and CH-300-1h: (a) C1s and (b) O1s.
The trend of increasing −C–C/C=C/C–Hx confirmed the increment in aromatic content and disintegration of aliphatic groups. On the contrary, the hydroxyl, carbonyl, and ester functional groups reduced with torrefaction harshness. These findings indicated the occurrence of series of dehydration and decarboxylation reactions releasing CO2 and H2O during torrefaction and agree with the findings of the FTIR analysis. Also, owing to the decomposition of the O–H group from the surface of biomasses, the hydrophobic characteristics were improved in the torrefied biomass samples as also evident from the moisture-sorption test presented in Section 2.2.
2.7. SEM of the Precursors and Torrefied Biomass Samples
To gain a deeper insight into the impact of torrefaction on the morphology of SCG and CH, the scanning electron microscopy (SEM) images of the respective precursors before and after torrefaction at different temperatures (200 and 300 °C) and residence times (0.5 h and 1 h) are presented in Figure 6. It should be mentioned that the images have been amplified by a factor of 1000.
Figure 6.
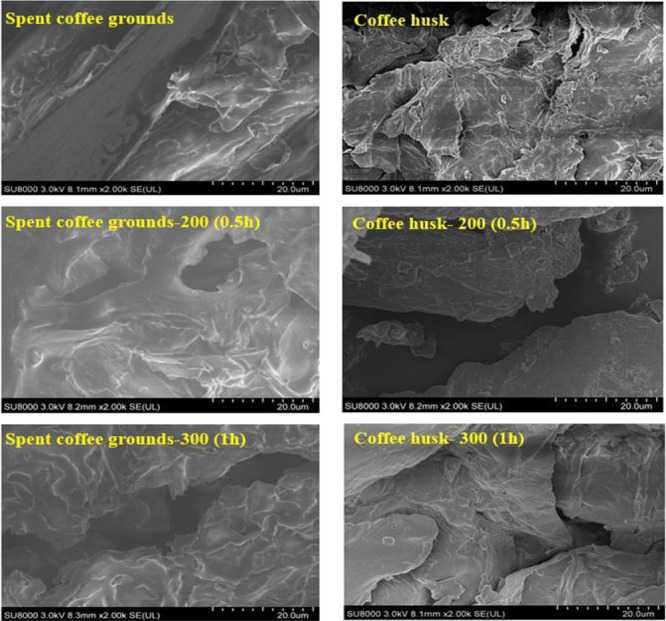
Scanning electron microscopy of SCG- and CH-derived torrefied biochar samples at different temperatures.
The structural change is much noticeable at a higher range of temperatures compared to the precursors. As the torrefaction conditions shifted to 300 °C for 1 h, the surface degrades. An increasing number of characteristic openings and voids are observed on the surface, resulting in a much scrappier structure. During torrefaction, especially under the most severe torrefaction condition (300 °C and 1 h), cell-wall distortion is visible, and microapertures are created owing to the disintegrated torrefied solid surface. This phenomenon could be attributed to the release of volatile compounds and carbonization under the severe torrefaction conditions that caused the formation of porous and brittle torrefied biochar samples. The microstructure can be observed on the surfaces where some microfibers are seen due to biomass structure rupture.
A similar observation on the change in the morphology of the torrefied biomass samples was reported by Sarker et al.15 They have observed that more porous but disintegrated biochar structures are formed with increasing severity of the torrefaction conditions.
2.8. Solid and Energy Yield of the Precursors and the Torrefied Samples
The resultant mass yield, higher heating value (HHV), energy yield of CH and SCG, and torrefied samples are summarized in Table 4. The results show that biomass exposure to a higher temperature had a negative impact on mass yield compared to the residence time. For instance, at a constant residence time of 0.5 h, an increase in temperature from 200 °C to 300 °C led to a decline in mass yield from 93.2 wt % to 55.1 wt % for SCG. This behavior could be because of the decomposition of volatile components into liquid and gaseous products.31 It could also be attributed to the accelerated thermal degradation of the lignocellulosic components, mainly hemicellulose, without any significant degradation on cellulose or lignin in precursors.21
Considerable decreases in the mass yield of torrefied CH and SCG to 48.1 and 54.3%, respectively, were observed at 300 °C and 1 h of residence time. This finding implies that approximately 45.7–51.9 wt % coffee residues degraded thermally as the temperature increased and with prolonged duration. Moreover, due to the inherent difference in composition, the SCG had a superior solid yield compared to CH.
The energy yield ranged between 70.6 and 67.1% for SCG- and CH-derived torrefied samples. However, CH-derived torrefied samples have a superior energy yield compared to SCG samples. It should be highlighted that the energy yield of the torrefied samples at all temperatures was below 100% due to the loss in energy during the torrefaction process. Additionally, from Table 4, it is evident that the energy density ratio improved for both the precursors with increasing severity of the torrefaction. Fuel with high energy density is always desirable. It will be less expensive in transportation and storage because it would occupy less storage or unit energy for transportation. The HHV values of the torrefied solids also increase with the severity of torrefaction. Furthermore, when compared with the raw precursor, torrefied solids have higher HHV values. The HHV values are widely represented in the Van Kravelen diagram, where torrefied samples obtained at 300 °C and 1 h were found at the lower end of the diagram, demonstrating an improved HHV.
2.9. Model Validation
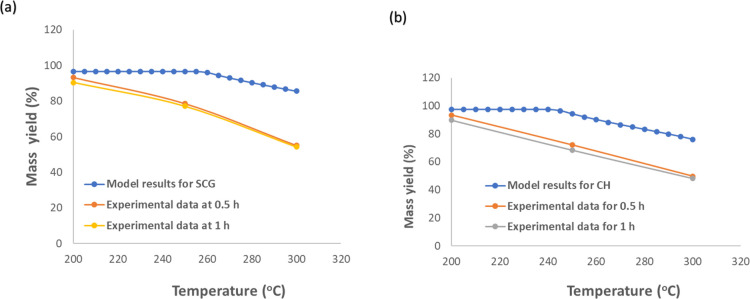
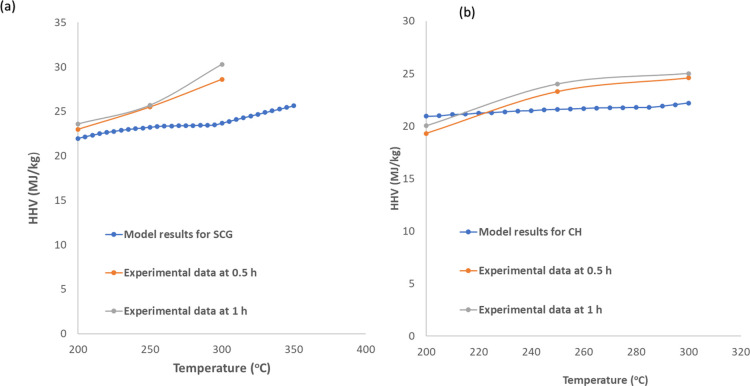
Experimental data for mass yields and HHV values from SCG and CH torrefaction at different torrefaction temperatures and residence times were used to validate the accuracy of the torrefaction model in this regard. The model validation plots for mass yields from the respective biomasses are presented in Figure 7a,b. It can be seen from Figure 7a,b that the experimental mass yield correlates with the model predictions at a lower range of torrefaction temperature (200 °C). However, the model predictions are higher than the experimental results for both biomasses at mild-higher torrefaction temperatures (<200 °C). On the other hand, Figure 8a,b compares the HHV values from experimental and model yields. From Figure 10a,b, it can be seen that the HHV values from experimental data are close to the model values with a deviation of less than 7% observed at 300 °C.
Figure 7.
Model validation for mass yields during torrefaction of coffee residues for (a) SCG-derived torrefied solids and (b) CH-derived torrefied solids.
Figure 8.
Model validation for HHV during torrefaction of coffee residues for (a) SCG-derived torrefied solids and (b) CH-derived torrefied solids.
Figure 10.
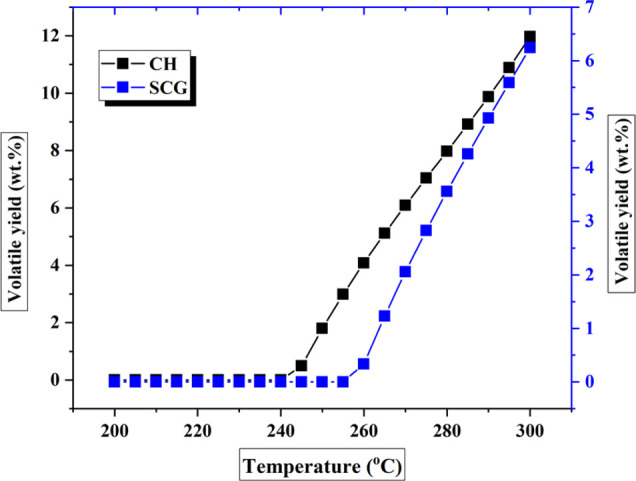
Effect of torrefaction temperatures on the decomposition of volatile compounds.
Some deviations exist between the experimental results and model values due to several reasons such as the reactor type, type of precursors, and heating rate. However, the trends for both HHV values and mass yields are similar. Moreover, the most significant deviations for both biomasses are less than 10%. These deviations are relatively small and permissible for engineering applications in the industries. Therefore, the model could be used to further to explain different phenomena occurring during the torrefaction process.
2.9.1. Parametric Studies
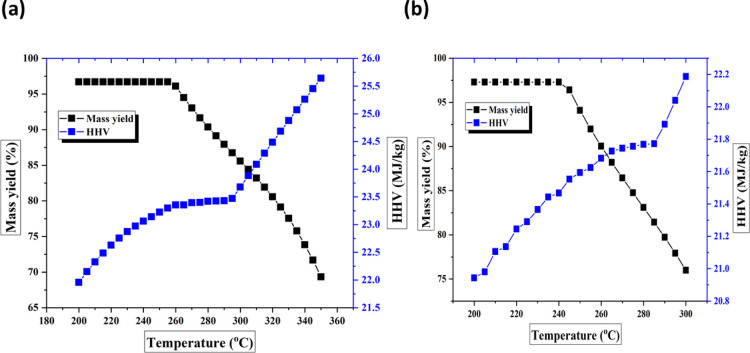
The impacts of torrefaction temperatures on the mass yield and HHV values of the torrefied biomass samples are studied and presented in Figure 9a,b. The simulation was performed at a temperature range of 200–300 °C. It should be noted that the effect of time was less pronounced when compared with torrefaction temperature; therefore, the residence time was kept constant at 1 h. It can be observed from Figure 9a,b that the mass yield remains almost the same at a temperature range between 200 and 250 °C. However, when the temperature rose above 250 °C, a significant decline in mass yield was observed for both precursors. For example, the mass yield of SCG solid at 250 °C was reported as 96.7%. Moreover, a rise in temperature to 300 °C led to a significant decline in the mass yield to 67.5%. Similarly, the mass yields of CH solids decreased from 97.3% at 250 °C to 75.1% at 300 °C.
Figure 9.
Effect of torrefaction temperatures on the mass yield and HHV values of (a) SCG-derived torrefied biomass samples and (b) CH-derived torrefied biomass samples.
Regarding the HHV values, it was observed that there is a consistent increase in the HHV values of the torrefied biomass samples with temperature, irrespective of the precursors. For instance, the HHV values of SCG solids rose from 22 MJ/kg at 200 °C to 23.7 MJ/kg at 300 °C. In the same way, CH solid HHV values increased from 20. 9 MJ/kg to 22.2 MJ/kg. The increase in HHV values and the decline in mass yields with temperature confirm the analytical characterization results reported in the previous sections. To understand why there is a significant decline in mass yields with temperature and an elevation in HHV values, the yields of volatile components were also simulated.
The change in volatile compound yields with torrefaction temperature is shown in Figure 10. As shown in Figure 10, at temperatures between 200 and 250 °C for both biomasses, the amount of volatiles decomposed is almost negligible. This explains why there is an increase in mass yield at this temperature range. On the contrary, beyond 250 °C, a significant increase in volatile compounds yield was observed. Maximum volatile compound yields of 11.9 and 6.2 wt % were obtained for CH and SCG, respectively.
The simulations result of volatile yield decomposition aligns with the TGA findings reported in the previous section. Additionally, the increased HHV values of the torrefied samples could be attributed to the change in their elemental compositions (CHNSO values) compared to the raw precursors, as reported in Table 1. The C content of the torrefied biomass samples increases when compared with the biomasses, although the oxygen and hydrogen content is reduced. These changes in ultimate composition promote the elevation in HHV values. These findings are in agreement with the previously reported literature.10,27,30
2.10. CO2 Capture Performance of Torrefied Samples from SCG and CH
The CO2 adsorption performance of SCG- and CH-derived torrefied biomass samples at 300 °C and 1 h was executed in a fixed-bed reactor at 25 °C and in the presence of 30 vol % CO2 (balanced by N2). The breakthrough capture performance of the tested samples is shown in Figure 11. As observed from Figure 11, the adsorption of gases proceeds continuously until the point of saturation is attained by the bed of torrefied biomass samples.
Figure 11.
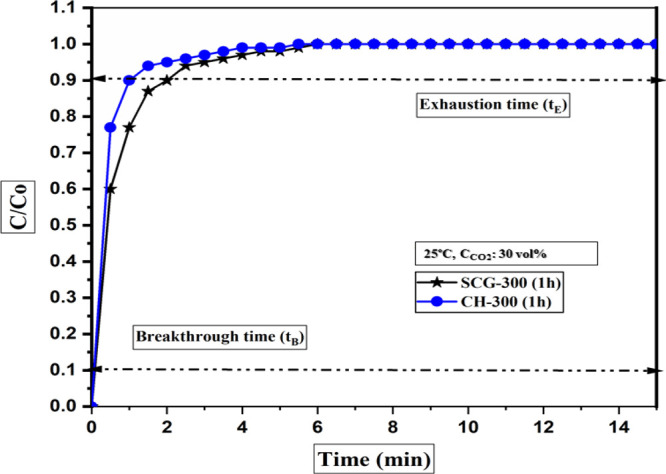
Breakthrough CO2 capture balanced by N2.
In general, under the similar capture scenario (25 °C and 30 vol % CO2 balanced by N2), the torrefied sample derived from SCG presents a higher adsorption capacity (0.38 mmol/g) at equilibrium than that derived from CH (0.23 mmol/g). The physiochemical transformation of SCG-derived torrefied samples under the severe conditions (300 °C and 1 h) could probably account for a higher equilibrium adsorption capacity under a similar capture scenario. It presents a comparatively porous structure, higher specific surface area, and well-developed functional species (basic-oxygenated) on the surface of the SCG-derived torrefied biomass sample. It had a significant impact on the capture performances. However, to improve the CO2 capture performance, the biomass needs further thermal treatment or chemical functionalization to attract more CO2 molecules under the post-combustion scenario.
3. Conclusions
The impact of torrefaction temperature and residence time on the yield and physicochemical properties of torrefied biomass samples derived from SCG and CH was studied. Furthermore, the performance of the torrefied biomass for post-combustion CO2 capture was evaluated. An increase in torrefaction of SCG and CH led to a rise in the carbon content of the torrefied solids. On the contrary, the torrefied solids’ hydrogen, sulfur, and oxygen contents decrease with an increase in torrefaction temperature for both precursors. The decline in hydrogen content with elevating torrefaction temperature could be attributed to the release of lighter hydrocarbons during torrefaction. An equilibrium moisture-sorption content test confirms a decrease in the torrefied samples’ moisture uptake compared with the raw precursors. The observation confirms an improvement in the hydrophobicity of the torrefied samples. The increased hydrophobicity of torrefied solids could be attributed to the dissolution and disintegration of the polar groups, such as hydroxyl (O–H bonds) present in hemicellulose molecules of the precursors.
The experimental mass yields were compared with model results obtained from Aspen Plus simulation. The experimental mass yield correlates with the model predictions at 200 °C. However, the model predictions are slightly higher than the experimental results for both precursors at temperatures above 200 °C. Overall, this study shows that torrefaction influences the fuel properties of biomass by increasing the heating value, decreasing the moisture content and moisture uptake, and reducing fouling tendency. XPS and FTIR results proved that the conversion from “–C–O/—C=O” to “aromatic −C–C/=C” was the key point for improving phenol and aromatic content. The development of basic functionalities and developed pore structure facilitated the CO2 capture for SCG, but further thermal treatment under more severe conditions is necessary to develop the porous structure.
4. Materials and Methods
4.1. Biomass Collection and Pretreatment
The collection and pretreatment of the biomasses (SCG and CH) were reported in our previous study.19 SCG and CH were collected from a local coffee café located at the University of Saskatchewan, Saskatoon campus, and Road Coffee Inc. (Saskatoon). The biomasses without any modification were referred to as the “as-received samples”. The as-received samples were thoroughly washed with water (distilled) to eliminate any impurities and oven-dried at 105 ± 5 °C for 12 ± 3 h. The dried precursors were collected and stored in air-tight glass containers for further thermal treatment to avoid any contamination.
4.2. Torrefaction Experiment
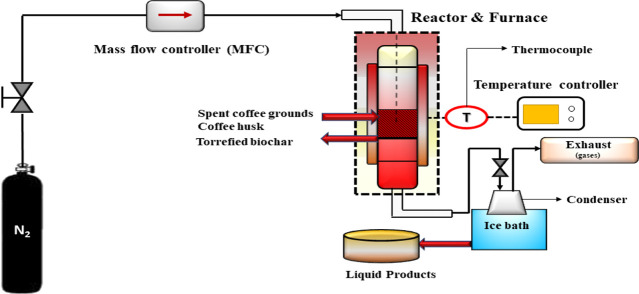
A schematic representation of the fixed-bed reactor for torrefaction is presented in Figure 12. The torrefaction of SCG and CH was performed in a 1 in. fixed-bed Inconel tubular reactor. The overall details of the torrefaction reactor system have been meticulously explained in a previous study.15 The dimensions of the tubular reactor are 22 mm (inner diameter), 25.4 mm (outer diameter), and 870 mm (reactor length). A standard temperature controller was used to monitor the temperature change and ensure that the desired reaction temperature was attained. A K-type thermocouple was inserted inside the reactor bed to monitor the temperature of the bed. The average geometric mean particle size of dried biomasses (SCG and CH) was already small and in the range of 0.52–0.61 mm, so they were fed directly into the reactor. During torrefaction, the temperature was raised from 25 °C to the desired peak temperatures (200, 250, and 300 °C). In addition, a constant heating rate of 10 °C/min was maintained throughout the reaction. Like torrefaction temperature and residence time, the heating rate influences the properties in torrefied biomass samples. However, the influence is minimal compared to the other parameters. Usually, the range of heating rate studied for torrefaction is between 10 and 50 °C/min. The heating rate of 10 °C/min was selected because a lower heating rate favored the generation of higher torrefied biomass (solid) yield and improved hydrophobic characteristics. As the torrefied biomass is the main product of consideration in this study, the heating rate was kept at the lower level and fixed at 10 °C/min. Nitrogen gas was added at 100 mL (STP)/min to maintain an inert atmosphere and avoid undesirable reactions (oxidation or ignition). The flow rate of gas was continuously monitored using a mass-flow controller. Once the desired torrefaction temperature was reached, a known amount of biomass (10 ± 0.5 g) was loaded into the reactor and then tightly sealed to ensure that the inertness and temperature inside the reactor were well maintained. It should be emphasized that two sets of residence times were considered in this study (0.5 and 1 h).
Figure 12.
Fixed-bed torrefaction reactor setup.
Once the experiment was completed, the reactor was cooled down to room temperature (25 ± 5 °C) in the presence of N2 at 100 mL (STP)/min. The final products (torrefied biomass and liquid samples) were collected for further mass balance. The torrefied biomass samples were stored in a glass container inside a desiccator at room temperature until other chemical analyses and adsorption performance studies were performed. The corresponding torrefied biomass samples were labeled according to the precursor-torrefaction temperature–residence time. For instance, SCG-200-0.5h implies a torrefied biomass sample derived from SCG at 200 °C and 0.5 h hold time, or CH-300-1h indicates a torrefied biomass sample derived from CH at 300 °C and 1 h hold time.
Temperature and residence time ranges of 200–300 °C and 0.5–1 h were defined in this study for the following reasons:
The devolatilization and depolymerization of lignocellulosic components (hemicellulose and cellulose) occur within the temperature range (200–300 °C).32
The objective of the present study is to improve the solid fuel properties and yield for potential CO2 capture. An increase in the temperature beyond 300 °C could lead to a drastic decline in solid yield. Therefore, 300 °C was selected as the maximum temperature.
The torrefaction temperature range of 200–300 °C was used to prevent excessive mass loss in the precursors.
The residence time range of 0.5–1 h was selected for this study because previous studies reported a decline in solid yield with a residence time above 1 h.32−34 Furthermore, a residence time below 0.5 h does not provide enough duration for intermediate reactions such as depolymerization, dehydration, and deoxygenation to occur.
4.3. Chemical Analysis
The analytical characterizations of the tested samples were carried out on a dried basis. The proximate analysis was conducted based on standard ASTM procedures as stated by Sarker et al.15 The proximate analysis showed the fraction of moisture, ash, and volatile matter contained in the biomasses and torrefied biomass samples. Further, by mass balance, the fixed carbon content was determined. To evaluate the composition of carbon, hydrogen, sulfur, and nitrogen in the biomasses and torrefied biomass samples, the ultimate analysis was performed with the aid of a PerkinElmer CHNS analyzer.35 The mass balance was used to determine the oxygen content. The pH values of the biomasses and torrefied samples in aqueous solutions were analyzed using a pH meter according to the standard method reported by Patra et al.36
A PARR 6400 calorimeter was used to determine the calorific value based on thermal energy generation, as stated by Sarker et al.15 The moisture uptake of SCG, CH, and torrefied biomass samples was tested using a climate chamber (SH-641). Before the sorption tests, the biomasses and torrefied samples were dried in a vacuum oven at 65 ± 5 °C to eliminate excess moisture from the samples. Then, the samples were loaded into a glass dish and placed into a climate chamber. The climate chamber was operated at a relative humidity (RH) of 90% and a temperature of 30 °C for 120 h. The equilibrium moisture content was determined after 120 h, and the weight of the samples was monitored and recorded at 4 h of interval. In the end, the samples’ weight was measured, and the relative weight gain by the samples compared to the initial sample weight represents the moisture uptake of the samples.
The Brunauer–Emmett–Teller (BET) analysis of the coffee residues and the torrefied samples was determined using a Micrometrics ASAP-2020 instrument. Before the test, the samples were degassed at 300 °C for 4 h followed by N2 adsorption and desorption studies at −196 °C.35
The Fourier transform infrared (FTIR) spectroscopy of SCG, CH, and the torrefied samples was performed to identify different functional groups present in the tested samples. This analysis was performed with a Bruker Vertex 70 FTIR spectrometer according to the method stated by Mukherjee et al.5 The spectrum was set in the range of 4500–400 cm–1.
To elucidate the devolatilization behavior of the biomasses and torrefied biomass, the TGA-DTG analysis was executed. About 10–20 mg of the tested samples was heated at a temperature range of 20–800 °C at a constant heating rate of 10 °C/min in the presence of N2 to maintain the reduced environment.5
The X-ray photoelectron spectroscopy (XPS) analysis was used to observe the functional moieties present in the sample. Details of the procedure have been meticulously explained in our previous publication.5 The SEM analysis was performed according to the method specified by Patra et al.36 The SEM analysis was used to investigate the change in the morphology of the biomasses and torrefied biomass samples after torrefaction,
4.4. CO2 Capture Setup
The information of the CO2 capture setup and the schematic has been meticulously described in our previous report.5 Before each adsorption experiment, the setup was loaded with 2 ± 0.2 g of torrefied biomass samples and then preheated to 160 ± 5 °C for 2 h in the presence of N2 gas at 50 ± 0.5 mL/min. N2 gas was used to maintain the inertness and to remove excess moisture inside the reactor.
After dehydration, the reactor was cooled down to 25 °C, after which pure CO2 (30 vol %) balanced by N2 was purged through the bed of torrefied adsorbents. A mass-flow controller was used to monitor the gas-flow rate throughout the adsorption process continuously. The adsorption capacity was evaluated by using eq 1.5
| 1 |
where qt , m, Q, Co, C, and t represent the CO2 uptake of the torrefied biomass samples at time t (mmol/g), the mass of the torrefied biomass samples (g), the flow rate of the gas (mL/min), and inlet CO2 and outlet CO2 concentrations in the mixed gas streams (volume %) and time (min), respectively.
4.5. Process Modeling
4.5.1. Aspen Plus Model Description and Assumptions
Biomass torrefaction is a highly complex process with a series of intermediate reactions. Therefore, it is challenging to model such systems in Aspen Plus. This is because biomass contains several complex components, including lignocellulosic compositions (hemicellulose, cellulose, and lignin).29 The thermal degradation of these lignocellulosic components comprises of several intermediate and complex reactions that could possibly yield various intermediate products. Therefore, the modeling and identification of these products are complicated and equally challenging. Consequently, the entire torrefaction process was simulated by considering different unit operations.
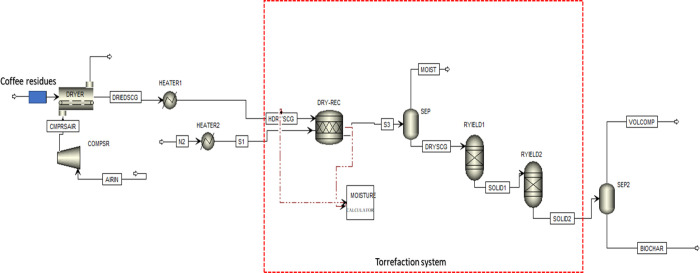
Figure 13 shows the flow diagram of the torrefaction model. The flowsheet, together with the unit operations arrangement, was designed to be as simple as possible. That way, it is easier for future adjustments and scale-up. The model consists of a dryer, a series of heaters and compressors, two yield reactors, and flash separators. The description of each unit operation and the assumptions are summarized and presented in Table 5. It should be emphasized that Aspen Plus does not contain a predefined feedstock for SCG and CH. Therefore, a nonconventional stream was used to define the heterogeneous solid feedstock based on their proximate and ultimate analyses together with a calculator block. A detailed description of the nonconventional stream modeling and the assumptions can be found in our previous report.37
Figure 13.
Flow diagram of the coffee residue (SCG and CH) torrefaction model in Aspen Plus.
Table 5. List of Assumptions and Description of the Processing Blocks Used for the Torrefaction Model.
| default block ID in Aspen Plus | unit operations used in the flowsheet | descriptions and assumptions |
|---|---|---|
| dryer | DRYER | This convective air-drying unit was used to simulate the predrying steps. |
| A continuous operation mode was assumed with a plug flow operation. | ||
| compressor | COMPSR | The compressor helps increase the pressure of the incoming air that is fed to the dryer. |
| Isentropic operation mode was assumed. | ||
| heater | HEATER1 | Heats air-dried feedstock to the desired preheating temperature. |
| Rstoic | DRY-REC | Simulate the moisture removal step in the torrefaction process. |
| Operates at atmospheric pressure. | ||
| Sep | SEP | Separates liquid products from other reaction products. |
| Sep | SEP2 | Separates volatile products from solid products. |
| yield | RYIELD1 | This unit helps simulate the decomposition of coffee residues into volatiles and intermediate products. |
| Operates at atmospheric pressure. | ||
| yield | RYIELD2 | The unit helps simulate different solid intermediate decompositions into volatiles and torrefied biomass. |
| Operates at atmospheric pressure. |
Moreover, it should be noted that a steady-state system was assumed in all calculations, while the Redlich–Kwong–Soave equation was used to simulate the fluid properties. Based on the flowsheet in Figure 13, the coffee residues (SCG and CH) are fed into a convective air dryer (DRYER) operating for 12 h. The dryer was designed to mimic the feedstock pre-drying steps and reduce the feedstock moisture content. Air at ambient temperature (ARN) is compressed and sent to the dryer for feedstock drying. The dried feedstock exiting the dryer is named as DRIEDSCG. The dried coffee residues enter the heater (HEATER1), where the temperature is elevated to a preheating temperature of 200 °C before entering the torrefaction reactor.
The torrefied unit was modeled with unit operations comprising the stoichiometric reactor, two RGibbs reactors, and two separator blocks. The entire torrefaction system was modeled in three sequential steps: initial heating and moisture removal, biomass decomposition, and intermediate decomposition. The first step in the torrefaction module is the moisture removal step. This step was modeled using the stoichiometric reactor (DRY-REC) and solid/gas phase separator.38 The mass balance calculations to ensure that the final moisture content is the same as the torrefied solid were solved with a calculator block with an embedded FORTRAN code. The dried solid stream (S3) leaving the stoichiometric reactor is fed to the solid separator, where the inbound moisture is separated from the solids, after which the hot stream containing dried solids (DRYSCG) is fed to the Ryield reactor (RYIED1). The two yield reactors were used to model the intermediate steps during coffee residue torrefaction based on eq 2. The two yield blocks were selected for several reasons. The torrefaction kinetic models assume that the reaction occurs in two-step processes, including biomass decomposition into intermediates and volatiles. They are followed by intermediate degradation to form the torrefied solids.10 In addition, a similar approach was employed in previous studies related to the development of biomass torrefaction models.39 The first yield reactor represents the decomposition of coffee residues into volatile compounds and solid intermediates, while the second reactor models the intermediate decomposition into other volatile compounds and torrefied biomass samples. It is vital to note that the density and enthalpy of the nonconventional solid feedstock were determined by the specific property methods of DCOALIGT and HCOALGEN, respectively.37
 |
2 |
It is essential to mention that the developed torrefaction models in this study apply to other types of coffee residues and might not be helpful for lignocellulosic biomass or agricultural residues due to the varying chemical compositions. The disparity in chemical compositions could lead to different product distributions and torrefaction behavior.
4.5.2. Torrefaction Yield and Energy Efficiency Calculations
The main parameters that are exploited to determine the efficacy of the torrefaction process are the mass and energy yields. They indicate how much dry mass is removed or lost during the torrefaction process and the amount of energy retained in the torrefied biomass samples (solid residues). The mass yield is calculated from eq 3 as follows:
| 3 |
where My, MTORR, and MRAW represent the mass yield, the mass of the torrefied biomass sample (solid residue), and the mass of raw feedstock (biomass), respectively.
The energy yield was determined from the expression in eq 4 as follows:
| 4 |
where Ey, HHVTORR, and HHVRAW represent the energy yield and higher heating values of torrefied biomass and raw feedstock (biomass), respectively.
The overall energy efficiency of the process is defined as the amount of energy imposed on the process through utilities. On the contrary, the torrefaction energy yield determines the quantity of energy present in the raw feedstock transferred to the torrefied solid after torrefaction.7 The process energy efficiency (ηp) was calculated from the lower heating value of the feedstock (LHVRAW) and torrefied biomass (LHVTORR) on a dry basis (eq 5).40
| 5 |
FRTORR and FRRAW are the mass flow rates of the torrefied biomass samples and raw feedstock (biomass), respectively. E represents the overall energy required to sustain the entire process.
Acknowledgments
The authors would like to acknowledge Natural Sciences and Engineering Research Council of Canada (NSERC), BioFuel Net, and Canada Research Chair (CRC) for the financial aid provided. The authors are also grateful toward the Saskatchewan Structural Sciences Centre (SSSC, SK, Canada) for providing the XPS spectroscopy facility.
Supporting Information Available
The Supporting Information is available free of charge at https://pubs.acs.org/doi/10.1021/acsomega.1c05270.
Supporting information containing the TGA-DTG analysis of SCG and CH and the deconvoluted C1s and O1s spectra of SCG- and CH-derived torrefied biomass samples (PDF)
The authors declare no competing financial interest.
Supplementary Material
References
- Safar M.; Lin B. J.; Chen W. H.; Langauer D.; Chang J. S.; Raclavska H.; Pétrissans A.; Rousset P.; Pétrissans M. Catalytic Effects of Potassium on Biomass Pyrolysis, Combustion and Torrefaction. Appl. Energy 2019, 235, 346–355. 10.1016/j.apenergy.2018.10.065. [DOI] [Google Scholar]
- Rashidi N. A.; Yusup S.; Borhan A.; Loong L. H. Experimental and Modelling Studies of Carbon Dioxide Adsorption by Porous Biomass Derived Activated Carbon. Clean Technol. Environ. Policy 2014, 16, 1353–1361. 10.1007/s10098-014-0788-6. [DOI] [Google Scholar]
- Igalavithana A. D.; Choi S. W.; Shang J.; Hanif A.; Dissanayake P. D.; Tsang D. C. W.; Kwon J. H.; Lee K. B.; Ok Y. S. Carbon Dioxide Capture in Biochar Produced from Pine Sawdust and Paper Mill Sludge: Effect of Porous Structure and Surface Chemistry. Sci. Total Environ. 2020, 739, 139845. 10.1016/j.scitotenv.2020.139845. [DOI] [PubMed] [Google Scholar]
- Mukherjee A.; Okolie J. A.; Abdelrasoul A.; Niu C.; Dalai A. K. Review of Post-Combustion Carbon Dioxide Capture Technologies Using Activated Carbon. J. Environ. Sci. 2019, 46. 10.1016/j.jes.2019.03.014. [DOI] [PubMed] [Google Scholar]
- Mukherjee A.; Borugadda V. B.; Dynes J. J.; Niu C.; Dalai A. K. Carbon Dioxide Capture from Flue Gas in Biochar Produced from Spent Coffee Grounds: Effect of Surface Chemistry and Porous Structure. J. Environ. Chem. Eng. 2021, 9, 106049. 10.1016/j.jece.2021.106049. [DOI] [Google Scholar]
- Shewchuk S. R.; Mukherjee A.; Dalai A. K. Selective Carbon-Based Adsorbents for Carbon Dioxide Capture from Mixed Gas Streams and Catalytic Hydrogenation of CO2 into Renewable Energy Source: A Review. Chem. Eng. Sci. 2021, 243, 116735. 10.1016/j.ces.2021.116735. [DOI] [Google Scholar]
- Jiang H.; Ye Y.; Lu P.; Zhao M.; Xu G.; Chen D.; Song T. Effects of Torrefaction Conditions on the Hygroscopicity of Biochars. J. Energy Inst. 2021, 96, 260–268. 10.1016/j.joei.2021.03.018. [DOI] [Google Scholar]
- Ikegwu U. M.; Ozonoh M.; Daramola M. O. Kinetic Study of the Isothermal Degradation of Pine Sawdust during Torrefaction Process. ACS Omega 2021, 6, 10759–10769. 10.1021/acsomega.1c00327. [DOI] [PMC free article] [PubMed] [Google Scholar]
- Ikegwu U. M.; Ozonoh M.; Okoro N. J. M.; Daramola M. O. Effect and Optimization of Process Conditions during Solvolysis and Torrefaction of Pine Sawdust Using the Desirability Function and Genetic Algorithm. ACS Omega 2021, 6, 20112–20129. 10.1021/acsomega.1c00857. [DOI] [PMC free article] [PubMed] [Google Scholar]
- Bach Q. V.; Skreiberg Ø.; Lee C. J. Process Modeling and Optimization for Torrefaction of Forest Residues. Energy 2017, 138, 348–354. 10.1016/j.energy.2017.07.040. [DOI] [Google Scholar]
- Yan W.; Perez S.; Sheng K. Upgrading Fuel Quality of Moso Bamboo via Low Temperature Thermochemical Treatments: Dry Torrefaction and Hydrothermal Carbonization. Fuel 2017, 196, 473–480. 10.1016/j.fuel.2017.02.015. [DOI] [Google Scholar]
- Chen W.-H.; Peng J.; Bi X. T. A state-of-the-art review of biomass torrefaction, densification and applications. Renewable Sustainable Energy Rev. 2015, 44, 847–866. 10.1016/j.rser.2014.12.039. [DOI] [Google Scholar]
- Ribeiro J. M. C.; Godina R.; Matias J. C. D. O.; Nunes L. J. R. Future Perspectives of Biomass Torrefaction: Review of the Current State-of-the-Art and Research Development. Sustain 2018, 10, 2323. 10.3390/su10072323. [DOI] [Google Scholar]
- Barskov S.; Zappi M.; Buchireddy P.; Dufreche S.; Guillory J.; Gang D.; Hernandez R.; Bajpai R.; Baudier J.; Cooper R.; Sharp R. Torrefaction of Biomass: A Review of Production Methods for Biocoal from Cultured and Waste Lignocellulosic Feedstocks. Renewable Energy 2019, 142, 624–642. 10.1016/j.renene.2019.04.068. [DOI] [Google Scholar]
- Sarker T. R.; Azargohar R.; Dalai A. K.; Venkatesh M. Physicochemical and Fuel Characteristics of Torrefied Agricultural Residues for Sustainable Fuel Production. Energy Fuels 2020, 34, 14169–14181. 10.1021/acs.energyfuels.0c02121. [DOI] [Google Scholar]
- Chen W. H.; Lu K. M.; Tsai C. M. An Experimental Analysis on Property and Structure Variations of Agricultural Wastes Undergoing Torrefaction. Appl. Energy 2012, 100, 318–325. 10.1016/j.apenergy.2012.05.056. [DOI] [Google Scholar]
- Dilokekunakul W.; Teerachawanwong P.; Klomkliang N.; Supasitmongkol S.; Chaemchuen S. Effects of Nitrogen and Oxygen Functional Groups and Pore Width of Activated Carbon on Carbon Dioxide Capture: Temperature Dependence. Chem. Eng. J. 2020, 389, 124413. 10.1016/j.cej.2020.124413. [DOI] [Google Scholar]
- Tiwari D.; Goel C.; Bhunia H.; Bajpai P. K. Dynamic CO2 Capture by Carbon Adsorbents: Kinetics, Isotherm and Thermodynamic Studies. Sep. Purif. Technol. 2017, 181, 107–122. 10.1016/j.seppur.2017.03.014. [DOI] [Google Scholar]
- Mukherjee A.; Okolie J. A.; Tyagi R.; Dalai A. K.; Niu C. Pyrolysis Kinetics and Activation Thermodynamic Parameters of Exhausted Coffee Residue and Coffee Husk Using Thermogravimetric Analysis. Can. J. Chem. Eng. 2021, cjce.24037. 10.1002/cjce.24037. [DOI] [Google Scholar]
- Chen W. H.; Du S. W.; Tsai C. H.; Wang Z. Y. Torrefied Biomasses in a Drop Tube Furnace to Evaluate Their Utility in Blast Furnaces. Bioresour. Technol. 2012, 111, 433–438. 10.1016/J.BIORTECH.2012.01.163. [DOI] [PubMed] [Google Scholar]
- Acharya B.; Dutta A.; Minaret J. Review on Comparative Study of Dry and Wet Torrefaction. Sustainable Energy Technol. Assess. 2015, 12, 26–37. 10.1016/j.seta.2015.08.003. [DOI] [Google Scholar]
- Ren X.; Sun R.; Meng X.; Vorobiev N.; Schiemann M.; Levendis Y. A. Carbon, Sulfur and Nitrogen Oxide Emissions from Combustion of Pulverized Raw and Torrefied Biomass. Fuel 2017, 188, 310–323. 10.1016/j.fuel.2016.10.017. [DOI] [Google Scholar]
- Lu K. M.; Lee W. J.; Chen W. H.; Liu S. H.; Lin T. C. Torrefaction and Low Temperature Carbonization of Oil Palm Fiber and Eucalyptus in Nitrogen and Air Atmospheres. Bioresour. Technol. 2012, 123, 98–105. 10.1016/j.biortech.2012.07.096. [DOI] [PubMed] [Google Scholar]
- Kim D.; Lee K.; Bae D.; Park K. Y. Characterizations of Biochar from Hydrothermal Carbonization of Exhausted Coffee Residue. J. Mater. Cycles Waste Manage. 2017, 19, 1036–1043. 10.1007/s10163-016-0572-2. [DOI] [Google Scholar]
- Oke E. O.; Okolo B. I.; Adeyi O.; Adeyi J. A.; Ude C. J.; Osoh K.; Otolorin J.; Nzeribe I.; Darlinton N.; Oladunni S. Process Design, Techno-Economic Modelling, and Uncertainty Analysis of Biodiesel Production from Palm Kernel Oil. BioEnergy Res. 2021, 1, 1–15. 10.1007/s12155-021-10315-y. [DOI] [Google Scholar]
- Iroba K. L.; Baik O.-D.; Tabil L. G. Torrefaction of biomass from municipal solid waste fractions II: Grindability characteristics, higher heating value, pelletability and moisture adsorption. Biomass Bioenergy 2017, 106, 8–20. 10.1016/j.biombioe.2017.08.008. [DOI] [Google Scholar]
- Azargohar R.; Nanda S.; Kang K.; Bond T.; Karunakaran C.; Dalai A. K.; Kozinski J. A. Effects of Bio-Additives on the Physicochemical Properties and Mechanical Behavior of Canola Hull Fuel Pellets. Renewable Energy 2019, 132, 296–307. 10.1016/j.renene.2018.08.003. [DOI] [Google Scholar]
- Chen Y. C.; Chen W. H.; Lin B. J.; Chang J. S.; Ong H. C. Impact of Torrefaction on the Composition, Structure and Reactivity of a Microalga Residue. Appl. Energy 2016, 181, 110–119. 10.1016/j.apenergy.2016.07.130. [DOI] [Google Scholar]
- Okolie J. A.; Nanda S.; Dalai A. K.; Kozinski J. A. Chemistry and Specialty Industrial Applications of Lignocellulosic Biomass. Waste Biomass Valoriz. 2021, 12, 2145–2169. 10.1007/s12649-020-01123-0. [DOI] [Google Scholar]
- Azargohar R.; Nanda S.; Dalai A. K.; Kozinski J. A. Physico-Chemistry of Biochars Produced through Steam Gasification and Hydro-Thermal Gasification of Canola Hull and Canola Meal Pellets. Biomass Bioenergy 2019, 120, 458–470. 10.1016/j.biombioe.2018.12.011. [DOI] [Google Scholar]
- Dai L.; Wang Y.; Liu Y.; Ruan R.; He C.; Yu Z.; Jiang L.; Zeng Z.; Tian X. Integrated Process of Lignocellulosic Biomass Torrefaction and Pyrolysis for Upgrading Bio-Oil Production: A State-of-the-Art Review. Renewable Sustainable Energy Rev. 2019, 107, 20–36. 10.1016/j.rser.2019.02.015. [DOI] [Google Scholar]
- Prins M. J.; Ptasinski K. J.; Janssen F. J. J. G. Torrefaction of wood: Part 2. Analysis of products. J. Anal. Appl. Pyrolysis 2006, 77, 35–40. 10.1016/j.jaap.2006.01.001. [DOI] [Google Scholar]
- Thrän D.; Witt J.; Schaubach K.; Kiel J.; Carbo M.; Maier J.; Ndibe C.; Koppejan J.; Alakangas E.; Majer S.; Schipfer F. Moving Torrefaction towards Market Introduction – Technical Improvements and Economic-Environmental Assessment along the Overall Torrefaction Supply Chain through the SECTOR Project. Biomass Bioenergy 2016, 89, 184–200. 10.1016/j.biombioe.2016.03.004. [DOI] [Google Scholar]
- Trubetskaya A.; Grams J.; Leahy J. J.; Johnson R.; Gallagher P.; Monaghan R. F. D.; Kwapinska M. The Effect of Particle Size, Temperature and Residence Time on the Yields and Reactivity of Olive Stones from Torrefaction. Renewable Energy 2020, 160, 998–1011. 10.1016/j.renene.2020.06.136. [DOI] [Google Scholar]
- Chand R.; Babu Borugadda V.; Qiu M.; Dalai A. K. Evaluating the Potential for Bio-Fuel Upgrading: A Comprehensive Analysis of Bio-Crude and Bio-Residue from Hydrothermal Liquefaction of Agricultural Biomass. Appl. Energy 2019, 254, 113679. 10.1016/j.apenergy.2019.113679. [DOI] [Google Scholar]
- Patra B. R.; Nanda S.; Dalai A. K.; Meda V. Slow Pyrolysis of Agro-Food Wastes and Physicochemical Characterization of Biofuel Products. Chemosphere 2021, 285, 131431. 10.1016/J.CHEMOSPHERE.2021.131431. [DOI] [PubMed] [Google Scholar]
- Okolie J. A.; Nanda S.; Dalai A. K.; Kozinski J. A. Hydrothermal Gasification of Soybean Straw and Flax Straw for Hydrogen-Rich Syngas Production: Experimental and Thermodynamic Modeling. Energy Convers. Manage. 2020, 208, 112545. 10.1016/j.enconman.2020.112545. [DOI] [Google Scholar]
- Onsree T.; Jaroenkhasemmeesuk C.; Tippayawong N. Techno-Economic Assessment of a Biomass Torrefaction Plant for Pelletized Agro-Residues with Flue Gas as a Main Heat Source. Energy Rep. 2020, 6, 92–96. 10.1016/j.egyr.2020.10.043. [DOI] [Google Scholar]
- Manouchehrinejad M.; Mani S. Process Simulation of an Integrated Biomass Torrefaction and Pelletization (IBTP) Plant to Produce Solid Biofuels. Energy Convers. Manage.: X 2019, 1, 100008. 10.1016/j.ecmx.2019.100008. [DOI] [Google Scholar]
- Bergman P. C. A.; Boersma A. R.; Zwart R. W. R.; Kiel J. H. A.. Torrefaction for Biomass Co-Firing in Existing Coal-Fired Power Stations. Energy Centre of Netherlands, Report No. ECN-C-05-013. 2005, No. July.
Associated Data
This section collects any data citations, data availability statements, or supplementary materials included in this article.


