

Abstract
InN/InGaN quantum dots (QDs) are introduced as an efficient photoanode for a novel abiotic one-compartment photofuel cell (PFC) with a Pt cathode and glucose as a biofuel. Due to the high catalytic activity and selectivity of the InN/InGaN QDs toward oxidation reactions, the PFC operates without a membrane under physiologically mild conditions at medium to low glucose concentrations with a noble-metal-free photoanode. A relatively high short-circuit photocurrent density of 0.56 mA/cm2 and a peak output power density of 0.22 mW/cm2 are achieved under 1 sun illumination for a 0.1 M glucose concentration with optimized InN/InGaN QDs of the right size. The super-linear dependence of the short-circuit photocurrent density and the output power density as a function of the logarithmic glucose concentration makes the PFC well suited for sensing, covering the 4–6 mM range of glucose concentration in blood under normal conditions with good selectivity. No degradation of the PFC operation over time is observed.
1. Introduction
Fuel cells (FCs) directly convert the chemical energy of a fuel to electrical energy by electrochemical reactions. Regarding biofuels, glucose is an ideal choice. Glucose is cheap, abundant, non-toxic, non-volatile, non-explosive, and easy to store. Furthermore, glucose is naturally contained in agricultural waste and food waste for direct use,1 and also in blood or serum to power medical implants.2,3 As a prerequisite, glucose FCs work at room temperature. Among the various types of biofuel cells, such as enzymatic, microbial, and abiotic FCs, abiotic FCs are by far most robust, have long lifetimes, and are easy to use. They commonly employ costly noble metal electrocatalysts for the oxidation reaction at the anode, which are easily poisoned, while noble-metal-free cathodes are readily available.4,5 For noble-metal-free anodes, very strong alkaline electrolytes and high glucose concentrations are usually needed to generate sufficient output power.6,7 Additionally, often ion-exchange membranes in two-compartment FCs are employed to enhance the selectivity toward glucose oxidation at the anode and the reduction of O2 at the cathode in air-saturated electrolytes. This increases the complexity, cost, volume, weight, and maintenance efforts. To make full use of glucose FCs, it is necessary to devise innovative electrodes that produce reasonable output power under mild, near-neutral conditions and for moderate glucose concentrations, occurring in nature.8 Expensive noble metals and membranes need to be avoided.9,10
Among abiotic biofuel cells, photofuel cells (PFCs) are an advanced development in the FC technology which potentially provide high photocurrent and output power due to the input of light at the semiconductor photoelectrodes.11−17 Here, we introduce an InN/InGaN quantum dot (QD) photoanode for realizing an abiotic, one-compartment PFC with a Pt cathode and glucose as a biofuel. The PFC operates under physiological, mild conditions with suitable photocurrent and output power for medium to low glucose concentrations. A short-circuit photocurrent density of 0.56 mA/cm2 and a peak output power density of 0.22 mW/cm2 under 1 sun illumination for a 0.1 M glucose concentration are achieved. A wide glucose concentration range down to 10–4 M is explored for biosensing applications covering the physiological range of 4–6 mM in blood under normal conditions with good selectivity and stability.
InGaN is excellently suited for photoelectrochemical devices. The direct band gap of InGaN is tunable over the whole visible spectrum by the In content. InGaN has a high absorption coefficient and is non-toxic and chemically very stable. The InN QDs are formed in the Stranski–Krastanov growth mode by plasma-assisted molecular beam epitaxy (PA-MBE).18 Due to their unique surface and quantum properties, the InN QDs act as an efficient catalyst for oxidation reactions,19−21 which has been previously exploited for solar hydrogen generation by water splitting.22−24 The high catalytic activity is evident from the comparison with a bare InGaN layer, a thin, two-dimensional InN wetting layer, and large, coalesced InN QDs. They all exhibit significantly lower photocurrent and output power. Due to the high catalytic activity of the InN QDs and the operation under light, other foreign co-catalysts are not needed. Moreover, the high catalytic activity of the InN QDs toward oxidation reactions allows for one-compartment PFCs without ion-exchange membranes.
In the following, we will first report the structural properties of the investigated structures, the bare InGaN layer, the 0.5 ML InN/InGaN layer, and the 1.5 and 3 ML InN/InGaN QDs and then the study done for a maximized PFC response. Then, we will focus on the glucose concentration-dependent PFC performance of the optimum InN/InGaN QDs for glucose sensing based on the glucose concentration-dependent photocurrent and output power, also addressing sensor selectivity and stability, and finally conclude the paper.
2. Results and Discussion
2.1. Characterization of InN/InGaN QDs
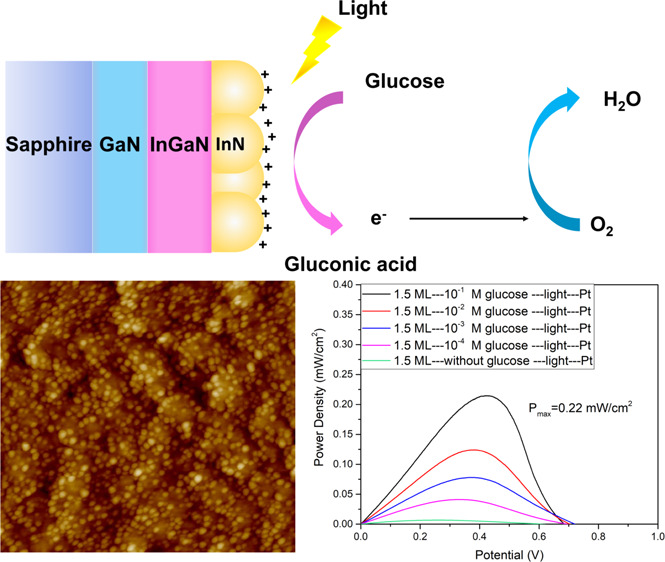
Figure 1 shows schematic drawings of (a) the experimental setup with the abiotic, one-compartment glucose PFC, the InN/InGaN QD photoanode, and the Pt cathode, together with (b) the detailed sample structure and the photoelectrochemical oxidation of glucose.
Figure 1.
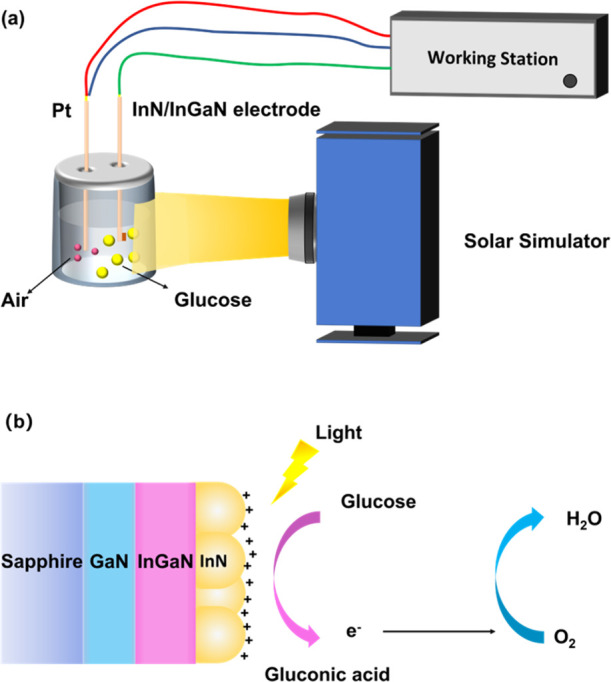
Schematic drawings of the (a) experimental setup and (b) sample structure.
In Figure 2a–d, the scanning electron microscopy (SEM) top views of the (a) bare InGaN layer, (b) 0.5 ML InN/InGaN layer, (c) 1.5 ML InN/InGaN QDs, and (d) 3 ML InN/InGaN QDs are shown. Atomic force microscopy (AFM) images are shown in Supporting Information Figure S1, together with cross-sectional SEM images, confirming compact InGaN layers with a 150 nm thickness. For the bare InGaN layer, columnar features are visible on the flat surface. The 0.5 ML InN layer grown on the InGaN layer is mostly flat, without evident columns. For 1.5 and 3 ML InN, QDs evolve. This evidences that the InN QDs are formed in the Stranski–Krastanov growth mode. The 0.5 ML InN layer exhibits very sparse dot-like features, indicating the onset of QD nucleation. The InN QDs for 1.5 ML InN are well defined and separated with a round shape, while for 3 ML InN, the QDs are larger and many QDs tend to coalesce. The well-separated 1.5 ML InN QDs have an average height of 3.1 nm, an average diameter of 24 nm, and a density of 3.5 × 1010 cm–2. The 3 ML InN QDs have an average height of 4.2 nm, an average diameter of 26 nm, and a density of 3.8 × 1010 cm–2. The In content of the InGaN layers is 45%, determined from X-ray diffraction (XRD), shown in Supporting Information Figure S2. For the InGaN band gap energy, the room-temperature photoluminescence (PL) measurement, shown in Supporting Information Figure S3, is considered. The band gap energy estimated from the PL peak is 1.7 eV. Together with the In content determined from XRD, this gives a bowing parameter b of 2.2, which is well within the reported range.25,26
Figure 2.

SEM top views of the (a) bare InGaN layer, (b) 0.5 ML InN/InGaN layer, (c) 1.5 ML InN/InGaN QDs, and (d) 3 ML InN/InGaN QDs.
2.2. Photoelectrochemical Characterization for Optimization of InN Deposition
Figure 3 shows (a) the photocurrent density versus voltage curves or linear sweep voltammetry (LSV) curves and (b) the deduced output power density versus voltage curves for the PFC with the bare InGaN layer, the 0.5 ML InN/InGaN layer, and the 1.5 and 3 ML InN/InGaN QD photoanodes and a Pt cathode under 1 sun illumination. The glucose concentration is 0.1 M. The short-circuit photocurrent density at 0 V increases from 0.35 mA/cm2 for the bare InGaN layer over 0.41 mA/cm2 for the 0.5 ML InN/InGaN layer to a maximum of 0.56 mA/cm2 for the 1.5 ML InN/InGaN QDs and then strongly decreases to 0.20 mA/cm2 for the 3 ML InN/InGaN QDs. Similarly, the peak output power density increases from 0.092 mW/cm2 for the bare InGaN layer over 0.11 mW/cm2 for the 0.5 ML InN/InGaN layer to a maximum of 0.22 mW/cm2 for the 1.5 ML InN/InGaN QDs and then strongly decreases to 0.078 mW/cm2 for the 3 ML InN/InGaN QDs. The maximum output power density for the 1.5 ML InN/InGaN QD photoanode is very competitive for an abiotic, one-compartment glucose PFC operating under mild conditions and medium glucose concentrations and with a noble metal-free photoanode, see refs (11)–17 and the tables in ref (1). In the dark, the current densities and output power densities are very small, at least 3 orders of magnitude smaller than those under illumination. For glucose, there is no significant FC operation in the dark. Glucose is not that easily oxidized in the dark by the InN/InGaN QDs as H2O2 by InGaN nanowires (NWs).27
Figure 3.

(a) Photocurrent density vs voltage curves and (b) deduced output power density vs voltage curves for the PFC with the bare InGaN layer, 0.5 ML InN/InGaN layer, and 1.5 and 3 ML InN/InGaN QD photoanodes and the Pt cathode under 1 sun illumination. The glucose concentration is 0.1 M.
The dependence of the photocurrent density and output power density on the structural parameters of the InN/InGaN photoanodes is a direct consequence of the catalytic activity of the QDs. The catalytic activity of the QDs originates from their outward pointing electric dipole,28 attracting electrons to enhance the oxidation reaction of the target reactant in the electrolyte. The electric dipole is generated by the high density of intrinsic, positively charged surface donors on the c-plane InN QDs, together with the zero-dimensional quantum confinement of electrons in the QDs.19 The density of positively charged surface donors reaches 2 to 3 × 1013 cm–2. Due to the limited number of atomic-like, bound electron states in the QDs, not sufficient electrons can enter the QDs to screen all surface donors. A large fraction of electrons is expelled from the QDs to the underlying InGaN layer. These expelled electrons together with the unscreened surface donors generate the outward electric dipole. The magnitude of the electric dipole potential accounts for the catalytic activity, that is, the reduction of the activation energy barrier for the oxidation reaction. The magnitude of the electric dipole potential critically depends on the QD size and shape, governing the electron distribution inside and outside of the QDs. This electron distribution is also in origin of the super-Nernstian response of the InN/InGaN QDs in potentiometric ion sensing and biosensing.29,30
For small QDs with a small height, the expelled electrons are not separated far from the surface donors. The dipole potential is small, and the catalytic activity is low. The same holds for thickness fluctuations of thin InN layers, representing shallow QDs, such as for the 0.5 ML InN/InGaN layer.28 For large QDs such as for the 3 ML InN/InGaN QDs, the number of bound electron states is increased, even more when the QDs coalesce toward a thick InN layer. More electrons enter the QDs to screen the surface donors. The dipole potential is small, and the catalytic activity is low. The well-separated 1.5 ML InN/InGaN QDs have the right size for an optimum electron distribution inside and outside of the QDs. A large electric dipole potential is generated, and the catalytic activity is high. The bare InGaN layer with 45% In content exhibits only a small density of surface donors providing a low catalytic activity. 45% In content is close to the transition from positively charged surface donors to negatively charged surface acceptors for c-plane InGaN with decreasing In content. The transition is reported for In contents of 30–40%.31−34
For all InN/InGaN photoanodes, the open-circuit cell voltage at zero current is large. This is similarly attributed to the high density of positively charged surface donors of c-plane InN and the QD electric dipole. They drag down the energy positions of the band edges at the surface to further reduce the already low oxidation potential of InGaN. This increases the potential difference with the reduction potential of the Pt cathode, which determines the open-circuit cell voltage, together with the photovoltage. To this end, we compare the performance of a PFC with an Ag cathode, which might have a higher reduction potential, such as for the reduction of H2O2.27 The Ag cathode, however, produces a lower photocurrent density and a lower output power density, as shown in Supporting Information Figure S4. The open-circuit cell voltage for the Ag cathode is comparable to that for the Pt cathode. This implies that Pt is the better catalyst for the O2 reduction reaction, with at most a small reduction of the open-circuit cell voltage in conjunction with the c-plane InN/InGaN photoanodes. Regarding the inefficient FC operation for the InN/InGaN anodes in the dark, the low energy positions of the band edges at the surface imply a large energy barrier in the InN/InGaN anode for electrons transferred from the reductants in the electrolyte.
For completeness, the InN/InGaN photoanodes are characterized alone in three-electrode measurements against a Ag/AgCl reference electrode. This is, actually, of limited relevance for the operation of the PFC, which critically depends on the interplay of the photoanode with the cathode regarding catalytic activity, selectivity of the oxidation and reduction reactions, and the energy positions of the oxidation and reduction potentials. Supporting Information Figure S5a presents the cyclic voltammetry (CV) measurements for the bare InGaN layer, the 0.5 ML InN/InGaN layer, and the 1.5 and 3 ML InN/InGaN QDs under 1 sun illumination. The glucose concentration is 0.1 M. Due to the complex oxidation behavior of glucose with many possible intermediates and oxidation products from gluconic acid to, in principle, CO2, the overall currents are usually increased in CV upon addition of glucose to the electrolyte without clear appearance and assignment of reaction peaks. We observe this too in Supporting Information Figure S5b, showing the CV curves for the 1.5 ML InN/InGaN QDs under 1 sun illumination without glucose and with 0.1 M glucose. A broad oxidation current peak appears around −0.4 V with onset around −0.9 V. The trend of the photocurrent density for the different photoanodes in CV reproduces the trend of the photocurrent density for the two-electrode photocurrent density versus voltage measurements in Figure 3.
2.3. Characterization of the Abiotic Glucose PFC and the Sensor with Optimized InN/InGaN QDs
Figure 4 depicts (a) the photocurrent density versus voltage curves and (b) the deduced output power density versus voltage curves for the PFC with the 1.5 ML InN/InGaN QD photoanode and Pt cathode under 1 sun illumination. The glucose concentration is varied from 10–4 to 0.1 M. The photocurrent density without glucose for the background electrolyte alone is due to photoelectrochemical water splitting, which is an unavoidable side reaction for the glucose PFC with the aqueous electrolyte solution. The increase of the photocurrent density and of the output power density with glucose concentration unambiguously proves that the photoelectrochemical oxidation of glucose produces the increasing photocurrent and output power of the PFC. This is possible because of the high selectivity of the InN/InGaN QDs toward oxidation reactions and a remarkable O2 tolerance in the air-saturated electrolyte solution.
Figure 4.

(a) Photocurrent density vs voltage curves and (b) deduced output power density vs voltage curves for the PFC with the 1.5 ML InN/InGaN QD photoanode and the Pt cathode under 1 sun illumination. The glucose concentration is varied from 0 to 0.1 M.
The short-circuit photocurrent density at 0 V and the peak output power density increase super-linearly with the logarithm of the glucose concentration. This is well-suited for the use of the PFC as a glucose sensor, covering the physiologically relevant range of the normal blood glucose concentration of 4–6 mM as well as health-threatening deviations of hypoglycemia below a 4 mM glucose concentration and hyperglycemia above a 10 mM glucose concentration.
2.4. Selectivity and Stability of the Sensor
To evaluate the selectivity of the glucose PFC sensor with the 1.5 ML InN/InGaN QD photoanode and Pt cathode, uric acid (UA) and ascorbic acid (AA) are added to the glucose solution. UA and AA are common interferents in blood. All concentrations are in the physiological, healthy range: 5 mM for glucose, 0.3 mM for UA, and 0.02 mM for AA. Figure 5 shows (a) the photocurrent densities and (b) the output power densities under 1 sun illumination. There are no significant changes upon addition of the interferents, neither for the short-circuit photocurrent density nor for the peak output power density nor for the open-circuit cell voltage. The PFC sensor exhibits very good selectivity toward the detection of glucose. As sensing readout, the short-circuit photocurrent density is recommended for the most easy operation.
Figure 5.

(a) Photocurrent density and (b) power density for the PFC with the 1.5 ML InN/InGaN QD photoanode and the Pt cathode under 1 sun illumination for 5 mM glucose, 5 mM glucose plus 0.3 mM UA, and 5 mM glucose plus 0.02 mM AA.
To address the reproducibility and stability of the PFC with the 1.5 ML InN/InGaN QD photoanode and Pt cathode, Figure 6a shows current density versus time measurements under chopped 10 s on/10 s off 1 sun illumination. The glucose concentration is varied from 10–4 to 0.1 M. The current density without glucose for the background electrolyte alone is also shown. The voltage is set to −0.4 V versus the Pt cathode in the range of the oxidation current peaks in the CV measurements. The photocurrent response is fast, and the repetitions are very stable. The current spikes after switching on the light are typical for accumulation of charge which can arise due to slow or diffusion-limited reactions. We attribute the spikes to a diffusion-limited reaction. This is very well founded by comparing the diffusion coefficient of glucose in water with the diffusion coefficients of other common species: the diffusion coefficients in water are (0.6, 2, and 5) × 103 μm2/s for glucose, O2, and H2, respectively. The diffusion limited reaction is best underlined by the low photocurrent in our final measurement, see Figure 6b, demonstrating the good long-time stability of the PFC with the 1.5 ML InN/InGaN QD photoanode and Pt cathode under continuous 1 sun illumination.
Figure 6.

(a) Current density vs time transients under chopped 10 s on/10 s off 1 sun illumination for the PFC with the 1.5 ML InN/InGaN QD photoanode at −0.4 V vs the Pt cathode. The glucose concentration is varied from 0 to 0.1 M. (b) Photocurrent density as a function of time under continuous 1 sun illumination for the PFC with the 1.5 ML InN/InGaN QD photoanode at 0 V vs the Pt cathode. The glucose concentration is 0.1 M.
Figure 6b shows the photocurrent density as a function of time at 0 V versus the Pt cathode. The glucose concentration is 0.1 M. After the strong decrease of the photocurrent density within the first 200 s due to glucose depletion, a stable reaction-diffusion equilibrium is reached. The photocurrent does not show any indication of long-time degradation. The photocurrent density rather slightly increases for the present measurement up to 4000 s. This is likely caused by slow warming up and water evaporation, eventually increasing the glucose concentration of the electrolyte solution under continuous illumination by the sun simulator. The initial strong depletion of glucose and long-time drift can be avoided by a better electrochemical cell design with permanent flow of a fresh solution to the electrodes.
3. Conclusions
An InN/InGaN QD abiotic, one-compartment glucose PFC has been demonstrated. The high catalytic activity and selectivity of the noble metal-free InN/InGaN QD photoanode toward oxidation reactions, together with a Pt cathode, allowed for operation of the PFC without an ion-exchange membrane under mild, close to pH neutral conditions for medium to low glucose concentrations. For an optimized InN/InGaN QD size, a relatively high short-circuit photocurrent density of 0.56 mA/cm2 and a peak output power density of 0.22 mW/cm2 were achieved under 1 sun illumination for a 0.1 M glucose concentration. The dependence of the photocurrent density and output power density on the logarithm of the glucose concentration was super-linear over a wide range, making the PFC well suited for sensing, covering the physiologically relevant 4–6 mM range of the glucose concentration in blood under normal conditions with good selectivity. The PFC operated very stable over time without degradation.
4. Experimental Details
4.1. Growth
The InN/InGaN QDs, flat InN/InGaN, and bare InGaN layer were grown on GaN/sapphire substrates by PA-MBE. Active N was supplied by a radio-frequency (RF) plasma source. After loading into the MBE buffer chamber, the substrates were degassed for 30 min at 200 °C and transferred into the MBE growth chamber. For growth of the InGaN layers, the growth rate was 0.2 μm/h and the active N flux was close to stoichiometric, slightly N-rich conditions. The RF power of the N plasma source was 220 W, and the N2 flow rate was 1.2 standard cubic centimeters per minute (sccm). The growth temperature was 620 °C (thermocouple reading), close to the InGaN decomposition temperature. The InGaN layer thickness was 150 nm. On the InGaN layers, 0.5, 1.5, and 3 monolayer (ML) InN were grown in different samples at the same temperature and active N flux without growth interruption. A bare InGaN layer was kept for comparison.
4.2. Characterization
The surface morphology and cross-section of the samples were characterized by SEM and AFM. The In content of the InGaN layers was determined by omega—2θ XRD. PL measurements were performed at room temperature. The 532 nm line of a Nd:YAG laser with a 100 mW excitation power served as an excitation source. The PL was dispersed by a single monochromator and detected by a Si charged-coupled device.
4.3. Electrode
For fabrication of the electrodes, the In–Ga eutectic was coated in a corner on the sample surface to form an Ohmic front contact. The In–Ga eutectic was connected to a conductive adhesive Cu tape on which the sample was glued and fixed on a supporting glass plate. The sample was covered with non-transparent silicone rubber, leaving an opening for the contact with the electrolyte with an area of around 0.04 cm2.
4.4. PFC Evaluation
The abiotic, one-compartment glucose PFCs with air-saturated 0.5 M Na2SO4 plus 0.1 M PBS aqueous electrolyte (pH 7.4) were evaluated in the two-electrode configuration with the InN/InGaN and InGaN samples as the working electrode and a Pt counter electrode, connected to an electrochemical workstation. A silver wire was also tested as a counter electrode. The glucose concentration was varied from 0 (background electrolyte) to 0.1 M. LSV measurements were conducted between 0 and 1 V (referring to the counter electrode) with a scan rate of 10 mV/s in the dark and light with 1 sun, 100 mW/cm2 AM 1.5 simulated sunlight. The InN/InGaN and InGaN working electrodes were also characterized alone in the three-electrode configuration using an additional KCl-saturated Ag/AgCl reference electrode, together with the Pt counter electrode. CV measurements were performed for a 0.1 M glucose concentration in the dark and under 1 sun illumination. For CV, the scan rate was 50 mV/s and the voltage range was from −1 to 0.5 V versus Ag/AgCl. Selectivity measurements of the PFC were conducted by the addition of UA and AA. Current versus time measurements of the PFC were carried out at −0.4 V versus the Pt counter electrode under chopped 1 sun illumination. Long-time photocurrent stability measurements of the PFC at 0 V under continuous 1 sun illumination completed the characterization. All measurements were conducted at room temperature.
Acknowledgments
This work was supported by the Program for Chang Jiang Scholars and Innovative Research Teams in Universities (no. IRT_17R40), the Science and Technology Program of Guangzhou (no. 2019050001), the Guangdong Provincial Key Laboratory of Optical Information Materials and Technology (no. 2017B030301007), and the MOE International Laboratory for Optical Information Technologies and the 111 Project.
Supporting Information Available
The Supporting Information is available free of charge at https://pubs.acs.org/doi/10.1021/acsomega.1c06138.
SEM and AFM images; XRD and PL characterization; comparison of Pt and Ag; and CV and selectivity measurements (PDF)
Author Contributions
L.X. and Y.C. contributed equally to the work. L.X. performed the growth under supervision of R.N. L.X. performed the measurements with support of Y.C,. and Y.Z. L.X., G.Z., and R.N. discussed and interpreted the results. R.N. supervised the research and drafted the manuscript together with L.X. All authors have discussed and commented on the manuscript. All authors have read and agreed to the published version of the manuscript.
The authors declare no competing financial interest.
Supplementary Material
References
- Santiago Ó.; Navarro E.; Raso M. A.; Leo T. J. Review of implantable and external abiotically catalysed glucose fuel cells and the difference between their membranes and catalysts. Appl. Energy 2016, 179, 497–522. 10.1016/j.apenergy.2016.06.136. [DOI] [Google Scholar]
- Kerzenmacher S.; Ducrée J.; Zengerle R.; von Stetten F. Energy harvesting by implantable abiotically catalysed glucose fuel cells. J. Power Sources 2008, 182, 1–17. 10.1016/j.jpowsour.2008.03.031. [DOI] [Google Scholar]
- Rapoport B. I.; Kedzierski J. T.; Sarpeshkar R. A glucose fuel cell for implantable brain-machine interfaces. PLoS One 2012, 7, e38436 10.1371/journal.pone.0038436. [DOI] [PMC free article] [PubMed] [Google Scholar]
- Torigoe K.; Takahashi M.; Tsuchiya K.; Iwabata K.; Ichihashi T.; Sakaguchi K.; Sugawara F.; Abe M. High-power abiotic direct glucose fuel cell using a gold-platinum bimetallic anode catalyst. ACS Omega 2018, 3, 18323–18333. 10.1021/acsomega.8b02739. [DOI] [PMC free article] [PubMed] [Google Scholar]
- Do U. P.; Seland F.; Johannessen E. A. A micro fuel cell for abiotical catalysis of glucose. J. Power Sources 2020, 478, 229032. 10.1016/j.jpowsour.2020.229032. [DOI] [Google Scholar]
- Gao M.; Liu X.; Irfan M.; Shi J.; Wang X.; Zhang P. Nickle-cobalt composite catalyst-modified activated carbon anode for direct glucose alkaline fuel cell. Int. J. Hydrogen Energy 2018, 43, 1805–1815. 10.1016/j.ijhydene.2017.11.114. [DOI] [Google Scholar]
- Irfan M.; Liu X.; Li S.; Khan I. U.; Li Y.; Wang J.; Wang X.; Du X.; Wang G.; Zhang P. High-performance glucose fuel cell with bimetallic Ni-Co composite anchored on reduced graphene oxide as anode catalyst. Renew. Energy 2020, 155, 1118–1126. 10.1016/j.renene.2020.04.016. [DOI] [Google Scholar]
- Zhiani M.; Barzi S.; Gholamian M.; Ahmadi A. Synthesis and evaluation of Pt/rGO as the anode electrode in abiotic glucose fuel cell: Near to the human body physiological condition. Int. J. Hydrogen Energy 2020, 45, 13496–13507. 10.1016/j.ijhydene.2020.03.058. [DOI] [Google Scholar]
- Slaughter G.; Sunday J. A membraneless single compartment abiotic glucose fuel cell. J. Power Sources 2014, 261, 332–336. 10.1016/j.jpowsour.2014.03.090. [DOI] [Google Scholar]
- Purkait T.; Dey R. S. Fabrication of a membrane-less non-enzymatic glucose-air fuel cell with graphene-cobalt oxide nanocomposite anode and Fe, N-doped biomass carbon cathode. J. Electroanal. Chem. 2020, 874, 114467. 10.1016/j.jelechem.2020.114467. [DOI] [Google Scholar]
- Iyatani K.; Horiuchi Y.; Moriyasu M.; Fukumoto S.; Cho S.-H.; Takeuchi M.; Matsuoka M.; Anpo M. Development of separate-type Pt-free photofuel cells based on visible-light responsive TiO2 photoanode. J. Mater. Chem. 2012, 22, 10460. 10.1039/c2jm32064a. [DOI] [Google Scholar]
- Han L.; Bai L.; Zhu C.; Wang Y.; Dong S. Improving the performance of a membraneless and mediatorless glucose–air biofuel cell with a TiO2 nanotube photoanode. Chem. Commun. 2012, 48, 6103–6105. 10.1039/c2cc32168h. [DOI] [PubMed] [Google Scholar]
- Yan Y.; Fang J.; Yang Z.; Qiao J.; Wang Z.; Yu Q.; Sun K. Photoelectrochemical oxidation of glucose for sensing and fuel cell applications. Chem. Commun. 2013, 49, 8632–8634. 10.1039/c3cc43189d. [DOI] [PubMed] [Google Scholar]
- Chong R.; Wang Z.; Li J.; Han H.; Shi J.; Li C. Transition metal (Ni, Fe, and Cu) hydroxides enhanced a-Fe2O3 photoanode-based photofuel cell. RSC Adv. 2014, 4, 47383–47388. 10.1039/c4ra07498j. [DOI] [Google Scholar]
- Yan K.; Yang Y.; Okoth O. K.; Cheng L.; Zhang J. Visible-light induced self-powered sensing platform based on a photofuel cell. Anal. Chem. 2016, 88, 6140–6144. 10.1021/acs.analchem.6b01600. [DOI] [PubMed] [Google Scholar]
- Yang Y.; Yan K.; Zhang J. Dual non-enzymatic glucose sensing on Ni(OH)2/TiO2 photoanode under visible light illumination. Electrochim. Acta 2017, 228, 28–35. 10.1016/j.electacta.2017.01.050. [DOI] [Google Scholar]
- He L.; Liu Q.; Zhang S.; Zhang X.; Gong C.; Shu H.; Wang G.; Liu H.; Wen S.; Zhang B. High sensitivity of TiO2 nanorod array electrode for photoelectrochemical glucose sensor and its photo fuel cell application. Electrochem. Commun. 2018, 94, 18–22. 10.1016/j.elecom.2018.07.021. [DOI] [Google Scholar]
- Soto Rodriguez P. E. D.; Aseev P.; Gómez V. J.; Kumar P.; Ul Hassan Alvi N.; Calleja E.; Mánuel J. M.; Morales F. M.; Jiménez J. J.; García R.; Senichev A.; Lienau C.; Nötzel R. Stranski-Krastanov InN/InGaN quantum dots grown directly on Si(111). Appl. Phys. Lett. 2015, 106, 023105. 10.1063/1.4905662. [DOI] [Google Scholar]
- Nötzel R. InN/InGaN quantum dot electrochemical devices: New solutions for energy and health. Natl. Sci. Rev. 2017, 4, 184–195. 10.1093/nsr/nww101. [DOI] [Google Scholar]
- Soto Rodriguez P. E. D.; Nash V. C.; Aseev P.; Gómez V. J.; Kumar P.; Alvi N. U. H.; Sánchez A.; Villalonga R.; Pingarrón J. M.; Nötzel R. Electrocatalytic oxidation enhancement at the surface of InGaN films and nanostructures grown directly on Si(111). Electrochem. Commun. 2015, 60, 158–162. 10.1016/j.elecom.2015.09.003. [DOI] [Google Scholar]
- Yin H.; Qian Y.; Xie L.; Song C.; Wang X.; Chen H.; Wang P.; Zhou G.; Nötzel R. Electrocatalytic activity of InN/InGaN quantum dots. Electrochem. Commun. 2019, 106, 106514. 10.1016/j.elecom.2019.106514. [DOI] [Google Scholar]
- Alvi N. u. H.; Soto Rodriguez P. E. D.; Aseev P.; Gómez V. J.; Alvi A. u. H.; Hassan W. u.; Willander M.; Nötzel R. InN/InGaN quantum dot photoelectrode: Efficient hydrogen generation by water splitting at zero voltage. Nano Energy 2015, 13, 291–297. 10.1016/j.nanoen.2015.02.017. [DOI] [Google Scholar]
- Kumar P.; Devi P.; Jain R.; Shivaprasad S. M.; Sinha R. K.; Zhou G.; Nötzel R. Quantum dot activated indium gallium nitride on silicon as photoanode for solar hydrogen generation. Commun. Chem. 2019, 2, 4. 10.1038/s42004-018-0105-0. [DOI] [Google Scholar]
- Alvi N. u. H.; Soto Rodriguez P. E. D.; Hassan W.; Zhou G.; Willander M.; Nötzel R. Unassisted water splitting with 9.3% efficiency by a single quantum nanostructure photoelectrode. Int. J. Hydrogen Energy 2019, 44, 19650–19657. 10.1016/j.ijhydene.2019.06.008. [DOI] [Google Scholar]
- Aseev P.; Rodriguez P. E. D. S.; Gómez V. J.; Alvi N. u. H.; Mánuel J. M.; Morales F. M.; Jiménez J. J.; García R.; Senichev A.; Lienau C.; Calleja E.; Nötzel R. Near-infrared emitting In-rich InGaN layers grown directly on Si: Towards the whole composition range. Appl. Phys. Lett. 2015, 106, 072102. 10.1063/1.4909515. [DOI] [Google Scholar]
- Moses P. G.; Van de Walle C. G. Band bowing and band alignment in InGaN alloys. Appl. Phys. Lett. 2010, 96, 021908. 10.1063/1.3291055. [DOI] [Google Scholar]
- Chen Y.; Chen H.; Song J.; Zhao Y.; Rao L.; Zhou G.; Nötzel R. One-compartment InGaN nanowire fuel cell in the light and dark operating modes. ACS Omega 2021, 6, 17464–17471. 10.1021/acsomega.1c01844. [DOI] [PMC free article] [PubMed] [Google Scholar]
- Qian Y.; Wang P.; Rao L.; Song C.; Yin H.; Wang X.; Zhou G.; Nötzel R. Electric dipole of InN/InGaN quantum dots and giant surface photovoltage directly measured by Kelvin probe force microscopy. Sci. Rep. 2020, 10, 5930. 10.1038/s41598-020-62820-3. [DOI] [PMC free article] [PubMed] [Google Scholar]
- Xie L.; Wang P.; Yin H.; Zhou G.; Nötzel R. All InN/InGaN solid state potentiometric chloride sensor with super-Nernstian sensitivity. Appl. Phys. Express 2020, 13, 027003. 10.35848/1882-0786/ab67d3. [DOI] [Google Scholar]
- Rao L.; Wang P.; Qian Y.; Zhou G.; Nötzel R. Comparison of the extended gate field-effect transistor with direct potentiometric sensing for super-Nernstian InN/InGaN quantum dots. ACS Omega 2020, 5, 32800–32805. 10.1021/acsomega.0c05364. [DOI] [PMC free article] [PubMed] [Google Scholar]
- Brown G. F.; Ager J. W. III; Walukiewicz W.; Schaff W. J.; Wu J. Probing and modulating surface electron accumulation in InN by the electrolyte gated Hall effect. Appl. Phys. Lett. 2008, 93, 262105. 10.1063/1.3062856. [DOI] [Google Scholar]
- Bailey L. R.; Veal T. D.; King P. D. C.; McConville C. F.; Pereiro J.; Grandal J.; Sánchez-García M. A.; Muñoz E.; Calleja E. Band bending at the surfaces of In-rich InGaN alloys. J. Appl. Phys. 2008, 104, 113716. 10.1063/1.3033373. [DOI] [Google Scholar]
- Van de Walle C. G.; Segev D. Microscopic origins of surface states on nitride surfaces. J. Appl. Phys. 2007, 101, 081704. 10.1063/1.2722731. [DOI] [Google Scholar]
- Veal T. D.; Jefferson P. H.; Piper L. F. J.; McConville C. F.; Joyce T. B.; Chalker P. R.; Considine L.; Lu H.; Schaff W. J. Transition from electron accumulation to depletion at InGaN surfaces. Appl. Phys. Lett. 2006, 89, 202110. 10.1063/1.2387976. [DOI] [Google Scholar]
Associated Data
This section collects any data citations, data availability statements, or supplementary materials included in this article.