

Abstract

A cobalt(III) complex, [Co(L)]Cl (complex 1, where L = 1,8-[N,N-bis{(3-formyl-2-hydroxy-5-methyl)benzyl}]-1,4,8,11-tetraaza-5,5,7,12,12,14-hexamethylcyclotetradecane) with distorted octahedral geometry has been synthesized and characterized using various spectroscopic techniques. The structure of the ligand has remarkably rich hydrogen intermolecular interactions such as H···H, H···C/C···H, and H···O/O···H that vary with the presence of the metal ion, and the structure of complex 1 has Cl···H interactions; this result has been proved by Hirshfeld surface and two-dimensional (2D) fingerprint maps analyses. The complex exhibits a quasi-reversible Co(III)/Co(II) redox couple with E1/2 = −0.76 V. Calf thymus DNA (CT DNA) binding abilities of the ligand and complex 1 were confirmed by spectroscopic and electrochemical analyses. According to absorption studies, the ligand and complex 1 bind to CT DNA via intercalative binding mode, with intrinsic binding strengths of 1.41 × 10³ and 8.64 × 10³ M–1, respectively. A gel electrophoresis assay shows that complex 1 promotes the pUC19 DNA cleavage under dark and light irradiation conditions. Complex 1 has superior antimicrobial activity than the ligand. The cytotoxicity of complex 1 was tested against MDA-MB-231 breast cancer cells with values of IC50 of 1.369 μg mL–1 in the dark and 0.9034 μg mL–1 after light irradiation. Besides, cell morphological studies confirmed the morphological changes with AO/EB dual staining, reactive oxygen species (ROS) staining, mitochondria staining, and Hoechst staining on MDA-MB-231 cancer cells by fluorescence microscopy. Complex 1 was found to be a potent antiproliferative agent against MDA-MB-231 cells, and it can induce mitochondrial-mediated and caspase-dependent apoptosis with activation of downregulated caspases. The biotoxicity assay of complex 1 on the development of Artemia nauplii was evaluated at an IC50 value of 200 μg mL–1 and with excellent biocompatibility.
Introduction
Medicinal inorganic chemistry has gained much attention in recent years because macrocyclic chelating ligands can easily control and change the properties of metal ions in biological systems.1,2 Different types of cobalt complexes in +2 and +3 oxidation states have been synthesized and analyzed, emphasizing the interaction of metal ions in the transmethylation reaction and reversible molecular oxygen absorption. Most of the research work focuses on cobalt ion-containing complexes since it has superior potential for medicinal applications.3,4 Despite their significant resourcefulness, these cobalt complexes are not famous in the inorganic medicinal field compared to their metals. Nowadays, clinical trials for a Co(III) Schiff base complex and Doxovir have shown that they are efficacious toward drug-resistant herpes simplex virus 1 (HSV1).5 Under UV light, the macrocyclic complexes show photoactive DNA cleavage activity, which is the reason phthalocyanine and porphyrin dyes are used as photodynamic therapy (PDT) agents.6 The organometallic-based complexes in PDT are nearly unidentified. PDT is a noninvasive cancer treatment in which medication acts as a photosensitizer and is photoactivated in cancer cells by red and UV light. Reactive oxygen species (ROS) are produced by cancer cells, but healthy cells that are not exposed are unaffected by the cytotoxicity of ROS.7 While it may be a model for cobalt complexes, the mechanism of Doxovir action is not fully cleared. Therefore, the understanding of cobalt complexes approaching the biological systems to elicit therapeutic effects is important for developing cobalt complex drugs. As part of our interest, we developed a 1,8-N,N′-disubstituted “tet a” macrocyclic ligand L that contains two N-methylsalicylaldehyde substituents and can be considered as a derivative of the 14-membered “tet a” macrocycle. Metal-cyclam adducts show five configurational transisomers, trans-I to trans-V, with trans-III being the most stable and trans-V being the strained form. However, complex 1 has the uncommon trans-V configuration. As an extra coordinating site, the symmetrical N4O2 hexadentate ligand has two secondary and tertiary nitrogen atoms, two phenoxide oxygen atoms, and formyl groups for further extension. This is a long-chain molecular spacer that is also utilized to form mono-, di-, and trinuclear metal complexes.8 The complex geometry is distorted because the nitrogen atom in the complex deviates from the ring’s planarity. The quantity and type of N-substituents can improve the selectivity for metal sequestration as well as the stability of the generated complexes and their potential usage in the coordinating properties.9 The diamagnetic octahedral cationic complex of CoIII, derived from an N,N′-disubstituted “tet a” macrocyclic ligand, is reported here with its characterization, crystal structure, DNA binding, and photocleavage activity. Significant results reveal that complex 1’s DNA photocleavage activity improves compared to the control species. Furthermore, complex 1 shows a noteworthy photodynamic activity of the light effect via the apoptotic pathway. The antibacterial activities and biocompatibility of complex 1 were confirmed by the Artemia salina model organism.
Results and Discussion
Synthesis of Complex 1
Complex 1 was obtained by adding CoCl2·6H2O to ligand L in methanol, which yields a diamagnetic brown complex. First, CoII is formed and oxidized by air. Complex 1 appears to be a 1:1 electrolyte based on the molar conductance values in methanol.10 Elemental analysis is in good arrangement with the formulation. Complex 1 exhibited a molecular ion peak at m/z = 637 attributed to [M – C1]+, which on fragmentation forms a peak at m/z = 502 (CoC26H43N4O2) due to the loss of one methylsalicylaldehyde group from [M – C1]+ and another fragment at m/z = 445 (C26H45N4O2) due to the loss of the metal and methylsalicylaldehyde group (Scheme 1).
Scheme 1. Synthesis of Cobalt(III) Complex 1.

Photophysical Characterization
The electronic spectra of the ligand and complex 1 were investigated in the 200–800 nm region. Figure 1 shows the methanol solution spectra of the ligand with complex 1. According to the literature,11 the low-energy shoulder at 478 (ε = 790 M–1 cm–1) might be ascribed to the charge transfer (CT) process from the pπphenolate → dσ*cobalt(III) complex (LMCT). High molar extinction coefficients can be seen in the high-energy bands at 262 nm (ε = 14 000 M–1 cm–1) and 384 nm (ε = 6800 M–1 cm–1). Because of the existence of aromatic pendant rings in the ligands, they may be ascribed to π–π*, n−π*, and intraligand charge transition processes. The band at 677 nm is due to 1A1g → 1T2g transition in a low-spin octahedral Co(III) complex, which is unaffected by symmetry reduction (Figure 1). The absorption spectra of the ligand and complex 1 in the visible range are shown in the inset. The band’s high intensity verifies the mixed charge transfer mechanism. However, in an octahedron, the low-energy absorption band 1A1g → 1T1g is predicted to be less intense. The addition of cobalt ions to the ligand causes a 15 nm blue shift in the Salen-based absorption peaks, illustrating the cobalt ion and Salen moiety ground state interaction. Upon complexing the ligand, the fluorescence of L is quenched dramatically. The Stern–Volmer quenching constant value is Kb = 1.05 × 10³ M–1 (Figure S4). The ligand and cobalt ion quenching mechanism might be electron transfer (ET) or energy transfer (EnT) or a combination of the two. This is due to the donor’s near proximity to the acceptor. The observed result is well related to the estimated Förster distance of 10.6 Å and demonstrates that the ET is thermodynamically favorable. Thus, the unprecedented N4O2-donating nature of the ligand to Co(III) and the symmetry of the ligand play a key role. The above observation can be explained by earlier reports.12,13
Figure 1.

UV–visible absorption and emission spectra of the ligand (L) and complex 1 in methanol solution at room temperature (RT).
Crystal Structure Description
Figure 2 depicts the ORTEP plot of complex 1. The selected bond angles and lengths with their predictable standard deviations are listed in Table S2. Complex 1 crystallizes in triclinic space group P-1. As shown in Figure 2, complex 1 is in a distorted octahedral geometry with an N4O2 donor set involving two phenoxide oxygen atoms and four “tet a” nitrogen atoms, which are ligated to a cobalt(III) ion. The two tertiary nitrogen atoms of “tet a” are trans to each other, and two secondary nitrogen and two phenoxide oxygen atoms are cis to each other. The ligands coordinated with atoms of different nature are trans to each other. The Co(1)–N(1) bond length is slightly longer than Co(1)–N(3), Co(1)–N(2), and Co(1)–N(4) bond lengths (2.035, 2.037, 2.019, and 2.007 Å, respectively) (Table S2), close to the values found in the reported compounds. The two phenyl rings are nearly planar, which cross-sect at an angle of 42.29°. The cis angles are between 83.60 and 96.94°. The confirmation of the saturated six-membered rings [Co(1)–N(3)–C(6)–C(7)–C(8)–N(4)] and [Co(1)–N(1)–C(1)–C(2)–C(3)–N(2)] is half-chair, twisted on C(1)–C(3) and C(6)–C(8), with puckering parameters Q = 0.437(4) Å, Φ = 61.59 and Q = 0.437(4) Å, Φ = 89.3(4), respectively. One carbonyl group points away from the chelating phenyl oxygen group, while the other points toward it. The phenolic (C–O) lengths [1.321 Å] in complex 1 are significantly longer than those [1.302 Å] in the precursor. In general, the tiny distances of five-membered and six-membered chelate rings are 2.6–2.7 and 2.8–2.9 Å, respectively, while the biting angles are 84–88 and 92–96°, respectively.14 The N–Co–N bond angles (88.13 and 87.71°) and N···N bond distances (2.813 and 2.808 Å) in the current study depart somewhat from the standard value of six- and five-membered chelate rings. Similarly, the bond distances and bond angles of N···N (2.882 and 3.013 Å) and N–Co–N (90.13 and 96.89°) varied slightly from the usual range for the six-membered ring octahedral coordination and chelate rings on the metal. The intermolecular Co···Co separation is 9.49 Å, a value that does not permit any kind of bridging between the cobalt atoms. The compound contains a noncoordinating chloride anion, which neutralizes the complex’s positive charge. For stabilizing the crystal packing and molecular structure, there are three centre N–H···Cl···N–H intramolecular hydrogen bonds, in which two H-bond donors are bound to a single H-bond acceptor (Table S3) (e.g., N–H···Cl···H–N), 2.37 Å; N(4)–H(4)···Cl(1) and (N(2)–H(2)···Cl(1), 2.40 Å; ∠N(2)–H(2)···Cl(1)···N(4)–H(4), 51.54°).15 Such an acceptor is overcoordinated, and an instance in proteins is initially noted by Kendrew. The occurrence of such bifurcated hydrogen bonds in proteins has been analyzed before16,17 and even implicated in bending the helices.18 Complex 1 does not pack as a helix. As observed from the crystal packing structure, the introduction of N-substituted moieties, as steric hindrance units, induce an increase in the closest Co-to-Co distance of 12.04 Å in a unit cell the complex.
Figure 2.

Crystal structure of complex 1. The disorder has been omitted for clarity.
Hirshfeld Surface Analysis
To understand the supramolecular chemistry of noncovalent interactions in the crystal structures, we conducted a molecular Hirshfeld surface study and correlated 2D fingerprint plots for the ligand and complex 1 were created using Crystal Explorer 17.5.19 The Hirshfeld surface study (dnorm, curvedness, and shape index) of the ligand and its complex 1 is used to describe the small intermolecular interactions, which are shown in Figure 3a,b. For the white zones, the resulting dnorm value is zero, which symbolizes the linkages and is equivalent to the van der Waals radius of the surface, which is colored in red, white, or blue in the Hirshfeld surface study. The dnorm value is red negative when the intermolecular connections are shorter than the van der Waals radii; the dnorm value is blue positive when the links are longer. The dnorm value for ligands in this study varies from 0.050 to 1.500 Å, while it ranges from −0.250 to 1.500 Å for complex 1. The ligand shape index ranges from 1.000 to 1.000 Å, while the complex 1 curvedness ranges from 4.000 to 0.400 Å. The surface area transparency facilitates the display of the complex 1 structure. The red patches on the surface area indicate the ligand’s and its complex 1 essential hydrogen-bonding interactions. The shape index depicts the trait packing modes and stacking configurations of the complex 1 molecules. The 2D fingerprint plots shown in Figure 3c,d present links between two atoms, indicating the proportion of contributions from various types of interactions. The uppermost interactions in the ligand and complex 1 involve hydrogen atoms (H···H). The 2D fingerprint plots obtained from the Hirshfeld surface study provide a synopsis of the frequency of each mixture of de and di across the molecule surface and thus indicate not only which interactions are present but also the proportion of contributions and related area of the surface from every interaction types.
Figure 3.

Molecular Hirshfeld surfaces, curvedness, and shape index of the (a) ligand and (b) complex 1. (c, d) 2D fingerprint plots of the (c) ligand and (d) complex 1, occupied and resolved into O···H, C···H, Cl···H, and H···H contacts demonstrating how the percentages of connections contributed to the molecules’ overall Hirshfeld surface region. The Hirshfeld surface region interactions are shown by blue areas. The di and de values indicate the distances from the surface to the interior and exterior nearby-neighbor atoms, respectively. (e). Relative percentage contributions from independent intermolecular interactions to the Hirshfeld surfaces of the ligand and complex 1.
As shown in Figure 3c, the H···H bond interactions become prominent around the ligand at (0.15, 1.15 Å) and account for 72.6% of the whole region of Hirshfeld surfaces. The H···C/C···H bond engagements are in the range of (1.60 and 1.60 Å) and manifest as a pair of equal wings, accounting for 12.5% of the entire region of Hirshfeld surfaces. The ratio of H···O/O···H bond interactions account for 14.2% of the total Hirshfeld surfaces for each ligand molecule. As shown in Figure 3d, the of H···H interactions appeared at (1.05 and 1.05 Å), amounting to 69.8% of the entire region of Hirshfeld surfaces around complex 1. The H···C/C···H bond contacts in the range of (1.6 and 1.6 Å) contribute to 10.4% of the whole Hirshfeld surface region. The quantities of H···O/O···H bond interactions include 12.9% of the whole Hirshfed surfaces for all molecules of complex 1. Cl···H linkages contribute an additional contribution (6.9%) to complex 1’s total Hirshfeld surface area, with the shortest de + di ≈ 2.8 Å. There was no additional interaction observed in the ligand and complex 1 structures. The H···C bond interactions in fingerprint plots of both ligand and complex 1 are shown as “wings” in Figure 3c,d, with the shortest de + di ≈ 2.7 Å. It should be noted that both the ligand and complex 1 exhibit a much larger proportion of H···H links, and these links in the fingerprint plot are pronounced with the shortest de + di ≈ 2.2 Å for both ligand and complex 1. These weaker hydrogen bonds caused the stability of the ligand and complex.20
Cyclic Voltammetry
The cyclic voltammogram of complex 1 describes a quasi-reversible single-electron redox procedure involving a CoIII/CoII couple at Epa= −0.69 V, Epc = −0.83V, E1/2 = −0.76 V, ΔEp = 0.14 V, and Ipa/Ipc= 0.90, at a scan rate of 0.15 V s–1. As shown in Figure 4, the straight linear plot (inset) of Ipc vs ν1/2 passes close to the origin, indicating that the electrode reaction is mainly diffusion-controlled.21,22
Figure 4.
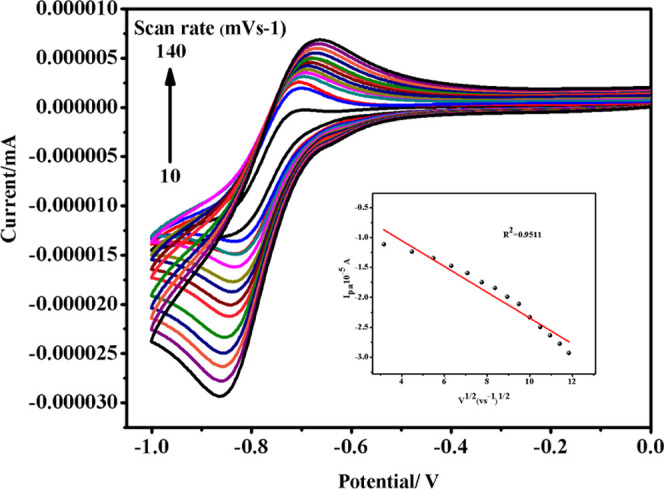
Cyclic voltammogram of complex 1 at different scan rates (V s–1). The arrowʼs direction denotes increasing scan rates as 10–140 mV s–1.
DNA Binding Studies
Absorption Spectral Studies
From a pharmacological viewpoint, the main aim of most antitumor medicines is DNA binding study. As a result, researchers are paying increasing attention to the DNA-binding behavior of transition-metal complexes for therapeutic medical uses. Thus, the binding of complex 1 and CT DNA was analyzed by UV–visible spectroscopic studies. A titration-based absorption experiment is a great tool for understanding the interaction between the molecules and CT DNA. Transition-metal complexes easily bind to CT DNA via covalent interactions, in which the complex’s labile ligand is substituted by a CT DNA nitrogen base such as guanine N7. Moreover, the noncovalent interactions were formed by electrostatic or groove-binding and intercalation processes. UV–visible absorption spectra confirm the ligand and complex 1 (aromatic chromospheres) interaction with the base pairs of CT DNA, which is shown in Figure S5. The decrease in destruction coefficient usually parallels the interactive (hypochromic shift) binding strength. The UV absorption spectra of the ligand and complex 1 in the presence of increasing levels of CT DNA were recorded in a buffer solution at pH 7.2. In the charge transfer (CT) band of complex 1, electronic absorption spectra revealed a reasonable bathochromic shift and an average hypochromic shift. The complex 1 absorption bands at 265 and 340 nm showed hypochromic shifts of 16 and 12%, respectively, confirming the interaction of complex 1 with double-helical CT DNA. The hypochromic shift was caused by an interaction between the complex 1 and CT DNA base pairs, compatible with the intercalative binding and stabilization of CT DNA.
The monocationic complex’s binding constant (Kb) was calculated using the following equation:23 [[DNA]/(εa – εf)=[DNA]/(εb – εf) + 1/(Kb(εb – εf))], where [DNA] denotes the DNA concentration in base pairs. The absorption coefficient (εa) refers to (Aobs/[compound]). εf represents the free complex’s destruction coefficient, whereas εb means that the complex is fully attached to DNA. The values for 1/(εb – εf) and 1/Kb(εb – εf) are derived from the intercept and slope of the linear plot of [DNA]/(εa – εf) vs [DNA], respectively. The value of (Kb) is obtained from the ratio of the slope to the intercept. The hypochromic shift and binding (Kb) constant value of the ligand (Kb = 1.41 × 10³ M–1) and complex 1 (Kb = 8.64 × 10³ M–1) indicate finite interaction between monocationic complex 1 and CT DNA. The obtained results are identical to those for the monocationic ruthenium, cobalt, and iridium complexes.24,25 The binding constant (Kb) value of the monocationic metal complex is lower than that of the previously reported trication complex with symmetric ligands, indicating that a greater positive charge increases the binding constant value. The introduction of CT DNA with 11–20-fold excess amount after saturation resulted in the unchanged electronic absorption spectrum of the final equilibrium mixture. It indicates that complex’s intercalative binding occurs with phosphate residues via electrostatic interactions. Because of the ligands’s expanded planar shape, the complex has a larger binding (Kb) constant value, significantly promoting intercalative interaction with the CT DNA base pairs.
Competitive Binding Studies
In the presence of CT DNA, ethidium bromide (EB) exhibits a high fluorescence emission intensity, which is due to the high intercalation of EB to the surrounding CT DNA base pairs. Recent reports prove that these enhanced fluorescence properties are easily quenched by adding a small amount of the metal complex.26 The fluorescence spectra of EB bound to CT DNA in the presence and absence of the ligand and complex 1 at different concentrations are shown in Figure S6. The addition of complex 1 to CT DNA pretreated with EB caused unusual quenching of the fluorescence intensity, which indicated that this complex 1 competes with EB for binding to CT DNA. The canonical Stern–Volmer equation analyzed the quenching performance. The Ksv plot values for the ligand and complex 1 are Kb = 1.72 × 10³ and 2.67 × 10³ M–1, respectively. The interaction of complex 1 with CT DNA is strong, which was confirmed by the quenching constant value.27
DNA Binding Studies by Cyclic Voltammetry (CV)
At a scan rate of 0.15 V s–1, the cyclic voltammograms of complex 1 and CT DNA represent a quasi-reversible single-electron redox process between complex 1 and CT DNA. As demonstrated in Figure 5a (inset), the linear relationship between Ipc and v1/2, which goes nearby the origin, revealed the diffusion-controlled electrode response. The redox flexibility of the transition-metal ion located at the active site of the metalloenzyme is critical to biocatalytic oxidation of the enzymatic models, which might reveal their potential to operate biomimetic catalysis. The redox-active process of the complex 1 interaction with CT DNA was verified using CV techniques. Furthermore, the CT DNA binding approaches were evaluated from the above electrospectral studies. We use these techniques to learn the interaction of the ligand and complex 1 with CT DNA. Figure 5b shows the CV performance of 0.1 mmol L–1 complex 1 in the presence and absence of 2–25 × 10–6 mol L–1 CT DNA in bare carbon electrodes (GCE). When CT DNA is added to complex 1, the peak current is gradually decreased because the formation of slowly diffusing, heavy molecular weight complex 1 and CT-DNA adduct The perceptible potential positive peak shift described the intercalation of the complex 1 planar component into the stacked base pair region of CT DNA.28 When CT DNA is continuously added, the peak potential shifts to a negative value, which represents effortless reduction. This performance is additionally explained by a change in the system. The CT DNA is surrounded by complex 1 in the system so that the diffusion coefficient and reduction potential change.
Figure 5.

(a) Cyclic voltammograms of complex 1 and CT DNA at different scan rates. The arrowʼs direction indicates increasing scan rates from 10 to 150 mV s–1. (b) Cyclic voltammograms of 0.1 mol L–1 complex 1 in CH3CN with TBFP (0.1 mol L–1) as a supporting electrolyte in the absence (a) and presence (b–g) of CT DNA (2–25 × 10–6 mol L–1) at room temperature and a scan rate of 100 mV s–1. The inset figure of (b) shows the plot of log (IH–G/(IG – IH–G)) vs log (1/[DNA]) to evaluate the binding constants of complex 1 and CT DNA. (c) Cb/CF vs various concentrations of DNA (2–25 × 10–6) mol L–1 to determine the binding site size. (d) Plots of I vs V1/2 for the identity of the diffusion coefficients of complex 1 and CT DNA. Scan rate (mV s–1) = 10, 20, 30, 40, 50, 60, 70, 80, 90, 100, 110, 120, 130, 140, and 150.
The peak potential gradually decreases when the CT DNA, in the range of 2–25 × 10–6 mol L–1, is added to complex 1; it aids in estimating the binding constant value using the equation29
where IG and IH–G are the peak currents of free guest (G) and complex (H–G), K is the CT DNA-binding constant value. From the intercept of log (1/[DNA] vs [log (IH–G/(IG – IH–G))]), the binding constant value (K) of complex 1 with CT DNA was found to be 1.58 × 10⁴ mol–1 L (Figure 5b). A larger binding constant value confirms strong binding attraction of CT DNA with complex 1, which confirms a suitable pharmaceutical medicine. The binding site size value was determined by the following equation30
where s indicates the binding site size value (base pairs). The concentration of base pairs is commonly referred to as [DNA]/2, when calculating the CT DNA concentration in terms of complex 1. So, the above equation can be re-written as Cb/Cf = K([DNA]/2s), where Cb and Cf represent concentrations of bound species with CT DNA and bare complex 1, respectively. The following equation was used to calculate the ratio of the bound and bare complex 1 concentrations.31 Peak currents of complex 1 with and without CT DNA are denoted IDNA and I, respectively.
The preceding equation yields a binding constant value of 1.58 × 10⁴ mol–1 L. Furthermore, the plot of Cb/Cf vs [CT DNA] in Figure 5c yielded a value of the binding site size of 0.40 bp. The number of binding sites implies one binding site per two base pairs, indicating that complex 1 intercalated into CT DNA. Another barrier type, such as groove binding and electrostatic binding, has a higher binding site number,32 and it is forbidden to use an intermediate to distribute the electrochemical process. The peak current (I) was plotted vs v1/2 with and without CT DNA by applying the Randles–Sevcil equation, as illustrated in Figure 5d.33
where Co* is the bulk concentration (mol mL–1) of the electroactive type, A is the surface area coefficient, and the remaining parameters have their usual meanings. The linear plots demonstrate that the distribution step prevents the electrochemical process. At scan rates 10–150 mV s–1, the CT DNA-bound complex 1 diffusion coefficients were resolved to form the slopes of Randles–Sevcik equation plots. Moreover, the coefficient of CT DNA-bound species suggests intercalation (Db = 1.16 × 105 cm2 s–1) of the planar part of the molecule into the staked base pairs of CT DNA.34 The hydrophobic interaction decreases the total charge on the electrostatic species due to the stronger binding modes in the hydrophobic area of the host matrix, which was confirmed by the current study. It is important to describing the binding of a complex cationic molecule to an amphiphilic matrix such as CT DNA. In many situations, these connections are governed by simple Coulombic interactions, like one between a charged metal complex and negatively charged sugar–phosphate backbone of CT DNA. Thus, the interplay among hydrophobic and electrostatic interactions is significant for the binding of cationic transition-metal complexes, which have an aromatic, planar moiety.
The in vitro binding studies indicated that CT DNA and complex 1 have stacked interaction along the aromatic chromophore of complex 1 with DNA base pairs that are compatible with intercalative binding mode. To confirm this binding mode, an in silico experiment was performed using complex 1 and 1BNA (similar to CT DNA) structures, which showed the lowest free energy value of -277.57 eV. The docked pose (Figure S7) showed that the planar methylsalicylaldehyde pendant arm in the ligand intercalated connecting the base pairs of DNA with π–π interactions. As stated in the UV spectral studies, the intercalator compounds must show the π-type interactions to achieve the assumed binding mode. The inset image reveals that the pendant arm moiety in complex 1 remains intercalated to the nucleobase at 3.2 Å and the existence of hydrogen bonds stabilized the intercalation mode of binding. The free heteroatoms (O/N) of the ligand form a single hydrogen bond at 1.8 Å with G base/phosphoryl hydrogen, and the pose is stabilized by various hydrogen bonds to the DNA structure. Considering these interactions into in account jointly with the strength of hydrogen bonds between G and C bases that reinforced the positive intercalated pose between complex 1 and DNA.
Nuclease Activity and Photoinduced Nuclease Activity Studies
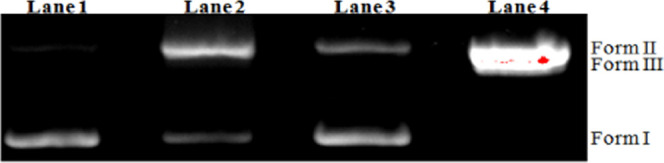
Complex 1’s capacity to cleave supercoiled DNA is determined by agarose gel electrophoresis studies. Circular plasmid pUC19 DNA in the presence of metal complexes is subjected to electrophoresis. Three bands appear with rapid movement, which is known as intact supercoiled (SC) form (Form I) DNA. Meanwhile, if scission occurs on a single strand, the supercoil form slows down, resulting in slow-moving nicked circular (NC) form (Form II) DNA. The two strands are cleaved and the DNA migrates between Forms I and II and produce a linear (LC) form (Form III). Complex 1’s DNA cleavage capacity was tested using plasmid pUC19 DNA in an aqueous medium buffer solution (5 mM Tris–HCl/50 mM NaCl, pH 7.2) at 37 °C for 2 h. No DNA cleavage was observed for the control (lane 1), in which plasmid DNA was present and complex 1 and H2O2 were not present, as shown in Figure 6. When complex 1 coexists with H2O2, it induced the obvious cleavage of plasmid DNA. At a concentration of 100 μM, complex 1 can nearly support the total exchange of DNA from Form I to Form II. Figure 6 shows that in lanes 3–5 for complex 1 with an increase in the concentration from 200 to 500 μM, supercoiled DNA had migrated and changed to NC (Form II) and LC (Form III) forms. The possibility of double-strand scission improves depending on the concentration of complex 1. The DNA cleavage capability of the complex is due to the presence of cobalt(III) ions and the aromatic moiety in the complex.35,36 Similar activity was observed (Figure 7) when the supercoiled form of DNA is fully converted to the nicked form after incubation of complex 1 with DNA in the presence of glutathione. The reduction of Co(III) ions is probably the important step for DNA cleavage.
Figure 6.

Agarose gel electrophoresis of pUC19 plasmid DNA (0.2 mg, 33.3 mM) with complex 1 in 5 mM Tris–HCl/50 mM NaCl buffer (pH 7.2) at 37 °C. Lanes 1–5 indicates the DNA control, DNA + H2O2, DNA + H2O2 + 200 μM complex 1, DNA + H2O2 + 300 μM complex, and DNA + H2O2 + 500 μM complex 1, respectively.
Figure 7.

Agarose gel electrophoresis of pUC19 plasmid DNA (0.2 mg, 33.3 mM) for chemical nuclease activity monitoring incubated with complex 1 in 5 mM Tris–HCl/50 mM NaCl buffer (pH 7.2) at 37 °C for 2 h. Lanes 1–4 indicate DNA, DNA + complex 1, DNA + glutathione, DNA + glutathione + complex 1, respectively.
The photonuclease activity of complex 1 was monitored with the help of a gel electrophoresis experiment using supercoiled pUC19 DNA buffer solution in an aqueous medium (5 mM Tris–HCl/50 mM NaCl, pH 7.2) at 37 °C for 2 h. Photolysis is done by light-irradiating the samples with a halogen lamp (650–950 nm). The control (line 1) with complex 1 shows that there is almost no cleavage. Gel electrophoresis of plasmid pUC19 DNA treated with complex 1 under light irradiation for about 30 min is shown in Figure 8. DNA cleavage was not observed for the control (lane 1) because the plasmid pUC19 DNA was present but complex 1 and H2O2 were absent, as shown in Figure 8; in lane 2, plasmid pUC19 DNA was incubated with H2O2, and in lane 4, with complex 1. At 200 μM concentration, complex 1 with H2O2 brought about 70% conversion of NC DNA to LC DNA (Figure 8, lane 3). Cleavage of plasmid pUC19 DNA in the presence of complex 1 under a photolytic environment was due to guanine oxidation by the excited state of the cobalt(III) ion. Figure 9 depicts the photoinduced DNA cleavage activity of complex 1 with glutathione in DMF and complex 1 describing the cleavage of SC DNA (form I) to form (II) and form (III) on incubation at 37 °C for 2 h. The control experiments with DNA alone and incubation of the plasmid pUC19 DNA and glutathione showed no crucial cleavage. This finding demonstrates that complex 1’s nuclease activity is capable of cleaving DNA in the presence of reducing chemicals or under photolytic conditions.37 In the presence or absence of KI and NaN3 scavengers, the additives did not influence the DNA cleavage activity in control trials (Figure S8). This demonstrates that the additives are not involved in DNA cleavage activity. Lane 7 in Figure S8 shows that there is no inhibition of cleavage in the presence of KI (Figure S8, lane 7), whereas in lane 5, in the presence of KI, considerable inhibition of the cleavage process is noticed (Figure S8, lane 5). The observed result implies that, instead of hydroxyl radicals, hydrogen peroxide is involved in the cleavage process. The introduction of NaN3 suppresses the cleavage process, demonstrating that 1O2 is an active oxygen intermediate that is responsible for the cleavage of the CoIII complex. The enhancement of complex 1’s DNA cleavage activity in the presence of H2O2 and the suppression of the cleavage activity in the presence of NaN3 and KI demonstrate that the cleavage process preceded through the production of singlet oxygen species.38 The photoinduced DNA cleavage activity of complex 1 and cobalt ions was studied under light irradiation at 650–950 nm for about 30 min and without light in Figure S9.
Figure 8.

Cleavage of supercoiled pUC19 by complex 1 in 5 mM Tris–HCl/50 mM NaCl buffer (pH 7.2) on incubation at 37 °C for 2 h followed by irradiation at 650–950 nm for 30 min: lane 1, control DNA; lane 2, DNA + H2O2; lane 3, DNA + H2O2 + complex 1 (200 μM); lane 4, DNA + complex 1 (200 μM).
Figure 9.
Photoinduced DNA cleavage activity of supercoiled pUC19 by complex 1 in 5 mM Tris–HCl/50 mM NaCl buffer (pH 7.2) on incubation at 37 °C for 2 h with irradiation at 650–950 nm for 30 min: lane 1, DNA; lane 2, DNA + complex 1; lane 3, DNA + glutathione; lane 4, DNA + glutathione + complex 1.
Antimicrobial Activity
The antimicrobial assay of complex 1 was analyzed at concentrations of 50 and 100 μL against pathogenic bacterial strains of Gram-negative (Klebsiella pneumoniae and Escherichia coli) and Gram-positive strains, as shown in Figure 10. Likewise, the antifungal activity was also analyzed using Candida albicans. Table S4 shows the antimicrobial activities of complex 1. The results point out that the antimicrobial activities of complex 1 gradually increased in a dose-dependent manner. As compared with standard antibiotic tetracycline, the results revealed that complex 1 effectively inhibited the growth of all bacterial strains in the order K. pneumoniae > Bacillus subtilis > Staphylococcus aureus > E. coli. The antifungal activity of C. albicans was observed, and the inhibition zone was measured from 8 to 10 mm (Figure S10). Complex 1 efficiently penetrated the cell membrane and lysed the bacterial cell. However, the ligands having nitrogen and oxygen donor systems may inhibit the growth, by metal ions upon chelation. The proximity of chelation decreases the sharing of positive ions to the donor groups and might cause the delocalization of π-electrons and thereby enhance the lipophilic nature, leading to transverse microbial cell membranes. The results suggest that complex 1 is a hopeful drug to fight against pathogenic microbes.39,40 The activity of complex 1 against Gram-positive and Gram-negative bacteria was comparable to those of current antibacterial drugs such as ampicillin, rifampicin, and streptomycin, and complex 1 was found to be very active.
Figure 10.

Antimicrobial efficiency zone of inhibition of complex 1.
In Vitro Cytotoxicity of Complex 1
Based on the capability of complex 1 to bind DNA, we have evaluated the cytotoxicity of complex 1 against human breast cancer MDA-MB-231 and HEK-231 cell lines. The MTT assay was performed to assess the metabolic rate of cells at the cellular level. In general, actively respiring cells convert MTT into an insoluble purple formazan with the help of an enzyme called mitochondrial succinate dehydrogenase. However, the conversion is hampered in dead cells that lack mitochondria, and therefore, cell death occurs. Different concentrations of complex 1 between 0 and 10 μg mL–1 were used in the study to demonstrate cytotoxicity against human breast cancer (MDA-MB-231) cell lines.
In photoirradiation conditions, MDA-MB-231 cancer cells demonstrate improved cytotoxicity with an IC50 value of 0.903 μg mL–1 as compared to the dark (1.369 μg mL–1), as shown in Figure 11. Meanwhile, complex 1 did not affect normal human embryonic cells (HEK-231), implying its selectivity and toxicity toward cancer cells under conditions shown in Figure 12. The results from our study authenticate that complex 1 could be employed as a photodynamic treatment agent based on this example. However, the precise process by which cancer cells are killed is unknown and requires further investigation.41
Figure 11.

MTT assay results for complex 1 with and without irradiation on MDA-MB-231 cells.
Figure 12.

MTT assay results for complex 1 with and without irradiation on HEK-293 cells.
Fluorescence-based labeling of MDA-MB-231 cells at an IC50 concentration of complex 1 (before and after irradiation) was performed to investigate the activation of apoptosis, chromatin condensation, formation of reactive oxygen species (ROS), and reduction in the mitochondrial membrane potential. As inferred, complex 1 was found to induce apoptosis, cleave DNA and as a result generate ROS by decreasing the mitochondrial membrane potential.
An insight into the mechanistic aspects of apoptosis, dual staining (AO/EB) solution of the MDA-MB231 cells was treated with complex 1 in the dark and irradiation conditions to ascertain membrane integrity changes by PDT, which is depicted in Figure 13a–c. The results show that irradiated cells have shown significant reddish-orange emission inferring apoptotic cells when compared to dark conditions. Further, ROS plays a vital role in inducing cell death. As a result, apoptotic cell death by complex 1 was confirmed by DCFH-DA staining, as shown in Figure 13d–f. These results show a significant increase in DCFH-DA-based emission (green) for the complex 1-treated cells with irradiation when compared with dark conditions that showed insignificant emission. In addition, a subcellular localization study in MDA-MB231 cells was performed by fluorescence microscopy using Rhodamine 123 (green) staining, as shown in Figure 13g–i. From these results, it is evident that complex 1 indicates its selectivity in the mitochondria of the cells, as both dark and irradiation conditions have been targeted to mitochondria during treatment with complex 1. Further, nuclear stains (Hoechst 33342) were used before and after irradiation treatment, which confirmed changes in cell morphology with significantly increased blue emission compared with control cells, as shown in Figure 13j–l. We also predict that complex 1 tends to exhibit intracellular DNA-binding ability upon photoirradiation that may induce apoptotic cell death. The results from our study are concurrent with earlier findings.
Figure 13.

Fluorescence staining images of MDA-MB231 breast cancer cells after treatment with complex 1. (a, d, g, j) Control cells (untreated). (b, e, h, k) Complex 1-treated cells in the dark condition. (c, f, i, l) Complex 1-treated cells in the irradiation condition. (i) Fluorescence of dual staining with AO (live, green) and EtBr (dead, red) (a–c). (ii) Fluorescence of ROS staining with DCFH-DA (green). (iii) Fluorescence of mitochondrial staining with Rhodamine 123 (green). (iv) Fluorescence of nuclear staining with Hoechst (blue). Scale bar: 125 μm.
Impaired apoptosis being a signature hallmark in the initiation and progression of cancer has been a topic of intense research in oncology, promoting drugs inducing apoptosis to effectively eliminate malignant cells.42 One of the major milestones achieved in oncology is the understanding of intrinsic and extrinsic signals relating to cell death involving the activation of caspase initiator proteins CASP-8, -9, and -10 and effector caspases CASP-3, -6, and -7 since the liberation of cytochrome c from mitochondria regulates the pro- and antiapoptotic members of the BCL-2 protein family with an inherent apoptotic pathway commonly involving procaspase 9 binding to the apoptosome, which is cleaved and activated, inducing CASP-3 and extrinsic pathway activation by ligand binding to death receptors recruiting CASP-8 with FADD to form death-inducing signaling complex (DISC) activating CASP-3.43 Interest in targeting tumor-suppressing pathways is gaining momentum. With interest progressing toward irradiated chemotherapeutic drugs, ionizing radiation results in structural modifications or changes in electrochemical properties, enhancing bioactivity.44 In our study, we assessed the effect of MDA-MB-231 on tumor suppression of breast cancer through validation by semiquantitative PCR. The expression of initiator caspases CASP-8 and -9 and effector caspase CASP-3 was observed under three conditions, namely, (a) control breast cancer cell line-extracted RNA, (b) prior irradiated MDA-MB-231 cells with RNA, and (c) postirradiated MDA-MB-231 cells with RNA; higher expression of caspases CASP-3, -8, and -9 was observed in irradiation-treated MDA-MB-231 cells, as shown in Figure 14.
Figure 14.

Semiquantitative RT-PCR studies for various genes. (a) Control breast cancer cell line-extracted RNA, (b) prior irradiated MDA-MB-231 cells with RNA, and (c) postirradiated MDA-MB-231 cells with RNA; higher expression of caspases CASP-3, -8, and -9 was observed in irradiation-treated MDA-MB-231 cells.
The cytotoxic value of complex 1 is parallel to those in many works of literature that reported cobalt(III) complexes. The complexes of [Co(tfacen)(NH3)2]+ and [Co(3F-Salen)(NH3)2]+ are productively inactive against A549 lung cancer cells using the MTT assay, but the complexes bearing axial 3F-BnNH2 ligands [Co(tfacen)(3F-BnNH2)2]+ and [Co(3F-Salen)(3F-BnNH2)2]+ show moderate activity. This characteristic shows that the axial ligand is a significant component in determining the activities that characterize the ligand exchange mechanisms.45 Dipyridophenazine–cobalt(III) complexation minimizes the toxicity of the dipyridophenazine base that shows photocytotoxicity in HeLa cervical cancer cells with IC50 values of 19.38 mM and 767 nM in the dark and under 365 nm UV-A light, respectively.46 This observation is helpful to know that diverse natural products have phenazine moieties that show higher antitumor activity.47 The mitocurcumin-based cobalt complex exhibits IC50 values of >100 μM in HeLa and ∼50 μM in MCF-7 cells on incubation of 4 h in the dark. When it involves irradiation, the cytotoxicity activity is enhanced, whereas the untreated light control cells are not dead.
Biotoxicity of Artemia nauplii Studies
The biotoxicity of complex 1 was evaluated on A. nauplii with various increasing concentrations (25, 50, 75, 100, 125, 150, and 200 μg mL–1) at room temperature for 24 h with an IC50 value of 200 μg mL–1. As a result, no death of A. nauplii was observed during the toxicity experiments with complex 1 and control groups, and excellent survival rates were observed, as shown in Figure 15. However, there are no morphological changes. However, complex 1 exposed at 200 μg mL–1 to A. nauplii gut has noticeable changes as observed by a phase-contrast microscope, as shown in Figure 16. The results suggested that complex 1 accumulation does not induce mortality after 24 h of exposure.48−50
Figure 15.

Mortality and survival rate of A. nauplii treated (24 h) with different concentrations of complex 1.
Figure 16.

Biocompatibility and morphological variations of A. nauplli treated with different concentrations of complex 1 using a phase-contrast microscope. (a) Control, (b) 25 μg mL–1, (c) 50 μg mL–1, (d) 75 μg mL–1, (e) 100 μg mL–1, (f) 125 μg mL–1, (g) 150 μg mL–1, and (h) 200 μg mL–1.
Conclusions
In summary, the reaction of a cobalt ion with a symmetrical N,N′-disubstituted macrocyclic “tet a” N4O2 hexadentate ligand, L gave a diamagnetic mononuclear cobalt complex. The single-crystal X-ray structure of [Co(L)]+ reveals an unprecedented N4O2-donor ligand from the distorted octahedral configuration at the Co(III) ion. In Hirshfeld surfaces analysis and corresponding 2D fingerprint plots, the studied structures were stabilized mostly by H···H, H···C/C···H, H···O/O···H, and Cl···H/H···Cl, representing the symmetrically decomposed fingerprint plots for H···H and H···C/C···H interaction and H···O/O···H interaction components manifested as red spots. Hirshfeld surface and 2D fingerprint maps analyses confirmed that the ligand has significant H···H, H···C/C···H, and O···H/H···O Cl···H/H···Cl interactions and intermolecular interactions that vary with the presence of metal ions. Absorption studies described that the ligand and complex 1 bind to DNA by intercalative binding mode and further stabilize the CT DNA duplex, and its intrinsic binding strength was 1.41 × 10³ and 8.64 × 10³ M–1. Complex 1 brings about cleavage of plasmid DNA when it is irradiated with light or under dark conditions. At high concentrations, the complex can bring about DNA cleavage more effectively. Complex 1 has good antimicrobial activity against E. coli, K. pneumoniae, S. aureus, B. subtilis, and C. albicans. The photocytotoxic activity in MDA-MB-231 and HEK-231 cells has exposed that complex 1 is an efficient PDT agent under halogen lamps (650–950 nm). Caspase-3, -8, and -9 inhibitor gene expression experiments have shown that complex 1 induces caspase-independent programmed cell death in MDA-MB-231 cancer cells. The morphological changes with AO/EB dual staining, ROS staining, mitochondria staining, and Hoechst staining revealed that MDA-MB-231 cancer cells enter early cell death under light treatment. Complex 1 does not induce mortality on A. nauplii in 24 h at a concentration of 200 μg mL–1. The macrocyclic “tet a”-derived complex 1 is expected to open new avenues in the chemical paradigm for biological applications.
Experimental Section
Chemicals and Instruments
All chemicals and solvents were purchased of analytical grade. CoCl2·6H2O was obtained from Aldrich. The sodium salt of CT DNA was kept at 4 °C. Buffer solutions were prepared using Millipore water (5 mM Tris–HCl/50 mM NaCl buffer at pH 7.2). Solvents were purified by standard methods.51 The elemental analysis was studied by a Carlo Erba-1106 microanalyzer. The molar conductivity of the prepared solution of complex 1 in methanol was measured with the help of an Elico Model SX80 conductivity bridge. A Perkin-Elmer FT-IR spectrophotometer with a KBr disc was used for the infrared spectra study. The UV–visible spectra were examined using a Shimadzu (UV-3101PC) spectrophotometer with a wavelength range of 200–800 nm. The fluorescence observations were examined using a spectrofluorometer (JASCO FP-8200). Data for single-crystal X-ray diffraction were obtained using an Agilent Technologies Super Nova Dual diffractometer. The Hirshfeld surface (HS) analysis was carried out using the Crystal Explorer Hirshfeld package, with the facility to read the CIF. An Accu Scope fluorescence microscope with a filter was used to collect the microscopic images
Cyclic voltammetry (CV) measurements were performed with an Auto lab PGSTAT128N electrochemical analyzer. A conventional three-electrode system of glassy carbon (GC, working electrode), platinum wire (Pt, counter electrode), and Ag/AgCl (reference electrode) were utilized for electrochemical investigations. The redox measurements were documented using acetonitrile solution containing tetrabutylammonium hexafluorophosphate (NBu4PF6), which acts as a supporting electrolyte in a nitrogen (N2) atmosphere. The concentrations of complex 1 and supporting electrolytes were 10–3 and 10–1 M, respectively.
Synthesis of Complex 1
Complex 1 was formed by slowly adding CoCl2·6H2O (0.0713 g, 0.3 mmol in 20 mL of methanol) to a methanolic solution of the ligand (L) (0.2 g, 0.3 mmol in 20 mL). Then, the reaction mixture was refluxed under stirring for 3h, followed by the reduction of the solution until the volume reached half. Brown single crystals were obtained from slow evaporation of the compound containing the solvent at room temperature. Yield: 66 mg, 44%. Decomposition point: 210 °C. FT-IR (KBr, cm–1): ṽ(C–H) 2962, ṽ(C=O) 1649, ṽ(C–O) 1450, ṽ(Co–O) 798, ṽ(Co–N), 427 (Figure S1). 1H NMR (400 MHz, DMSO) δ 8.74 (d, J = 2.1 Hz, 1H), 8.56 (s, 1H), 8.13 (s, 1H), 7.03 (s, 1H), 2.51 (s, 2H), 1.85 (d, J = 1.3 Hz, 1H), 1.21 (s, 1H) (Figure S2). ESI-MS m/z: [M – C1]+ calcd. for CoC34H50N4O4, 637.72 (100%); found 637 (100%) (Figure S3); Anal. Calc. for CoC34H50N4O4Cl (%) C, 60.66; H, 7.49; N, 8.32. Found: C, 60.46; H, 7.34; N, 8.56%. ΛM = 87 Ω–1 mol–1 cm2 (electrolyte 1:1 in methanol).
Crystal Structure Refinement and Biological Studies
The details about crystal structure refinement and all of the biological studies such as DNA binding, DNA cleavage, antimicrobial, photocytotoxicity, semiquantitative gene expression, and in vivo toxicity assay are given in the Supporting Information.
Acknowledgments
The authors gratefully acknowledge the Indian Council of Medical Research (ICMR) New Delhi Vide Project No. 52/1/2018/BMS for financial assistance. The authors gratefully acknowledge the financial support by the RUSA-Phase 2.0 Grant (Vide Letter No. F.24-51/2014-U (TNMulti-Gen)), Government of India, and DST-PURSE-II New Delhi to the Department of Industrial Chemistry, Alagappa University, Karaikudi-3, Tamil Nadu.
Supporting Information Available
The Supporting Information is available free of charge at https://pubs.acs.org/doi/10.1021/acsomega.1c05306.
Author Contributions
The manuscript was written through the contribution of all authors. All authors have approved the final version of the manuscript.
The authors declare no competing financial interest.
Supplementary Material
References
- Ware D. C.; Denny W. A.; Clark G. R. [N,N-Bis(2-Chloroethyl)-1,2- Ethanediamine-N,N′]Bis(3-Methyl-2,4-Pentanedionato-O,O′)Cobalt(III) Perchlorate: A Potential Hypoxia Selective Anticancer Agent. Acta Crystallogr., Sect. C 1997, 53, 1058–1059. 10.1107/S0108270197004186. [DOI] [Google Scholar]
- Ware D. C.; Siim B. G.; Robinson K. G.; Denny W. A.; Brothers P. J.; Clark G. R. Synthesis and characterization of aziridine complexes of cobalt (III) and chromium (III) designed as hypoxia-selective cytotoxins. X-ray crystal structure of trans-[Co(Az)4(NO2)2]Br. 2H2O. LiBr. Inorg. Chem. 1991, 30, 3750–3757. 10.1021/ic00019a036. [DOI] [Google Scholar]
- Gupta S. K.; Hitchcock P. B.; Kushwah Y. S.; Argal G. S. Synthesis, Structure and DNA Binding Studies of a Mononuclear Cobalt(III) Complex with a NNO Donor Schiff Base Derived from 4-Methyl-2,6-Dibenzoylphenol and Ethane-1,2-Diamine. Inorg. Chim. Acta 2007, 360, 2145–2152. 10.1016/j.ica.2007.01.007. [DOI] [Google Scholar]
- Schwartz J. A.; Lium E. K.; Silverstein S. J. Herpes Simplex Virus Type 1 Entry Is Inhibited by the Cobalt Chelate Complex CTC-96. J. Virol. 2001, 75, 4117–4128. 10.1128/JVI.75.9.4117-4128.2001. [DOI] [PMC free article] [PubMed] [Google Scholar]
- Indumathy R.; Radhika S.; Kanthimathi M.; Weyhermuller T.; Unni Nair B. Cobalt Complexes of Terpyridine Ligand: Crystal Structure and Photocleavage of DNA. J. Inorg. Biochem. 2007, 101, 434–443. 10.1016/j.jinorgbio.2006.11.002. [DOI] [PubMed] [Google Scholar]
- Ramu V.; Gautam S.; Kondaiah P.; Chakravarty A. R. Diplatinum(II) Catecholate of Photoactive Boron-Dipyrromethene for Lysosome-Targeted Photodynamic Therapy in Red Light. Inorg. Chem. 2019, 58, 9067–9075. 10.1021/acs.inorgchem.9b00567. [DOI] [PubMed] [Google Scholar]
- Sudhamani C. N.; Bhojya Naik H. S.; Sangeetha Gowda K. R.; Girija D.; Giridhar M. DNA Binding, Prominent Photonuclease Activity and Antibacterial PDT of Cobalt(II) Complexes of Phenanthroline Based Photosensitizers. Nucleosides, Nucleotides Nucleic Acids 2018, 37, 546–562. 10.1080/15257770.2018.1508691. [DOI] [PubMed] [Google Scholar]
- Ikeda R.; Soneta Y.; Miyamura K. First X-Ray Structure of a Trans-IV of Ni Complex of Tetra-Azamacrocycles with Pendent Groups, 1,8-Bis(N,N- Dimethylcarbamoylethyl)-1,5,8,12-Tetramethyl-1,4,8,11-Tetraazacyclotetra-Decane. Inorg. Chem. Commun. 2007, 10, 590–592. 10.1016/j.inoche.2007.02.007. [DOI] [Google Scholar]
- Bosnich B.; Poon C. K.; Tobe M. L. Complexes of cobalt (III) with a cyclic tetradentate secondary amine. Inorg. Chem. 1965, 4, 1102–1108. 10.1021/ic50030a003. [DOI] [Google Scholar]
- Geary W. J. The use of conductivity measurements in organic solvents for the characterisation of coordination compounds. Coord. Chem. Rev. 1971, 7, 81–122. 10.1016/S0010-8545(00)80009-0. [DOI] [Google Scholar]
- Shakya R.; Imbert C.; Hratchian H. P.; Lanznaster M.; Heeg M. J.; Mc Garvey B. R.; Allard M.; Schlegel H. B.; Verani C. N. Structural, Spectroscopic, and Electrochemical Behavior of Trans-Phenolato Cobalt(Iii) Complexes of Asymmetric NN′O Ligands as Archetypes for Metallomesogens. Dalton Trans. 2006, 125, 2517–2525. 10.1039/B514190G. [DOI] [PubMed] [Google Scholar]
- Funston A. M.; Ghiggino K. P.; Grannas M. J.; David McFadyen W.; Tregloan P. A. Synthesis, Structural Studies and Photochemistry of Cobalt(Iii) Complexes of Anthracenylcyclam Macrocycles. Dalton Trans. 2003, 170, 3704–3712. 10.1039/B305773A. [DOI] [Google Scholar]
- Sengottuvelan N.; Saravanakumar D.; Narayanan V.; Kandaswamy M.; Chinnakali K.; Senthilkumar G. Synthesis and Characterization of New Trans N,N′-Disubstituted Macrocyclic “Tet a” Ligands and Their Copper(II) and Nickel(II) Complexes: Structural, Electrochemical, Magnetic, and Catalytic Studies. Bull. Chem. Soc. Jpn. 2004, 77, 1153–1159. 10.1246/bcsj.77.1153. [DOI] [Google Scholar]
- Hadlington T. J.; Kostenko A.; Driess M. Cycloaddition Chemistry of a Silylene-Nickel Complex toward Organic π-Systems: From Reversibility to C–H Activation. Chem. – Eur. J. 2020, 26, 1958–1962. 10.1002/chem.202000009. [DOI] [PMC free article] [PubMed] [Google Scholar]
- Baker E. N.; Hubbard R. E. Hydrogen Bonding in Globular Proteins. Prog. Biophys. Mol. Biol. 1984, 44, 97–179. 10.1016/0079-6107(84)90007-5. [DOI] [PubMed] [Google Scholar]
- Ballesteros J. A.; Deupi X.; Olivella M.; Haaksma E. E. J.; Pardo L. Serine and Threonine Residues Bend α-Helices in the X1= g- Conformation. Biophys. J. 2000, 79, 2754–2760. 10.1016/S0006-3495(00)76514-3. [DOI] [PMC free article] [PubMed] [Google Scholar]
- Gray T. M.; Matthews B. W. Intrahelical Hydrogen Bonding of Serine, Threonine and Cysteine Residues within α-Helices and Its Relevance to Membrane-Bound Proteins. J. Mol. Biol. 1984, 175, 75–81. 10.1016/0022-2836(84)90446-7. [DOI] [PubMed] [Google Scholar]
- Thomas S. P.; Spackman P. R.; Jayatilaka D.; Spackman M. A. Accurate Lattice Energies for Molecular Crystals from Experimental Crystal Structures. J. Chem. Theory Comput. 2018, 14, 1614–1623. 10.1021/acs.jctc.7b01200. [DOI] [PubMed] [Google Scholar]
- Chai L. Q.; Zhou L.; Zhang H.; Mao K. H.; Zhang H. S. Antimicrobial Activities of Self-Assembled Copper(Ii), Nickel(Ii), and Cobalt(Iii) Complexes Combined with Crystallographic, Spectroscopic, DFT Calculations and Hirshfeld Surfaces Analyses. New J. Chem. 2019, 43, 12417–12430. 10.1039/C9NJ01920K. [DOI] [Google Scholar]
- Gupta S. K.; Hitchcock P. B.; Kushwah Y. S. The Crystal Structure of 4-Methyl-2,6-Dibenzoylphenol and Its Conversion into a Mononuclear Cobalt(III) Complex by Treatment with Cobalt(II) Chloride and Propane-1,3-Diamine. Polyhedron 2002, 21, 1787–1793. 10.1016/S0277-5387(02)01044-6. [DOI] [Google Scholar]
- Sen N.; Butcher R. J.; Jasinski J. P.; Gupta S. K. A Novel Single-Pot Synthesis of Dinuclear and Mononuclear Copper(II) Complexes with Sterically Demanding Schiff Bases: Structural, Spectral, Magnetic, Electrochemical, DNA Binding and Theoretical Investigation. J. Mol. Struct. 2021, 1231, 129955 10.1016/j.molstruc.2021.129955. [DOI] [Google Scholar]
- Herebian D.; Sheldrick W. S. Synthesis and DNA Binding Properties of Bioorganometallic (H5-Pentamethylcyclopentadienyl)Iridium(III) Complexes of the Type [(H5-C5Me5)Ir(Aa)(Dppz)]N+ (Dppz = Dipyrido[3,2-a:2′,3′-c]-Phenazine, n = 1-3), with S-Coordinated Amino Acids (Aa) or Peptides. J. Chem. Soc., Dalton Trans. 2002, 6, 966–974. 10.1039/b107656f. [DOI] [Google Scholar]
- Sharma S.; Singh S. K.; Chandra M.; Pandey D. S. DNA-Binding Behavior of Ruthenium(II) Complexes Containing Both Group 15 Donors and 2,2′:6′,2″-Terpyridine. J. Inorg. Biochem. 2005, 99, 458–466. 10.1016/j.jinorgbio.2004.10.021. [DOI] [PubMed] [Google Scholar]
- Wang X. L.; Chao H.; Li H.; Hong X. L.; Liu Y. J.; Tan L. F.; Ji L. N. DNA Interactions of Cobalt(III) Mixed-Polypyridyl Complexes Containing Asymmetric Ligands. J. Inorg. Biochem. 2004, 98, 1143–1150. 10.1016/j.jinorgbio.2004.04.003. [DOI] [PubMed] [Google Scholar]
- Shah A.; Qureshi R.; Khan A. M.; Khera R. A.; Ansari F. L. Electrochemical Behavior of 1-Ferrocenyl-3-Phenyl-2-Propen-1-One on Glassy Carbon Electrode and Evaluation of Its Interaction Parameters with DNA. J. Braz. Chem. Soc. 2010, 21, 447–451. 10.1590/S0103-50532010000300008. [DOI] [Google Scholar]
- Qu F.; Li N.; Jiang Y. Electrochemical Studies of CuTMAP Interaction with DNA and Determination of DNA. Microchem. J. 1998, 58, 39–51. 10.1006/mchj.1997.1511. [DOI] [Google Scholar]
- Carter M. T.; Rodriguez M.; Bard A. J. Voltammetric Studies of the Interaction of Metal Chelates. J. Am. Chem. Soc. 1989, 111, 8901–8911. 10.1021/ja00206a020. [DOI] [Google Scholar]
- Ramesh G.; Daravath S.; Ganji N.; Rambabu A.; Venkateswarlu K.; Shivaraj S. Facile Synthesis, Structural Characterization, DNA Binding, Incision Evaluation, Antioxidant and Antimicrobial Activity Studies of Cobalt(II), Nickle(II) and Copper(II) Complexes of 3-Amino-5-(4-Fluorophenyl)Isoxazole Derivatives. J. Mol. Struct. 2020, 1202, 127338 10.1016/j.molstruc.2019.127338. [DOI] [Google Scholar]
- Aslanoglu M.; Isaac C. J.; Houlton A.; Horrocks B. R. Voltammetric Measurements of the Interaction of Metal Complexes with Nucleic Acids. Analyst 2000, 125, 1791–1798. 10.1039/b005440m. [DOI] [PubMed] [Google Scholar]
- Randles J. E. B. A Cathode Ray Polarograph.The Current-Voltage Curves. Trans. Faraday Soc. 1948, 44, 327–338. 10.1039/TF9484400327. [DOI] [Google Scholar]
- Xu Z.; Bai G.; Dong C. Studies on Interaction of an Intramolecular Charge Transfer Fluorescence Probe: 4′-Dimethylamino-2,5-Dihydroxychalcone with DNA. Bioorg. Med. Chem. 2005, 13, 5694–5699. 10.1016/j.bmc.2005.06.023. [DOI] [PubMed] [Google Scholar]
- Daskalakis M.; Nguyen T. T.; Nguyen C.; Guldberg P.; Köhler G.; Wijermans P.; Jones P. A.; Lübbert M. Demethylation of a Hypermethylated P15/INK4B Gene in Patients with Myelodysplastic Syndrome by 5-Aza-2′-Deoxycytidine (Decitabine) Treatment. Blood 2002, 100, 2957–2964. 10.1182/blood.V100.8.2957. [DOI] [PubMed] [Google Scholar]
- Shehatta I. S.; Ibrahim M. S. Binding of Anti-Inflammatory Drug Indomethacin with Cyclodextrin and DNA: Solubility, Spectroscopic, and Voltammetric Studies. Can. J. Chem. 2001, 79, 1431–1438. 10.1139/v01-105. [DOI] [Google Scholar]
- Banerjee S.; Ghorai P.; Brandão P.; Ghosh D.; Bhuiya S.; Chattopadhyay D.; Das S.; Saha A. Syntheses, Crystal Structures, DNA Binding, DNA Cleavage, Molecular Docking and DFT Study of Cu(II) Complexes Involving N2O4 Donor Azo Schiff Base Ligands. New J. Chem. 2018, 42, 246–259. 10.1039/C7NJ03293E. [DOI] [Google Scholar]
- González-Álvarez M.; Alzuet G.; Borrás J.; Pitié M.; Meunier B. DNA Cleavage Studies of Mononuclear and Dinuclear Copper(II) Complexes with Benzothiazolesulfonamide Ligands. J. Biol. Inorg. Chem. 2003, 8, 644–652. 10.1007/s00775-003-0463-6. [DOI] [PubMed] [Google Scholar]
- Raman N.; Jeyamurugan R.; Sudharsan S.; Karuppasamy K.; Mitu L. Metal Based Pharmacologically Active Agents: Synthesis, Structural Elucidation, DNA Interaction, in Vitro Antimicrobial and in Vitro Cytotoxic Screening of Copper(II) and Zinc(II) Complexes Derived from Amino Acid Based Pyrazolone Derivatives. Arab. J. Chem. 2013, 6, 235–247. 10.1016/j.arabjc.2012.04.010. [DOI] [Google Scholar]
- Filipović N. R.; Elshaflu H.; Grubišić S.; Jovanović L. S.; Rodić M.; Novaković I.; Malešević A.; Djordjević I. S.; Li H.; Šojić N.; Marinković A.; Todorović T. R. Co(III) Complexes of (1,3-Selenazol-2-Yl)Hydrazones and Their Sulphur Analogues. Dalton Trans. 2017, 46, 2910–2924. 10.1039/C6DT04785H. [DOI] [PubMed] [Google Scholar]
- Icsel C.; Yilmaz V. T.; Aydinlik Ş.; Aygun M. New Manganese(II), Iron(II), Cobalt(II), Nickel(II) and Copper(II) Saccharinate Complexes of 2,6-Bis(2-Benzimidazolyl)Pyridine as Potential Anticancer Agents. Eur. J. Med. Chem. 2020, 202, 112535 10.1016/j.ejmech.2020.112535. [DOI] [PubMed] [Google Scholar]
- Vignesh G.; Senthilkumar R.; Paul P.; Periasamy V. S.; Akbarsha M. A.; Arunachalam S. Protein Binding and Biological Evaluation of a Polymer-Anchored Cobalt(Iii) Complex Containing a 2,2′-Bipyridine Ligand. RSC Adv. 2014, 4, 57483–57492. 10.1039/C4RA10377G. [DOI] [Google Scholar]
- Pu X.; Storr S. J.; Zhang Y.; Rakha E. A.; Green A. R.; Ellis I. O.; Martin S. G. Caspase-3 and Caspase-8 Expression in Breast Cancer: Caspase-3 Is Associated with Survival. Apoptosis 2017, 22, 357–368. 10.1007/s10495-016-1323-5. [DOI] [PMC free article] [PubMed] [Google Scholar]
- Uma V.; Kanthimathi M.; Weyhermuller T.; Nair B. U. Oxidative DNA Cleavage Mediated by a New Copper (II) Terpyridine Complex: Crystal Structure and DNA Binding Studies. J. Inorg. Biochem. 2005, 99, 2299–2307. 10.1016/j.jinorgbio.2005.08.011. [DOI] [PubMed] [Google Scholar]
- Martin S. J. Destabilizing influences in apoptosis: sowing the seeds of IAP destruction. Cell 2002, 109, 793–796. 10.1016/S0092-8674(02)00802-4. [DOI] [PubMed] [Google Scholar]
- Horvitz H. R. Genetic Control of Programmed Cell Death in C. elegans. Sci. World J. 2001, 1, 137. 10.1100/tsw.2001.235. [DOI] [PMC free article] [PubMed] [Google Scholar]
- Patra S.; Bhol C. S.; Panigrahi D. P.; Praharaj P. P.; Pradhan B.; Jena M.; Bhutia S. K. Gamma Irradiation Promotes Chemo-Sensitization Potential of Gallic Acid through Attenuation of Autophagic Flux to Trigger Apoptosis in an NRF2 Inactivation Signalling Pathway. Free Radical Biol. Med. 2020, 160, 111–124. 10.1016/j.freeradbiomed.2020.06.022. [DOI] [PubMed] [Google Scholar]
- Lahiri D.; Roy S.; Saha S.; Majumdar R.; Dighe R. R.; Chakravarty A. R. Anaerobic DNA Cleavage Activity in Red Light and Photocytotoxicity of (Pyridine- 2-Thiol)Cobalt(Iii) Complexes of Phenanthroline Bases. Dalton Trans. 2010, 39, 1807–1816. 10.1039/b917860k. [DOI] [PubMed] [Google Scholar]
- Toshima K.; Takano R.; Ozawa T.; Matsumura S. Molecular Design and Evaluation of Quinoxaline-Carbohydrate Hybrids as Novel and Efficient Photo- Induced GG-Selective DNA Cleaving Agents. Chem. Commun. 2002, 2, 212–213. 10.1039/b107829c. [DOI] [PubMed] [Google Scholar]
- Garai A.; Pant I.; Banerjee S.; Banik B.; Kondaiah P.; Chakravarty A. R. Photorelease and Cellular Delivery of Mitocurcumin from Its Cytotoxic Cobalt(III) Complex in Visible Light. Inorg. Chem. 2016, 55, 6027–6035. 10.1021/acs.inorgchem.6b00554. [DOI] [PubMed] [Google Scholar]
- Shaibu R. O.; Watkins G. M. Synthesis, spectral characterization, and biological activities of Cobalt (II) complexes of Schiff bases derived from o-vanillin and p- vanillin with 3-aminopyridine. IFE J. Sci. 2019, 21, 27–38. 10.4314/ijs.v21i1.3. [DOI] [Google Scholar]
- Lupaşcu G.; Pahontu E.; Shova S.; Bărbuceanu ŞF.; Badea M.; Paraschivescu C.; Neamtu J.; Dinu M.; Ancuceanu R. V.; Drăgănescu D.; Dinu-Pîrvu C. E. Co(II), Cu(II), Mn(II), Ni (II), Pd (II), and Pt (II) complexes of bidentate Schiff base ligand: Synthesis, crystal structure, and acute toxicity evaluation. Appl. Organomet. Chem. 2021, 35, e6149 10.1002/aoc.6149. [DOI] [Google Scholar]
- Filipović N. R.; Elshaflu H.; Grubišić S.; Jovanović L. S.; Rodić M.; Novaković I.; Malešević A.; Djordjević I. S.; Li H.; Šojić N.; Marinković A.; et al. Co(III) complexes of (1, 3-selenazol-2-yl) hydrazones and their sulphur analogues. Dalton Trans. 2017, 46, 2910–2924. 10.1039/C6DT04785H. [DOI] [PubMed] [Google Scholar]
- Borkowski L. A.; Cahill C. L. A Novel Uranium-Containing Coordination Polymer: Poly[[Aqua(Benzene-1,3,5- Tricarboxylato)Dioxouranium(VI)] Monohydrate]. Acta Crystallogr., Sect. E 2004, 60, m198–m200. 10.1107/S1600536804000765. [DOI] [Google Scholar]
Associated Data
This section collects any data citations, data availability statements, or supplementary materials included in this article.