Abstract
A combined experimental and theoretical study of the electron donor 4-dimethylaminopyridine (4-DMAP) with the electron acceptor 2, 3-dichloro-5, 6-dicyano-p-benzoquinone (DDQ) has been made in acetonitrile (ACN) and methanol (MeOH) media at room temperature. The stoichiometry proportion of the charge transfer (CT) complex was determined using Job’s and photometric titration methods and found to be 1:1. The association constant (KCT), molar absorptivity (ε), and spectroscopic physical parameters were used to know the stability of the CT complex. The CT complex shows maximum stability in a high-polar solvent (ACN) compared to a less-polar solvent (MeOH). The prepared complex was characterized by Fourier transform infrared, NMR, powder X-ray diffraction, and scanning electron microscopy–energy-dispersive X-ray analysis. The nature of DNA binding ability of the complex was probed using UV–visible spectroscopy, and the binding mode of the CT complex is intercalative. The intrinsic binding constant (Kb) value is 1.8 × 10⁶ M–1. It reveals a primary indication for developing a pharmaceutical drug in the future due to its high binding affinity with the CT complex. The theoretical study was carried out by density functional theory (DFT), and the basis set is wB97XD/6-31G(d,p), with gas-phase and PCM analysis, which supports experimental results. Natural atomic charges, state dipole moments, electron density difference maps, reactivity parameters, and FMO surfaces were also evaluated. The MEP maps indicate the electrophilic nature of DDQ and the nucleophilic nature of 4-DMAP. The electronic spectrum computed using time-dependent DFT (TD-DFT) via a polarizable continuum salvation approach, PCM/TD-DFT, along with natural transition orbital analysis is fully correlated with the experimental outcomes.
Introduction
The molecular interactions between electron-deficient and electron-rich molecules are related to the formation of intensity-colored charge transfer (CT) complexes, which absorb radiation within the visible region.1 The term charge transfer phenomenon was first introduced by Mulliken2,3 and was discussed by Foster.4 The CT complexes are widely utilized in a large number of applications including heterogeneous catalysis,5 surface chemistry,6 photocatalysis,7 gas sensing,8 oil–water separation,9 and so forth. Moreover, DNA binding studies of the complex are one among the foremost important aspects in biological investigation with various sorts of drugs, proteins, and enzymes.10 UV–visible spectroscopy is one among the foremost common techniques used to examine the binding mode between the CT complex and DNA.11 The DNA interaction is vital for understanding the molecular mechanism of CTC action. Consequently, an understanding of how these tiny molecules bind to DNA is going to be helpful for the development of new drugs, diagnostic probes, and reactive agents. Density functional theory (DFT) was found to be an efficient tool within the study of the association between structural and spectral properties.12,13 Moreover, time-dependent DFT (TD-DFT) has been used to calculate the electronic absorption spectra of CT complexes.14,15
Nitrogen-containing heterocyclic compounds are of interest as electron donors since they will function as n and π-donors. Amino pyridines are bioactive N-heterocyclic amines, which increase the strength of the nerve signal by blocking the voltage-dependent K+ channel.16 They constitute an important group of electron donors, and the study of their CT-interactions can elucidate various medical and pharmacological applications.17 The compound 4-dimethylaminopyridine (4-DMAP) is a pyridine derivative with the chemical formula (CH3)2NC5H4N. This colorless solid is a useful nucleophilic catalyst for a variety of reactions such as esterifications with anhydrides and hydrosilylations. Researchers have worked on the interaction of 4-dimethylaminopyridine (4-DMAP) with TCNE, TCNQ, and TBCHD.18 On the other hand, the benzoquinone derivative of 2,3-dichloro-5,6-dicyano-p-benzoquinone (DDQ) is a famous acceptor in chemical synthesis. It is used as a mild oxidizing agent in organic chemistry and has been found to have extraordinary effectiveness as a dehydrogenate.19 It also produces stable, free ion pair complexes with many donors.20 In spite of the abovementioned pharmaceutical and biological importance of these compounds, we are pleased to report on the formation of a new CT complex of 4-DMAP and DDQ in acetonitrile (ACN) (CH3CN) and methanol (CH3OH), studied with a UV–visible spectrophotometer.
The first aspect of the present work was to investigate the interaction between 4-DMAP as a donor and the DDQ as an electron acceptor in ACN and methanol (MeOH). The properties of the CT complex [(4-DMAP)/(DDQ)] are investigated by electronic spectra through computing the molar ratio, formation constant, molar extinction coefficients, charge transfer energy, and spectroscopic properties such as ionization energy (ID), dissociation energy (W), resonance energy (RN), and oscillator strength (f) in the solution state. Herein, we report the investigation of DNA binding to a new CT complex [(4-DMAP/DDQ)] examined by UV–visible spectroscopy. The solid complex was synthesized and characterized by Fourier transform infrared (FT-IR) and 1H NMR spectroscopy. The second aspect of this work aims to provide the relevant Supporting Information by applying DFT and TD-DFT analysis. The theoretical UV–visible and FT-IR spectra analyzed using TD-DFT associated with the polarized continuum model (PCM) were compared with those obtained experimentally.
Results and Discussion
Observation of the CT Band
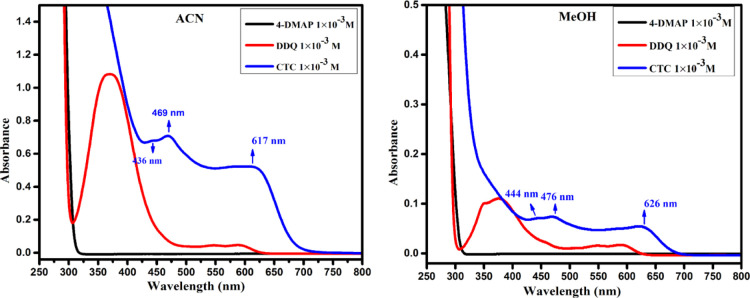
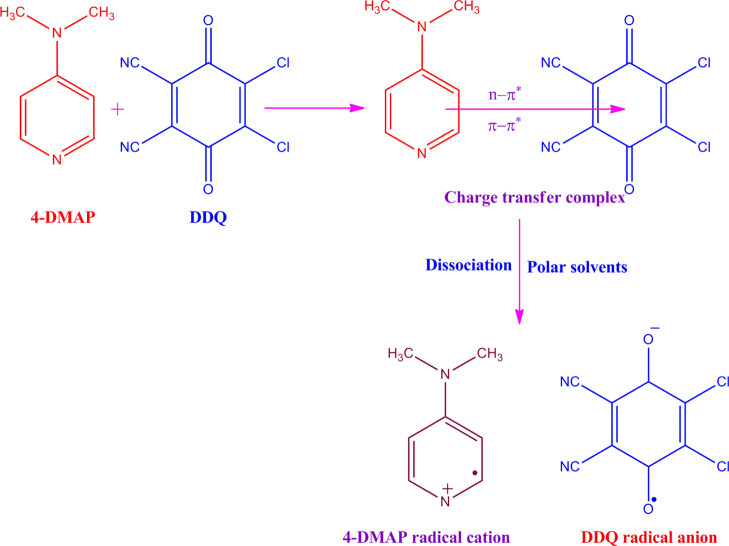
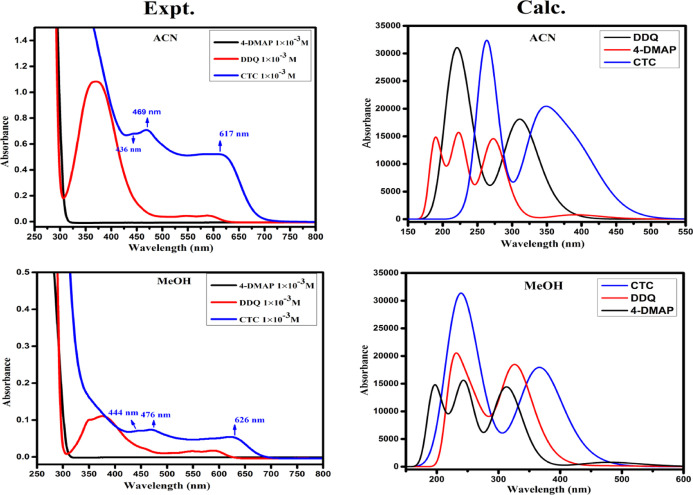
UV visible spectra of the DDQ acceptor 1 × 10⁻³ M (pale yellow), 4-DMAP donor 1 × 10⁻³ M (colorless), and the formed CT complex (reddish brown) in MeCN and MeOH solvent were observed in the area of 250–800 nm (25 °C) and are displayed in Figure 1. As can be shown in Figure 1, the mixture spectrum is absolutely different from that of individual donor and acceptor ones, confirming the CT complex structure. The complex spectrum included multicharge transfer bands in both polar solvents ACN and MeOH at 617, 469, and 436 and 626, 476, and 444 nm, respectively, and the longest wavelength peak was considered as the CT peak.21 In the time study of the CT complex in can, the bands at 617 and 436 nm remain constant with time, but a band at 469 nm disappeared with time, as shown in Figure S1. These multicharge transfer transitions take place from more than one closely located higher occupied molecular orbital of the donor to the higher unoccupied molecular orbital(s) of the acceptor.22 The instantaneous production of constant reddish-brown color is mainly recognized as the formation of a radical anion of DDQ resulting in the electron transfer from 4-DMAP to DDQ (Scheme 1).
Figure 1.
Electronic spectra of 4-DMAP, DDQ, and CTC in ACN and MeOH.
Scheme 1. Mechanism of the 4-DMAP–DDQ Complex Reaction in the Ground State.
Physical Composition of the CT Complex
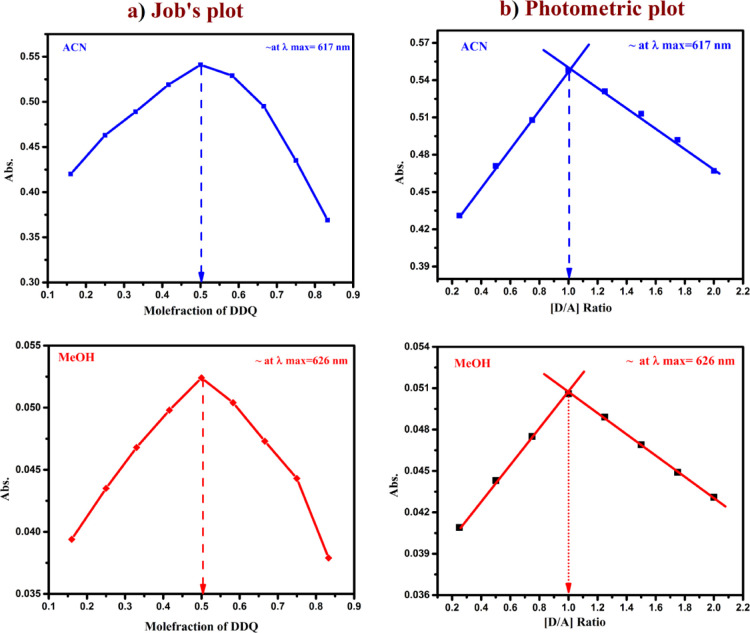
The molecular composition of the CT complex was determined by applying Job’s continuous variations at 617, and 626 nm23 in both ACN and MeOH medium shown in (Figure 2a). Where maximum absorbance achieved at 0.5 mol fraction indicating 1:1 [(4-DMAP)/(DDQ)] stoichiometry for the complex. Similar results were obtained when applying Job’s method at 436 and 444 nm in ACN and MeOH solvents. The (Figure 2b) represents photometric titration plots in both polar solvents.24 Here, the results from both ACN and MeOH indicates the molar ratio of [(4-DMAP)/(DDQ)] complex is 1:1.
Figure 2.
(a) Job’s plot, (b) spectrophotometric plot of CT complex in ACN and MeOH.
Association Constant (KCT), Molar Absorptivity (εCT), and Energy
Based on spectral data in (Table 1), the association constant KCT (L mol–1) and the molar absorptivity ε (L mol–1) of the [(4-DMAP)/(DDQ)] complex were calculated using the following Benesi-Hildebrand25 at room temperature.
| 1 |
Table 1. Benesi–Hildebrand Data for the 1:1 CT Complex at 25 °C.
| Ca | Cd | A | CaCd/A | Ca + Cd | (CaCd/A) × 10–6 | (Ca + Cd) × 103 |
|---|---|---|---|---|---|---|
| ACN 25 °C | ||||||
| 0.001 | 0.005 | 0.791 | 6.32 × 10⁻⁶ | 0.006 | 6.32 | 6 |
| 0.001 | 0.0045 | 0.763 | 5.89 × 10⁻⁶ | 0.0055 | 5.89 | 5.5 |
| 0.001 | 0.004 | 0.716 | 5.58 × 10⁻⁶ | 0.005 | 5.58 | 5 |
| 0.001 | 0.0035 | 0.699 | 5.00 × 10⁻⁶ | 0.0045 | 5 | 4.5 |
| 0.001 | 0.003 | 0.665 | 4.51 × 10⁻⁶ | 0.004 | 4.51 | 4 |
| 0.001 | 0.0025 | 0.648 | 3.85 × 10⁻⁶ | 0.0035 | 3.85 | 3.5 |
| 0.001 | 0.002 | 0.618 | 3.23 × 10⁻⁶ | 0.003 | 3.23 | 3 |
| 0.001 | 0.001 | 0.489 | 2.04 × 10⁻⁶ | 0.002 | 2.04 | 2 |
| MeOH 25 °C | ||||||
| 0.001 | 0.005 | 0.124 | 4.02 × 10⁻⁵ | 0.006 | 4.02 | 6 |
| 0.001 | 0.0045 | 0.120 | 3.7 × 10⁻⁵ | 0.0055 | 3.7 | 5.5 |
| 0.001 | 0.004 | 0.115 | 3.4 × 10⁻⁵ | 0.005 | 3.4 | 5 |
| 0.001 | 0.0035 | 0.110 | 3.0 × 10⁻⁵ | 0.0045 | 3.0 | 4.5 |
| 0.001 | 0.003 | 0.104 | 2.88 × 10⁻⁵ | 0.004 | 2.88 | 4 |
| 0.001 | 0.0025 | 0.098 | 2.55 × 10⁻⁵ | 0.0035 | 2.55 | 3.5 |
| 0.001 | 0.002 | 0.090 | 2.22 × 10⁻⁵ | 0.003 | 2.22 | 3 |
| 0.001 | 0.0015 | 0.085 | 1.76 × 10⁻⁵ | 0.0025 | 1.76 | 2.5 |
| 0.001 | 0.001 | 0.080 | 1.25 × 10⁻⁵ | 0.002 | 1.25 | 2 |
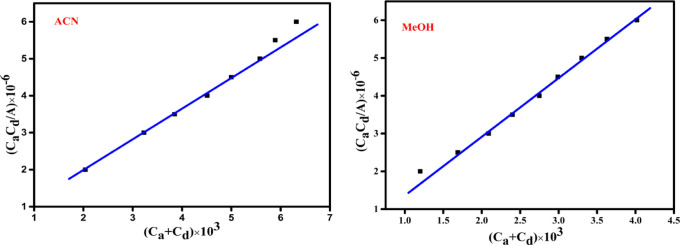
In eq (1), Cd and Ca are the primary concentrations of the 4-DMAP (varied) and DDQ (fixed) respectively, and A is the absorbance of the CT complex at 617, 626 nm in ACN and MeOH. Plotting the values of CaCd × 10–6 against (Ca + Cd) a straight line was obtained with a correlation coefficient (R) in ACN and MeOH was R = 0.9913 and R = 0.9941, supporting the formation of a 1:1 complex shown in (Figure 3). The data of stability constant, molar absorptivity, and wavelength values depicted in (Table 2). The KCT value of CT complex in ACN (5.8 × 10⁴ L mol–1) slightly higher than KCT of (4.49 × 10⁴ L mol–1) MeOH solvent. The high value of the stability constant suggest that the formation of CT complex with high stability. The high values of KCT, ε are pointed to the more donating power of 4-DMAP, high electron affinity of DDQ (∼1.9 eV) and high electric permittivity of ACN solvent.
Figure 3.
Benesi–Hildebrand plots at room temperature.
Table 2. Formation Constants, Molecular Extinction Coefficients, and Other Physical Parameters of the CT Complex.
| solvent | λmax (nm) | KCT × 102 (L mol–1) | εCT × 102 (L mol–1 cm–1) | –ΔG° (kJ/mo) | ECT (eV) | W (eV) | ID (eV) | f | RN |
|---|---|---|---|---|---|---|---|---|---|
| ACN | 617 | 5.88 | 10.91 | –27.20 | 2.01 | 4.31 | 8.22 | 6.07 | 0.574 |
| MeOH | 626 | 4.49 | 6.74 | –26.53 | 1.98 | 4.30 | 8.18 | 2.88 | 0.565 |
The energy (ECT) of the donor–acceptor interaction was calculated using the following equation derived by Briegleb and Angew.26
| 2 |
Determination of Physical Parameters
From electronic spectral studies of the CT complex, several spectroscopic physical parameters were calculated and the obtained results were analyzed.
The ionization energy (IE) of the CT complex was calculated by the subsequent equation in both polar solvents, which were associated with Aloisi and Piganatro.27
| 3 |
In this equation, νCT and ID are the wave number in cm–1 and ionization energy of the donor molecule, respectively.
The resonance energy (RN) of the CT complex was evaluated by following the principle of (Brieglb and Czekalla) in both polar solvents.28
| 4 |
In this equation, εCT is the molar absorptivity of the complex at the maximum of the CT band, νCT is the frequency of the CT band, and RN is the resonance energy of the complex in the ground state, which is a contributing factor to the stability constant of the complex in both polar solvents.
The dissociation energy (W) of the CT complex29 was estimated by the usage of ECT, IE of the donor (ID), and electron affinity (EA) of the acceptor from the subsequent equation in different polarities; these values are depicted in Table 2.
| 5 |
The CT complex has an electronic absorption spectrum in which the oscillator strength (f) is a dimensionless quantity that is utilized for stating the transition probability of CT bands in both polar solvents and can be determined by the following equation.30
| 6 |
In this equation, Δν1/2 is the half-band width and εCT is the molar absorptivity at maximum absorption of the CT band.
The standard Gibbs free energy change of the complex (ΔG°) was evaluated31 from the subsequent equation in both polar solvents.
| 7 |
In this equation, ΔG° is the standard free energy of the CT complex (k J mol–1), R is the gas constant (8.314 J mol–1 K–1), T is the absolute temperature in kelvin (273+ °C), and KCT is the formation constant of the CT complex in ACN and MeOH solvents at room temperature. All physical parameters are mentioned in Table 2.
FT-IR Spectra
The FT-IR absorption spectra of 4DMAP, DDQ, and the [(4-DMAP)/(DDQ)] complex are shown in Figure 4. The important band assignments are depicted in Table 3. The presence of the essential IR bands of the donor and acceptor in the spectrum of the CT complex strongly favors the CT complexation.32 However, the bands of the 4-DMAP and DDQ in this complex reveal small shifts in both band intensities and wave number values from those of the free reactants. The characteristic absorption bands were identified in the infrared spectra of free DDQ at 1651, 2232, 1515, 1165, and 757 cm–1 assigned to υ (C=O), (C≡N), (C=C), (C–C), and (C–Cl) respectively. These absorption band shifts in the complex appeared at 1643, 2205, 1441, 1215, and 741 cm–1. On the other hand, the stretching vibrational frequencies of υ (C=N), (C–N), and (C–N) are recorded at 1537, 1561, and 1269 cm–1 in the complex spectrum relative with 1517, 1596, and 1220 cm–1 for the free 4-DMAP, respectively. All these band shifts clearly show the charge transfer from 4-DMAP to DDQ. The infrared spectra have been calculated using the wb97xd method, and the results (Figure S2) and band intensities are found in Table 3. Close values between calculated and measured infrared data were detected, confirming the validity of the applied method for computing infrared spectra.
Figure 4.
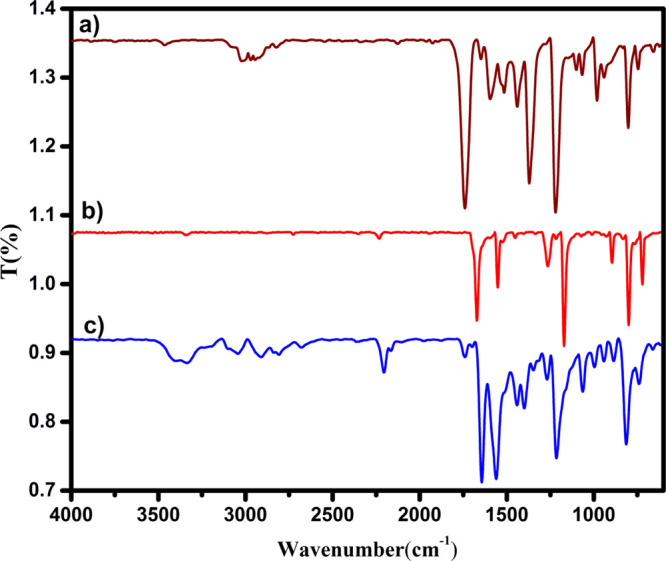
Experimental FT-IR spectra (a) 4-DMAP, (b) DDQ, and (c) CTC.
Table 3. Experimental and Calculated Infrared Frequencies (cm–1) Using the wB97XD Method for the Studied System.
| CTC |
||||
|---|---|---|---|---|
| 4-DMAP | DDQ | exp. | calc. | assignments |
| 3023 | 2910 | 3049 | υ (CH3) aromatic | |
| 3278 | 3043 | 3278 | υ (CH) aliphatic | |
| 1596 | 1561 | 1584 | υ (C=C) | |
| 1160 | 1203 | 1228 | υ (C–C) | |
| 1220 | 1269 | 1302 | υ (C–N) | |
| 1651 | 1643 | 1655 | υ (C=O) | |
| 2232 | 2205 | 2456 | υ (C≡N) | |
| 757 | 741 | 737 | υ (C–Cl) | |
| 1515 | 1441 | 1409 | υ (C=C) | |
| 1165 | 1215 | 1217 | υ (C–C) | |
1H NMR Spectroscopy
The 1H NMR spectrum of the [(4-DMAP)(DDQ)] complex was recorded in DMSO-d6 solvent, which exhibits a signal at δ = 3.0, and it is depicted in Figure S3. The data from 1H NMR were tabulated in Table 4. The NMR spectra of the complex show two doublet signals at δ 8.23 and δ 6.98 ppm, which were assigned to the four aromatic protons of the pyridine ring. The peak observed at δ 2.51 ppm shows a singlet, which is assigned to the six methyl protons of the pyridine ring. The consistence of NMR and IR spectra supports the charge transfer, which is responsible for its high stability.
Table 4. 1H NMR Spectral Data of the CT Complex.
| compound | chemical shift, δ (ppm) | assignments |
|---|---|---|
| 8.23, 8.21 | (d, 2H of the pyridine ring) | |
| [(4-DMAP)(DDQ)] | 6.98 | (d, 2H Ar–H of 4-DMAP) |
| 3.0 | (s, 6H of methyl protons 4-DMAP) | |
| 2.5 | (s, 6H DMSO solvent) |
Determination of the Composition Using Scanning Electron Microscopy
The surface morphology33 and elemental composition of the CT complex [(4-DMAP)/(DDQ)] were studied through scanning electron microscopy (SEM)–energy dispersive X-ray (EDX) analysis. The corresponding results are shown in Figure 5. Needle-shaped microstructures of the product are detectable from the SEM images. The composition of the CT complex formed with the donor and acceptor was confirmed by EDX spectra, which showed C, N, O, and Cl elemental peaks (listed in Table S1).
Figure 5.
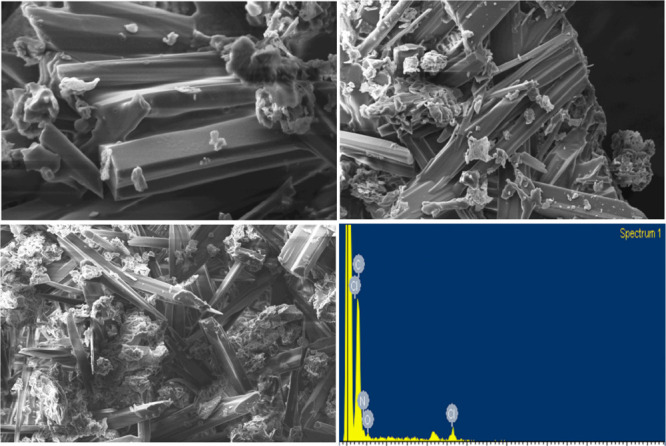
SEM images and EDX spectrum of the CT complex.
Powder X-ray Diffraction Studies of the CT Complex
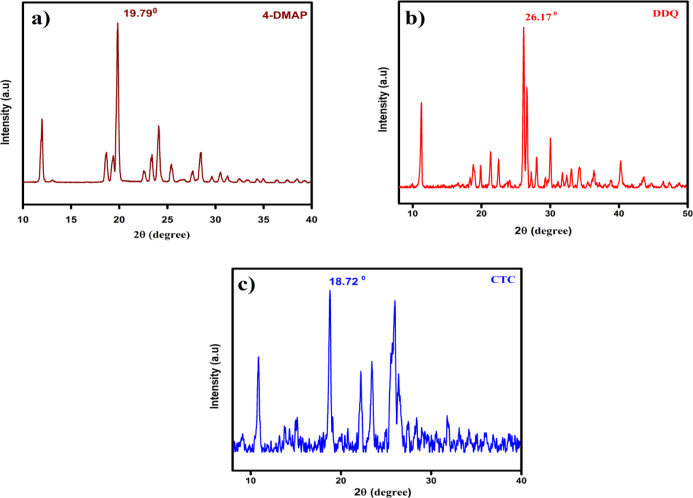
Powder X-ray diffraction (PXRD) is a useful technique to ascertain the purity and composition of the CT complex. Figure 6 shows the PXRD patterns of 4DMAP, DDQ, and the [(4-DMAP)/(DDQ)] complex, whereas Table 5 presents their XRD spectral data. A strong characteristic peak with high intensity was noted at the diffraction angle 2θ of 19.79, 26.17, and 18.72° for 4-DMAP, DDQ, and the [(4-DMAP)/(DDQ)] complex, respectively. The PXRD pattern shows that the material is semicrystaline in nature due to the sharp and well-defined Bragg peaks at specific 2θ angles of the newly synthesized CT complex of 4-DMAP and DDQ. The particle size of the complex was calculated based on the highest intensity line relative to the other lines using the Debye–Scherrer formula34 as follows
| 8 |
where D is the crystalline size in nm, λ is the wavelength of the X-ray used (0.15406 nm), 0.94 is the Scherrer constant, θ is the position of the particular diffraction peak, and β is the full width at half maximum (fwhm) of the particular diffraction peak. The calculated particle sizes of 4-DMAP, DDQ, and the [(4-DMAP)/(DDQ)] complex are 14.68, 4.97, and 14.07 nm, respectively.
Figure 6.
Powder XRD semi-crystalline nature of (a) 4-DMAP, (b) DDQ, and (c) CT complex.
Table 5. Powder XRD Spectral Data for 4-DMAP, DDQ, and the CT Complex.
| compound | Bragg angle (2θ) | fwhm (β) | particle size (nm) |
|---|---|---|---|
| 4-DMAP | 19.82 | 0.2547 | 14.68 |
| DDQ | 26.26 | 0.7171 | 4.97 |
| CTC | 18.76 | 0.2674 | 14.07 |
DNA Interaction Study
In the investigations of CT-DNA, binding analysis of organic compounds through UV absorption spectroscopy is a prominent method. In general, hypochromism with or without a small red or blue shift is associated with the intercalative binding mode between the complex and DNA. After adding the DNA solution to the complex, the binding interaction of the formed complex through DNA helices is defined by changes in absorbance and wavelength.35 The binding affinity was evaluated in this current study by observing the absorbance alteration of the CT complex when the CT-DNA concentration rises and when the CT complex concentration was kept constant. The absorption spectrum of the CT-DNA binding with the CT complex is presented in Figure 7. The spectra reveal a blue shift and are hypochromic, expressing the binding mode of intercalation between the CT-DNA and CT complex. In this spectrum, we observed a decrease in the absorbance with an increase in the concentration of CT-DNA to the CT complex, which confirms the binding mode of the complex with DNA.1 From the absorption, data were analyzed to evaluate the intrinsic binding constant (Kb), which is determined from the following Wolfe–Shimer equation.
| 9 |
Figure 7.
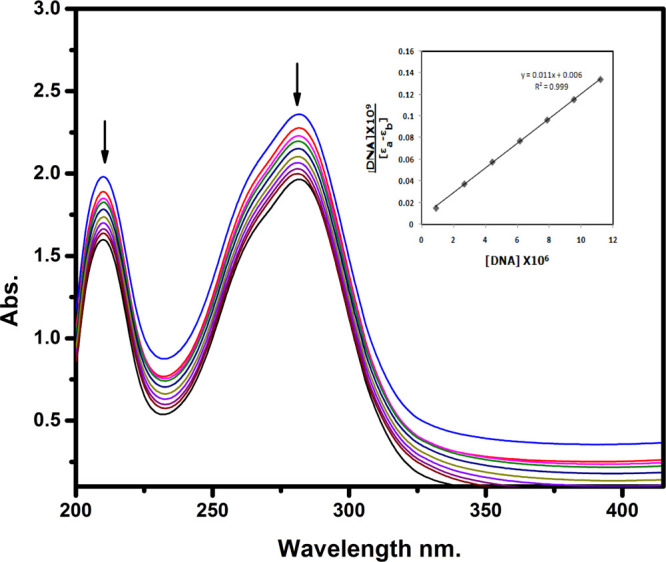
Absorption spectra of 4-DMAP-DDQ in Tris–HCl buffer upon addition of CT-DNA. [Compound] = 25 μM, [DNA] = 0–10 μM DNA concentration.
In this equation, [DNA] is the concentration of CT-DNA, εa is the apparent coefficient, εf and εb correspond to the extinction coefficient of the free and fully bound complex to DNA molecules, respectively, and Kb is the intrinsic binding constant. From the plot of DNA/(εa – εf) vs [DNA], Kb is calculated by the ratio of a slope to the intercept. The ratio of intrinsic binding constant (Kb) values of the complex is 1.8 × 10⁶ M–1. From the abovementioned DNA binding results, it is evident that the complex has planarity and an extended π system, which leads to the probability of DNA intercalation.
Computational Analysis
Bond Lengths and Bond Angles
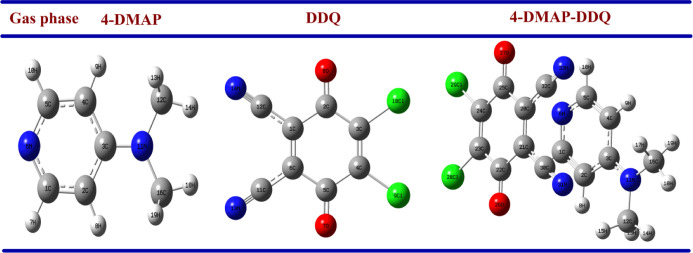
The optimized geometries of 4-DMAP, DDQ, and the 1:1 [(4-DMAP)/(DDQ)] complex with the atomic number in the gas phase and PCM (ACN/methanol) are shown in Figure 8. Their bond length and bond angles are given in the Supporting Information (Tables S2 and S3). Table S2 shows that the C2–O8 and C5–O7 of the DDQ moiety of the complex increase to 1.252, 1.261, and 1.263 Å in the gas phase and PCM relative to 1.241 Å for free DDQ. This result indicates the single bond character of the carbon–oxygen bond in the complex compared with the double bond in the monomer. The cyano group bond lengths of DDQ in complex C1–C12 and C6–C11 increase to 1.435, 1.434, and 1.435 Å in the gas state and PCM relative to 1.42 Å for individual DDQ. On the other hand, the bond lengths of C2–C3 and C3–C4 decrease to 1.417, 1.415, and 1.414 Å in the gas state and PCM in the complex compared with 1.452 Å in 4-DMAP alone. The C1–N6 and C3–N11 bond lengths are decreased, while one of the C3–N11 distances is more decreased than the C1–N6 bond. This reveals that the strength of the charge transfer process is not equivalent. Thus, the planarity of the donor molecule and the withdrawing ability of the C≡N group contribute to the strength of CT, which confirms the n-electron transfer from the highest occupied molecular orbital (HOMO) of 4-DMAP to the π* lowest unoccupied molecular orbital (LUMO) of carbonyl of the DDQ moiety.
Figure 8.
Optimized geometries in the gas phase of 4-DMAP, DDQ, and the CT complex.
The CT complex is further confirmed by the changes in its bond angles compared to the monomers as shown in Table S3. The DDQ free radical anion (Scheme 1) can further give evidence from the increasing bond angles of C1–C2–O8 and C6–C5–O7 to 121 and 121.5° in the complex, respectively, compared with 120.2° in the monomer of DDQ. Moreover, the bond angle of C5–C6–C1 decreases to 120.1°compared with 121° for DDQ. On the other hand, the bond angles between ring carbon atoms decrease in the complex relative to 4-DMAP alone, which confirms the π–π* transition from the HOMO to LUMOs of the CT complex. Similar results were obtained while applying the PCM model observed in Table S3. There is also no solvent effect in the bond angle.
Molecular Electrostatic Potential Surfaces
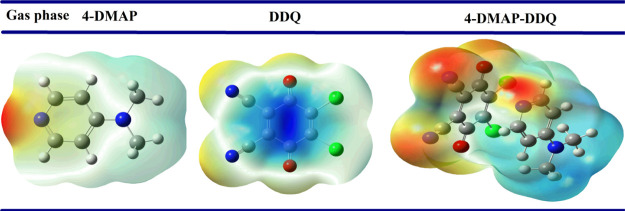
The molecular electrostatic potential (MEP) surfaces36 are the most suited graphical presentations which show electrostatic potential over the surface of a molecule used to identify the electrophilic and nucleophilic centers. The MEP surfaces labeled by different colors where blue and red represent most positive and most negative regions, respectively, while green shows the neutral region. The MEP maps of 4-DMAP, DDQ, and the [(4-DMAP)(DDQ)] complex are depicted in Figure 9 in the gas phase. The acceptor (DDQ) MEP plot is characterized by a positive region (blue), which is located at the center (surface map value of 0.07696 au), considered as an electrophile. The negative region is coming from C=O and C≡N (−0.03126 and −0.03881 au, respectively) groups of DDQ. Regarding the 4-DMAP major negative region (red) located on the N6 and N11 atoms (−0.0706 and −0.0298 au, respectively), it can be considered as an n-donor (nucleophile). After complex formation from the donor to th eacceptor, the C=O, C≡N values are increased and the N11 atom of 4-DMAP decreased to get a positive value. These results suggest the n-electron transfer from N11 of the donor to C=O and C≡N groups of DDQ. The surface map values of the PCM model also gave near results. Hence, ESP map surfaces demonstrate good agreement with the experimental results.
Figure 9.
MEP maps of 4-DMAP, DDQ, and the CT complex in the gas phase.
HOMO–LUMO of the CT Complex
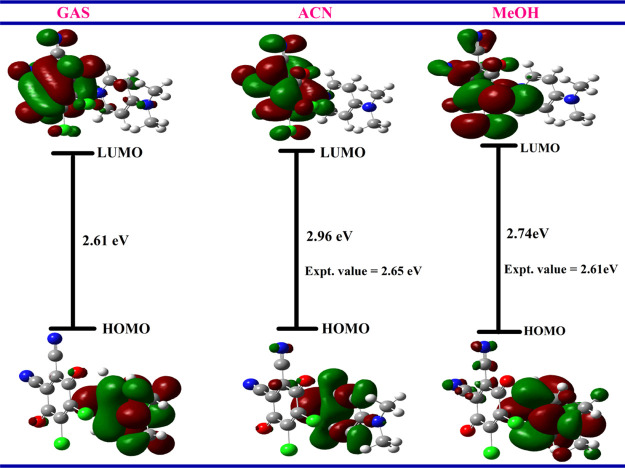
Molecular orbital analysis exhibits that the frontier molecular orbitals are mainly composed of p-atomic orbitals.37 HOMO–LUMO energy (in eV) calculation of the [(4-DMAP)(DDQ)] complex in the ground state obtained by DFT using wB97XD 6-31+G(d,p) (gas phase and PCM) is shown in Figures 10 and S4. From Figure 10, it is seen that the HOMOs are mostly distributed on 4-DMAP, while LUMOs are mainly localized on the DDQ moiety. The HOMO is localized on the donor, mainly on the N6 and N11 atomic orbitals. Thus, one can conclude that the n-electrons are localized in the HOMO of 4-DMAP. The other molecular orbitals are localized on the p-atomic orbitals of the pyridine moiety. The n, π-molecular orbitals are detected as HOMOs and π* molecular orbitals are LUMOs; therefore, the charge transfer can be assigned as n–π* and π–π*.
Figure 10.
HOMO–LUMO energy gaps of the CT complex in the gas phase, ACN, and methanol.
Natural Atomic Charges
The natural atomic charges (through NPA analysis) of 4-DMAP, DDQ, and the [(4-DMAP)(DDQ)] complex in the gas state (Figure S5) and PCM (ACN/methanol) are depicted in Table S4. From Table S4, it is seen that the atomic charges of O7, O8, N14, and N13 increased in the complex relative to the free DDQ moiety in both gas and PCM phases. Concerning the donor 4-DMAP, the atomic charges of N11 decreased in the complex compared with free 4-DMAP. These results clearly show that the HOMO–LUMOs are localized on the given atomic centers of the CT complex in both gas and PCM phases, supporting the n–π* transition.
Reactivity Descriptors
Various reactivity descriptors such as ionization potential (Ip), electron affinity (A), chemical potential (μ), hardness (η), electrophilicity index (ω), and softness (σ) are calculated from the HOMO–LUMO surfaces, giving insightful characteristics of reactivity related to chemical reactions.13 The description of these descriptors is given by equations
| 10 |
| 11 |
| 12 |
| 13 |
| 14 |
| 15 |
The electronic interactions of 4-DMAP and DDQ with formed CT complex descriptors are given in Table S5. From this table, the electronic nature of DDQ and 4-DMAP molecules is concluded. When deriving HOMO–LUMO energies of a molecule, a maximum EHOMO makes it a good electron donor, while a minimum ELUMO makes for a good electron acceptor. Here, DDQ has a lower ELUMO than DMAP, so it is considered as an electron acceptor; on the other hand, 4-DMAP has a greater EHOMO than the DDQ molecule in gas and PCM analysis, so it is considered as an electron donor. Additionally, the chemical potential is a potential index that specifies the path of flow of electrons between molecules. The flow of electrons arises from a structure with maximum chemical potential to a minimum chemical potential. As for this idea of interpretation, 4-DMAP has a greater maximum chemical potential than DDQ. Also, the electrophilicity of DDQ is >4-DMAP, confirming that DDQ is a better electrophile than 4-DMAP and is considered as the e-acceptor and 4-DMAP is the e-donor. The softness values and these results additionally discovered that 4-DMAP is an electron donor, while DDQ is an electron acceptor in gas and PCM analysis.
Computed Electronic Spectra
The calculated electronic spectra of the resulting complex [(4-DMAP)(DDQ)] in ACN and MeOH solvents computed using TD-DFT/wB97XD/6-31+G(d,p) are shown in Figure 11. The TD-DFT calculation provides excitation energies, oscillator strengths, state dipole moments, band assignments, and calculated wavelengths collected in Table 6.
Figure 11.
Measured and calculated electronic spectra of the CT complex in the gas phase, ACN, and methanol.
Table 6. Relevant Excited States, Energy, Oscillator Strengths, State Dipole Moments, and HOMO to LUMO Contributions of the CT Complex.
| excited state | ΔE (eV) | f | μ | λmax | description |
|---|---|---|---|---|---|
| 1 | 2.96 | 0.0025 | 0.0342 | 418 | HOMO → LUMO (95%) |
| 2 | 3.30 | 0.0011 | 0.0131 | 375 | HOMO – 4 → LUMO (86%) |
| HOMO – 6 → LUMO (51%) | |||||
| HOMO – 5 → LUMO (2.8%) | |||||
| 3 | 3.5 | 0.0187 | 0.2183 | 353 | HOMO – 3 → LUMO (6.4%) |
| HOMO – 2 → LUMO (24.7%) | |||||
| HOMO – 1 → LUMO (6.1%) | |||||
| HOMO – 6 → LUMO (33%) | |||||
| 4 | 3.54 | 0.0194 | 0.2235 | 350 | HOMO – 3 → LUMO (16%) |
| HOMO – 1 → LUMO (19%) | |||||
| 5 | 3.84 | 0.2868 | 3.0418 | 322 | HOMO – 5 → LUMO (69%) |
| HOMO – 4 → LUMO (25%) |
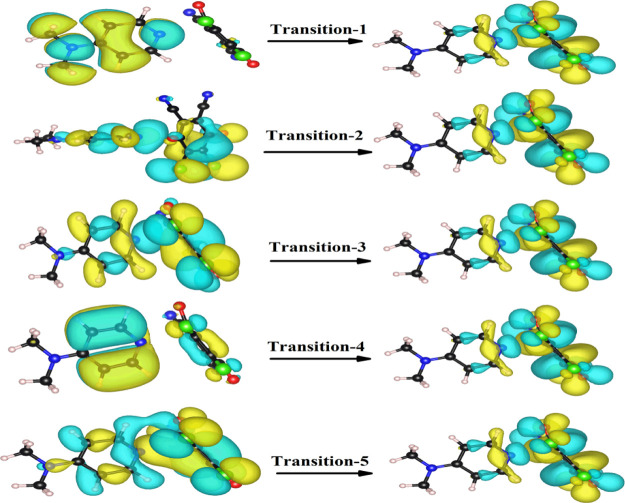
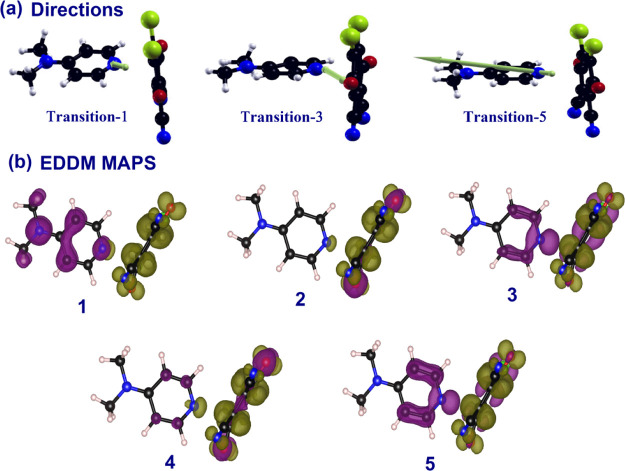
To get further insights into the nature of excited states, natural transition orbital38 (NTO) analysis was performed based on TD-DFT results to offer a compact orbital representation for the electronic transitions shown in Figure 12. In order to obtain the absorption spectra from the optimized ground-state geometry, the dominant NTO is evaluated for the first five excited states in ACN. The first excited-state transition at 418 nm corresponds to 95% contribution from mainly HOMO → LUMO, which strongly consists of the experimental one in ACN and MeOH (appearing at 469 and 476 nm, respectively). The next two excited states correspond to mainly HOMO – 4 → LUMO (86%), HOMO – 6 → LUMO (51%), and HOMO – 2 → LUMO (24.7%). The fifth excited state differs primarily in the phase of the configuration mixing HOMO – 5 → LUMO (69%) and HOMO – 4 → LUMO (25%); this leads to weak transition and higher energy, a more intense one. Furthermore, the relevant excited states with the corresponding dipole moment directions along with electron density difference maps (EDDM) from S1 to S5 geometries are shown in Figure 13.
Figure 12.
NTO pairs for the first five excited states of the [(4-DMAP)(DDQ)] complex. The first excited state is the top of the figure; for each state, the occupied (holes) is on the left and unoccupied (particles) is on the right.
Figure 13.
(a) Corresponding dipole moment directions of the CT complex and (b) EDDMs of first five transitions.
Conclusions
A new CT complex between 4-DMAP as an electron donor and DDQ as an electron acceptor was synthesized and characterized experimentally in both ACN and methanol solvents at room temperature. The appearance of new absorption bands in electronic spectra at 617 and 626 nm in ACN and MeOH suggest the formation of the [(4-DMAP)(DDQ)] complex. The stoichiometry of the CT complex is 1:1 molar ratio, which is confirmed by Job’s and photometric methods. Spectroscopic physical parameters such as KCT, εCT, ECT, ID, RN, W, and ΔG° for the CT complex were evaluated using spectral data. The CT complex stability depends on polarity of the solvents. The solid CT complex was confirmed using FT-IR and NMR spectroscopic techniques. The nature of the CT complex was confirmed by powder XRD analysis, and the particle size was calculated. The surface morphology and elemental analysis were confirmed by producing SEM EDX spectra, and it shows a needle-type structure. The CT complex interacts with CT-DNA via intercalation, and the binding constant shows good binding affinity. The theoretical analysis of the complex was confirmed by the DFT method (wB97XD/6-31G(d,p)), and the bond lengths, bond angles, natural atomic charges, dipole moments, ESP maps, reactivity parameters, EDDM maps, and FMO surfaces were evaluated. PCM/TD-DFT was applied to find the electronic spectra in ACN and methanol.
Experimental Details
Desired Materials and Chemicals
All chemicals used were of analytical grade. The donor 4-DMAP (97%) and acceptor DDQ (99%) were purchased from Sigma-Aldrich, and calf thymus DNA (CT-DNA) was purchased from Sisco Research laboratory; Tris buffer (Molechem) and NaCl (99.50% SDFCL) were commercially accessible. Analytical-grade CH3CN (99.9% Merck) and MeOH (99% Merck) solvent are used for the preparation of the stock solution.
Synthesis of the 1:1 Solid 4-DMAP–DDQ Complex
The solid 4-DMAP–DDQ complex (1:1) was arranged by mixing equimolar amounts of 4-DMAP and DDQ in methanol medium. A reddish-brown color solution was later produced on the addition of these two reactants. The saturated solution of 4-DMAP and DDQ in the same solvent was stirred constantly for about 4–6 h at room temperature. The solution was allowed to evaporate gradually at room temperature. The solid-precipitated adduct was filtered and washed a number of times with small amounts of MeOH and dried under vacuum over anhydrous calcium chloride. The complex was characterized spectroscopically along with elemental analysis: (theoretical values are shown in brackets) yield: 81% [(4-DMAP)/(DDQ)] violet complex: C, 51.52 (51.60%); Cl, 02.19 (20.31%); O, 9.15 (9.16%); and N, 16.01 (16.05%). The molecular structures of the donor and acceptor will be depicted.
Preparation of Standard Stock Solutions of 4-DMAP and DDQ
Standard stock solutions of 4-DMAP (10–2 M) and 2,4-DNP (10–2 M) were arranged by dissolving 0.013 g and 0.023 g, respectively, each in separate volumetric flasks of 10 mL with AN and MeOH solvents. The donor and acceptor concentrations (1 × 10⁻³ and 1 × 10⁻³ M, respectively) were each prepared in a 25 mL volumetric flask by diluting the standard stock solutions. The other solutions were also arranged by the same procedure in the same solvents, and the stock solution was protected from light.
Instrumental Measurements
Electronic Spectra
UV absorption spectra of 4-DMAP, DDQ, and the resulting [(4-DMAP)/(DDQ)] complex in ACN and MeOH measurements were made using a SHIMADZU UV-2600 and UV–visible spectrophotometer within the range of 800–200 nm with 1 cm quartz cell path length. 4-DMAP and DDQ were scanned individually through a spectrophotometric titration39 at 25 °C. The wavelength of the highest absorption of the resulting solution was determined.
FT-IR Spectra
The FT-IR measurement of 4-DMAP, DDQ, and the [(4-DMAP/DDQ)] complex was recorded in the range of 4000–250 cm-1 employing a Bruker Alpha spectrometer.
1H NMR Spectra
The 1H NMR spectrum was evaluated in DMSO via a Bruker 400 MHz NMR instrument with TMS as an internal reference.
Preparation of the DNA Stock Solution
The calf thymus DNA stock solution was made using 5 mM Tris–HCl and 50 mM NaCl at 25 °C in double-distilled water. The solution mixture was stirred overnight to form a clear solution. The pH was adjusted to 7.2 with HCl added to the homogeneous clear buffer solution. The purity of the DNA solution was explored from the UV absorbance proportion of about 1.8–1.9 at 260 and 280 nm. It confirms no impurity protein present in the CT-DNA.40 UV–visible and electronic spectroscopy has been used to calculate the concentration of CT-DNA at an absorbance wavelength of 260 nm by a molar absorptivity of 6600 M–1 cm–1. The prepared solutions were kept at a lower temperature (3–4 °C) and utilized for 3–4 days. The CT complex was dissolved using 50% ACN and 50% Tris–HCl buffer solution throughout the examination. The titration tests were performed at the rigid concentration of the complex with changing concentrations of DNA (0–10 μM).
Computational Details
The Gaussian 09 program41 was used for the DFT calculation of 4-DMAP, DDQ, and the resulting [(4-DMAP)/(DDQ)] complex in the gas phase. The geometries of the complex were optimized using the latest hybrid functional (wB97XD) 6-31+G(d,p) basis set.42 In addition to optimization, TD-DFT calculations were carried out at the same level to explain the origin of electronic spectra, using (integrated equation formalism for the polarizable continuum salvation model) IEF-PCM ACN and methanol as solvents. The Gauss View 5.0.843 program has been used to extract the calculation results and visualize the optimized structures, FMO surfaces, Reactivity parameters, and MEP maps.
SEM–EDX Details
The surface morphology of the [(4-DMAP)/(DDQ)] complex was recognized by SEM (scanning electron microscopy on a Zeiss evo18). The chemical composition of the CT complex was analyzed using an EDX spectrometer attached to an SEM instrument.
Powdered XRD Analysis
Powdered X-ray diffraction study was performed with a Rigaku MiniFlex 600 X-ray diffractometer through Cu Kα radiation (λ = 1.5406 Å) at a step size of 0.02° and a scan step time of 0.15 s in the 2θ range from 10 to 80°..chemou@gmail.com
Acknowledgments
One of the authors, V.M., gratefully acknowledges CSIR, India, for providing JRF/SRF. Financial assistance was provided by the UGC, New Delhi, and the Head, Department of Chemistry, Osmania University, Hyderabad, was acknowledged for providing facilities for the work.
Supporting Information Available
The Supporting Information is available free of charge at https://pubs.acs.org/doi/10.1021/acsomega.1c05464.
Effect of time on the stability of the formed complex, calculated IR spectra, 1H NMR spectra of CTC in DMSO-d6 (400 mHz), FMO pictures of the CT complex, natural atomic charge of the CT complex, additional views of the optimized structures of the CT complex, elemental analysis by EDX spectroscopy, optimized bond length values, optimized bond angle values, natural atomic charge values, reactivity parameters, and Cartesian coordinates of the CT complex (PDF)
Author Contributions
The article was written through contributions of all the authors. All the authors have given approval to the final version of the article.
The authors declare no competing financial interest.
Supplementary Material
References
- Mahipal V.; Venkatesh N.; Naveen B.; Suresh G.; Manaiah V.; Parthasarathy T. Catalytic activity and DNA binding applications of Benzhydrylpiperazine and p-Chloranil charge transfer complex: Synthesis, spectroscopic, and DFT studies. Chem. Data Collect. 2020, 28, 100474. 10.1016/j.cdc.2020.100474. [DOI] [Google Scholar]
- Mulliken R. S. Molecular Compounds and their Spectra. II. J. Am. Chem. Soc. 1952, 74, 811–824. 10.1021/ja01123a067. [DOI] [Google Scholar]
- Mulliken R. S. Molecular Compounds and their Spectra. III. The Interaction of Electron Donors and Acceptors. J. Phys. Chem. 1952, 56, 801–822. 10.1021/j150499a001. [DOI] [Google Scholar]
- Foster R.Charge Transfer Complexes; Academic Press: London, 1969. [Google Scholar]
- Mohammadtaheri M.; Ramanathan R.; Bansal V. Emerging applications of metal-TCNQ based organic semiconductor charge transfer complexes for catalysis. Catal. Today 2016, 278, 319–329. 10.1016/j.cattod.2015.11.017. [DOI] [Google Scholar]
- Andrade S. M.; Costa S. M. B.; Pansu R. STRUCTURAL CHANGES IN W/O TRITON X-100/Cyclohexane-Hexanol/Water Microemulsions Probed by a Fluorescent Drug Piroxicam. J. Colloid Interface Sci. 2000, 226, 260. 10.1006/jcis.2000.6821. [DOI] [Google Scholar]
- Bhattacharya S. Ab initio and TDDFT investigations on charge transfer transition for the o-chloranil/aniline complex in gas phase. Chem. Phys. Lett. 2007, 446, 199–205. 10.1016/j.cplett.2007.08.041. [DOI] [Google Scholar]
- Hoshyargar F.; Shafiei M.; Piloto C.; Motta N.; O’Mullane A. P. Investigation of the room temperature gas sensing properties of metal–organic charge transfer complex CuTCNQF4. J. Mater. Chem. 2016, 4, 11173–11179. 10.1039/c6tc03548e. [DOI] [Google Scholar]
- Peng L.; Chang L.; Liu X.; Lin J.; Liu H.; Han B.; Wang S. Antibacterial Property of a Polyethylene Glycol-Grafted Dental Material. ACS. Appl. Mater. Interfaces 2017, 9, 17688–17692. 10.1021/acsami.7b05284. [DOI] [PubMed] [Google Scholar]
- Murugesan V.; Saravanabhavan M.; Sekar M. Synthesis,spectroscopicharacterization and structural investigation of a new charge transfercomplex of 2,6diaminopyridine with 4-nitrophenylacetic acid: Antimicrobial, DNAbinding cleavageand antioxidant studies. Spectrochim. Acta, Part A 2015, 147, 99–106. 10.1016/j.saa.2015.03.083. [DOI] [PubMed] [Google Scholar]
- Vadivelan G.; Saravanabhavan M.; Murugesan V.; Gohulvani G.; Sekar M.; Babu B. Synthesis, spectroscopic investigations, antioxidants and DNA binding studies of a charge transfer of benzimidazole with 4-methylbenzenesulfonic acid. Mol. Cryst. Liq. Cryst. 2017, 652, 242–254. 10.1080/15421406.2017.1378045. [DOI] [Google Scholar]
- Al-Ahmary K. M.; Soliman S. M.; Habeeb M. M.; Al-Obidan A. H. Spectral analysis and DFT computations of the hydrogen bonded complex between 2,6-diaminopyridine with 2,6-dichloro-4-nitrophenol in different solvents. J. Mol. Struct. 2017, 1143, 31–41. 10.1016/j.molstruc.2017.04.077. [DOI] [Google Scholar]
- Alghanmi R. M.; Soliman S. M.; Basha M. T.; Habeeb M. M. Electronic spectral studies and DFT computational analysis of hydrogen bonded charge transfer complexes between chloranilic acid and 2,5-dihydroxy-p-benzoquinone with 2-amino-4-methylbenzothiazole in methanol. J. Mol. Liq. 2018, 256, 433–444. 10.1016/j.molliq.2018.02.056. [DOI] [Google Scholar]
- Al-Ahmary K. M.; Habeeb M. M.; Aljahdali S. H. Synthesis, spectroscopic studies and DFT/TD-DFT/PCM calculations of molecular structure, spectroscopic characterization and NBO of charge transfer complex between 5-amino-1,3-dimethylpyrazole (5-ADMP) with chloranilic acid (CLA) in different solvents. J. Mol. Liq. 2019, 277, 453–470. 10.1016/j.molliq.2018.12.072. [DOI] [Google Scholar]
- Al-Ahmary K. M.; Alenezi M. S.; Habeeb M. M. Synthesis, spectroscopic and DFT theoretical studies on the hydrogen bonded charge transfer complex of 4-aminoquinoline with chloranilic acid. J. Mol. Liq. 2016, 220, 166–182. 10.1016/j.molliq.2016.04.074. [DOI] [Google Scholar]
- Al-Ahmary K. M. Spectroscopic characterization of charge transfer complexes of 2,3-diaminopyridine with chloranilic acid and dihydroxy-p-benzoquinone in polar solvent. Spectrochim. Acta, Part A 2014, 117, 635–644. 10.1016/j.saa.2013.09.008. [DOI] [PubMed] [Google Scholar]
- Büyükmurat Y.; Akyüz S. Theoretical and experimental IR spectra and assignments of 3 aminopyridine. J. Mol. Struct. 2001, 563–564, 545–550. 10.1016/s0022-2860(00)00801-2. [DOI] [Google Scholar]
- Mostafa A.; Benjamin Cieslinski G.; Bazzi H. S. Preparation, spectroscopic and thermal characterization of charge-transfer molecular complexes formed in the reaction of 4-dimethylaminopyridine with π-electron acceptors. J. Mol. Struct. 2015, 1081, 136–145. 10.1016/j.molstruc.2014.09.074. [DOI] [Google Scholar]
- Mohamdi M.; Bensouilah N.; Trad N.; Abdaoui M. Synthesis, experimental characterization and theoretical calculation of novel charge transfer complex between (S, S)-bis-N,N-sulfonyl bis −l-phenylalanine dimethylester and 2,3-dichloro-5,6-dicyano-1,4-benzoquinone (DDQ). J. Mol. Struct. 2019, 1198, 126890. 10.1016/j.molstruc.2019.126890. [DOI] [Google Scholar]
- Palnati M. K.; Baindla N.; Parthasarathy T. Spectrophotometric, Thermodynamic and Density Functional Studies of Charge Transfer Complex Between Benzhydryl Piperazine and 2,3-Dichloro-5,6-dicyano-1,4-benzoquinone. J. Solution Chem. 2018, 47, 975–992. 10.1007/s10953-018-0767-3. [DOI] [Google Scholar]
- Miyan L.; Khan I. M.; Ahmad A. Synthesis, and spectroscopic studies of charge transfer complex of 1,2-dimethylimidazole as an electron donor with π-acceptor 2,4dinitro-1-naphthol in different polar solvents. Spectrochim. Acta, Part A 2015, 146, 240–248. 10.1016/j.saa.2015.02.060. [DOI] [PubMed] [Google Scholar]
- Al-Attas A. S.; Al-Raimi D. S.; Habeeb M. M. Spectroscopic analysis,thermodynamic study and molecular modeling of charge transfer complexation between 2-amino-5,6-dimethyl-1,2,4-triazine with DDQ in acetonitrile. J. Mol. Liq. 2014, 198, 114–121. 10.1016/j.molliq.2014.06.015. [DOI] [Google Scholar]
- Abbu V.; Venkatesh N.; Naveen B.; Parthasarathy T. Stoichiometric, Thermodynamic and Computational DFT Analysis of Charge Transfer Complex of 1-Benzoylpiperazine with 2, 3-Dichloro-5, 6-Dicyano-1, 4-benzoquinone. J. Solution Chem. 2019, 48, 61–81. 10.1007/s10953-019-00847-5. [DOI] [Google Scholar]
- Lakkadi A.; Baindla N.; Parthasarathy T. Synthesis, Spectroscopic and Computational Studies of Charge-Transfer Complexation Between 4-Aminoaniline and 2,3-Dichloro-5,6-dicyano-1,4-benzoquinone. J. Solution Chem. 2017, 46, 2171–2190. 10.1007/s10953-017-0685-9. [DOI] [Google Scholar]
- Benesi H. A.; Hildebrand J. H. A Spectrophotometric Investigation of the Interaction of Iodine with Aromatic Hydrocarbons. J. Am. Chem. Soc. 1949, 71, 2703–2707. 10.1021/ja01176a030. [DOI] [Google Scholar]
- Ibrahim A. A. Afr. Spectrophotometric studies of charge transfer complex of 8-hydroxyquinoline with 1,4-benzoquinone. J. Pure Appl. Chem. 2011, 5, 507–514. 10.5897/ajpac11.043. [DOI] [Google Scholar]
- Adam A. M. A.; Salman M.; Sharshar T.; Refat M. S. Chemical and Physical Studies on the Reaction Mechanism of Charge-Transfer Complexes Between Narcotic Drugs and Electronic Acceptors. Int. J. Electrochem. Sci. 2013, 8, 1274–1294. [Google Scholar]
- Briegleb G.Electron-Donor Acceptor Complex; Springer-Verlog: Berlin, 1961. [Google Scholar]
- McConnell H.; Ham J. S.; Platt J. R. Regularities in the Spectra of Molecular Complexes. J. Chem. Phys. 1953, 21, 66. 10.1063/1.1698626. [DOI] [Google Scholar]
- Gaber M.; Al-Shihry S. S. Spectrophotometric and electrical studies of charge transfer complexes of 2-amino-1,3,4-thiadiazole with π-acceptors. Spectrochim. Acta, Part A 2005, 62, 526–531. 10.1016/j.saa.2005.02.005. [DOI] [PubMed] [Google Scholar]
- Person W. B. Thermodynamic Properties of Donor-Acceptor Complexes. J. Am. Chem. Soc. 1962, 84, 536–540. 10.1021/ja00863a007. [DOI] [Google Scholar]
- Manojkumar P.; Venkatesh N.; Suresh G.; Mahipal V.; Ramesh M.; Parthasarathy T. Synthesis, spectroscopic, DNA binding and DFT analysis of new charge transfer complexes of 2-Ethyl-6-methylaniline with DDQ and p-Chloranil. Chem. Data Collect. 2020, 29, 100493. 10.1016/j.cdc.2020.100493. [DOI] [Google Scholar]
- Al-Amoudi M. S.; Salman M.; Al-Majthoub M. M.; Adam A. M. A.; Alshanbari N. A.; Refat M. S. Spectral studies to increase the efficiency and stability of laser dyes by charge-transfer reactions for using in solar cells: charge-transfer complexes of Ponceau S with p-chloranil, chloranilic and picric acids. Res. Chem. Intermed. 2015, 41, 3089–3108. 10.1007/s11164-013-1417-4. [DOI] [Google Scholar]
- Adam A. M. A.; Refat M. S.; Saad H. A.; Hegab M. S. Charge transfer complexation of the anticholinergic drug clidinium bromide and picric acid in different polar solvents: Solvent effect on the spectroscopic and structural morphology properties of the product. J. of Mol. Liq. 2016, 216, 192–208. 10.1016/j.molliq.2015.12.112. [DOI] [Google Scholar]
- Venkatesh N.; Naveen B.; Venugopal A.; Suresh G.; Mahipal V.; Manojkumar P.; Parthasarathy T. Donor-acceptor complex of 1-benzoylpiperazine with p-chloranil: Synthesis, spectroscopic, thermodynamic and computational DFT gas phase/PCM analysis. J. Mol. Struct. 2019, 1196, 462–477. 10.1016/j.molstruc.2019.06.083. [DOI] [Google Scholar]
- Naveen B.; Arunapriya L.; Parthasarathy T. Charge transfer interaction of 8-hydroxyquinoline with DDQ: Spectrophotometric, thermodynamic and molecular modeling studies. Indian J. Chem., Sect. A: Inorg., Bio-inorg., Phys., Theor. Anal. Chem. 2016, 55, 1209–1215. [Google Scholar]
- Al-Ahmary K. M.; Habeeb M. M.; Al-Obidan A. H. Charge transfer complex between 2,3-diaminopyridine with chloranilic acid. Synthesis, characterization andDFT, TD-DFT computational studies. Spectrochim. Acta, Part A 2018, 196, 247–255. 10.1016/j.saa.2018.02.025. [DOI] [PubMed] [Google Scholar]
- Richard L. M. Natural transition orbitals. J. Chem. Phys. 2003, 118, 4775. 10.1063/1.1558471. [DOI] [Google Scholar]
- Suresh G.; Venkatesh N.; Naveen B.; Mahipal V.; Madhavi M.; Parthasarathy T. DNA Binding, DFT and Spectroscopic Studies of a Charge Transfer Complex Consisting of a Bioactive Donor 1-(2-Methylbenzyl)piperazine. J. Solution Chem. 2020, 49, 777–797. 10.1007/s10953-020-00989-x. [DOI] [Google Scholar]
- Vadivelan G.; Murugesan V.; Saravanabhavan M.; Gohulvani G.; Sekar M.; Babu B. Mol. Cryst. Liq. Cryst. 2017, 652, 242–254. 10.1080/15421406.2017.1378045. [DOI] [Google Scholar]
- Gaussian 09W; Gaussian Inc.: Wallingford CT, USA, 2009.
- Chai J.-D.; Head-Gordon M. Long-range corrected hybrid density functionals with damped atom–atom dispersion corrections. J. Chem. Phys. 2008, 10, 6615–6620. 10.1039/B810189B. [DOI] [PubMed] [Google Scholar]
- Frisch A.; Nielson A. B.; Holder A. J.. Gaussview User Manual; Gaussian Inc.: Pittsburgh USA, 2000.
Associated Data
This section collects any data citations, data availability statements, or supplementary materials included in this article.


