

Abstract
Community health workers (CHWs) are a vital part of the health infrastructure in Uganda and in many other low- and middle-income countries. While the need for CHWs is clear, it is less clear how they should dispense health products to maximize the health benefits to their community. In this study, we assess the cost-effectiveness of several competing CHW distribution strategies in the context of treatment for child diarrhoea. We used data from a four-armed cluster-randomized controlled trial to assess the cost-effectiveness of (1) free distribution of oral rehydration salts (ORS) via home deliveries prior to diarrhoea onset (free delivery arm), (2) free distribution via vouchers where households retrieved the treatment from a central location (voucher arm), (3) a door-to-door sales model (home sales arm) and (4) a control arm where CHWs carried out their activities as normal. We assessed the cost-effectiveness from the implementor’s perspective and a societal perspective in terms of cost per case treated with ORS and cost per disability-adjusted life year (DALY) averted. Free delivery was the most effective strategy and the cheapest from a societal perspective. Although implementor costs were highest in this arm, cost savings comes from households using fewer resources to seek treatment outside the home (transport, doctor fees and treatment costs). From the implementors’ perspective, free delivery costs $2.19 per additional case treated and $56 per DALY averted relative to the control. Free delivery was also extremely cost-effective relative to home sales and vouchers, but there was a large degree of uncertainty around the comparison with vouchers. Free distribution of ORS by CHWs prior to diarrhoea onset is extremely cost-effective compared to other CHW distribution models. Implementers of CHW programmes should consider free home delivery of ORS.
Keywords: Cost-effectiveness analysis, diarrhoea, child health, international health
Key messages.
Free delivery was the most effective strategy and the cheapest from a societal perspective.
Although implementor costs were highest in this arm, cost savings comes from households using fewer resources to seek treatment outside the home (transport, doctor fees and treatment costs).
From the implementors’ perspective, free delivery costs $2.19 per additional case treated and $56 per DALY averted relative to the control.
Free delivery was also extremely cost-effective relative to home sales and vouchers, but there was a large degree of uncertainty around the comparison with vouchers.
Introduction
Community health workers (CHWs) are a vital part of the health infrastructure in Uganda and, in many other low- and middle-income countries (World Health Organization, 2016), CHWs are generally tasked with providing essential health products and basic health services to their community members. This increases access to products and services that poor households often forgo (Björkman Nyqvist et al., 2019). While the need for CHWs is clear, it is less clear how such programmes should be designed, and there is wide variation in the way in which CHW programmes are structured (Kok et al., 2015; Scott et al., 2018). For example, some CHWs sell health products for a profit, whereas others dispense for free; some CHWs deliver products door-to-door while others dispense from a central location. It is important to understand which of these design features are most cost-effective to make the best use of resources and to maximize the health benefits of CHW services.
In this study, we used data from a four-armed cluster-randomized controlled trial (RCT) to assess the cost-effectiveness of several competing CHW programme design features in the context of treatment for child diarrhoea. Diarrhoea is the second leading cause of child mortality globally, although nearly all these deaths could be prevented with the use of oral rehydration salts (ORS) and zinc (Cash et al., 1970; Pierce et al., 1969; Santosham, 1982; Spandorfer et al., 2005; Munos et al., 2010). However, ORS and zinc are widely underused, leaving children at risk (Forsberg et al., 2007; Pantenburg et al., 2012; Ram et al., 2008; Santosham et al., 2010; Sood and Wagner, 2014; Sreeramareddy et al., 2017). Finding cost-effective ways of increasing ORS and zinc use is a key objective of the global health community, and CHWs are increasingly tasked with increasing access to ORS and zinc (Björkman Nyqvist et al., 2019).
We compare a model of free distribution of ORS and zinc via home deliveries (free delivery arm), free distribution model where households retrieve the treatment from a central location using a voucher (voucher arm) and home sales model (home sales arm). We also compare each intervention to a control arm where CHWs carried out their activities as normal (control arm). Prior studies from this trial document that free delivery increased the share of diarrhoea cases treated with ORS by 19 percentage points (34%) compared to the control arm and 12 percentage points (16%) compared to the home sales arm (Wagner et al., 2019). There was no difference in ORS coverage between the delivery and voucher arms, both of which provided treatment for free. Free distribution also appears to have increased CHW effort compared to selling (Wagner et al., 2020).
Although the free distribution arms were both effective, it is not clear to what extent they were cost-effective. Free distribution is more expensive from the perspective of the implementor because it requires subsidizing the ORS. Moreover, although free delivery and vouchers produced similar ORS coverage, fewer households in the voucher arm retrieved the free treatment compared to the free delivery arm (Wagner et al., 2020), which could make it more cost-effective. In this paper, we estimate the cost-effectiveness of free delivery, vouchers and home sales from an implementor perspective and societal perspective in terms of cost per case treated and cost per disability-adjusted life year (DALY) averted.
Methods
Setting and location
The interventions were carried out by Community Health Promoters (CHPs), a CHW programme implemented by BRAC Uganda. BRAC has CHP programmes across 12 countries and manages over 3000 CHPs in over 74 districts in Uganda. CHPs are community members who are hired by BRAC to sell essential health products to others in the village. CHPs purchase products from BRAC at a subsidized price and sell the products back to community members for a profit (usually at the market price). CHPs sell an array of products, including ORS, zinc, water treatment, bed nets, malaria treatment and other basic household items (e.g. soap). This entrepreneurial model was recently found to have a substantial impact on under 5 years child mortality and has been growing in global popularity over the last decade (The Economist, 2012; Björkman Nyqvist et al., 2019). Our status quo scenario for the cost-effectiveness analysis (CEA) uses the above model.
We worked with BRAC to select six of their branches to enrol in the study. Branches are local offices used to coordinate all of BRAC’s operations in the surrounding villages. We then enrolled all villages affiliated with the selected branches where a CHP was active (about 20 per branch) resulting in 118 villages. All branches were within a 100-km radius of Kampala, Uganda’s capital city, and most villages were considered peri-urban. The interventions took place at the village level, since one CHP is dedicated to serve an entire village. Although some villages were in close proximity to each other, CHP catchment areas did not overlap.
Interventions
The target population for the intervention was households with a child under 5 years old (henceforth under-5). Interventions are described in more detail in prior work (Wagner et al., 2019). We randomly assigned each CHP/village to one of four study arms.
Control—status quo
No intervention took place and CHPs carried out their normal activities. Caretakers had standard access to ORS and zinc from CHPs and at local health facilities and pharmacies.
Free delivery
We instructed CHPs to visit all of the households in their catchment area that contained a child under-5 (roughly 100 households) at the beginning of the study and give caretakers two packets of ORS and 10 tablets of zinc per child under-5 (free of charge) to store in their homes. In addition, we instructed CHPs to provide the standard information on ORS and zinc that CHPs are trained to provide.
Vouchers
We instructed CHPs to visit all of the households in their catchment area that contained a child under-5 at the beginning of the study and provide caretakers with one voucher per child under-5 that they could redeem at the CHPs home for two packets of ORS and 10 tablets of zinc. We also asked CHPs to provide the standard information on ORS and zinc. On average, it takes about 10 minutes to walk to the CHPs home.
Pre-emptive home sales
We instructed CHPs to visit all of the households in their catchment area with a child under-5 at the beginning of the study and offer to sell ORS and zinc to caretakers at the market price ($0.15 USD per ORS packet and $0.30 for a 10 tablet strip of zinc). CHPs were allowed to retain the money from any sales. We also asked CHPs to provide the standard information on ORS and zinc. This model is very similar to the status quo model. The key difference is that we gave CHPs ORS and zinc for free and instructed them to visit all households, whereas, in the status quo arm, the CHPs had to purchase ORS and zinc from BRAC and generally did not make monthly home sales offers to all households.
CHPs were instructed to visit every household in villages assigned to an intervention arm. However, fidelity was imperfect and many households did not receive a visit. Moreover, CHPs in the free distribution arms visited more households than the other two arms (Wagner et al., 2020). These differences in home visit probability are part of the intervention’s causal effect and have implications for both cost (more CHP time spent making household visits) and effectiveness (more exposure to CHPs promoting ORS use).
Sampling and data collection
The household sampling design is described in more detail elsewhere (Wagner et al., 2019). In short, we sampled households to enrol in the study from a list of all households with children under-5 created by each CHW. We conducted a baseline survey prior to the intervention and an endline survey approximately 1 month after the intervention started. At both baseline and endline, the interviewers asked the main caretaker whether a child had a diarrhoea episode in the last 4 weeks and how this case was managed. Only the endline survey asked about key cost parameters for a diarrhoea case (money spent on treatment, clinic costs, transport costs and time spent seeking care) and thus we only use the endline data in this analysis. The team surveyed 7949 caretakers at endline, of which 2122 cared for a child with a case of diarrhoea (27%). This resulted in data on 2363 cases at endline (some households had multiple cases).
Study perspectives
We conducted our CEA from the perspective of BRAC, the implementor, where only BRAC’s programme costs are included, and also from a societal perspective, where we also include costs incurred by the households and the CHP.
Health outcomes and time horizon
We estimated incremental cost-effectiveness ratios (ICERs) both in terms of cost per additional case treated with ORS and cost per disability adjusted life-year (DALY) averted. We used a time horizon of 1 month (the length of time between intervention and endline) and included all households for this analysis (including households with no case of diarrhoea). We only considered treatment costs and benefits of ORS use (excluding costs and benefits of zinc) because the health benefits of zinc alone and zinc added to ORS are less well documented. All households contributed to the programme costs, but only households with a diarrhoea episode contributed to the benefits. This assumes that there is no benefit to receiving ORS if there was no diarrhoea episode in the prior 4 weeks. The appendix provides a detailed description of how we estimate number of cases treated and DALYs averted for each study group and we provide an overview below.
Cases treated
To estimate the number of diarrhoea cases treated with ORS for each scenario, we multiplied the number of cases in each arm by the probability of the case being treated with ORS as estimated by Wagner et al. (2019). This is described in more detail in the appendix.
Deaths
To estimate the number of deaths in each group, we first estimated the probability of death conditional on having a diarrhoea episode. We used 2015 data on number of births and deaths due to diarrhoea from Liu et al. (2015). We assumed that each child has 5 episodes of diarrhoea per year (estimated from study data) and that deaths only occurred among cases not treated with ORS (54% of cases in Uganda). This assumption is conservative because it lowers the death rate compared to if we assume that deaths also occurred among cases treated with ORS. We used number of births, cases per year, and probability of not receiving ORS to estimate the number of total cases in Uganda not treated with ORS. We then divided the number deaths by the number cases that did not receive ORS to get the probability of death from a case of diarrhoea. This gives a diarrhoea case fatality rate of 0.0014.
We then used Munos et al. (2010) for estimates of the effectiveness of ORS on prevention mortality from diarrhoea, which documents a 93% reduction in diarrhoea mortality as a result of ORS use (Munos et al., 2010). This allows us to estimate the number of deaths from cases treated with ORS and the number deaths from cases not treated with ORS, and their sum, which is the total deaths form diarrhoea. We do this separately for each study group.
DALYs averted
To convert deaths to DALYs averted, we used the life expectancy in Uganda (57 years) combined with the average child age in our sample (24 months), to first estimate the life-years saved for each death averted. We then discounted each future life year gained a standard 3% discount rate (Larson, 2013). This gives about 27.15 discounted life years saved for each death averted.
Although diarrhoea can have effects on disability (e.g. frequent diarrhoea could lead to malnutrition and stunting), the magnitude of these effects is not well documented and likely contributes only a small portion of all DALYs lost to each diarrhoea case. As such, we ignored the potential reductions in disability that result from increased ORS use and assumed all of the DALYs averted come from life years saved. Ignoring disability produces a conservative estimate of DALYs averted.
Estimating resources and costs
Programme costs
In the status quo scenario, BRAC incurs a cost of about $0.02 per packet distributed because CHPs purchase ORS from BRAC for about $0.05 and the wholesale price is $0.07. In the three intervention scenarios, BRAC incurs the full cost of ORS (i.e. $0.07 per packet). We multiplied the total number of packets distributed by the cost per packet to get total cost in each study group. We then estimated the average cost per household for each of the four groups. Finally, we multiplied the average cost per household by the population size of the control group (to keep the population size consistent across groups). Row 1 of Table 2 presents monthly programme cost estimates by group assignment. Free delivery was the costliest from BRAC’s perspective at about $280 to distribute two packets of ORS to 1939 households. Vouchers was the next most costly and was only slightly less expensive than free delivery. Home sales and the control group were cheapest at only $84 and $9 dollars, respectively. BRAC’s costs were low in these groups because only 21% and 7% of households received ORS, respectively.
Table 2.
Itemized cost estimates
| Monthly costs for 30 villages (USD) | ||||
|---|---|---|---|---|
| Item | Control | Free delivery | Vouchers | Home sales |
| BRAC costs (ORS) | 9.22 | 280.64 | 216.77 | 84.29 |
| Cost of CHP time | 39.86 | 77.38 | 65.69 | 48.38 |
| Household costs | 2008.66 | 855.48 | 1203.84 | 1804.00 |
| Time | 322.59 | 143.56 | 269.49 | 292.82 |
| Treatment | 1265.91 | 522.12 | 802.44 | 1083.29 |
| Clinic | 685.57 | 301.00 | 402.63 | 680.20 |
| Transport | 85.49 | 59.56 | 59.21 | 75.33 |
| Total costs (for 30 villages) | ||||
| Implementer perspective | 9.22 | 280.64 | 216.77 | 84.29 |
| Societal perspective | 2057.74 | 1213.50 | 1485.69 | 1936.67 |
| Total costs (for single household) | ||||
| Implementer perspective | 0.002 | 0.065 | 0.050 | 0.019 |
| Societal perspective | 0.473 | 0.279 | 0.341 | 0.445 |
Note: 2016 was used as the base year for all currency conversions. On average, there are 145 households per village. Household costs (in bold) are the sum of time, treatment, clinic, and transport costs.
Household costs
The household survey recorded the time spent by caretakers seeking treatment for each case of diarrhoea, the amount spent on clinic fees, the amount spent on treatment, and the amount spent on transport. To estimate the opportunity cost of caretaker time, we used the monthly wage for paid female workers reported in the Uganda Living Standard and Measurement Survey, which is about $44 (USD) (Uganda Bureau of Statistics, 2016). We then divided this number by 20 (number of working days per month) and then by 8 (work hours per day) to get the average hourly wage for women in Uganda (about $0.27). We then multiplied the hourly wage by the time spent seeking treatment for the child’s case of diarrhoea to estimate the cost of time spent seeking treatment for each household. All currency conversions were done in the OANDA conversion tool using a base year of 2016 ($1USD=∼3400 UGX). Table 2 shows that the cost of time spent seeking treatment was substantially lower in the free delivery group than all other groups. This is because caretakers in the free delivery group were less likely to have to leave the home to seek treatment. The cost of time spent seeking treatment was highest in the control group, which is consistent with this group being the least likely to seek treatment from the CHP and the most likely to seek treatment outside the home.
Cost of time for CHP
As described in Wagner et al. (2020), CHPs in the free delivery and voucher arms visited more households than CHPs in the two other arms; about 60% of households received a visit in the free distribution arms compared to only 35% in the home sales arm and 23% in the control arm (Wagner et al., 2020). To estimate opportunity cost of CHP time, we used data from our household surveys to estimate the number of minutes spent at each household and the number of households visited in each arm. We combined the likelihood of receiving a visit, time spent for a visit, and the CHP wage, to estimate the opportunity cost of CHP time to make these visits in each group.
Estimating ICERs
We estimated the ICER of each intervention relative to the control arm and also relative to the next cheapest alternative. This involved dividing the extra costs incurred by the more costly intervention by the extra benefits (see Supplementary Appendix for more details). We compare the ICERs we estimate to the cost-effectiveness thresholds outlined by the World Health Organization; 3 × GDP per capita is considered ‘cost-effective’ and 1 × GDP per capita is considered ‘extremely cost-effective’. GDP per capita in Uganda is $776 (Marseille et al., 2014; World Bank, 2019).
Sensitivity analysis
We conducted one-way sensitivity analysis to identify the parameters to which results were most sensitive and multiway sensitivity analysis to produce a distribution of estimates taking into account the joint uncertainty of the various parameters. For one-way sensitivity analysis, we used the upper and lower bounds of the parameter ranges from Table 1 and re-estimated the ICERs. For estimates from the study data and for ORS effectiveness, we used the upper and lower bounds of 95% confidence intervals. We used a wider range for ORS costs (±20%) to allow for addition distribution cost that might arise at scale-up (e.g. increased contact with the supplier or more transportation costs). For the probability of death, we used the upper and lower bounds of the number of deaths provided by Liu et al. (2015). For hourly wage, we increased and decreased the base wage by 10%.
Table 1.
Parameters
| Input | Base value | Lower | Upper | Source |
|---|---|---|---|---|
| Population size | 1939 | N/A | N/A | Study data |
| Diarrhoea prevalence | 0.31 | 0.29 | 0.33 | Study data |
| Cases per year | 5 | 8 | 2 | Study data |
| Pr(ORS|Diarrhoea) | 0.56 | 0.52 | 0.60 | Study data |
| Pr(Death|Diarrhoea) | 0.0014 | 0.0007 | 0.0026 | Liu et al. (2015) |
| ORS effectiveness (RRR) | 0.93 | 0.69 | 1 | Munos et al. (2010) |
| Eff free delivery (% point) | 0.21 | 0.13 | 0.28 | Wagner et al. (2019) |
| Eff home sales (% point) | 0.08 | 0.0005 | 0.17 | Wagner et al. (2019) |
| Eff vouchers (% point) | 0.18 | 0.10 | 0.26 | Wagner et al. (2019) |
| Hourly wage (UG women) (USD) | 0.28 | 0.25 | 0.30 | LSMS in 2011/2012 |
| ORS costs per HH (USD) | ||||
| Control | <0.01 | <0.01 | 0.01 | Study data |
| Free + delivery | 0.14 | 0.12 | 0.17 | Study data |
| Home sales | 0.04 | 0.03 | 0.05 | Study data |
| Vouchers | 0.11 | 0.09 | 0.13 | Study data |
| Time costs per HH (USD) | ||||
| Control | 0.17 | 0.13 | 0.20 | Study data |
| Free + delivery | 0.07 | 0.06 | 0.09 | Study data |
| Home sales | 0.15 | 0.12 | 0.18 | Study data |
| Vouchers | 0.14 | 0.11 | 0.17 | Study data |
| Treatment costs per HH (USD) | ||||
| Control | 0.65 | 0.54 | 0.76 | Study data |
| Free + delivery | 0.27 | 0.20 | 0.34 | Study data |
| Home sales | 0.56 | 0.45 | 0.67 | Study data |
| Vouchers | 0.41 | 0.31 | 0.51 | Study data |
| Clinic costs per HH (USD) | ||||
| Control | 0.35 | 0.28 | 0.43 | Study data |
| Free + delivery | 0.16 | 0.10 | 0.21 | Study data |
| Home sales | 0.35 | 0.26 | 0.44 | Study data |
| Vouchers | 0.21 | 0.15 | 0.26 | Study data |
| Transport costs per HH (USD) | ||||
| Control | 0.04 | 0.03 | 0.05 | Study data |
| Free + delivery | 0.03 | 0.02 | 0.04 | Study data |
| Home sales | 0.04 | 0.03 | 0.05 | Study data |
| Vouchers | 0.03 | 0.02 | 0.04 | Study data |
| Time spent at HH (minutes) | ||||
| Control | 19.37 | 14.25 | 24.50 | Study data |
| Free + delivery | 14.59 | 13.31 | 15.86 | Study data |
| Home sales | 15.66 | 13.91 | 17.41 | Study data |
| Vouchers | 13.66 | 12.34 | 14.98 | Study data |
| Proportion of HH visited | ||||
| Control | 0.24 | 0.20 | 0.27 | Study data |
| Free + delivery | 0.61 | 0.57 | 0.65 | Study data |
| Home sales | 0.35 | 0.31 | 0.39 | Study data |
| Vouchers | 0.55 | 0.51 | 0.59 | Study data |
Note: 2016 was used as the base year for all currency conversions. Time costs were all based on opportunity cost of time using estimates from the Uganda Living Standard and Measurement Survey [$44 (USD) per month]. Opportunity cost of CHP time used the same monthly wage and was a function of the time spent at each household and the proportion of households visited. HH, Household; UG, Uganda; RRR, Relative Risk Reduction; LSMS, Living Standard and Measurement Survey.
For our multiway sensitivity analysis, we sampled each parameter from a normal distribution centred around the base value or a uniform distribution bounded by the upper and lower values. We sampled all parameters simultaneously from their respective distribution and re-estimated our ICERs. We repeated this process 1000 times.
Results
Incremental costs and outcomes
Table 2 shows that free delivery was the lowest cost intervention from a societal perspective. Free delivery costs $1213 (USD) to society when implemented for 1 month across 30 villages. This is compared to $1486 in the voucher arm, $1937 in the home sales arm, and $2058 in the control arm. Free delivery had lower societal costs because households used far fewer resources seeking care outside the home and purchasing treatment. Free delivery was also the most effective (Table 1), which means it dominates all other interventions from a societal perspective.
Vouchers were the next cheapest from a societal perspective and the next most effective. Thus, it dominates the other two scenarios. The control arm was the most expensive and least effective from a societal perspective.
From BRAC’s perspective, free delivery was the costliest ($280.64 per month), followed by vouchers ($216.77 per month) and home sales ($84.29 per month). The status quo scenario for ORS dispensing costs BRAC $9.22 per month. Column 1 of Table 4 shows incremental cost relative to the control and to the next cheapest alternative. Free delivery costs an extra $271 per month, vouchers cost an extra $208 per month and home sales cost an extra $75 per month.
Table 4.
Cost per additional case treated
| Incremental cost | Incremental cases treated | Cost per additional case treated (ICER) |
||||
|---|---|---|---|---|---|---|
| Relative to control | Relative to next cheapest alternative | Relative to control | Relative to next cheapest alternative | Relative to control | Relative to next cheapest alternative | |
| Control | ‐‐‐‐‐‐‐‐‐‐‐‐‐‐‐‐‐‐‐‐‐‐‐‐‐‐‐‐‐‐‐‐‐‐‐‐‐‐‐‐‐‐‐‐‐‐‐‐‐‐‐‐‐‐‐‐‐‐‐‐‐‐‐‐‐‐‐‐‐‐‐‐‐‐‐‐‐‐‐Reference‐‐‐‐‐‐‐‐‐‐‐‐‐‐‐‐‐‐‐‐‐‐‐‐‐‐‐‐‐‐‐‐‐‐‐‐‐‐‐‐‐‐‐‐‐‐‐‐‐‐‐‐‐‐‐‐‐‐‐‐‐‐‐‐‐‐‐‐‐‐‐‐‐‐‐‐‐ | |||||
| Home sales | $75.07 | $75.07 | 50 | 50 | $1.51 | $1.51 |
| Voucher | $207.55 | $132.48 | 106 | 56 | $1.96 | $2.37 |
| Free delivery | $271.42 | $63.87 | 124 | 18 | $2.19 | $3.56 |
Note: 2016 was used as the base year for all currency conversions.
Table 3 presents cases treated, deaths and DALYs lost in each arm. In the status quo scenario (control), 336 of 601 cases were treated with ORS. We estimate there to be 0.44 deaths of children under-5 per month, which results in 11.96 DALYs lost. The increase in ORS use in the free delivery arm reduced the number of deaths from 0.44 to 0.26. Vouchers reduced deaths to 0.29 and home sales reduced deaths to 0.37. The decline in lost DALYs was proportional: 11.96 in control compared to 7.14 in free delivery, 7.84 in vouchers and 10.02 in home sales.
Table 3.
Cases treated, deaths and DALYs lost
| Control | Free delivery | Vouchers | Home sales | |
|---|---|---|---|---|
| Cases treated | 336 | 460 | 442 | 386 |
| Deaths from diarrhoea | 0.44 | 0.26 | 0.29 | 0.37 |
| DALYs lost from diarrhoea | 11.96 | 7.14 | 7.84 | 10.02 |
Note: Each death leads to 27.15 lost DALYs, assuming 3% discounting of future years. 2016 was used as the base year for all currency conversions.
The home sales intervention resulted in 50 additional cases treated with ORS at $1.51/case (Table 4). An additional 56 cases treated were achieved with the voucher intervention at a cost of $2.37/case relative to home sales and 1.96/case relative to the control. Free delivery achieved another 18 cases treated at $3.56/case relative to vouchers and $2.19 relative to the control.
Table 5 shows costs per DALY averted and Figure 1 plots the costs and DALYs averted for each scenario. The home sales intervention reduced deaths by 0.07, which converts to 1.94 DALYs averted and costs $39 per DALY averted. An additional 0.08 deaths could be averted under the voucher intervention, leading to 2.18 DALYs averted at a cost of $61 per DALY averted relative to home sales and $50 per DALY averted relative to control. Finally, going from the voucher intervention to the free delivery intervention averts an additional 0.03 deaths and 0.70 DALYs at a cost of $91 per DALY averted compared to vouchers and $56 per DALY averted compared to control. When compared to the home sales group, free delivery averts 2.88 DALYs at a cost of $68 per DALY averted (not shown in table).
Table 5.
Cost per DALY averted
| Incremental DALYs averted | Cost per DALY averted (ICER) |
|||
|---|---|---|---|---|
| Relative to control | Relative to next cheapest alternative | Relative to control | Relative to next cheapest alternative | |
| Control | ‐‐‐‐‐‐‐‐‐‐‐‐‐‐‐‐‐‐‐‐‐‐‐‐‐‐‐‐‐‐‐‐‐‐‐‐‐‐‐‐‐‐‐‐‐‐‐‐‐‐‐‐‐‐‐‐‐‐‐‐‐‐‐‐‐‐‐‐Reference‐‐‐‐‐‐‐‐‐‐‐‐‐‐‐‐‐‐‐‐‐‐‐‐‐‐‐‐‐‐‐‐‐‐‐‐‐‐‐‐‐‐‐‐‐‐‐‐‐‐‐‐‐‐‐‐‐‐‐‐‐‐‐‐‐‐‐‐‐‐ | |||
| Home sales | 1.94 | 1.94 | $39 | $39 |
| Voucher | 4.12 | 2.18 | $50 | $61 |
| Free delivery | 4.82 | 0.70 | $56 | $91 |
Note: Each death averted saves 27.15 DALYs with 3% discounting of future years. Incremental costs are the same as in Table 4. 2016 was used as the base year for all currency conversions.
Figure 1.
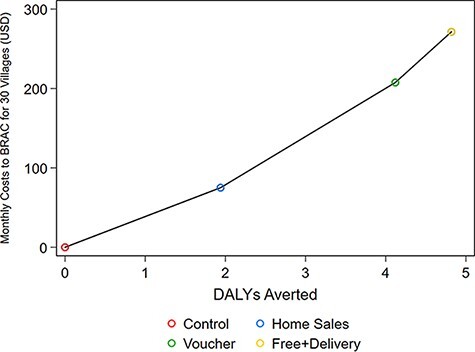
All costs are compared to a baseline monthly cost of $9.22 for the control group
Sensitivity analysis
One-way sensitivity analysis shows that free delivery was still cost saving from a societal perspective relative to all other scenarios even when using upper- or lower-bound cost estimates from Table 1 (results available upon request). The societal cost of free delivery would have to be under-estimated by 22%, 60% and 70% in order for it not to be cost saving compared to vouchers, home sales and the control arm, respectively.
The probability of death conditional on a diarrhoea case was the most influential parameter from BRAC’s perspective when comparing free delivery to the status quo (Supplementary Appendix Figure A1). It is also worth noting that even at the most extreme value of this parameter, free delivery was the most cost effective. One concern is that additional cases treated under free delivery will experience less benefit to using ORS if the decision to use ORS is a function of illness severity. However, we find that free delivery is still highly cost-effective compared to the control and home sales arms even at the lower bound of ORS effectiveness. We conducted a threshold analysis to identify how extreme key parameters would need to be for free delivery to be above the extremely cost-effective threshold and we find that both prevalence and effectiveness would have to about 90% lower than the base value for free delivery to not be within the extremely cost-effective threshold. When comparing free delivery to vouchers, the cost of implementing the interventions (ORS costs) was most influential. When comparing free delivery and home sales, the estimated effect sizes were most influential.
Multiway sensitivity analysis (Supplementary Appendix Figure A2) shows that the ICER for free delivery compared to control was well below the ‘extremely cost-effective’ threshold ($776) for all 1000 simulations (maximum ICER of around $200 per DALY averted). When comparing free delivery to home sales, the ICER was within the extremely cost-effectiveness threshold on 98% of the simulations. When comparing free delivery to vouchers, the ICER was within the extremely cost-effectiveness threshold on only 69% of the simulations, and vouchers was more cost-effective than free delivery on 31% of simulations.
Discussion
There is a growing body of evidence suggesting that free distribution can dramatically increase the use of life-saving health products (Dupas and Miguel, 2017; Kremer and Glennerster, 2011) and improve health (Dupas et al., 2020). However, it is not immediately clear that free distribution is cost-effective. For example, if free distribution produces a large quantity of wastage with only modest coverage improvements, then a model with user fees might be preferred. This study shows that free distribution can be a very efficient use of resources relative to other distribution strategies and that free delivery to the home is particularly efficient. The free delivery intervention costs the implementer only $56 per DALY averted relative to the status quo, which is comparable to the most cost-effective maternal and child health interventions available; for example, the management of severe malnutrition and micronutrient interventions costs around 60$ per DALY averted; households water treatment costs just over $100 per DALY averted (Black et al., 2016). Moreover, the ease of access associated with free delivery reduced the time and money households spent seeking care, which made it cost saving from a societal perspective.
This work demonstrates that free delivery is more cost-effective for ORS dispensing than home sales. Home sales is a key component of entrepreneurial CHW models, which experienced growing support over the last decade (The Economist, 2012). The support for this type of model is partly based on a recent RCT that demonstrated a 27% reduction in child mortality after the introduction of the entrepreneurial model (Björkman Nyqvist et al., 2019). BRAC alone implements their entrepreneurial model in 12 countries, and several other organizations have expanded a version of this model all over the world. Therefore, these findings have international relevance and provide important evidence for donors deciding on whether to prop up the public sector model, which generally uses free distribution, or to invest in this type of entrepreneurial model.
Vouchers were slightly less expensive for implementors and achieved nearly the same benefit as free delivery. The additional time spent redeeming the vouchers increased the costs from a societal perspective. Moreover, households in the voucher arm were more likely to seek treatment from someone other than the CHW, resulting in more money spent on clinic fees and treatment. However, the effectiveness of vouchers was not statistically different from free delivery, and multiway sensitivity analysis demonstrates a large degree of uncertainty in this comparison. It is possible that the voucher programme is more efficient in the long run; as the novelty of the vouchers wears off, people unlikely to use ORS could stop redeeming vouchers, which has been evident in other voucher programmes (Dupas et al., 2020).
Although the price of ORS appears to be a barrier to use for the caretaker, as demonstrated by Wagner et al. (2019), these products are very cheap from a donor perspective (Wagner et al., 2019). It costs only about $10 per village per month to implement the free delivery programme. This cost is likely well within most budgets for CHW programmes.
This study suggests that free distribution of health products by CHWs could be an optimal strategy, but it is not yet clear how well our results translate to other health products. ORS is extremely cheap, extremely effective and most people use it if available and needed (Wagner et al., 2020). The cost of distributing more expensive products for free would be higher and most other health products do not improve child health to the same degree as ORS. However, there is a growing body of literature suggesting that free distribution of other health products (e.g. point-of-use water treatment, bed nets, and deworming medication) is also preferred to charging (Dupas and Miguel, 2017; Kremer and Glennerster, 2011).
Blanket-free delivery of ORS would be less cost-effective in a setting where diarrhoea prevalence is lower than our setting because the free treatment will go to more households that do not need it. Vouchers do a better job of targeting free health products to households that are likely to use them compared to free home delivery and, in prior work, we demonstrate that vouchers screened out households that did not have a case of diarrhoea (Dupas et al., 2020; Wagner et al., 2020). Therefore, vouchers might be more efficient when diarrhoea prevalence is low.
We did not include the benefits of increasing zinc use in this analysis because the health gains from zinc are less well documented. However, the Third Edition of Disease Control Priorities ranks zinc added to ORS as the second most cost-effective intervention for maternal and child health (Horton, 2017). Moreover, free delivery increased ORS + zinc use by even more than ORS use alone (Wagner et al., 2019). Therefore, including the benefits of zinc could improve the cost-effectiveness of free delivery if the health benefits of zinc are large enough.
Our cost-effectiveness analysis is limited in several ways. First, ORS is likely to produce less health benefits for less severe cases of diarrhoea, which has implications for our cost-effectiveness results. If the additional cases treated under free delivery were indeed less severe, health gains could be over-stated. We find in prior work that the additional cases treated with ORS in the free delivery arm were slightly less severe compared to the control group (58% in the control arm compared to 52% in the free delivery arm), although this difference were not statistically significant (Wagner-Rubin, 2017). The implies that a large portion of the cases treated in the free delivery arm had severe infection and that effectiveness of ORS for the additional cases treated was comparable to the effectiveness in the control arm. Moreover, our sensitivity analysis shows that even at the lower bound of ORS effectiveness, free delivery is still highly cost-effective (Supplementary Appendix Figure A1).
Second, it is possible that additional programme costs will arise at scale-up. Other CHW programmes might have higher costs if this requires setting up new ORS supply chains and distribution points. However, the costs of free delivery would have to increase 10-fold in order for the cost per DALY averted to approach the ‘extremely cost-effective’ threshold of less than the country’s GDP per capita ($776/DALY averted in Uganda) (Marseille et al., 2014; World Bank, 2019).
CHWs can play a vital role in increasing access to life-saving health products in poor and rural communities. This study shows that giving treatment for child diarrhoea away for free instead of selling is an extremely cost-effective approach. Implementers of CHW programmes should consider free home delivery of ORS.
Supplementary Material
Contributor Information
Zachary Wagner, Department of Economics, Sociology and Statistics, RAND Corporation, 1776 Main Street, Santa Monica, CA 90405, USA; Pardee RAND Graduate School, 1776 Main Street, Santa Monica, CA 90405, USA.
Rushil Zutshi, Pardee RAND Graduate School, 1776 Main Street, Santa Monica, CA 90405, USA.
John Bosco Asiimwe, School of Statistics and Planning, Makerere University, University Road, P.O. Box 7062, Kampala, Uganda.
David Levine, Hass School Business, University of California, 2220, Piedmont Avenue, Berkeley, CA 94720, USA.
Supplementary data
Supplementary data are available at Health Policy and Planning online.
Data availability
The data underlying this article cannot be shared publicly for the privacy of individuals that participated in the study. The data will be shared on reasonable request to the corresponding author.
Funding
This work was funded by the Weiss Family Program Fund, East African Social Science Translation (EASST) Collaborative, and NIDDK (grant number R01DK126049-01A1).
Ethical approval.
Approval obtained from the UC Berkeley Committee for Protection of Human Subjects, Mildmay Uganda Research Ethics Committee and Uganda National Council for Science and Technology.
Conflict of interest statement.
None declared.
References
- Björkman Nyqvist M, Guariso A, Svensson J, Yanagizawa-Drott D. 2019. Reducing child mortality in the last mile: experimental evidence on community health promoters in Uganda. American Economic Journal: Applied Economics 11: 155–92. [Google Scholar]
- Black RE, Levin C, Walker N et al. 2016. Reproductive, maternal, newborn, and child health: key messages from Disease Control Priorities 3rd Edition. The Lancet 388: 2811–24. [DOI] [PubMed] [Google Scholar]
- Cash RA, Nalin DR, Rochat R et al. 1970. A clinical trial of oral therapy in a rural Cholera-Treatment Center. American Journal of Tropical Medicine and Hygiene 19: 653–6. [DOI] [PubMed] [Google Scholar]
- Dupas P, Miguel E. 2017. Impacts and determinants of health levels in low-income countries. In: Handbook of Economic Field Experiments. Elsevier. 10.3386/w27570. [Google Scholar]
- Dupas P, Nhlema B, Wagner Z, Wolf A, Wroe E 2020. Expanding access to clean water for the rural poor: experimental evidence from Malawi. NBER Working Paper Series #27570. In: #27570, N. W. P. S. (ed.).
- The Economist . 2012. Selling Sisters. https://www.economist.com/blogs/schumpeter/2012/11/retail, accessed 27 February 2018.
- Forsberg BC, Petzold MG, Tomson G, Allebeck P. 2007. Diarrhoea case management in low- and middle-income countries: an unfinished agenda. Bulletin of the World Health Organization 85: 42–8. [DOI] [PMC free article] [PubMed] [Google Scholar]
- Horton S. 2017. Cost-effectiveness analysis in disease control priorities. In: Jamison DT, Gelband H, Horton S, Jha P, Laxminarayan R, Mock CN, Nugent R (eds). Disease Control Priorities: Improving Health and Reducing Poverty. 3rd edn. Washington (DC): The International Bank for Reconstruction and Development/The World Bank, 147–56. [PubMed] [Google Scholar]
- Kok MC, Dieleman M, Taegtmeyer M et al. 2015. Which intervention design factors influence performance of community health workers in low-and middle-income countries? A systematic review. Health Policy and Planning 30: 1207–27. [DOI] [PMC free article] [PubMed] [Google Scholar]
- Kremer M, Glennerster R. 2011. Improving health in developing countries. Handbook of Health Economics 2: 201–315. [Google Scholar]
- Larson BA. 2013. Calculating disability-adjusted-life-years lost (DALYs) in discrete-time. Cost Effectiveness and Resource Allocation 11: 1–6. [DOI] [PMC free article] [PubMed] [Google Scholar]
- Liu L, Oza S, Hogan D et al. 2015. Global, regional, and national causes of child mortality in 2000–13, with projections to inform post-2015 priorities: an updated systematic analysis. The Lancet 385: 430–40. [DOI] [PubMed] [Google Scholar]
- Marseille E, Larson B, Kazi DS, Kahn JG, Rosen S. 2014. Thresholds for the cost–effectiveness of interventions: alternative approaches. Bulletin of the World Health Organization 93: 118–24. [DOI] [PMC free article] [PubMed] [Google Scholar]
- Munos MK, Walker CLF, Black RE. 2010. The effect of oral rehydration solution and recommended home fluids on diarrhoea mortality. International Journal of Epidemiology 39: i75–i87. [DOI] [PMC free article] [PubMed] [Google Scholar]
- Pantenburg B, Ochoa TJ, Ecker L, Ruiz J. 2012. Use of commercially available oral rehydration solutions in Lima, Peru. American Journal of Tropical Medicine and Hygiene 86: 922–4. [DOI] [PMC free article] [PubMed] [Google Scholar]
- Pierce NF, Sack RB, Mitra RC et al. 1969. Replacement of water and electrolyte losses in cholera by an oral glucose-electrolyte solution. Annals of Internal Medicine 70: 1173–81. [DOI] [PubMed] [Google Scholar]
- Ram PK, Choi M, Blum LS et al. 2008. Declines in case management of diarrhoea among children less than five years old. Bulletin of the World Health Organization 86: E–F. [DOI] [PMC free article] [PubMed] [Google Scholar]
- Santosham M. 1982. Oral rehydration therapy of infantile diarrhea a controlled study of well-nourished children hospitalized in the United States and Panama. New England Journal of Medicine 306: 1070–6. [DOI] [PubMed] [Google Scholar]
- Santosham M, Chandran A, Fitzwater S et al. 2010. Progress and barriers for the control of diarrhoeal disease. The Lancet 376: 63–7. [DOI] [PubMed] [Google Scholar]
- Scott K, Beckham S, Gross M et al. 2018. What do we know about community-based health worker programs? A systematic review of existing reviews on community health workers. Human Resources for Health 16: 1–17. [DOI] [PMC free article] [PubMed] [Google Scholar]
- Sood N, Wagner Z. 2014. Private sector provision of oral rehydration therapy for child diarrhea in Sub-Saharan Africa. American Journal of Tropical Medicine and Hygiene 90: 939–44. [DOI] [PMC free article] [PubMed] [Google Scholar]
- Spandorfer PR, Alessandrini EA, Joffe MD, Localio R, Shaw KN. 2005. Oral versus intravenous rehydration of moderately dehydrated children: a randomized, controlled trial. Pediatrics 115: 295–301. [DOI] [PubMed] [Google Scholar]
- Sreeramareddy CT, Low Y-P, Forsberg BC. 2017. Slow progress in diarrhea case management in low and middle income countries: evidence from cross-sectional national surveys, 1985–2012. BMC Pediatrics 17: 83. [DOI] [PMC free article] [PubMed] [Google Scholar]
- Uganda Bureau of Statistics . 2016. Uganda living standard and measurement survey. Technical report. World Bank. [Google Scholar]
- Wagner Z, Asiimwe JB, Dow WH, Levine DI. 2019. The role of price and convenience in use of oral rehydration salts to treat child diarrhea: a cluster randomized trial in Uganda. PLoS Medicine 16: e1002734. [DOI] [PMC free article] [PubMed] [Google Scholar]
- Wagner Z, Asiimwe JB, Levine DI. 2020. When financial incentives backfire: evidence from a community health worker experiment in Uganda. Journal of Development Economics 144: 102437. [Google Scholar]
- Wagner-Rubin Z. 2017. Working with Community Health Workers to Increase Use of ORS and Zinc to Treat Child Diarrhea in Uganda: A Cluster Randomized Controlled Trial. Berkeley, CA, USA: UC Berkeley. [Google Scholar]
- World Bank . 2019. GDP per capita (current US$) - Uganda. https://data.worldbank.org/indicator/NY.GDP.PCAP.CD?locations=UG, accessed 13 November 2020.
- World Health Organization . 2016. Global strategy on human resources for health: workforce 2030. https://apps.who.int/iris/bitstream/handle/10665/250368/?sequence=1, accessed 20 December 2020.
Associated Data
This section collects any data citations, data availability statements, or supplementary materials included in this article.
Supplementary Materials
Data Availability Statement
The data underlying this article cannot be shared publicly for the privacy of individuals that participated in the study. The data will be shared on reasonable request to the corresponding author.